Abstract
During perforation operations, high-speed jet penetration into the casing-cement sheath-formation assembly damages the bonding interfaces, resulting in fluid flow along these interfaces within the wellbore. This can compromise the wellbore seal integrity and shorten the lifespan of the oil and gas well. To address this, a numerical model was developed using fluid-solid coupling algorithms, combined with a cohesive zone damage model and the ALE algorithm. The model was employed to analyze the dynamic damage evolution of the bonding interfaces during the jet penetration process and quantify the effects of the cement sheath’s mechanical parameters (shear modulus and compressive strength) and geological stress on the axial damage length and area. The results indicate that both the casing-cement sheath and cement sheath-formation interfaces exhibit significant damage, with the former showing a larger damage area under identical mechanical conditions; as the cement sheath’s shear modulus increases, the damaged area at the casing-cement sheath interface expands, while that at the cement sheath-formation interface reduces. Conversely, an increase in the cement sheath’s compressive strength reduces the damage extent at both interfaces, as does elevated geological stress. Based on engineering cases, different cement slurry types were compared to minimize perforation-induced interface damage. This study provides theoretical and practical guidance for optimizing cement selection and assessing bonding interface integrity during perforation.
1. Introduction
As the primary barrier to maintaining wellbore seal integrity, the cement sheath serves a vital function in sealing off formation fluids, supporting casing loads, and preserving structural stability [1,2,3]. During the completion process, perforation operations are required to establish channels for reservoir fluids to enter the wellbore. The explosion of the perforating gun during the perforation operation produces high-speed metal jets that penetrate the wellbore assembly and perforate the casing and cement sheath, resulting in perforation tunnels in the formation. The perforation process induces fracturing in the cement sheath surrounding the perforation channels, concurrently compromising both the casing-cement sheath interface (Interface I) and cement sheath-formation interface (Interface II) [4]. Once the bonding interface of the wellbore assembly is damaged and forms a weak interface, during subsequent reservoir stimulation or injection/production processes, fluids within the wellbore may migrate along the weak interface, causing the bonding interface to crack and allowing fluids to migrate along the wellbore bonding interface [5]. In severe cases, fluids may even migrate along the bonding interface over long distances. For example, the high-pressure injection during hydraulic fracturing can lead to fluid migration through the bonding interface between fracturing segments, weakening the effectiveness of enhanced production measures [6]. However, at present, most studies on perforation penetration of wellbores primarily focus on the damage caused by perforation penetration to the cement sheath body, with limited analysis conducted on the damage to the bonding interface of the wellbore after perforation. Consequently, quantitative evaluation of perforation-induced interfacial damage in wellbore systems becomes essential, particularly for analyzing parametric influences on both casing-cement sheath (Interface I) and cement sheath-formation (Interface II) integrity. These findings carry significant implications for optimizing reservoir stimulations and ensuring long-term well integrity.
Regarding the damage caused by high-speed jets during perforation to the casing-cement sheath-formation assembly, domestic and international scholars have employed various investigative approaches such as laboratory tests, numerical simulations, and theoretical analyses, primarily focusing on the damage caused by perforation to the cement sheath body. Yew et al. [7] and Yan et al. [8] conducted real-size perforation experiments combined with computerized tomography (CT) to observe the damage characteristics of the cement sheath after perforation, pointing out that perforation operations can damage the cement sheath around the perforation tunnels. The surface pressure formed by the high-speed jet around the tunnels can cause cracks and other damage to the cement sheath near the tunnels. Liu et al. [9] established a 3D numerical model incorporating perforating charges, casing-cement sheath, and formation to investigate the influence of cement sheath physical parameters on cement sheath damage. Their results demonstrated that cement sheath damage could be mitigated by increasing its compressive/tensile strength or decreasing shear modulus and density. Zhang et al. [10] developed a 3D numerical model to simulate perforating charge penetration through wellbore assembly, elucidating cement sheath failure mechanisms during perforation. Their results revealed concentrated damage zones along the cement sheath’s interior surface and perforation tunnel vicinities. Li et al. [11] used finite element numerical simulation methods to establish a jet morphology simulation model, systematically evaluating cement sheath damage under varying material properties. Their findings demonstrate that decreasing the cement’s shear modulus effectively minimizes the damage zone surrounding perforation channels. It is evident from the studies that perforation operations result in severe damage to the cement sheath during penetration. Previous studies have often focused on the destruction of the cement sheath during penetration, neglecting the analysis of damage to the wellbore bonding interface during perforation, making it difficult to comprehensively and objectively evaluate the impact of perforation on the damage to the wellbore assembly.
In actual engineering practice, the high-speed jets generated during perforation operations not only directly damage the cement sheath during penetration but also cause damage to the bonding interfaces of the wellbore assembly, including the casing-cement sheath interface (Interface I) and the cement sheath-formation interface (Interface II) [12,13,14,15,16]. The damage caused by these two bonding interfaces often leads to fluid channeling between different fracturing segments during hydraulic fracturing, thereby reducing production enhancement sheath effects, or allows corrosive gases such as hydrogen sulfide to enter through the damaged bonding interfaces, shortening the lifespan of oil and gas wells [17,18,19,20,21,22,23]. Currently, existing studies mainly analyze the damage to the cement sheath interface (including Interface I and II) caused by perforation operations through physical experiments and numerical simulations. For example, Li et al. [16] and Fan et al. [15] conducted experimental studies on perforation-induced wellbore integrity, demonstrating that perforation operations can cause damage to both the casing-cement sheath interface and the cement sheath-formation interface. Yan et al. [4] analyzed the damage patterns of the bonding interfaces based on a 3D numerical model of a perforated wellbore, considering confining pressure, cement sheath shear modulus, and shaped charge, and concluded that damage to bonding interfaces can be reduced through the use of a cement sheath with reduced shear modulus. Yan et al. [23] simulated the process of perforating guns penetrating the wellbore using a numerical model to study the damage characteristics of the casing-cement sheath interface and the cement sheath-formation interface, pointing out that the casing-cement sheath interface is more prone to stress concentration. Its debonding area is significantly larger than that of the cement sheath-formation interface. Based on these research findings, although existing studies have verified the damage to Interfaces I and II after perforation through laboratory tests or numerical simulations, they have not conducted a detailed analysis of the dynamic process of damage to reveal the mechanism leading to damage to the bonding interface. Furthermore, they have not conducted a thorough analysis of the changes in damage to the bonding interface under different engineering parameters.
The preceding analysis reveals that while experimental and numerical studies have validated the potential for perforation-induced damage to both the cement sheath and wellbore bonding interface, research on failure mechanisms at Interfaces I and II remains notably limited. There are two main challenges: (1) Given that current numerical analysis results primarily focus on the damage caused by perforation to the cement sheath body, there is a lack of quantitative analysis regarding the extent of damage to the bonding interface under perforation operations. A damage model must be developed for the wellbore assembly’s bonding interface during perforation penetration to investigate the dynamic failure progression at Interfaces I and II. This model should enable quantitative assessment of interfacial damage along both axial and circumferential orientations. (2) At present, the influence patterns of relevant engineering and geological factors on the damage to the bonding interface are unclear and have not been quantified. Consequently, establishing an analytical model to study the influence patterns of geological and engineering conditions on the damage to interfaces I and II becomes imperative, which can be used as a basis for selecting the optimal cement sheath slurry and optimizing engineering parameters. Consequently, investigating the evolution patterns of damage to the bonding interface of the wellbore assembly under perforation penetration conditions holds substantial scientific and practical importance.
In response to this, considering the actual operating conditions of the perforation penetration casing-cement sheath-formation wellbore assembly, a fluid-solid coupling algorithm combined with the Cohesive Zone Model (CZM) was employed for three-dimensional modeling to analyze the dynamic evolution of damage at bonding interfaces during the jet penetration process. The study investigates the influence of different cement sheath mechanical parameters (shear modulus, compressive strength) and different ground stress conditions on the axial damage length of the bonding interface. The study findings establish a theoretical framework for quantifying perforation-induced interfacial damage in wellbore systems and optimizing cement slurry formulation selection.
2. Numerical Simulation of Perforation Penetration into Wellbore
As an essential well completion process, perforation establishes reservoir-wellbore connectivity by penetrating through casing, cement sheath, and formation. These created channels serve as conduits for oil and gas flow from the reservoir to surface production pipelines [24]. During perforation operations, a perforating gun equipped with perforating charges is connected to the corresponding downhole tools via a tubing string and lowered into the wellbore. When the assembly reaches the target formation, the detonating fuse detonates, causing the perforating charges to explode and generate high temperatures and pressures. The copper liner melts during this process and, under pressure, converges into a high-speed jet that sequentially penetrates the casing, cement sheath, and reservoir. This process not only damages the wellbore structure but also causes the casing-cement sheath interface (Interface I) and the cement sheath-formation interface (Interface II) to fail, resulting in the formation of a weak interface at the perforation tunnels [15,16] and further validated by experiments conducted by previous researchers [9], as shown in Figure 1.
Figure 1.
Perforation penetration wellbore diagram.
During hydraulic fracturing operations, high-pressure fracturing fluid not only enters the target reservoir through perforation channels but also flows along the weak interface formed by perforation operations. Engineering practice results indicate that the fluid flow along the weak interfaces of the wellbore during the fracturing period not only significantly weakens the reservoir stimulation effect of multistage fracturing but also causes a significant decline in the production capacity of oil and gas wells [19,20,21]. To address this, it is necessary to clarify further and quantify the extent of damage to the bonding interfaces around the perforation tunnels after perforation operations are completed. Additionally, it is essential to analyze relevant geological and engineering factors to serve as the basis for adjusting process parameters and optimizing cement sheath slurry formulations.
2.1. Geometric Modeling and Meshing
Considering the geometric structure of perforating charges and wellbore assemblies in actual engineering applications, a numerical model was established based on ANSYS/LS-DYNA (R4.7) finite element software. In this model, the perforating charge is positioned at the center of the wellbore assembly, consisting of a copper liner, bomb, and shell. The wellbore assembly comprises, from the inside out, a casing, cement sheath, and formation, exhibiting an overall symmetrical structural characteristic. During model establishment, considering the complex dynamic process and large computational workload of perforation operations, a quarter-symmetry 3D model of perforating charge penetration through the wellbore assembly was developed. Additionally, to accurately simulate the detonation wave propagation characteristics of the shaped charges, the simulation utilized a central initiation approach, positioning the detonation source at the explosive axis’ geometric center. During the perforating charge explosion, considering the interaction between high-temperature, high-pressure explosive gases and wellbore fluids, the simulation incorporated an air domain as the transmission medium for the metallic jet and its path to maintain simulation fidelity. The air domain adopted a rectangular geometric configuration, as shown in Figure 2.
Figure 2.
Three-dimensional simulation of perforating charge interaction with the wellbore.
The overall height of the model is set to 450 mm, with a casing diameter of 139.7 mm and a thickness of 6.98 mm; the cement sheath thickness is 38.1 mm; and the simulated formation thickness is 140 mm. Measuring 48 mm in height, the perforating charge has a copper liner with a 30 mm diameter, 2 mm thickness, a 60° cone angle, and a 40 mm shell diameter. Additionally, a single layer of cohesive elements was implemented at both the casing-cement and cement-formation bonding interfaces to simulate interfacial damage during jet penetration. The element thickness was determined as 0.5 mm based on considerations of physical approximation of the actual bonding layer thickness, mesh compatibility, and parametric studies. The copper liner, bomb, and air domain were modeled using the ALE (Arbitrary Lagrangian-Eulerian) mesh, while the casing, cement sheath, and formation were discretized using the Lagrangian mesh. The Lagrangian and ALE meshes were spatially overlaid but maintained independent node numbering and topological structures, thereby enabling fluid–structure interaction simulations.
In terms of mesh division, the model was discretized with hexahedral elements of type HEX8, employing hourglass control. To ensure sufficient mesh accuracy while avoiding excessive computation time, a variable density mesh division method is used, with a locally densified mesh for the near-field region of the perforating charge and a sparse mesh for the far-field region. A mesh convergence study confirmed that this mesh scheme yields mesh-independent results. The model mesh ultimately converges to 1,084,652 elements, as shown in Figure 3.
Figure 3.
Meshing the grid of the numerical model (a. Mesh morphology of the cross-section of the model; b. Mesh morphology of the longitudinal section of the model.).
In the boundary condition setup, the top and side surfaces of the wellbore assembly near the perforation end are fixed using displacement sheath constraints. Meanwhile, non-reflective boundary conditions were applied to the far-field lateral and bottom boundaries of the model, as well as to the air domain boundaries, to simulate stress wave propagation in infinite geological formations [25]. This setup effectively absorbs stress waves arriving at the truncated model boundaries, preventing their spurious reflection back into the computational domain and thereby ensuring simulation accuracy.
2.2. Control Equations
During the penetration of the perforating charge into the wellbore assembly, the copper liner forms a high-speed metal jet driven by a bomb, which penetrates the casing, cement sheath, and enters the formation 8. In this numerical model, the bomb component of the perforating charge is modeled using the High_Explosive_Burn material model, with detonation wave characterized by the “Jones-Wilkins-Lee” (JWL) state equation [26,27], whose expression is:
where E signifies the internal energy that is explosive per unit mass, J·m−3; υ = 1/ρ is the specific volume, m3·kg−1; Abomb, Bbomb, R1, R2, and ω represent the properties of the bomb material. All parameter values are summarized in Table 1.

Table 1.
Characteristics of the bomb material model and its state equation.
The metallic composition of both the copper liner and shell is characterized using the Johnson-Cook material model coupled with the Mie-Grüneisen equation of state [28,29,30]. The Johnson-Cook model, due to its excellent strain rate sensitivity, has become the preferred constitutive model for simulating the formation and penetration process of metal jets driven by detonation. The material’s yield stress is given by:
where Agu is the initial yield stress, MPa; Bgu is the strain hardening coefficient, MPa; Cgu is the strain rate sensitivity coefficient, dimensionless; n is the strain hardening index, dimensionless; m is the temperature softening index, dimensionless; , dimensionless; Tmelt is the melting point temperature, K; Troom is the room temperature, K; is the equivalent plastic strain, dimensionless; is the normalized equivalent plastic strain rate, dimensionless. The Mie-Grüneisen state equation is expressed as [31]:
where E signifies the internal energy that is explosive per unit mass, J·m−3; C represents the intercept of the Vs-Vp curve, m·s−1; S1, S2 and S3 are the dimensionless slope coefficients of the Vs-Vp curve; γ0 is a dimensionless constant of the Mie-Gruneisen state equation; a denotes the first-order volume correction for γ0, dimensionless; ρ0 is the density of the medium in its normal state, kg·m−3; ρ is the density of the medium after compression, kg·m−3. The mechanical properties of the copper liner and shell [32] are shown in Table 2:
Table 2.
Material properties and constitutive parameters for the copper liner and shell.
The region through which the high-speed metal jet propagates after the perforating charge explodes is defined as the air domain. Ideal gases exhibit mechanical behavior that can be mathematically represented by a linear polynomial state equation, with the pressure expression given by:
where E signifies the internal energy that is explosive per unit mass, J·m−3; μ is the relative volume, dimensionless. The coefficients C0 through C6 represent constants in the governing equations.
The casing is modeled using the Plastic_Kinematic material model, and the Cowper-Symonds model is employed to account for strain-rate-dependent yield stress evolution under impact loading. The expression for the dynamic yield limit is as follows:
where is the dynamic yield stress, MPa; is the strain rate, s−1; C and p are strain rate parameters; is the initial yield stress, MPa; β is the hardening coefficient, dimensionless; is the plastic modulus, MPa; is the equivalent plastic strain, dimensionless.
Both the cement sheath and the formation use the Johnson-Holmquist-Concrete material model, which can effectively simulate the mechanical response characteristics of rock-like materials under dynamic loads. It is suitable for simulating the large deformation, high-strain-rate deformation process, and progressive damage evolution laws of rock materials under extreme conditions such as explosion impact and penetration. Its normalized equivalent stress is:
where is the quasi-static uniaxial compressive strength, MPa; is the pressure value, dimensionless; is the dimensionless strain rate; Ac, Bc and Cc are the material parameters of the cement sheath and formation, dimensionless; and are the equivalent plastic strain and plastic volume strain, respectively; D1 and D2 are the material damage constants, dimensionless; is the stress ratio, dimensionless; N is the pressure hardening index, dimensionless. The parameters are listed in Table 3.
Table 3.
Material model parameters and equations of state for both the cement sheath and formation.
2.3. Cohesive Zone Model
Considering that high-speed jets may induce stress concentration phenomena at the interface during penetration, leading to damage to the bonding interface and subsequent debonding issues, the cohesive zone model (CZM) was employed to simulate this scenario [33,34]. Cohesive zone elements are primarily used to simulate the fracture behavior of materials or structures, enabling accurate quantification of the stress-displacement sheath relationship at the fracture interface [35]. Based on this, during the study, cohesive zone elements with a thickness of 0.5 mm were set at the bonding interface to conduct numerical analysis of the damage to Interfaces I and II during the perforation operation, as shown in Figure 4.
Figure 4.
Separation-traction constitutive relationship.
In the process of characterizing cohesive units, the two curves in the bilinear cohesive model represent the linear elastic stage and the softening stage after reaching the strength limit, respectively. The horizontal axis represents displacement, the vertical axis represents traction force, and the energy dissipated during material damage is represented by the area enclosed by the curve and the horizontal axis in the figure.
For the bilinear cohesive zone model, during the linear elastic stage before the tensile force reaches the critical value, the tensile force increases linearly with increasing displacement. When the tensile force reaches the tensile strength or shear strength, cohesive units begin to crack, and the mechanical properties of the interface gradually deteriorate, causing the tensile force to decrease accordingly [36]. Finally, due to the accumulation of damage, the cracks continue to propagate, and when the tensile force decreases to 0, the interface is destroyed and loses its load-bearing capacity.
During the linear elastic stage, the relationship between the force and displacement of cohesive units is as follows:
where is the normal stress, Pa; and are the two tangential stresses, Pa; is the normal stiffness, Pa; and are the two tangential stiffnesses, Pa; and are the displacement sheaths in the normal and two tangential directions, respectively. In the calculation process, the coupling between the normal and tangential mechanical properties is not considered, the three stiffnesses are independent of each other, and it is assumed that .
During the crack initiation stage, the maximum nominal stress criterion (Maxe Damage) is used as the critical damage criterion to analyze the damage of cohesive units. When the following formula is satisfied, damage begins to appear at the interface. The expression is as follows:
where and represent the critical strength values in normal, primary shear, and secondary shear directions, respectively, for the cohesive unit, Pa; < > is the Magellan bracket, defined as:
During the crack propagation stage, stiffness gradually decreases due to the continuous degradation of interface performance. As the crack propagates, the tensile force continuously decreases. At this point, the stiffness degradation coefficient quantifies the extent of damage to the bonding interface:
where represents the peak displacement attained under loading conditions, m; represents the displacement at complete cohesive failure, m; is the displacement at the initial damage, m. When , the integrity of the bonding interface remains preserved; when , the bonding interface has undergone complete failure; the specific parameter settings of the cohesive unit used [6] are summarized in Table 4:
Table 4.
Model parameters of the cohesive interface.
3. Results and Discussion
3.1. Perforation Dynamic Process
3.1.1. Damage Characteristics of Bonding Interface
When the perforating charge detonates, the copper liner is driven by the bomb to form a high-speed metal jet, penetrating the wellbore assembly. The sequential evolution from charge detonation to flow channel establishment via jet penetration comprises four distinct stages: the jet formation stage (Stage I), the development stage (Stage II), the penetration stage (Stage III), and the stabilization stage (Stage IV). The jet characteristics and dynamic changes in the effective stress of the wellbore assembly during each stage are shown in Figure 5, Figure 6, Figure 7 and Figure 8.
Figure 5.
t1 ≤ 10 μs jet characteristics and effective stress changes in the wellbore assembly.
Figure 6.
10 μs < t2 ≤ 20 μs jet characteristics and effective stress changes in the wellbore assembly.
Figure 7.
20 μs < t3 ≤ 50 μs jet characteristics and effective stress changes in the wellbore assembly.
Figure 8.
t4 ≤ 400 μs jet characteristics and effective stress changes in the wellbore assembly.
Stage I (t1 ≤ 10 μs): The explosive detonation of the perforating charge produces high-temperature, high-pressure gas, which immediately impacts the copper liner, inducing melting and axial convergence that generates a penetration-capable jet reaching peak velocities of 4646 m/s. This measured jet velocity shows agreement with the results obtained by previous researchers [37] (4569 m/s), confirming the reliability of our numerical model. At this stage, the metal jet head remains within the wellbore and has not yet come into contact with the wellbore assembly, with the effective stress of the wellbore assembly being 0 MPa, as shown in Figure 5.
Stage II (10 μs < t2 ≤ 20 μs): The high-speed metal jet has reached the casing’s interior surface. Due to the resistance of the casing metal material, the jet head is compressed, resulting in a morphological change with a larger front end and a smaller rear end. At the same time, the jet velocity gradually decreases (2906 m/s). The casing near the perforation location is penetrated by the high-speed jet, forming a perforation tunnel, as shown in Figure 6.
Stage III (20 μs < t3 ≤ 50 μs): When the high-speed jet penetrates the casing and continues to expand outward, it comes into contact with and penetrates the cement sheath. The jet velocity significantly decreases (1680 m/s) due to the effect of resistance. At this point, the cement sheath is penetrated, and significant damage occurs around the perforation tunnels. Stress decreases radially from the center of the perforation tunnels, as shown in Figure 7.
Stage IV (t4 ≤ 400 μs): The formation damage reaches a steady-state condition under continuous jet penetration, and the formation damage surrounding the perforation tunnel attains its maximum severity at this stage. Due to the influence of formation resistance, the jet breaks and becomes discontinuous, and its velocity rapidly decays to 411.1 m/s, as shown in Figure 8.
3.1.2. Dynamic Damage Evolution Law of Bonding Interface
During perforation penetration, dynamic loads cause damage to both the casing-cement sheath (Interface I) and cement sheath-formation (Interface II) bonding interface. The extent of damage along the wellbore axis and circumference can be quantified. Considering that the change in axial damage length during perforation is significantly greater than the change in circumferential damage angle, axial damage length is used as a key parameter to characterize the dynamic evolution of bonding interface damage quantitatively.
As shown in Figure 9, this illustrates the dynamic evolution process of damage to the casing-cement sheath interface. The figure reveals that jet penetration induces substantial casing-cement sheath interfacial damage, where the axial damage extent grows linearly with progressive jet advancement. At 20 μs, damage begins to appear on the bonding interface, with an axial damage length of 0.20 cm; by 400 μs, the maximum axial damage length (42.80 cm) is reached.
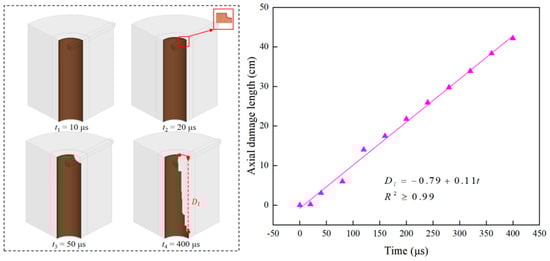
Figure 9.
Dynamic evolution process of Interface I damage.
Figure 10 shows the dynamic evolution process of damage to the cement sheath-formation interface. During perforation operations, the cement sheath-formation interface at the II interface may also sustain damage. The axial damage length exhibits a non-linear growth trend with the dynamic penetration of the jet, but the growth rate gradually decreases, overall following a quadratic function relationship. At 50 μs, damage begins to appear at the II interface, with an axial damage length of 1.50 cm; at 400 μs, the maximum axial damage length (12.98 cm) is reached.
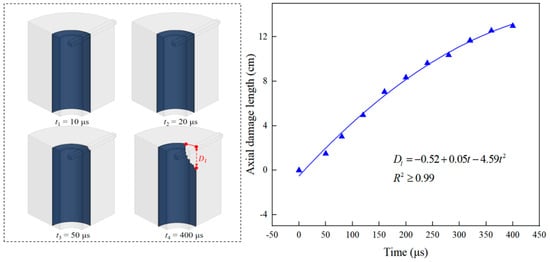
Figure 10.
Dynamic evolution process of Interface II damage.
The numerical results reveal that while both Interface I (casing-cement sheath) and Interface II (cement sheath-formation) experience perforation-induced damage, their respective damage evolution characteristics exhibit fundamentally distinct patterns: the damage at Interface I propagates rapidly, with the damaged area extending along the model axis at a rapid rate, reaching a maximum damage length of 42.8 cm, while damage propagation at the II interface is relatively slower, with a more minor increase in damage length, reaching a maximum of 12.98 cm. This is primarily because Interface I directly sustains the impact of the high-speed jet during perforation. In contrast, following cement sheath penetration, the jet’s velocity significantly decreases, resulting in Interface II damage notably less severe than Interface I.
3.1.3. Dynamic Stress of Bonding Interface
During the high-speed metal jet penetration of the wellbore, the effective stress on the wellbore bonding interface continues to increase. Once the stress on the bonding interface exceeds its ultimate strength, debonding occurs. As penetration continues, the debonded area expands, progressively compromising cement sheath structural integrity. Based on this, further research is conducted on the stress change characteristics of Interfaces I and II during perforation operations, please see the Supplementary Materials for details. The perforation penetration process exhibits four distinct phases, illustrated in Figure 11 and Figure 12:
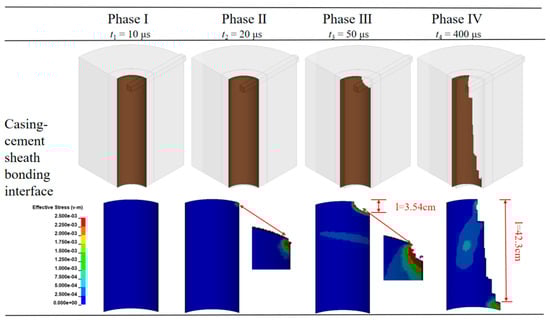
Figure 11.
Changes in effective stress distribution at Interface I.
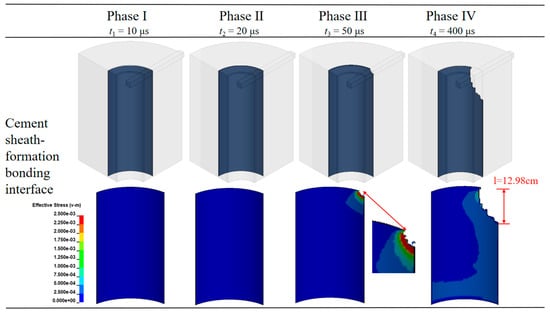
Figure 12.
Changes in effective stress distribution at Interface II.
(1) Initial Stabilization Phase (Phase I): The copper liner is driven by the bomb to converge towards the central axis, forming a high-speed metal jet. During this phase, the jet does not come into contact with the casing, and the wellbore system remains in its original stress equilibrium state, with effective stress at Interfaces I and II being 0 MPa.
(2) Casing Penetration Phase (Phase II): The metal jet has reached the casing’s interior surface (t1 = 20 μs). Under the combined effects of compression and shear, the stress around the perforation tunnels at Interface I exhibits a radial arc-shaped distribution, with the maximum stress located at the central region of the perforation channel. Meanwhile, at Interface II, since the jet has not yet propagated to this region, the effective stress remains 0 MPa.
(3) Cement Sheath Penetration Phase (Phase III): As the metal jet penetrates the cement sheath, establishing perforation tunnels (t2 = 50 μs), the stress concentration zone gradually forms along the wellbore axis near the perforation tunnels at Interface I, and this stress concentration zone continues to expand as penetration progresses (l1 = 3.54 cm). Meanwhile, stress concentration begins to appear at Interface II, with damage concentrated near the perforation tunnels;
(4) Formation Penetration Stage (Phase IV): As penetration progresses, the effective stress at both Interface I and II continues to expand along the wellbore axis, reaching the peak damage range. The overall damage extent at Interface I (l1 = 42.3 cm) is significantly greater than that at Interface II (l2 = 12.98 cm), and the stress near the perforation tunnels is notably higher than in non-perforated areas.
The following two factors mainly cause the above damage patterns:
As the metal jet penetrates through the wellbore assembly, its velocity and diameter undergo significant reduction due to resistive forces. Consequently, the elevated jet velocity and larger fluid column diameter observed at Interface I lead to substantially more severe damage compared to Interface II.
As a metallic material, the casing primarily dissipates the kinetic energy of the jet stream through extensive plastic deformation during the penetration process. This failure mode effectively disperses the jet stream’s energy, significantly reducing its subsequent penetration capability. In contrast, the cement sheath, as a brittle material, primarily dissipates energy through brittle fracture and crack propagation, with relatively low energy absorption efficiency during crack initiation and propagation. It is precisely due to this abrupt change in energy dissipation mechanisms that Interface I experiences higher stress concentration, leading to more severe damage.
3.2. Influencing Factors
3.2.1. Influence of Cement Sheath Shear Modulus
Variations in cement sheath material properties directly govern perforation-induced damage severity; shear modulus—a key parameter characterizing a material’s resistance to shear deformation—plays a crucial role. Changes in its value can significantly influence the extent of damage to the bonding interface caused by perforation operations 13. To address this, cement sheath shear moduli of 8 GPa, 12 GPa, 16 GPa, and 20 GPa were systematically evaluated to quantify interfacial damage evolution at both casing-cement sheath and cement sheath-formation interface.
Figure 13 displays the numerical simulation results for the casing-cement sheath interface. When the shear modulus increases, the damaged area at Interface I grows gradually, with a limited magnitude. The most severe damage to the cement sheath interface occurs near the perforation tunnels, and it expands along the circumferential direction of the model. The damage expansion along the axial direction of the wellbore is more pronounced, and it intensifies towards the bottom region of the model. This phenomenon occurs primarily because the stiffness mismatch between the high-shear-modulus cement sheath and the casing tends to induce stress concentration at the interface, which aggravates damage at Interface I.
Figure 13.
Changes in effective stress distribution at Interface I with shear modulus.
The numerical simulation results of the cement sheath-formation interface are shown in Figure 14. As the shear modulus increases, the damaged area of the bonding interface gradually decreases, and significant damage appears at the interface near the perforation tunnels. With increasing circumferential angle, the effective stress exhibits a radial decay pattern, while axially, damage propagation remains limited to just one-third of the model’s extent. The reason is that increased shear modulus reduces cement sheath-formation interface shear strain during jet penetration, consequently diminishing damage propagation.
Figure 14.
Changes in effective stress distribution at Interface II with shear modulus.
To quantify the influence of shear modulus on the damage extent at the wellbore Interfaces I and II, analysis was conducted by measuring the axial damage length and circumferential damage angle of the cement sheath-formation interface. As shown in Figure 15 and Figure 16:
Figure 15.
Relationship curve between the axial damage length and circumferential damage angle of Interface I and the shear modulus.
Figure 16.
Relationship curve between the axial damage length and circumferential damage angle of Interface II and the shear modulus.
With progressively higher shear modulus values in the cement sheath, the post-perforation axial damage length at the casing-cement interface demonstrates linear growth. Specifically, Interface I shows a damage length of 40.25 cm at 8 GPa, which extends by 3.44 cm (8.55% increase) when the modulus reaches 20 GPa. However, the circumferential damage angle at Interface I is largely unaffected by changes in shear modulus and remains essentially constant across different shear moduli (approximately 40.88°).
At Interface II, both axial and circumferential damage decrease with increasing shear modulus, but the patterns of change between the two exhibit significant differences. The length of axial damage exhibits a quadratic relationship with the shear modulus of the cement sheath. With the shear modulus increasing from 8 GPa to 20 GPa, the axial damage length decreases by 2.25 cm, representing a decrease of 15.41%. The circumferential damage angle, however, exhibits an S-shaped curve relationship with the shear modulus, decreasing from 27.65° to 17.98°, with a decrease of 34.95%. Comparison reveals that circumferential damage is more sensitive to changes in shear modulus than axial damage.
A comprehensive analysis of the two figures reveals that as the shear modulus increases, the damaged area at the casing-cement sheath interface shows a continuous expansion trend, while the affected zone at the cement sheath-formation interface gradually contracts. This phenomenon occurs because when the cement sheath has a higher shear modulus, the significant stiffness difference between it and the casing tends to cause stress concentration at their bonding interface. Conversely, the increased shear modulus of the cement sheath reduces the shear strain at the cement sheath-formation interface under the impact of the metal jet, thereby mitigating the extent of damage.
Drawing from the obtained data, in cementing engineering practice, it is advisable to give priority to cement sheath slurry systems with a lower shear modulus. These materials are capable of mitigating the damage to the bonding interface induced by perforation, thus better safeguarding the sealing integrity of the cement sheath.
3.2.2. Influence of Cement Sheath Compressive Strength
Compressive strength is a key mechanical parameter that characterizes a material’s resistance to external compressive failure. Under perforation impact loads, increasing compressive strength can control damage by raising the failure threshold. Enhanced compressive strength in cement sheaths provides greater stress-bearing capacity, significantly inhibiting both compressive failure and radial fracture propagation. Their numerical changes also significantly regulate the damage evolution of the bonding interface during perforation operations. To study the damage patterns of wellbore Interfaces I and II as a function of cement sheath compressive strength, cement sheaths with compressive strengths of 24 MPa, 28 MPa, 32 MPa, and 36 MPa were used to calculate the damage conditions of the bonding interface.
Figure 17 shows the effective stress contour map of Interface I under perforation operations and the relationship curve between axial damage length and compressive strength. As shown in the figure, as the metal jet penetration progresses, the axial damage length of the casing-cement sheath interface continues to increase. However, as the compressive strength increases, the axial damage length gradually decreases, exhibiting an overall decreasing trend. At 24 MPa compressive strength, Interface I exhibits peak axial damage (42.3 cm); when increased to 36 MPa, the axial damage length decreases by 4.02 cm, representing a 9.50% reduction. The data demonstrate that elevating the cement sheath’s compressive strength significantly restricts damage progression at Interface I. This improvement stems from microstructural densification during strength enhancement, which decreases imperfections in the interfacial transition zone. Consequently, stress distribution becomes more uniform, effectively suppressing interfacial damage initiation.
Figure 17.
Effective stress cloud diagram of Interface I and relationship curve between axial damage length and compressive strength.
Figure 18 displays both the effective stress contour map of Interface II during perforation processes and the curve that depicts how axial damage length relates to compressive strength. The axial damage propagation at Interface II demonstrates a clear non-linear response to increasing cement sheath compressive strength, characterized by an initial growth phase followed by a subsequent reduction. With the cement sheath’s compressive strength reaching 28 MPa, the axial damage length of Interface II reaches its peak value of 16.8 cm. However, when the compressive strength is increased to 36 MPa, the axial damage length decreases by 6.6 cm, representing a reduction of 39.29%. This indicates that increasing the compressive strength can effectively reduce damage to Interface II. The reason is that as the compressive strength increases, the material’s resistance to penetration significantly enhances. During the jet penetration process, this enhanced penetration resistance can significantly reduce the jet velocity, thereby causing the damage area at Interface II to decrease gradually.
Figure 18.
Effective stress cloud diagram of Interface II and relationship curve between axial damage length and compressive strength.
Enhanced compressive strength in cement sheaths demonstrates significant potential for reducing perforation-induced interface damage. Consequently, it is advisable to adopt a high-strength cement sheath as the cement material to lessen damage at the perforation tunnels.
3.2.3. Influence of Geological Stress
Due to the compressive effect of geological stress on the wellbore, the metal jet may dissipate more jet energy during penetration, potentially affecting the extent of damage to the bonding interface [38]. To investigate the variation in damage to the wellbore Interfaces I and II with changes in geological stress, a series of circumferential uniform stresses (0, 10, 20, and 40 MPa) was applied. As shown in Figure 19 and Figure 20, these are the effective stress contour maps of Interfaces I and II after perforation operations, along with the relationship curves between axial damage length and uniform stress.
Figure 19.
Effective stress cloud diagram of Interface I and relationship curve between axial damage length and uniform stress.
Figure 20.
Effective stress cloud diagram of Interface II and relationship curve between axial damage length and uniform stress.
As shown in Figure 19, the effective stress at Interface I decreases with an increase in uniform stress. Meanwhile, the axial damage length at Interface I decreases significantly with an increase in uniform stress, exhibiting an exponential function form overall. When the uniform stress is 0 MPa, the axial damage length is 42.5 cm; when increased to 40 MPa, the damage length decreases to 40.34 cm, a decrease of 2.16 cm, representing a 5.08% reduction. This is because the compressive effect of the uniform stress on the wellbore increases the bonding strength of the bonding interface. During the metal jet penetration process, this enhanced bonding strength requires more jet energy to be consumed. Therefore, the energy available for bonding interface damage is correspondingly reduced, thereby effectively suppressing the occurrence of damage.
As shown in Figure 20, as the uniform stress increases, the axial damage length at Interface II also decreases continuously, exhibiting a quadratic relationship overall. When the uniform stress is 0 MPa, the axial damage length is 14.48 cm; when increased to 40 MPa, the damage length decreases by 3.66 cm, representing a decrease of 25.28%. This indicates that an increase in uniform stress can significantly suppress the damage caused by perforation to the cement sheath-formation interface.
Considering that analyzing only the axial damage length cannot fully reflect the damage morphology characteristics, the damage was extracted along the trajectory coordinates and projected onto the coordinate axes, as shown in Figure 21. Comparison revealed that the damage area at Interface I was less sensitive to uniform stress. In contrast, the damage area at Interface II showed a significant decreasing trend with increasing uniform stress, indicating higher sensitivity. This is due to the different mechanical constraint environments of the two interfaces. The casing is made of high-strength material, with a Young’s modulus much higher than that of the cement sheath and the formation. The casing-cement interface is subjected to the rigid constraint of the high-strength casing on the inside, which greatly suppresses relative displacement at the interface, allowing it to respond gently under uniform stress. In contrast, the cement-formation interface on the outside is adjacent to the broad and relatively soft formation, with weaker constraints. Under uniform stress, the difference in elastic modulus between the cement sheath and the formation causes significant radial displacement differences, leading to high shear stress concentration at this interface. Therefore, the cement-formation interface, which has weaker constraints and greater freedom to deform on the outside, is naturally more sensitive to in situ stress and becomes the most vulnerable link in the system.
Figure 21.
Relationship curve between the damage area of Interfaces I and II and uniform stress.
Considering the combined axial damage length and damage area, the uniform stress exerted by the wellbore significantly influences the development of damage at Interfaces I and II. Specifically, under uniform stress, the wellbore structure is in a state of triaxial stress equilibrium, and this confining pressure effect significantly enhances the bonding strength of the bonding interface. When a metal jet penetrates the wellbore structure subjected to uniform stress compression, it must overcome higher bonding strength, thereby dissipating more kinetic energy, which results in the damage area of the bonding interface gradually decreasing. Generally, as reservoir depth increases, formation stress exhibits a gradient increase, and the bonding strength of the bonding interface also increases accordingly. Therefore, during shallow reservoir development, due to the relatively low formation stress, the risk of damage to the bonding interface caused by perforation operations requires special attention.
4. Case Study
This study selected a typical shale gas well in the Fuling block as the research object [39]. The well adopts a three-stage wellbore structure design, with the diameters of the first, second, and third stages being 410 mm, 335 mm, and 228 mm, respectively. The production casing features a 139.7 mm outer diameter with 6.98 mm wall thickness. The material exhibits an elastic modulus of 210 GPa, a Poisson’s ratio of 0.30, and a yield strength of 758 MPa. The mechanical behavior of the cement sheath follows the Mohr-Coulomb criterion, with specific parameters as follows: shear modulus of 12 GPa, internal friction angle of 30°, and cohesion of 8 MPa. Based on the above parameters, a corresponding numerical model was established and calculated, yielding the numerical simulation results shown in Figure 22.
Figure 22.
Effective stress cloud map of Interfaces I and II.
During the initial stage of perforation penetration, the bonding interface area directly exposed to the metal jet first reaches the material’s ultimate tensile strength, leading to the onset of damage. As penetration progresses, cracks continue to form and propagate, with this damage gradually expanding along the wellbore axis, resulting in a progressive failure pattern. Figure 22 reveals a marked disparity in damage severity between the two interfaces, with the casing-cement sheath interface exhibiting substantially more extensive failure than the cement sheath-formation interface. To quantitatively assess the damage characteristics of Interfaces I and II under metal jet penetration, a fitting analysis was conducted on the data regarding the axial damage length and circumferential damage angle of Interfaces I and II over time. The fitting results are shown in Figure 23.
Figure 23.
Relationship curve between the axial damage length and circumferential damage angle at Interfaces I and II.
As can be seen from the fitted curve, both axial and circumferential damage at Interfaces I and II continue to worsen as the penetration process progresses, exhibiting a non-linear growth trend. However, the damage development rate and final damage extent at Interface I are significantly higher than those at Interface II. Specifically, the peak axial damage length at Interface I reached 37.1 cm, an increase of 19.8 cm compared to the 17.3 cm at Interface II, representing a 114% increase. In terms of circumferential damage extent, the damage angle at Interface I was 41.4°, significantly higher than the 27.5° at Interface II, with the former exceeding the latter by 50.5%.
Given that the aforementioned damage variations are intrinsically related to the cement sheath’s material properties—consistent with field engineering practices employing elastic-ductile additives (e.g., fibers, latex) to reduce shear modulus [40]—this study employs three cement sheath systems with different shear modulus—hard cement sheath (G1 = 8 GPa), medium cement sheath (G2 = 12 GPa), and flexible cement sheath (G3 = 32 GPa)—to investigate their effects on the damage of the bonding interface, as shown in Figure 24.
Figure 24.
Relationship curve between the axial damage length at Interfaces I and II and the shear modulus.
With increasing cement sheath shear modulus, there are significant differences in the damage at Interfaces I and II. The axial damage length at Interface I exhibits a positive correlation with the shear modulus. With the shear modulus increasing from 8 GPa to 32 GPa, the axial damage length expands from 40.25 cm to 41.81 cm, amounting to a 3.9% growth. This implies that the damage at Interface I is relatively insensitive to changes in shear modulus. In contrast, the axial damage length at Interface II exhibits a significant negative correlation with shear modulus. Under the same conditions, the axial damage length at Interface II decreases from 14.57 cm to 9.97 cm, with a reduction percentage of 31.63%, indicating that shear strength significantly influences the control of damage at Interface II.
From the perspective of optimizing the integrity of the bonding interface, prioritizing a cement sheath system with a 12 GPa shear modulus is advisable. This can be achieved by adding some elastic-ductile materials such as fibers or latex during the preparation of the cement sheath slurry. It should be emphasized that the simulation results do not take into account key parameters in actual engineering, such as economic costs, long-term downhole conditions, and sensitivity to changes in formation pore pressure. These factors are critical for any field application and must be considered in future research.
5. Conclusions
Considering the engineering realities of high-speed metal jet penetration of wellbore assemblies during perforation operations, a fluid-solid coupling algorithm was utilized alongside a cohesive zone model to develop a three-dimensional numerical model of the perforation charge penetrating the wellbore assembly. The study assessed the impact of cement mechanical properties and geological parameters on damage to the bonding interface, with principal conclusions as follows:
(1) The established 3D numerical model, integrating fluid-solid coupling with a cohesive zone model, enabled analysis of perforation-induced bonding interface damage. Damage characterization revealed substantial damage at both the casing-cement sheath and cement sheath-formation interfaces, with consistently more severe failure observed at the former.
(2) The research investigated the influence of cement parameters on bonding interface damage evolution. Increasing the shear modulus produces divergent effects—extending damage along the casing-cement sheath interface while reducing failure at the cement sheath-formation interface. As compressive strength increases, both bonding interfaces exhibit progressive damage reduction.
(3) The research investigated the influence of geological parameters (geostress) on bonding interface damage evolution. As geostress increases, the axial damage length at both the casing-cement sheath interface and the cement sheath-formation interface decreases, though with distinct trends—exponential decay for the former and quadratic decline for the latter.
(4) Based on actual engineering cases, the research examined the impact of diverse cement slurry systems on bonding interface damage characteristics. It proposed an optimal cement slurry system scheme constrained by the impact of perforation penetration on bonding interface damage, recommending the use of elastic-ductile cement slurry in perforation operation sections to reduce damage to the bonding interface caused by perforation.
Supplementary Materials
The following supporting information can be downloaded at: https://www.mdpi.com/article/10.3390/app152111475/s1, Video S1: Video Documentation of Dynamic Effective Stress Variations at the Casing-Cement Sheath Interface Under Perforation Impact. Video S2: Video Documentation of Dynamic Effective Stress Variations at the Cement Sheath-Formation Interface Under Perforation Impact.
Author Contributions
Writing—review and editing, Y.X.; funding acquisition, Y.X.; writing—original draft preparation, W.S.; resources, J.F.; investigation, Y.L.; supervision, H.J. All authors have read and agreed to the published version of the manuscript.
Funding
This study was financially supported by the National Natural Science Foundation of China (52374001), Chongqing Natural Science Foundation (CSTB2024NSCQ-MSX0882), Foundation of State Key Laboratory of Petroleum Resources and Engineering (PRE/open-2408).
Institutional Review Board Statement
Not applicable.
Informed Consent Statement
Not applicable.
Data Availability Statement
Dataset available on request from the authors.
Conflicts of Interest
The authors declare that they have no known competing financial interests or personal relationships that could have appeared to influence the work reported in this paper.
References
- Yousuf, N.; Olayiwola, O.; Guo, B.; Liu, N. A comprehensive review on the loss of wellbore integrity due to cement failure and available remedial methods. J. Pet. Sci. Eng. 2021, 207, 109123. [Google Scholar] [CrossRef]
- Bu, Y.H.; Ma, R.; Guo, S.L.; Du, J.; Liu, H.; Cao, X. A theoretical evaluation method for mechanical sealing integrity of cementing sheath. Appl. Math. Model. 2020, 84, 571–589. [Google Scholar] [CrossRef]
- Du, J.P.; Bu, Y.H.; Cao, X.C.; Shen, Z.; Sun, B. Utilization of alkali-activated slag based composite in deepwater oil well cementing. Constr. Build. Mater. 2018, 186, 114–122. [Google Scholar] [CrossRef]
- Yan, Y.; Guan, Z.C.; Xu, Y.Q.; Yan, W.; Wang, H. Numerical investigation of perforation to cementing interface damage area. J. Pet. Sci. Eng. 2019, 179, 257–265. [Google Scholar] [CrossRef]
- Wang, J.P.; Zhang, W.; Song, L.; Wu, J.; Wu, Y. Study on sealing integrity of cement sheath in ultra deep well reservoir reconstruction. Energy Sci. Eng. 2023, 11, 2630–2641. [Google Scholar] [CrossRef]
- Wang, W.; Taleghani, A.D. Three-dimensional analysis of cement sheath integrity around Wellbores. J. Pet. Sci. Eng. 2014, 121, 38–51. [Google Scholar] [CrossRef]
- Yew, C.H.; Zhang, X. A study of the damage zone created by shaped-charge perforating. In Proceedings of the SPE Rocky Mountain Petroleum Technology Conference/Low-Permeability Reservoirs Symposium, Denver, CO, USA, 26–28 April 1993. [Google Scholar] [CrossRef]
- Yan, Y.; Guan, Z.C.; Yan, W.J.; Wang, H. Mechanical response and damage mechanism of cement sheath during perforation in oil and gas well. J. Pet. Sci. Eng. 2020, 188, 106924. [Google Scholar] [CrossRef]
- Liu, X.B.; Li, J.; Lian, G.H.; Lian, W.; Yang, H.; Wang, D.; Liu, P. Analysis of FEM-SPH coupling for perforation penetration variation under different geology-engineering conditions. Comput. Part. Mech. 2024, 11, 867–883. [Google Scholar] [CrossRef]
- Zhang, H.; Yu, Q.; Li, J.; Yang, H.; Wu, Y.; Chen, Y.; Wang, X.; Liu, K.; Zhou, Y.; Dong, Z. Damage analysis of cement sheath and rock subjected to electrohydraulic shock waves under the perforation completion. Energy Sci. Eng. 2024, 12, 3289–3307. [Google Scholar] [CrossRef]
- Li, H.; Yao, Y.; Ding, J.X.; Wang, H.; Wang, J.; Xi, Y. Damage of Cement Sheath under Perforation Conditions. China Pet. Mach. 2025, 53, 80–87. (In Chinese) [Google Scholar] [CrossRef]
- Pucknell, J.K.; Behrmann, L.A. An investigation of the damaged zone created by perforating. In Proceedings of the 66th Annual Technical Conference and Exhibition of the Society of Petroleum Engineers, Dallas, TX, USA, 6–9 October 1991. [Google Scholar] [CrossRef]
- Yan, Y.; Guan, Z.C.; Han, L.H.; Liu, Y. Coupled thermo-hydro-mechanical analysis of perforated cement sheath integrity during hydraulic fracturing. J. Pet. Sci. Eng. 2022, 218, 110950. [Google Scholar] [CrossRef]
- Godfrey, W.K. Effect of Jet Perforating on Bond Strength of cement sheath. In Proceedings of the SPE 43rd Annual Fall Meeting, Houston, TX, USA, 29 September–2 October 1968. [Google Scholar]
- Fan, M.T.; Li, J.; Liu, G.H. Study on the sealing integrity of cement sheath during volume fracturing of shale gas of horizontal well. Cluster Comput. 2019, 22, S5009–S5016. [Google Scholar] [CrossRef]
- Li, Y.; Chen, Y.; Jin, J.Z.; Jiang, L.; Ding, F.; Yuan, X. Cement ring interface crack propagation under volume fracturing in shale gas well. Acta Pet. Sin. 2017, 38, 105–111. (In Chinese) [Google Scholar] [CrossRef]
- Feng, Y.C.; Li, X.R.; Gray, K.E. Development of a 3D numerical model for quantifying fluid-driven interface debonding of an injector well. Int. J. Greenh. Gas Control 2017, 62, 76–90. [Google Scholar] [CrossRef]
- Lecampion, B.; Bunger, A.; Kear, J.; Quesada, D. Interface debonding driven by fluid injection in a cased and cemented wellbore: Modeling and experiments. Int. J. Greenh. Gas Control 2013, 18, 208–223. [Google Scholar] [CrossRef]
- Gao, Q.; Cheng, Y.F. Numerical investigation of fluid-driven debonding fracture propagation along wellbore interfaces during hydraulic fracturing. Energy Sources Part A 2018, 40, 1215–1225. [Google Scholar] [CrossRef]
- Lian, H.; Li, Z.M.; Liu, G.H.; Tao, Q. Numerical simulation of cement-to-formation interface debonding during hydraulic fracturing of shale gas wells. J. Adhes. Sci. Technol. 2019, 34, 917–935. [Google Scholar] [CrossRef]
- Xu, Y.Q.; Yan, Y.; Xu, S.Q.; Guan, Z. Numerical Simulation Study on Propagation of Initial Microcracks in Cement Sheath Body during Hydraulic Fracturing Process. Energies 2020, 13, 1260. [Google Scholar] [CrossRef]
- Wang, X.Q.; Song, J.X.; Liu, W.H.; He, J.; Xu, Z.; Zhang, Z.; Ge, H.; Zou, Y.; Wang, Y. Experimental study on hydraulic fracturing and acoustic emission characteristics of shale. Chin. J. Geophys. 2025, 68, 229–243. (In Chinese) [Google Scholar] [CrossRef]
- Yan, Y.; Guan, Z.C.; Xu, Y.Q.; Yan, W.; Chen, W. Study on debonding issue of cement sheathing interfaces caused by perforation with numerical simulation and experimental measures. SPE Drill. Complet. 2020, 35, 684–695. [Google Scholar] [CrossRef]
- Guo, Z.H.; Gou, J.H.; Zhou, T.; He, W.; Yu, D. Research on damage mechanism of casing based on fluid-structure coupling and perforation performance of new perforation device. Geoenergy Sci. Eng. 2025, 244, 213478. [Google Scholar] [CrossRef]
- Villavicencio, R.; Soares, C.G. Numerical modelling of the boundary conditions on beams stuck transversely by a mass. Int. J. Impact Eng. 2011, 38, 384–396. [Google Scholar] [CrossRef]
- Liu, J.; Guo, X.Q.; Liu, Z.J.; Liu, X.; Liu, Q. Pressure field investigation into oil&gas wellbore during perforating shaped charge explosion. J. Pet. Sci. Eng. 2019, 172, 1235–1247. [Google Scholar] [CrossRef]
- Chen, C.Y.; Shiuan, J.H.; Lan, I.F. The Equation of State of Detonation Products obtained from cylinder expansion test. Propellants Explos. Pyrotech. 1994, 19, 9–14. [Google Scholar] [CrossRef]
- Steinberg, D.J.; Cochran, S.G.; Guinan, M.W. A constitutive model for metals applicable at high-strain rate. J. Appl. Phys. 1980, 51, 1498–1504. [Google Scholar] [CrossRef]
- Iqbal, M.A.; Rajput, A.; Gupta, N.K. Performance of prestressed concrete targets against projectile impact. Int. J. Impact Eng. 2017, 110, 15–25. [Google Scholar] [CrossRef]
- Hao, W.Q.; Zhang, P.; Xie, J.M.; Hou, M.; Wang, Z.; Bai, X. Investigation of impact performance of perforated plates and effects of the perforation arrangement and shape on failure mode. Eng. Fail. Anal. 2022, 140, 106638. [Google Scholar] [CrossRef]
- Xi, Y.; Yao, Y.; Chen, P.H.; Li, J.; Wang, H.; Li, H. Investigation of casing stress distribution and parameter optimization during the transient impact process of multi-hole perforation operations. Eng. Fail. Anal. 2024, 155, 107761. [Google Scholar] [CrossRef]
- Elshenawy, T.; Li, Q.M. Influences of target strength and confinement on the penetration depth of an oil well perforator. Int. J. Impact Eng. 2013, 54, 130–137. [Google Scholar] [CrossRef]
- Wang, G.H.; Liu, A.B.; Lu, W.B.; Chen, M.; Yan, P. Failure modes and dynamic responses of roller compacted concrete gravity dams subjected to underwater contact explosion based on the cohesive model. Eng. Fail. Anal. 2023, 150, 107367. [Google Scholar] [CrossRef]
- Luo, Y.; Pei, C.H.; Qu, D.X.; Li, X.; Ma, R.; Gong, H. Distribution of cracks in an anchored cavern under blast load based on cohesive elements. Sci. Rep. 2022, 12, 4478. [Google Scholar] [CrossRef] [PubMed]
- Linke, M.; Lammering, R. On the calibration of the cohesive strength for cohesive zone models in finite element analyses. Theor. Appl. Fract. Mech. 2023, 124, 103733. [Google Scholar] [CrossRef]
- Zhang, M.H.; Chen, J.K.; Zhao, F.; Bai, S. A new model of interfacial adhesive strength of fiber-reinforced polymeric composites upon consideration of cohesive force. Int. J. Mech. Sci. 2016, 106, 50–61. [Google Scholar] [CrossRef]
- Liu, X.B.; Li, J.; Yang, H.W.; Liu, G.; Lian, W.; Wang, B.; Zhang, G. A new investigation on optimization of perforation key parameters based on physical experiment and numerical simulation. Energy Rep. 2022, 8, 13997–14008. [Google Scholar] [CrossRef]
- Jiang, M.Z.; Bao, Z.S.; Dong, K.X.; Liu, J.; Cao, Y. Numerical simulation and experimental study on the sealing capacity of cemented well interface. Mach. Des. Manuf. Eng. 2025, 54, 13–18. (In Chinese) [Google Scholar] [CrossRef]
- Xi, Y.; Li, J.; Tao, Q.; Zeng, X.; Zhong, W. Emergence and evolution of micro-annulus under cyclic loading. Fault-Block Oil Gas Field 2020, 27, 522–527. Available online: https://caod.oriprobe.com/articles/59494867/Emergence_and_evolution_of_micro_annulus_under_cyc.htm (accessed on 23 September 2025). (In Chinese).
- Cheng, Y.Q.; Liu, S.Q.; Shen, J.Y.; Guo, X.; Huang, Z.; Liu, H. Matching analysis and experimental study of mechanical properties of cement sheath interface. J. Pet. Sci. Eng. 2023, 220, 111138. [Google Scholar] [CrossRef]
Disclaimer/Publisher’s Note: The statements, opinions and data contained in all publications are solely those of the individual author(s) and contributor(s) and not of MDPI and/or the editor(s). MDPI and/or the editor(s) disclaim responsibility for any injury to people or property resulting from any ideas, methods, instructions or products referred to in the content. |
© 2025 by the authors. Licensee MDPI, Basel, Switzerland. This article is an open access article distributed under the terms and conditions of the Creative Commons Attribution (CC BY) license (https://creativecommons.org/licenses/by/4.0/).