Abstract
This paper proposes a bearing fault diagnosis method based on the Dempster–Shafer evidence fusion of cloud model memberships from multi-channel data, which provides an explicable calculation process and a final result. Firstly, vibration signals from the drive end and fan end of the rolling bearing are used as dual-channel data sources to extract multi-dimensional features from time and frequency domains. Then, cloud models are employed to build models for each feature under different conditions, utilizing three digital characteristic parameters to characterize the distribution and uncertainty of features under different operating conditions. Thus, the membership degree vectors of test samples from two channels can be calculated using reference models. Subsequently, D-S evidence theory is applied to fuse membership degree vectors of the two channels, effectively enhancing the robustness and accuracy of the diagnosis. Experiments are conducted on the rolling bearing fault dataset from Case Western Reserve University. Results demonstrate that the proposed method achieves an accuracy of 96.32% using evidence fusion of the drive-end and fan-end data, which is obviously higher than that seen in preliminary single-channel diagnosis. Meanwhile, the final results can give suggestions of the possibilities of anther, which is benefit for technicists seeking to investigate the actual situation.
1. Introduction
With the development of intelligent manufacturing, the operating status of rolling bearings, as critical components in rotating machinery, directly affects the stability and safety of the entire system. As one of the most critical and failure-prone components in rotating machinery, rolling bearings play a vital role in ensuring the stability and safety of the entire system [1]. However, under prolonged high-load operating conditions, rolling bearings are highly susceptible to faults, such as inner race faults, outer race faults, and rolling element faults. If not diagnosed and maintained in a timely manner, these failures can lead to severe equipment damage or even major safety incidents [2]. Nowadays, except conventional steel ball bearings, hybrid ceramic bearings and full ceramic bearings are also widely used in various fields for their long service life [3]. No matter the kind of bearing used, a condition monitoring system is needed to identify the bearing health state in real time. Commonly used sensing techniques include vibration sensors [4], acoustic emission sensors [5], thermal sensors [6], magnetic sensors [7,8], and so on. Meanwhile, a current monitoring system usually makes use of several same types of sensor or different types of sensor together to collect signals from different installation sites or different physical mechanisms for better judgment of the working state [9]. Therefore, the research of multi-channel fusion methods for rolling bearings holds significant theoretical importance and engineering application value [10].
Multi-sensor fusion-based diagnosis has attracted growing attention, and can be divided into data, feature, and decision fusion according to different fusion stages [11,12]. Data-level fusion provides the most complete information but suffers from synchronization and noise sensitivity issues. Feature-level fusion reduces computational cost and enables compatibility across heterogeneous sensors. Decision-level fusion integrates the independent diagnostic outcomes of different sensors and is widely adopted in practice due to its low data requirements, strong fault tolerance, and ease of integration with existing systems [13]. Representative strategies at this level include weighted voting, Bayesian inference, fuzzy logic, and D-S evidence theory.
In multi-sensor information fusion, decision-level fusion is a widely adopted strategy that integrates features independently extracted from multiple channels, thereby enhancing prediction accuracy and robustness. Depending on the algorithmic framework, decision-level fusion can be categorized into deep learning-based, traditional machine learning-based, and evidence theory-based methods [14]. Deep learning-based approaches have demonstrated substantial effectiveness across diverse applications. Reference [15] employs Siamese Neural Networks (SNNs) to extract fault features, utilizes a multi-stage training strategy to address training stagnation and small sample issues, and develops a multi-source feature fusion network to integrate multi-sensor data for enhanced diagnostic accuracy. Niu et al. [16] proposed a multi-task bearing fault diagnosis method based on a deep residual convolutional neural network by integrating domain knowledge, incorporating attention modules, and implementing information fusion, which significantly enhanced diagnostic accuracy and training efficiency. Wang et al. [17] combined multi-channel feature fusion with variational inference to generate interpretable latent representations, which were then fed into a regression module for robust prediction. These studies indicate that multi-channel decision-level fusion effectively integrates heterogeneous features, improving both accuracy and interpretability. Traditional machine learning-based strategies also benefit from multi-channel feature fusion. For instance, Song et al. proposes a multi-sensor data fusion classification method based on improved linear discriminant analysis (LDA), which extracts the fluctuations detrended of two single-axis accelerometers using local fit of vibration signals [18]. In multi-sensor health assessment, wavelet packet analysis transforms stress wave signals into energy features, PCA extracts feature vectors, and a genetic algorithm-optimized SVM classifier identifies damage types, with decision-level evidence fusion consolidating results across sensors to achieve efficient and accurate diagnosis [19]. It selects an optimal CNN for feature extraction, applies manifold learning for dimensionality reduction, and uses heuristic optimization for hyperparameter tuning. A decision fusion-based accuracy method enhances robustness. Experiments show up to 20% higher accuracy than other methods, proving practical utility in noisy environments [20]. Evidence theory-based approaches, particularly Dempster–Shafer (D-S) theory and its extensions, are widely applied in multi-source information fusion. For example, in gear fault diagnosis, vibration signals were converted into images via symmetric dot patterns (SDP) and analyzed using a VGG16 network, with D-S evidence fusion at the decision level achieving 99.99% accuracy [21]. Other studies propose a D-S evidence theory-based decision fusion model, CNN-ELMNet, which achieves a high accuracy rate of 99.29% in bearing fault diagnosis for induction motors. By fusing cross-modal outputs from vibration and current signals and optimizing the ELM classifier, it effectively addresses the challenges of multi-source noise and modal differences [22].This method addresses few-shot fault diagnosis via transfer learning and data fusion: signals are converted into 2D images, multi-sensor features are fused using GANs, and a D-S evidence theory-driven DB-DSC Classifier performs decision fusion, achieving 93% accuracy in bearing gear diagnosis while enhancing robustness and stability [23]. Furthermore, a novel fault diagnosis method for rolling bearings is proposed, combining SVM and improved D-S evidence theory. It involves feature-level fusion to create multidimensional feature vectors from multiple sensors, and decision-level fusion using D-S theory to integrate SVM outputs. Experimental results show superior accuracy, reduced uncertainty, and enhanced robustness compared to single-sensor methods [24].
Existing multi-channel decision-level fusion methods based on data still exhibit limitations in feature representation and evidence integration, such as relying on a large amount of data for training, default feature linear normalization, and modeling process with poor interpretability. Considering the above issues, this paper proposes a multi-channel rolling bearing fault diagnosis method based on the integration of cloud model digital characteristics and D-S evidence theory. The main contributions of this article can be summarized as follows:
- (1)
- This article provides an evidence generation method by using a cloud mode algorithm, which transforms features of test signal directly into probabilities of belonging to the related categories, i.e., membership degree. This operation leaves out the normalization process and avoids linear normalization.
- (2)
- Sets of reference cloud models for each feature of every state were built to reflect the distribution characteristics under the corresponding state and feature. Using the reference cloud models, a probabilities matrix of a test signal can be obtained by feeding the features into the cloud models. Then, calculating the mean value of this matrix along the direction of features, a vector can be obtained, the element of which represents the possibilities of belonging to every condition. Then, the possibilities vector of every channel provide the evidence used for DS fusion.
Seen from above, our method has the following advantages:
- (1)
- No training process and easy calculation: Instead of training, we calculated a set of cloud models to represent the distribution properties for every feature under each condition.
- (2)
- No normalization process: Different from other data-driven methods, the features can be directly transformed into a membership degree within 0~1.
- (3)
- Explainable process and results: Throughout the whole process, all the values, including final results, have physical significance and are explainable, which is meaningful for the engineers in terms of confirming faults and finding out the reason for them.
The rest of this paper is organized as follows. Section 2 reviews the related theoretical foundations, with emphasis on the principles of the cloud model and the D-S evidence theory that support the proposed framework. Section 3 introduces the fault diagnosis methodology based on the integration of the cloud model and D-S evidence fusion, highlighting both the modeling procedure and the fusion mechanism. Section 4 presents the experimental results and provides a detailed analysis to verify the effectiveness and robustness of the proposed approach. Finally, Section 5 concludes the paper with a summary of the main findings and suggestions for future research.
2. Related Theoretical Foundations
2.1. Cloud Model Theory
A cloud model combines fuzzy mathematical theory and probability theory, which can comprehensively describe the randomness and fuzziness of concepts and realize the uncertainty transformation between qualitative and quantitative concepts [25]. The cloud model cannot only be regarded as a generalized distribution with weak constraints; it also avoids the negative impact of the defects of fuzzy sets on the degree of affiliation of quantitative elements, and is often used in the task of complex knowledge representation. The overall quantitative nature of a concept is characterized by the following three numerical features:
Expectation is equivalent to the expected value rank-squared estimate in statistical theory, reflecting the expected value of the spatial distribution of the thesis domain, i.e., the spatial distribution of the center of gravity of the cloud droplets.
Entropy corresponds to the variance of the likelihood distribution in statistical theory, reflecting the range of cloud drops accepted by the qualitative concepts in the domain space.
Hyper-entropy corresponds to the hyperparameters in statistical theory and is a measure of uncertainty in entropy.
The normal distribution, as a widely existing model in nature, can be integrated with the cloud model to compute membership degrees . According to the above definition, if the following two conditions are satisfied, the distribution of over the discourse domain U is referred to as a normal cloud distribution.
- (1)
- , where ;
- (2)
- The membership degree of belong to the concept is defined as
2.1.1. Backward Cloud Generator
The model that establishes the uncertain transformation between numerical values and qualitative concepts is called the Backward Cloud Generator, as shown in Figure 1.
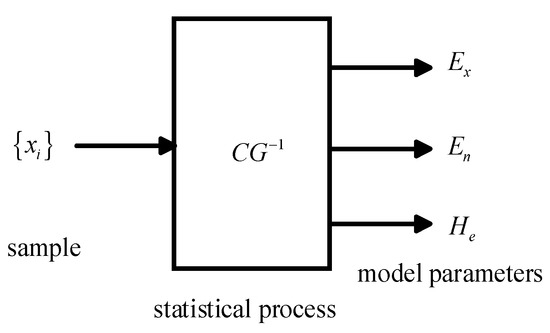
Figure 1.
Backward cloud generator.
The inverse cloud generator represents the numerical sample space by three features of the cloud model. Therefore, for a given set of samples , the inverse cloud generator is the process of obtaining the parameters of the sample set , which is calculated as follows:
- 1.
- Expectation of the sample
- 2.
- Cloud model feature entropy of the sample
- 3.
- Hyper-entropy of the samplewhere is the second-order central moment of the sample, which is calculated as follows:
2.1.2. Forward Cloud Generator
The forward cloud generator completes the transformation from qualitative to quantitative, and it generates cloud droplets and their corresponding membership degree according to the numerical characteristics of the cloud. The forward cloud generator is shown in Figure 2.
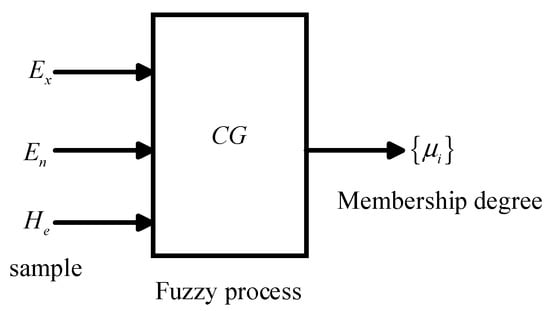
Figure 2.
Forward cloud generator.
The algorithm of forward cloud generator is as follows:
Inputs: numerical characteristics of cloud , , and , and N- the number of cloud droplets to be generated.
Outputs: N cloud droplets and their membership degree .
The algorithm is as follows:
- 1.
- Generate a normal random number with as the mean and as the standard deviation;
- 2.
- Generate a normal random number with as the mean and as the standard deviation;
- 3.
- Calculate the membership degree:
In the formula, is the membership degree of the cloud droplet in the universe of discourse U.
- 4.
- Repeat Steps (1)~(3) until the required N cloud drops are generated.
Through the above process, N cloud drops can be generated, and a typical cloud cluster is illustrated in Figure 3. Analyzing the visual appearance of the two cloud diagrams a and b in Figure 3, the eigenvalues are the same, different , or different . Among them, the cloud droplets in Figure 3b take a wider range of values, and the deterministic distribution of Figure 3b is “thicker” than that of Figure 3a.
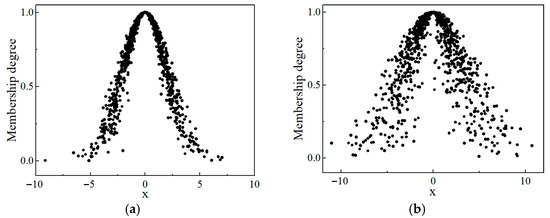
Figure 3.
Cloud model diagram for different eigenvalues: (a) = 0, = 2, = 0.3; (b) = 0, = 3, = 1.
2.2. Dempster–Shafer Evidence Theory
D-S evidence theory is a theory of imprecise reasoning that can transform propositions into mathematical sets for analysis. Assuming that there is a problem that needs to be judged, if all the consequences that can be caused by a specific event can be exhaustively listed, it is denoted as set Θ. In D-S evidence theory, Θ is called the identification framework, and the elements in Θ are finite and incompatible with each other; m(A) is called the basic probability assignment function (BPA) of A [12,13,14,15,16].
Within the recognition framework Θ, the belief assigned to the empty set is zero, and the sum of the belief values of all subsets A must equal one. Subset A can be a single element or contain multiple elements.
In D-S theory, the belief function (Bel) and plausibility function (Pl) are two fundamental concepts. The Pl(A) measures the possibility that a proposition is not necessarily false; that is, it represents the highest probability that the proposition is true under conditions of uncertainty. The function assigns each event a probability representing the level of trust in the event, which represents the degree to which the evidence supports the event, where m() represents the uncertainty of the evidence. Confidence interval A is introduced to more accurately reflect the level of trust in occurrences. It is made up of two functions, Bel and Pl, and has the following expression:
The function of trust Bel(A) reflects the level of support for the event A, and Pl(A), which measures the level of acceptability for the event A, represents the level of uncertainty. Figure 4 depicts their relationship with one another.
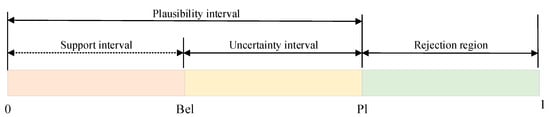
Figure 4.
Illustration of the uncertainty representation of a proposition.
For the traditional D-S evidence theory, when there is evidence from n different information sources, the D-S combination rule is shown in Formula (10), and the normalization factor K is shown in Formula (11).
Herein, k = 1 − K is defined as the conflict factor, where k ranges between [0, 1] and is used to quantify the conflict intensity between different pieces of evidence. If k is small, it indicates that the pieces of evidence are relatively consistent; conversely, if k is large, it means there is significant conflict between the pieces of evidence.
3. Fault Diagnosis Method Based on Cloud Model and D-S Evidence Fusion
This paper proposes a fault diagnosis method based on the fusion of cloud model and D-S evidence theory, which leverages the advantages of cloud models in representing uncertainty and the capability of D-S theory in handling multi-source information fusion, thereby establishing a complete diagnostic framework from feature extraction to decision-level fusion. The overall process is illustrated in Figure 5, which can be divided into three parts, modeling, evidence generation, and fusion.
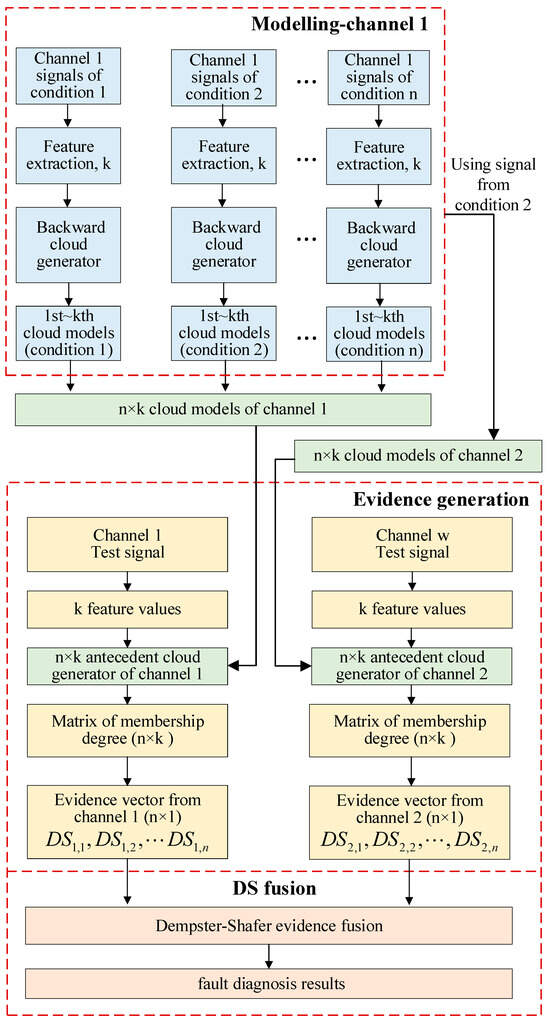
Figure 5.
Flowchart of the fault diagnosis method.
In the modeling stage, modeling signals from channel 1 and channel 2 are firstly utilized for feature extraction. Then, the extracted features are employed to construct cloud models, which serve as reference standards for the subsequent membership degree calculation of testing samples. In the evidence generation stage, features are extracted using testing samples obtained from both accelerometers. Then, the extracted features are input into the previously established cloud models to calculate their membership degrees with respect to various features under different modes, thereby generating evidential information from the two sensors. Finally, the evidence from multiple sensors is fused using the Dempster–Shafer evidence theory; thus, the final fault diagnosis results can be obtained.
3.1. Feature Extraction and Preprocessing
During the diagnosis process, the raw vibration signals are first segmented into segments of fixed length. Subsequently, multidimensional statistical features are extracted from each segment to form the input feature space. The selected features cover both time–domain and frequency–domain indicators, ensuring a comprehensive reflection of fault state variations. The specific feature parameters are listed in Table 1.

Table 1.
Feature parameters.
3.2. Construction of Cloud Model Using Backward Cloud Generator
For each fault category, several initial segments are selected as modeling samples to calculate the cloud model parameters of the features, obtaining the , , and for each feature dimension. For a specific feature sequence , its cloud model parameters , , and can be obtained using the backward cloud generator introduced before to describe the uncertain probabilistic distribution of the related fault type in its feature space. So that, seen as Figure 5, as to each fault type and each channel, a set of cloud models can be obtained, the number of which equals to the number of extracted feature types.
3.3. Membership Degree Calculation
Given a quantitative sample with a specific value in the quantitative domain, the process of generating the certainty degree that this value belongs to a qualitative concept is called the antecedent cloud generator. This method can be used to determine the membership degree of test data to a certain qualitative description. The diagram of the antecedent cloud generator is shown in Figure 6.

Figure 6.
Antecedent cloud generator.
Given a known cloud model and a sample , the membership degree of in the cloud model can be computed by treating as a cloud drop. The procedure is as follows [25]:
- 1.
- Generate a Gaussian random number with expectation and variance
- 2.
- Calculate the membership degree using the following formula:
In the formula, represents the membership degree of to the cloud model. It can be seen that, compared to the forward cloud generator, the antecedent cloud generator omits Step (2) of the forward generation process.
Using the above antecedent cloud generator, the membership degree of a sample belonging to cloud can be obtained. When the membership degree is high, the probability that the sample belongs to the qualitative concept is greater. Conversely, a lower membership degree indicates a lower likelihood of the sample being associated with . Therefore, this method can be used for the classification of test data.
3.4. D-S Evidence Fusion Strategy
D-S evidence theory is an inference method based on belief functions that enables decision support under incomplete information. It is particularly suitable for multi-source information fusion and uncertainty modeling scenarios. The channels, respectively, output membership degree vectors corresponding to each fault category. These results serve as sources of evidence and are input into the D-S fusion framework. The principle of two channels fusion is illustrated in Figure 7.
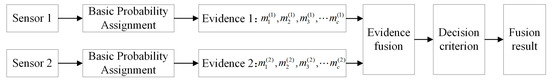
Figure 7.
D-S evidence theory framework.
The fusion process mainly includes the following steps:
- 1.
- BPA Construction: Normalize the membership degree vector of each channel so that the sum equals 1 and treat it as the BPA of that channel for each fault category. Let means the confidence calculated by cloud model corresponding to i-th category (i = 1, 2, …, c, c it the total possible fault category number) and k channel. The confidence vector of channel k can be expressed as followThe corresponding BPA expression is
- 2.
- D-S Combination Rule: For the same test sample, the BPAs from multiple channels are jointly fused using Dempster’s combination formula. The fusion rule for two pieces of evidence m1 and m2 can be implemented according to Equation (10):
- 3.
- Diagnosis Decision: The fused belief vector represents the degree of support for each fault category of the current test sample. The category with the highest belief value is selected as the final diagnostic result for the sample.
4. Experiment Results and Analysis
This study uses the standard rolling bearing fault dataset provided by the Case Western Reserve University (CWRU) Bearing Data Center [26]. This dataset covers a variety of typical fault states and sets multiple fault levels for different fault locations, which is a widely used public dataset in the field of mechanical equipment fault diagnosis. The data used were collected from the drive end (DE) and fan end (FE) under the sampling rate of 12 kHz. Considering the long-duration continuous sampling nature of the vibration signals, each data file was segmented into 58 sample segments, with each segment containing 2048 points. The frequency spectrum for each segment was estimated using the Fast Fourier Transform (FFT) with this fixed number of points (N = 2048), from which the frequency–domain features were calculated. Each segment serves as an independent analysis unit, facilitating subsequent feature extraction and modeling. The specific fault category codes are listed in Table 2 below:
Table 2.
Specific fault codes.
4.1. Analysis of Feature Extraction Results
In fields such as fault diagnosis, accurately extracting and analyzing features is crucial for identifying system states and diagnosing faults. In the preliminary work, we extracted 12 key features from the signals. To more intuitively display the data distribution of these features under different operating conditions or states, and to analyze their dispersion, their central tendency, and the presence of outliers, we used boxplots as an effective visualization tool. The specific boxplots are shown in Figure 8.
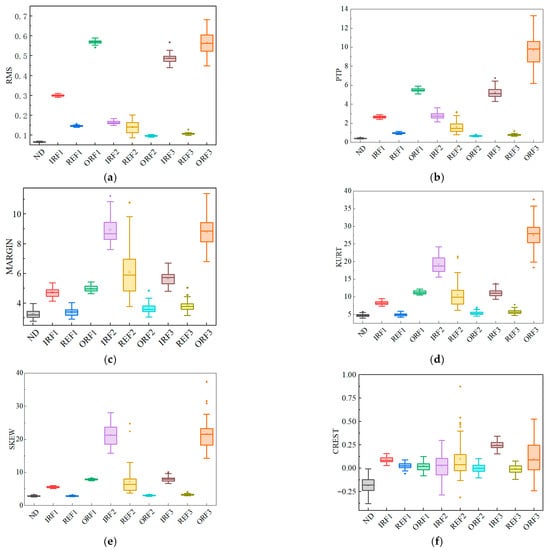
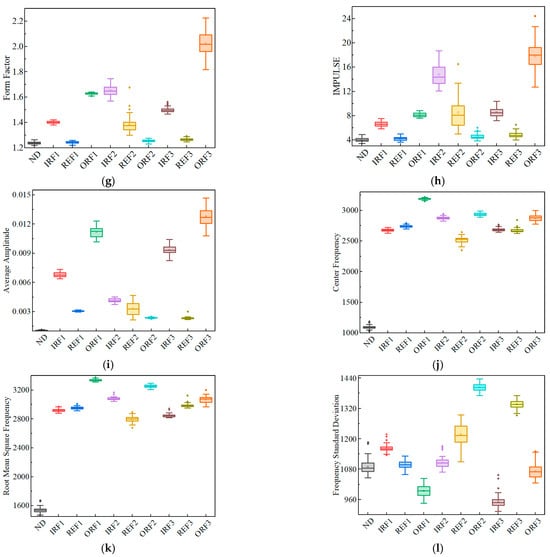
Figure 8.
Feature distribution under different states: (a) RMS; (b) PTP; (c) MARGIN; (d) KURT; (e) SKEW; (f) CREST; (g) Form Factor; (h) IMPULSE; (i) Average Amplitude; (j) Center Frequency; (k) Root Mean Square Frequency; (l) Frequency Standard Deviation.
The boxplot analysis of the 12 features reveals distinct distribution patterns across different operating conditions. Under normal operation, features are concentrated with minimal variability, whereas fault conditions exhibit widened distributions and numerous outliers, reflecting strong dispersion induced by fault excitations. Specifically, outer-ring faults show pronounced changes in impact- and Form Factor-related features such as PTP, CREST, and Form Factor; inner-ring faults are sensitive to higher-order statistical features such as KURT and SKEW; and rolling element faults display marked differences in MARGIN and IMPULSE features. Overall, PTP, KURT, and MARGIN provide high fault discriminability, while Center Frequency and Root Mean Square Frequency are partially redundant. These insights inform subsequent feature selection and support improved classification accuracy in fault diagnosis models.
4.2. Reference-End Modeling
To further investigate the differences between channels, we selected four representative features—RMS, PTP, KURT, and Frequency Standard Deviation (f4)—for in-depth analysis through dual-channel comparison plots and cloud charts, as shown in Figure 9.
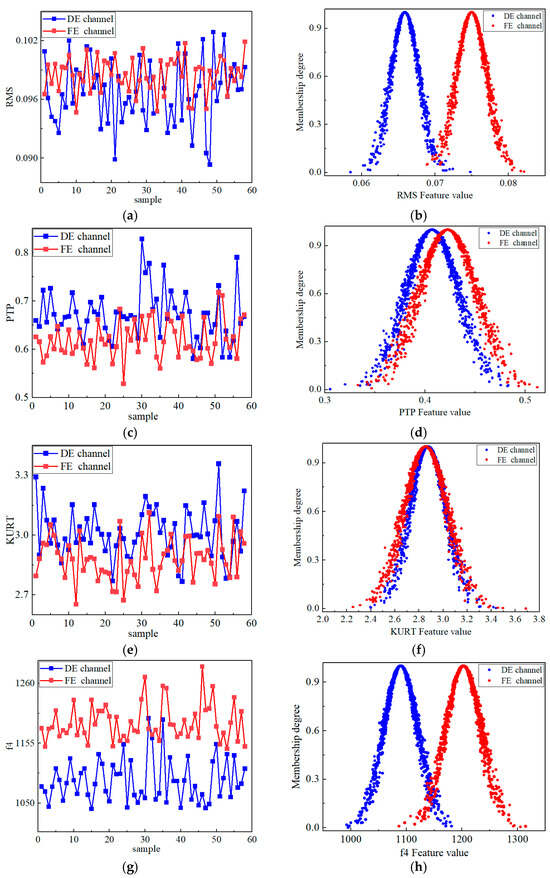
Figure 9.
Comparison between DE and FE channels: (a) DE vs. FE RMS comparison; (b) RMS cloud plot; (c) PTP comparison; (d) PTP cloud plot; (e) KURT comparison; (f) KURT cloud plot; (g) f4 Comparison; (h) f4 cloud plot.
The two channels exhibit overall level differences in RMS and f4, with the FE channel generally showing higher values. In contrast, PTP and KURT display interleaved and complex fluctuations, reflecting differing sensitivities to impact and non-Gaussian characteristics. Cloud plot analysis further reveals that the distributions of the two channels are clearly separated in RMS and f4, whereas in PTP and KURT they partially overlap but still exhibit subtle differences. Overall, both line plots and cloud plots indicate that the two channels respond differently in terms of energy, impact, and frequency features, providing a multi-dimensional basis for state identification.
To gain a deeper understanding of the distribution characteristics and intrinsic relationships of the same feature under different states within the same channel, cloud model diagrams for one time–domain feature and one frequency–domain feature across different states of the same channel will be plotted, as shown in Figure 10.
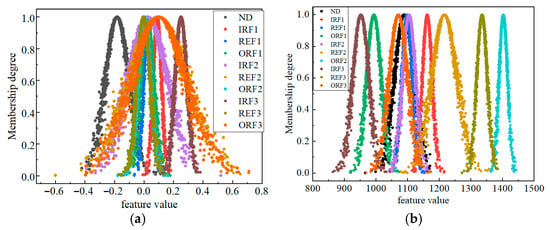
Figure 10.
Cloud model of DE channel features under 10 states: (a) CREST feature; (b) f4 feature.
This method intuitively reflects the membership distribution, aggregation, and dispersion differences of feature values under different states, enabling the more precise characterization of subtle changes during state evolution. Visualization through the cloud model provides a clear and direct basis for feature sensitivity analysis and the improvement of fault diagnosis accuracy.
4.3. Membership Calculation
As mentioned before, this study selects the first 20 signal segments of each fault type as modeling samples. From these, 12-dimensional typical time–frequency domain features are extracted, and the corresponding cloud model numerical parameters—, , and —are calculated. The remaining samples are used as the test set and input into the constructed cloud model classifier. Classification decisions are made based on the membership degrees of the samples to each cloud model. To verify the applicability of the proposed method at different measurement locations, independent experiments are conducted using test data from both the DE channel and the FE channel.
We extracted the confidence results of all DE channel test samples under the 10 fault models and constructed a confidence matrix. Table 3 illustrates a confidence matrix of an example from DE channel under condition 1. Each row corresponds to a fault state and each column corresponds to a feature, and the values represent the possibilities that the corresponding features belong to specific fault state. Seen from the table, the values belong to ND have the highest or the second highest values (features 3~5 and 7~8) at each column. Then, the membership degree of the sample for each fault category is calculated using the average confidence of the features under that category, according to the membership degree inference process described in Section 3.3.
Table 3.
Membership degree vector derivation based on average confidence of features.
Table 4 lists the membership degree results of ten test samples selected from each fault state. Each column in the matrix represents a test sample, each row corresponds to a fault category, and the values reflect the degree of matching between the sample and the corresponding fault model—that is, the membership degree in that category. In Table 4, the vector of sample 1 is the average along the rows of the matrix listed in Table 3.
Table 4.
Membership degree vectors of 10 test samples from DE channel.
According to the maximum membership degree principle, fault categories of the test samples were determined, and the classification results were counted to construct a confusion matrix for the further evaluation of diagnostic performance. Figure 11 shows the confusion matrix of classification results based on the cloud model for the DE channel. It can be seen that the highlighted values on the diagonal represent the majority of correctly classified samples, indicating effective differentiation among fault categories. The overall classification accuracy reaches 94.74%, verifying the excellent performance of the proposed cloud model method in single-channel fault diagnosis.
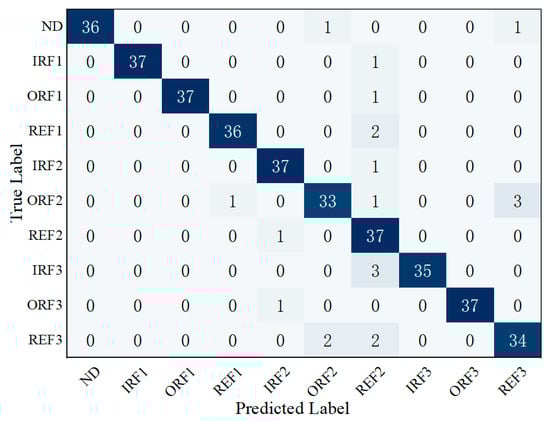
Figure 11.
Confusion matrix of fault diagnosis for the DE channel.
For the FE channel, after the same modeling process, the confidence matrix of test samples can be constructed and its corresponding membership degree vector can be obtained after average operation. Table 5 presents the membership degree vectors of these FE channel test samples in various fault category models, where the samples correspond to the DE channel samples listed in Table 3 (sampled at the same time).
Table 5.
Membership degree vectors of 10 test samples from FE channel.
Based on the maximum membership degree principle, fault categories of the FE channel test samples were determined, and classification results were compiled to construct a confusion matrix. Figure 12 shows the confusion matrix of the cloud model classification results for the FE channel. Overall, the classification accuracy for the FE channel is 83.16%. Although the overall performance is inferior to that of the DE channel, it still achieves a certain level of recognition for most fault categories.
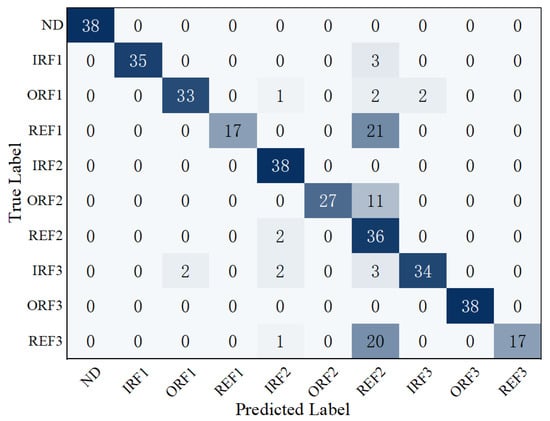
Figure 12.
Confusion matrix of fault diagnosis for the FE channel.
The single-channel fault diagnosis method based on the cloud model effectively addresses the feature uncertainty under complex operating conditions of rolling bearings, achieving a relatively high diagnostic accuracy. However, feature overlap among certain fault categories limits the recognition accuracy. The following section will introduce our multi-channel data fusion approach, employing D-S evidence theory to realize information complementarity and fusion, thereby enhancing the overall robustness and accuracy of the diagnostic system.
4.4. Direct Average Vector Fusion Comparative Analysis
To comprehensively evaluate the performance of different fusion strategies, this section introduces direct average vector fusion as a benchmark for comparison. This method performs the arithmetic averaging of the output confidence vectors from the DE and FE channels, representing a simple and intuitive decision-level fusion strategy. The mathematical formulation is as follows:
Let and denote the confidence values of the DE and FE channels for fault category , respectively. The fused confidence vector after direct averaging is given as follows:
This equation aims to combine evidence from both channels, mitigating individual sensor uncertainties while preserving diagnostic features. The weighted average approach is computationally efficient but may struggle with high-conflict scenarios. Table 6 displays the resulting membership degrees after applying Equation (15) to DE and FE channel data. The table includes rows for each fault state and columns for samples (Sample 1 to Sample 10), with values representing the fused membership degrees.
Table 6.
Confidence distribution of directly averaged vector fusion.
This comparative analysis demonstrates that direct average vector fusion achieves 85% diagnostic accuracy while maintaining high computational efficiency, establishing it as a practical baseline for multi-channel information integration. However, its fundamental limitations in resolving evidence conflicts and quantifying uncertainty restrict applicability in high-precision scenarios such as safety-critical fault diagnosis, where misaligned sensor evidence or ambiguous feature representations may degrade reliability.
4.5. Multi-Source Confidence Information D-S Fusion Process and Results
To further improve the accuracy and robustness of rolling bearing fault diagnosis, D-S evidence theory is introduced to fuse confidence information from different channels. D-S evidence theory possesses strong capabilities in handling uncertainty and can effectively combine conflicting information sources to enhance the overall decision-making performance of the system.
4.5.1. Conversion from Membership Degree to Evidence
Before performing multi-source information fusion, it is necessary to convert the membership degrees obtained from the cloud models from the DE and FE channels into BPA suitable for D-S evidence theory fusion. D-S evidence theory requires each piece of evidence to be represented as a set of probability assignments that satisfy the normalization condition, meaning their sum equals 1. Therefore, the original confidence matrix must be normalized to ensure it conforms to the basic form of BPA. Let the membership vector of the -th test sample in a certain channel be denoted as
where c represents the total number of fault categories, and denotes the membership degree of sample under the -th fault model, with values ranging from [0, 1]. To satisfy the definition requirements of BPA in D-S theory, each element in needs to be normalized as follows:
where represents the BPA value of sample under the -th fault state. The normalized confidence values not only ensure that the sum equals 1 but also preserve the relative strengths among different confidence levels, thereby maintaining the decision information of the diagnostic model during the subsequent D-S fusion process.
This normalization process is carried out independently for both the DE and FE channels, ultimately resulting in two sets of c × 1 BPA matrices, denoted as
where c represents the total number of fault categories. To more intuitively illustrate the process of converting confidence values into BPA, this paper selects the prediction results of Sample 1 from Table 4 and Table 5 as an example. The original confidence values and the corresponding normalized BPA values under both the DE and FE channels are listed in Table 7. The normalized BPA values preserve the original proportional distribution while ensuring that their sum equals exactly 1. This meets the input requirements of D-S evidence theory.
Table 7.
Comparison of confidence values and BPA in DE and FE channels.
The normalized BPA matrices serve as the fundamental input for the subsequent D-S fusion process, enabling the combination and integration of multi-channel information for decision-making.
4.5.2. Dual-Channel D-S Evidence Fusion
To achieve collaborative decision-making with multi-channel information, the D-S evidence theory is applied to fuse the BPAs obtained from the DE and FE channels. The core idea is to strengthen consistent evidence and suppress conflicting evidence, thereby enhancing the reliability of multi-source diagnosis.
Assume that, for a given test sample, the BPA vectors from the DE and FE channels are, respectively, denoted as and , with each element expressed as
where represents the -th fault category, and c is the total number of categories, which equals 10 in the experiment. According to the combination rule in D-S theory, the fused BPA from the two evidence sources is given by:
Here, K represents the conflict coefficient, which measures the degree of inconsistency between the two evidence sources. If K is close to 0, it indicates high agreement between the evidence; otherwise, a strong conflict exists, making direct combination unsuitable.
Taking the normalized DE and FE channel evidence in Table 6 as an example, the D-S evidence fusion process is demonstrated. First, according to Equation (20), the evidence from the two channels is cross-combined to obtain a c × c fused evidence matrix, as shown in Table 8. This matrix comprehensively reflects the joint support level of the two channels across all categories, where the diagonal elements indicate the consistency of support between the two channels for the same fault category. The larger the diagonal values, the higher the consistency of evidence between the DE and FE channels for that category, and thus the greater the credibility.
Table 8.
Intermediate matrix of two-channel evidence fusion.
Then, the conflict coefficient K is calculated according to Equation (21). Subsequently, following Equation (22), the elements of the cross-combined matrix are normalized and summed to obtain the final fused belief m(A) for each state, representing the system’s overall support for each condition. The fused evidence m can be expressed as follows:
Each element represents the system’s combined confidence level for a specific fault category—the larger the value, the stronger the system’s inclination toward that classification. This fusion strategy effectively leverages the complementarity of multi-channel information without increasing system complexity, significantly reducing the risk of misclassification caused by uncertainties in a single channel and enhancing the overall diagnostic capability of the system.
Following the above steps, fusion processing is performed sequentially on the remaining test samples, yielding the fused confidence distribution for each sample across the ten fault categories. For clarity and analysis, Table 9 presents the fused confidence distributions of selected typical test samples corresponding to those in Table 4 and Table 5. Each column corresponds to the fused confidence distribution of a sample over all fault categories, and each row corresponds to the related specific fault type. The final classification output is determined by selecting the category with the highest confidence value.
Table 9.
Belief degrees of partial samples after D-S evidence fusion.
4.5.3. Experimental Results and Performance Comparison
Figure 13 presents the confusion matrix obtained using the D-S evidence fusion method and selecting the category with the highest confidence value as decision result. Overall, the majority of classes show high values along the diagonal, and the total accuracy reaches 96.32%, demonstrating that D-S fusion effectively enhances classification performance. Nevertheless, misclassifications persist in certain classes; for instance, one ORF1 sample is misclassified as REF2, three ORF2 samples are incorrectly classified, and a few REF1 samples are confused. These results indicate that, while the fusion strategy improves overall recognition to a high level of accuracy, further optimization is needed for classes with similar feature characteristics to address residual errors and achieve even higher robustness.
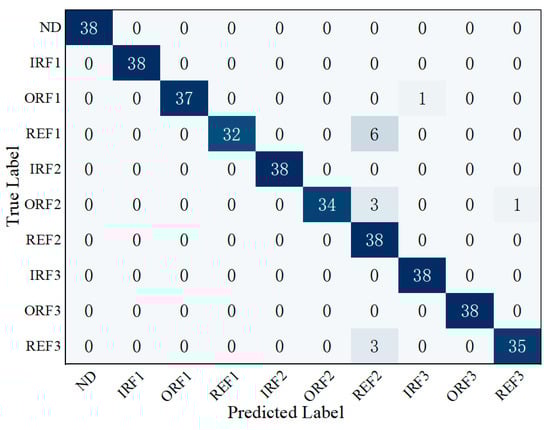
Figure 13.
Confusion matrix of the fusion system.
To analyze the cause of misclassification, a typical erroneous sample’s fused evidence vector is examined as shown in Equation (24). The true label of this sample is REF1, but it is misclassified as REF2. The evidence values for REF1 and REF2 are 0.28 and 0.32, respectively, with close magnitudes and REF2 slightly higher, leading to the incorrect decision. Evidence values for the remaining classes are considerably lower, indicating that the error mainly occurs between these two highly similar categories. Although the final decision is incorrect, the evidence value of REF1 remains relatively high, suggesting that its class information is still partially preserved in the fusion result, which is useful for further examination.
4.6. Comparison with Other Datasets
To comprehensively evaluate the generalization performance and robustness of the proposed method, this study conducted systematic comparative experiments on the Paderborn Bearing Dataset. The Paderborn dataset [27] is widely recognized as a benchmark in the field of bearing fault diagnosis, developed by Paderborn University in Germany. It provides rich fault types, operational conditions, and sensor data, effectively validating the applicability of diagnostic methods in real industrial scenarios. This section elaborates on the experimental design and result analysis on the Paderborn dataset, providing a comprehensive assessment of the cross-dataset performance of the cloud model and D-S evidence fusion-based method.
To ensure the reliability and comparability of experimental results, the same experimental procedures and parameter settings used for the CWRU dataset were replicated on the Paderborn dataset. Overall, 16 types of bearing conditions were utilized, including healthy state K001, outer race fault KA03, inner race adding outer race fault KB24, and inner race fault KI16 (each has 4 working conditions). And, using distance return map analysis, (separation distance threshold value 0.7) was applied, thus 9 features were selected for current signals, and 15 features for vibration signals. During the data preprocessing, raw vibration and current signals were segmented with each segment maintaining 2048 points. Thus, 125 samples were generated for each state. Then, a randomized sampling strategy was implemented, which randomly selected 88 samples from each fault state for modeling, and 37 for testing. The random process was repeated 20 times. Experimental results in Table 10 show that the method achieved an average accuracy rate of 88.76% on the Paderborn dataset.
Table 10.
Performances of single channel classification and multi-channel fusion classification using Paderborn dataset.
As to CWRU dataset, to validate the robustness of the model against training data variability, a randomized sampling strategy was implemented, which random selected 20 samples from each fault state for modeling and 38 for testing. Table 11 presents the accuracy results of various sensor channels and their fusion on the datasets. Statistical analysis revealed a mean recognition accuracy of 96.52% for the CWRU dataset.
Table 11.
Performance Comparison between CWRU and Paderborn dataset.
From the experimental results of the CWRU dataset, it can be seen that the performance of single-sensor channels shows significant differences. Fusion effectively achieves redundancy verification and conflict handling, reduces the false alarm rate, and enhances the model’s stability under varying operating conditions. Secondly, the experimental results of the Paderborn dataset further confirm the value of the fusion strategy in challenging environments. Through multi-sensor fusion, the accuracy is significantly improved to 88.76%.
This experiment validates the efficiency of the proposed multi-sensor fusion method in bearing fault diagnosis. The results on both CWRU and Paderborn datasets consistently show that the fusion strategy significantly improves accuracy and enhances robustness. This provides a reliable solution for industrial intelligent maintenance, supporting high-precision diagnosis in complex environments.
5. Conclusions
This paper proposes a multi-source information fusion fault diagnosis method combining cloud model and D-S evidence theory. By extracting comprehensive time–domain and frequency–domain features from vibration signals, a set of multi-dimensional cloud model covering 10 typical fault states is established, effectively modeling the uncertainty and fuzziness of mechanical vibration signals, overcoming the limitations of traditional deterministic models under complex working conditions.
This study designs a multi-source fault evidence acquisition and fusion mechanism based on dual channels from the DE and FE. Using D-S evidence theory, the diagnostic results from both channels are comprehensively reasoned, achieving collaborative utilization of multi-channel information. Through normalization and the Dempster’s combination rule, membership vectors from each channel are converted into BPA, which are then fused to generate more accurate and robust fault decisions. Experimental results show that the proposed method significantly outperforms single-channel diagnosis in terms of classification accuracy and diagnostic robustness. The accuracy improves from 83.16% and 94.74% for single FE and DE channels, respectively, to 96.52% after fusion.
The proposed method demonstrates several advantages, including fast computational speed, high diagnostic accuracy, and strong interpretability. However, its performance in identifying certain transitional states is limited, and it remains influenced by manual feature selection. Firstly, this effect of this method relies on whether the extracted features are sensitive to different fault types. So, this method is influenced by manual experience. Because of mean operation when transforming the possibility matrix into evidence vectors, the identify effects will decrease if more features are nonsensitive to faults. Secondly, this method cannot be used to identify the transition stage, which is also the problem of most data-driven methods. Future research will focus on enhancing the model’s adaptability to complex transitional conditions, reducing dependence on manual feature engineering, and incorporating more adaptive feature screening strategy. In addition, validation in real industrial scenarios will be pursued to further improve the method’s generalizability and practical applicability.
Author Contributions
Conceptualization, methodology, and data curation, L.L., P.W. and X.Z.; validation, formal analysis, visualization, and investigation, X.Z.; writing—original draft preparation, L.L., X.Z. and P.W.; writing—review and editing, L.L., X.Z. and P.W.; supervision, T.M. and S.G.; project administration and funding acquisition, C.C. and S.G. All authors have read and agreed to the published version of the manuscript.
Funding
This work was funded by the National Natural Science Foundation of China (62203345 and 62303368), the Youth Talent Support Program Project of Shaanxi Association for Science and Technology (20230107), Shaanxi Province Qin Chuangyuan scientist & engineer project (2023KXJ-151) and the Youth Innovation Team of Shaanxi Universities (2023997).
Institutional Review Board Statement
Not applicable.
Informed Consent Statement
Not applicable.
Data Availability Statement
The data that support the findings of this study are available from the corresponding author upon reasonable request.
Conflicts of Interest
The authors declare no conflicts of interest.
References
- Wang, Y.; Zhang, Q.; Cao, R.; Zhang, S.; Li, S.; Xu, D. The Single-channel blind source separation based on VMD and Tukey M estimation for rolling bearing composite fault diagnosis. Meas. Control 2023, 56, 1599–1612. [Google Scholar] [CrossRef]
- Zou, X.; Zhang, H.; Jiang, Z.; Zhang, K.; Xu, Y. Toward accurate extraction of bearing fault modulation characteristics with novel time–frequency modulation bispectrum and modulation Gini index analysis. Mech. Syst. Signal Process. 2024, 219, 111629. [Google Scholar] [CrossRef]
- He, D.; Li, R.; Zhu, J.; Zade, M. Data Mining Based Full Ceramic Bearing Fault Diagnostic System Using AE Sensors. IEEE Trans. Neural Netw. 2011, 22, 2022–2031. [Google Scholar] [CrossRef] [PubMed]
- Saucedo-Dorantes, J.J.; Arellano-Espitia, F.; Delgado-Prieto, M.; Osornio-Rios, R.A. Diagnosis Methodology Based on Deep Feature Learning for Fault Identification in Metallic, Hybrid and Ceramic Bearings. Sensors 2021, 21, 5832. [Google Scholar] [CrossRef]
- Wei, P.; Wang, Z.; Zheng, P.; Lv, B.; Qi, J. Online Diagnosis of Small Faults in Rolling Bearings Using FBG Acoustic Emission Sensors Inside the Accelerated Life Tester. IEEE Sens. J. 2023, 23, 2211–2219. [Google Scholar] [CrossRef]
- Mohammed, A.; Djurovic, S. In-Situ Thermal and Mechanical Fibre Optic Sensing for In-Service Electric Machinery Bearing Condition Monitoring. In Proceedings of the 2019 IEEE International Electric Machines & Drives Conference (IEMDC), San Diego, CA, USA, 12–15 May 2019; pp. 37–43. [Google Scholar]
- Wonho, J.; Seong-Hu, K.; Sung-Hyun, Y.; Jaewoong, B.; Park, Y.H. Acoustic, temperature, and motor current dataset of rotating machine under varying operating conditions for fault diagnosis. Data Brief 2023, 48, 109049. [Google Scholar] [CrossRef]
- Dempsey, P.J.; Certo, J.M.; Morales, W. Current Status of Hybrid Bearing Damage Detection. Tribol. Trans. 2005, 48, 370–376. [Google Scholar] [CrossRef]
- Gao, T.; Yang, J.; Zhang, B.; Li, Y.; Zhang, H. A fault diagnosis method based on feature-level fusion of multi-sensor information for rotating machinery. Meas. Sci. Technol. 2023, 35, 036109. [Google Scholar] [CrossRef]
- Wang, B.; Feng, G.; Huo, D.; Kang, Y. A bearing fault diagnosis method based on spectrum map information fusion and convolutional neural network. Processes 2022, 10, 1426. [Google Scholar] [CrossRef]
- Singh, P.; Singh, L.K. Improved measurement accuracy in critical parameters of safety-critical systems with multisensor data fusion. IEEE Trans. Instrum. Meas. 2021, 70, 9514508. [Google Scholar] [CrossRef]
- Zhao, X.; Luo, Q.; Han, B. Survey on robot multi-sensor information fusion technology. In Proceedings of the 2008 7th World Congress on Intelligent Control and Automation, Chongqing, China, 25–27 June 2008; pp. 5019–5023. [Google Scholar]
- Pan, Z.; Pan, X.; Jiang, F.; Guan, Y.; Meng, Z.; Wang, Y.; Zhao, P. Novel rolling bearing state classification method based on probabilistic Jensen–Shannon divergence and decision fusion. Meas. Sci. Technol. 2025, 36, 042001. [Google Scholar] [CrossRef]
- Zhou, H.; Liu, Z.; Li, T.; Chen, Y.; Huang, W.; Zhang, Z. Classification of precancerous lesions based on fusion of multiple hierarchical features. Comput. Methods Programs Biomed. 2023, 229, 107301. [Google Scholar] [CrossRef]
- Wen, C.; Xue, Y.; Liu, W.; Chen, G.; Liu, X. Bearing fault diagnosis via fusing small samples and training multi-state Siamese neural networks. Neurocomputing 2024, 576, 127355. [Google Scholar] [CrossRef]
- Niu, G.; Liu, E.; Wang, X.; Ziehl, P.; Zhang, B. Enhanced discriminate feature learning deep residual CNN for multitask bearing fault diagnosis with information fusion. IEEE Trans. Ind. Inform. 2022, 19, 762–770. [Google Scholar] [CrossRef]
- Wang, Y.; Suo, C.; Zhao, Y. A multi-channel fusion variational autoencoder-based RUL prediction approach for multi-sensor systems. Meas. Sci. Technol. 2024, 35, 116129. [Google Scholar] [CrossRef]
- Song, Q.; Zhao, S.; Wang, M. On the Accuracy of Fault Diagnosis for Rolling Element Bearings Using Improved DFA and Multi-Sensor Data Fusion Method. Sensors 2020, 20, 6465. [Google Scholar] [CrossRef]
- Yu, Y.; Dackermann, U.; Li, J.; Niederleithinger, E. Wavelet packet energy–based damage identification of wood utility poles using support vector machine multi-classifier and evidence theory. Struct. Health Monit. 2019, 18, 123–142. [Google Scholar] [CrossRef]
- Xi, R.; Xu, Y.; Wu, S.; Ji, A.; Zhao, B. Bearing fault diagnosis method based on unsupervised pseudo-labels adapted for Locality Preserving Projections. Nondestruct. Test. Eval. 2025, 1–32. [Google Scholar] [CrossRef]
- Fu, Y.; Chen, X.; Liu, Y.; Son, C.; Yang, Y. Gearbox fault diagnosis based on multi-sensor and multi-channel decision-level fusion based on SDP. Appl. Sci. 2022, 12, 7535. [Google Scholar] [CrossRef]
- Yi, L.; Huang, Y.; Zhan, J.; Wang, Y.; Sun, T.; Long, J.; Liu, J.; Chen, B. CNN-ELMNet: Fault diagnosis of induction motor bearing based on cross-modal vector fusion. Meas. Sci. Technol. 2024, 35, 115114. [Google Scholar] [CrossRef]
- Zhang, Y.; Yan, X.; Xiao, P.; Zou, J.; Hu, L. A fault diagnosis method for bearings and gears in rotating machinery based on data fusion and transfer learning. Meas. Sci. Technol. 2024, 36, 016104. [Google Scholar] [CrossRef]
- Li, X.; Wu, J.; Xia, Y.; Luo, W.; Lu, H.; Zhang, W.; Lei, Z.; Li, Z. Fault Diagnosis of Rolling Bearings Based on SVM and Improved DS Evidence Theory for Multi-sensor Fusion. In Proceedings of the China Intelligent Networked Things Conference, Xi’an, China, 18 May 2024; pp. 54–64. [Google Scholar]
- Li, D.; Du, Y. Artificial Intelligence with Uncertainty; CRC press: Boca Raton, FL, USA, 2017. [Google Scholar]
- C. W. R. University. Case Western Reserve University Bearing Data Center Website. 2025. Available online: https://engineering.case.edu/bearingdatacenter/download-data-file (accessed on 3 January 2025).
- Lessmeier, C.; Kimotho, J.K.; Zimmer, D.; Sextro, W. Condition monitoring of bearing damage in electromechanical drive systems by using motor current signals of electric motors: A benchmark data set for data-driven classification. In Proceedings of the PHM Society European Conference, Bilbao, Spain, 5–8 July 2016. [Google Scholar]
Disclaimer/Publisher’s Note: The statements, opinions and data contained in all publications are solely those of the individual author(s) and contributor(s) and not of MDPI and/or the editor(s). MDPI and/or the editor(s) disclaim responsibility for any injury to people or property resulting from any ideas, methods, instructions or products referred to in the content. |
© 2025 by the authors. Licensee MDPI, Basel, Switzerland. This article is an open access article distributed under the terms and conditions of the Creative Commons Attribution (CC BY) license (https://creativecommons.org/licenses/by/4.0/).