Abstract
Early software defect prediction research primarily relied on software metric features. However, such features struggle to fully capture semantic information in source code. Consequently, methods based on semantic features have gradually become mainstream. Nevertheless, the empirical value of traditional metric features remains significant. To address this, this paper proposes a multi-modal feature fusion method based on a cross-attention gating mechanism for software defect prediction (GMCA-SDP). This method aims to effectively fuse multiple modal features of source code to improve defect prediction performance. Unlike previous approaches, GMCA-SDP can simultaneously integrate traditional metric features and various code semantic features. During the feature fusion stage, it considers both the contribution differences among different types of features and the information interaction between modalities. This paper selects three types of modal features as input for GMCA-SDP: traditional metric features, semantic features extracted from the abstract syntax tree, and structural features extracted from the control flow graph. Our experiments on nine open-source projects demonstrate that the GMCA-SDP method outperforms six mainstream defect prediction models, with average improvements of 18.7% in F1, 10.9% in AUC, and 14.1% in G-mean.
1. Introduction
Software Defect Prediction (SDP) is a key technology for software quality assurance. It aims to build defect prediction models by mining and analyzing historical project data, thereby accurately identifying potential defect modules in the early stages of software development. This technology can effectively reduce the cost of defect fixing later in the development process and significantly enhance the quality and reliability of software products [1,2]. However, how to construct defect identification methods with accurate predictive capabilities remains an important research challenge in the software development testing process.
Traditional defect prediction methods are largely based on code measurement features, such as CK metrics [3], Halstead complexity [4], and McCabe complexity [5]. These metrics are straightforward and concise for defect detection, but they often lack deeper semantic information [6,7,8]. Figure 1 shows examples of two code snippets; snippet A calculates the sum of array elements, while snippet B calculates the product of array elements. Although their line count, variable count, and while loop count are exactly the same, the meanings and functionalities of the two snippets are different. This limitation may weaken the effectiveness of software defect prediction.
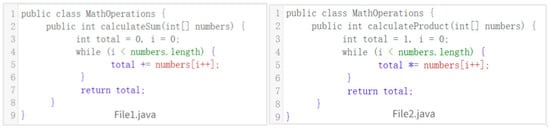
Figure 1.
Examples of File1 and File2.
With the rapid development of deep learning, researchers have gradually begun to utilize deep learning methods to extract semantic information from various code representations for software defect prediction in order to overcome the limitations of traditional metric features. Commonly used code representations include Abstract Syntax Trees (AST) and Control Flow Graphs (CFG). Earlier researchers mainly extracted semantic features from a single code representation. For example, Nagappan et al. [9] and Kamei et al. [10] built defect prediction methods using traditional metric features, while Wang et al. [11] and Dam et al. [12] constructed defect prediction methods based on AST, and Liu et al. [13] and Rajnish et al. [14] did so based on CFG.
In recent years, researchers have discovered that combining features from different code representations can further enhance the effectiveness of software defect prediction, as these various code representations describe source code from different perspectives. For instance, the AST describes the source code from a static syntactic structure perspective, while the Control Flow Graph represents the program execution logic, and traditional metric features describe the original code from the aspect of measurable metrics. The information contained in these representations is complementary. Li et al. [6] combined traditional metric features and AST features for software defect prediction using a simple concatenation method and demonstrated that this approach outperformed cases using only a single feature. The GH-LSTM method proposed by Wang et al. [15] also integrates traditional metric features and semantic features, but it employs a gating mechanism during the feature fusion stage, proving that the use of this gating mechanism improves results compared to simple concatenation. The gating mechanism allows for the consideration of the contribution of different features during fusion. Additionally, the software defect prediction model constructed by Abdu et al. [16] also uses a gating mechanism in different feature fusion stages. Beyond the combination of traditional metric features and semantic features, some scholars have also developed defect prediction models by integrating different semantic features. For example, Li and Zhu [17] used Long Short-Term Memory networks (LSTM) and Graph Convolutional Networks (GCN) to extract code semantics from AST and Program Dependence Graphs (PDG), respectively, and combined the two features using simple concatenation.
In this paper, we treat different code representations as distinct modalities of source code. Therefore, software defect prediction methods based on different feature fusions can be viewed as multi-modal feature fusion-based software defect prediction methods. Existing defect prediction methods typically consider only one or two modal features. Furthermore, when fusing different modal features, the commonly used fusion methods are mostly concatenation, summation, or gating mechanisms. Direct concatenation and summation cannot effectively highlight key information or suppress redundant information, thereby reducing model performance to varying degrees [18]. Although the gating mechanism can distinguish the contribution of different modalities at a coarse-grained level, it cannot effectively model the complex inter-modal relationships.
To address the above issues, this paper proposes a multi-modal feature fusion method based on a cross-attention gating mechanism (GMCA-SDP) for file-level defect prediction. This method aims to uniformly fuse three representative types of code modal features: traditional metric features, syntactic structure features extracted from the AST, and program control flow features extracted from the CFG, in order to enhance the model’s overall representational capability. These three modalities are chosen because they have been extensively studied and have demonstrated good performance in defect prediction [19,20,21]. The core of GMCA-SDP lies in its feature fusion mechanism, which considers both the contribution differences in different modal features and the interactive information among multiple modalities.
To validate the effectiveness of our proposed method, we conducted extensive experiments using nine open-source projects within the Within-Project Defect Prediction (WPDP) scenario. The experimental results show that the GMCA-SDP method outperforms six mainstream defect prediction models, with average improvements of 18.7% in F1, 10.9% in AUC, and 14.1% in G-mean.
The main contributions of this paper are as follows:
- We propose a three-modal feature fusion software defect prediction method named GMCA-SDP. This method can effectively integrate traditional metric features, semantic features extracted from the Abstract Syntax Tree (AST), and structural features extracted from the Control Flow Graph (CFG), thereby enhancing the model’s overall representational capacity for program code and significantly improving the performance of software defect prediction.
- We built a gated multi-head cross-attention multi-modal fusion model (GMCA), which employs a two-stage progressive fusion approach. In the first stage, cross-modal interaction information is generated using multi-head cross-attention based on the input modality information. In the second stage, cross-modal interaction information and original modality information are dynamically fused through a gating mechanism. This fusion method not only considers the information differences or contribution levels of different modal features in defect prediction but, more importantly, introduces cross-modal interactive semantic information, further enhancing the representational capability of multi-modal feature fusion.
- We conducted extensive experiments on nine open-source datasets to evaluate the performance of GMCA-SDP and GMCA. The results demonstrate that our proposed tri-modal fusion method outperforms both bi-modal and single-modal approaches, and the multimodal fusion mechanism we designed surpasses concatenation, summation, and gating mechanisms.
The remainder of this paper is organized as follows. Section 2 reviews related work. Section 3 elaborates on the proposed method. Section 4 describes the experimental setup. Section 5 presents and discusses the experimental results. Section 6 concludes the paper. Section 7 discusses threats to validity.
2. Related Work
2.1. Software Defect Prediction
Software defect prediction technology has become an important means of ensuring software quality, as it can identify potential defect risks early in the software development process. Current defect prediction methods can be categorized into three types based on the features used: methods based on traditional software metric features, methods based on semantic features, and methods that integrate both traditional and semantic features.
Early software defect prediction primarily used software metric features, which mainly consist of two categories: code metrics and process metrics [22]. Code metrics primarily reflect the attribute information of the code, with the most commonly used code metric being Lines of Code (LOC). Later, McCabe [5] introduced several cyclomatic complexity measures to assess the structural complexity of software code. Halstead [23] proposed several complexity metrics based on the number of operators and operands. With the increasing popularity of Object-Oriented (OO) coding, some code metrics specific to OO languages have been proposed, such as the CK metrics jointly proposed by Chidamber and Kemerer [3]. Process metrics are obtained through information collected during the software development process, such as code version changes, file ownership, and interactions among developers. Common process metrics include the number of code changes, revision counts, and code churn rates. Nagappan et al. [9] established a regression model using code metrics to predict potential defects in Microsoft systems, while Kamei et al. [10] constructed a defect prediction model focusing on identifying high-risk software changes based on the characteristics of software changes. Sun et al. [24] utilized the complementarity of two metric indicators to build a multi-perspective software defect prediction model through multi-layer nonlinear transformations.
With the development of deep learning, semantic-based software defect prediction methods have gradually replaced traditional metric-based software defect prediction methods due to their ability to capture deeper semantic information from code, resulting in better defect prediction performance. Commonly used intermediate representations for extracting semantic features from code include Abstract Syntax Trees (AST) and Control Flow Graphs (CFG).
Abstract Syntax Tree (AST) is an intermediate representation generated after lexical and syntactical analysis of source code. It presents the syntactic structure of the source code in a tree format, with each node in the tree corresponding to a structure or element in the source code. The AST is the most commonly used representation for extracting semantic features from code. When utilized in software defect prediction, it typically employs three types of nodes: method call and class instance creation nodes, declaration nodes, and control flow nodes [19]. Wang et al. [11] used Deep Belief Networks (DBN) to self-learn software defect prediction features from the AST and demonstrated that their approach outperforms methods based on traditional metric features. To better extract the syntactic structure and multi-level semantic features of code, Dam et al. [12] proposed a tree-based network structure composed of LSTM units for software defect prediction.
Control Flow Graph (CFG) is a graphical representation that depicts all possible execution paths within a program, showing the order in which various statements or instructions are executed. Phan et al. [25] developed a defect prediction method based on a Directed Graph Convolutional Neural Network (DGCNN) that automatically learns semantic features from the CFG. Liu et al. [13] employed Graph Attention Networks (GAT) to process the Control Flow Graph (CFG), enabling the model to focus on important nodes and edges within the graph, resulting in a software defect prediction method named CFG2AT. Rajnish et al. [14] combined Graph Convolutional Networks (GCN) with CFG to construct a defect prediction method, where cognitive complexity measurement results were used as nodes in the CFG.
Through previous defect prediction methods based on software metric features and semantic features, it can be seen that both types of features have achieved certain results in software defect prediction. They represent source code from different perspectives or forms, and their features have certain complementarity. As a result, some researchers have constructed software defect prediction methods by combining traditional metric features with semantic features, achieving some success. Li et al. [6] proposed a defect prediction framework named DP-CNN, which first utilizes Convolutional Neural Networks (CNN) to extract semantic features from Abstract Syntax Trees (AST). The extracted semantic features are then fused with traditional features through simple concatenation, and a logistic regression model is employed to complete the classification task. Ni et al. [26] merged the extracted semantic features with their collected expert metric features using simple concatenation for real-time software defect prediction. Lin and Lu [27] used the dual-sequence characteristics of BiLSTM to extract semantic information from the AST, which is then used for software defect prediction by concatenating with traditional features. Fan et al. [28] proposed a defect prediction framework named DP-AM, which learns code semantic information using BiLSTM combined with an attention mechanism, concatenating the learned semantic features and traditional features for software defect prediction. However, these methods that combine traditional software metric features with semantic features have not considered the contribution of different types of features. To better enhance feature fusion effects, Wang et al. [15] dynamically weighted the fusion of traditional features and semantic features using a gating mechanism for software defect prediction, while Abdu et al. [29] also used a gating mechanism to fuse traditional features and semantic features. Recently, researchers have found that fusing multiple semantic features can similarly improve software defect prediction performance. Zhou et al. [30] combined two semantic features, Abstract Syntax Trees (AST) and Class Dependency Networks (CDN), to enhance defect prediction effectiveness. Additionally, to improve feature fusion effects, this method employed a weighting strategy and concluded that different fusion strategies would impact the final performance of the model. Abdu et al. [16] proposed a method using hierarchical convolutional neural networks, which extracts different types of semantic features from AST, CFG, and data dependency graphs (DDG) and ultimately fuses them for software defect prediction. In the feature fusion stage, the authors employed a concatenation approach.
2.2. Multimodal Data Fusion
Multimodal data fusion refers to the process of collaboratively processing data from different sources and modalities, integrating it into a global space, ultimately representing both intra-modal and cross-modal information in a unified manner [31,32]. Multimodal data fusion has been proven to enhance the overall model performance due to its integration of complementary information from different modalities; this approach has been extensively used in areas like visual question answering, sentiment analysis, and multimedia retrieval. Existing approaches to multimodal data fusion can be grouped into four categories: early fusion, middle fusion, late fusion, and hybrid fusion [33]. Early fusion integrates the raw data or preprocessed data from different modalities before inputting it into the model. Middle fusion combines features extracted from different modalities and inputs them into the model for decision-making. Late fusion, often referred to as decision fusion, merges individual decisions from different modalities to produce a final prediction, with the core idea of this approach being similar to ensemble learning. Hybrid fusion is a combination of early, middle, and late fusion methods.
Zhao et al. [33] argue that with the increasing amount of multimodal data, traditional classification methods for multimodal data fusion can only provide basic guidance. With the development of deep learning, the focus has shifted from independently extracting features from each modality to extracting richer representations from multimodal data. Multimodal data fusion methods have transitioned from traditional explicit approaches to more implicit fusion strategies. Couprie et al. [27] were the first to propose a deep learning-based multimodal fusion model, in which the authors concatenated features from RGB images and depth images to build an image segmentation task. Many researchers have also adopted this strategy in the software defect prediction process [6,26,27]. Subsequently, researchers leveraged the hierarchical representation learning capability of deep neural networks to fuse multimodal hierarchical features. Hung et al. [34] applied this method to the semantic segmentation task. Recently, in order to explore the interaction relationships between modalities, researchers have begun to use attention mechanisms to learn cross-modal features. Mohla et al. [35] proposed a multimodal model that combines spatial attention and channel attention. In addition to utilizing an intra-modal attention mechanism, the authors also employed an inter-modal attention mechanism to explore the cross-modal relationships between the LiDAR modality and the hyperspectral image modality.
3. Materials and Methods
We propose an overview of the GMCA-SDP method as shown in Figure 2, which includes four steps: (1) Data preprocessing, parsing the AST and CFG from the source code and vectorizing the embeddings using Word2Vec and node2vec, respectively. The traditional handcrafted static features directly adopt the 20 metrics previously collected by researchers from the source code; (2) Multimodal Feature Extraction: Utilizing Convolutional Neural Networks (CNN) to mine deep semantic features from Abstract Syntax Tree (AST) sequences, leveraging Graph Convolutional Networks (GCN) to learn structural characteristics of Control Flow Graphs (CFG), and employing Multi-Layer Perceptron (MLP) for feature enhancement and dimensional alignment; (3) Multimodal Feature Fusion: Integrating features from different modalities to construct a unified comprehensive representation; (4) Defect Prediction: Mapping the fused features to defect probabilities through fully connected neural networks.
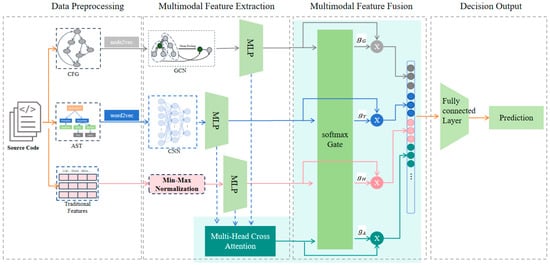
Figure 2.
Overview of the GMCA-SDP Method.
3.1. Data Preprocessing
To build a software defect prediction model using multiple modalities of information, we need to preprocess the source code to extract three key code representations: traditional software metric features, Abstract Syntax Trees (AST), and Control Flow Graphs (CFG).
For the traditional metric features, we selected 20 key indicators from existing traditional metrics based on previous research, including WMC (the number of methods in a given class), LCOM (the cohesion between methods), and NOC (the number of direct subclasses of the class). These features are widely used in software defect prediction [15,29,36].
For the AST, we first used the open-source Python library javalang to parse the source code into an AST. To reduce the noise impact of specific nodes, we followed the approach by Li et al. [6] and retained only three types of nodes. Next, we obtained the AST node sequence by performing a Depth-First Search (DFS) on the parsed AST, and finally, we used Word2Vec [37] to embed the AST node sequence, resulting in the final vector representation of the AST.
The CFG is a directed graph that represents the control flow logic of the program execution process, where each node corresponds to a basic block in the program, and the edges indicate the control flow transitions. In this study, we used the COMEX tool proposed by Das et al. [38] to generate the CFG from the source code. Subsequently, we used Node2Vec [39] to embed the CFG, obtaining its vector representation.
3.2. Multimodal Feature Extraction
For traditional metric features, we used Min-Max normalization to scale their values to the range [0, 1], allowing them to be directly input as a 20-dimensional feature vector into the subsequent neural network. For the input feature matrix X, its output Z can be expressed as:
For AST semantic feature extraction, we employed a convolutional neural network (CNN) model. The network is composed of the following sequence of layers: input, one-dimensional convolution (Conv1D), global max-pooling, Dropout, and a fully connected output layer. Its final output can be expressed as:
In the formula, X is the feature matrix of the AST, is the convolutional kernel weight matrix, is the bias of the convolutional layer, and are the weight matrix and bias of the output layer, respectively, is the activation function, and is the semantic vector output.
In extracting CFG features, we adopted a graph convolutional network (GCN), which is a deep learning model designed for graph-structured data. The core idea of GCN is to extend the convolution operation to non-Euclidean spaces by aggregating normalized neighborhood information. This mechanism preserves the topological characteristics of the graph structure and the semantic features of the nodes. Through layer-wise feature aggregation, GCN can progressively capture feature representations from local to global. The GCN can be mathematically described by the following formula:
Among them: is the self-loop adjacency matrix (where A is the original adjacency matrix and I is the identity matrix). Therefore, in the new process, each node considers its own features. is the degree matrix of , with . is normalized to increase the stability of the adjacency matrix and prevent overfitting of nodes with many neighboring nodes. is the adjacency matrix of the -th layer (input), and (initial node features). is the learnable weight matrix of the -th layer. is a nonlinear activation function (such as ReLU).
After extracting the traditional metric features, AST features, and CFG features, we use a multilayer perceptron (MLP) to perform dimension alignment and feature enhancement on these three types of features. The input layer of a multilayer perceptron can be represented as:
The l-th hidden layer can be represented as:
The output layer can be represented as (where L is the total number of layers):
Here, is the input vector, is the weight matrix of the first layer, is the bias vector of the first layer, and is the activation function. The MLP used in this study consists of four layers.
3.3. Multimodal Feature Fusion
In the multi-modal feature fusion stage, to effectively integrate different modal feature information and enhance the model’s representation capability, we designed a Gated Multi-Modal Cross-Attention (GMCA) fusion module. This model employs a two-stage progressive fusion strategy: In the first stage, GMCA uses multi-head cross-attention layers to process the input multi-modal information, generating cross-modal interaction feature representations. GMCA effectively maps and fuses features from different modalities, enabling the model to capture deep relationships between modalities and enhance the representation of the features. In the second stage, GMCA utilizes a gating mechanism to dynamically weight and fuse the cross-modal interaction features obtained in the previous stage with the original modal features, taking into account the differences in contributions among the various modalities during the multi-modal fusion process. Our hierarchical fusion architecture not only learns the contribution levels between different modalities but also considers the deep semantic interactions among modalities, thereby enhancing the overall performance of the model.
In the first stage, for defining AST modal features , CFG features , and traditional metric features , we use a multi-head attention layer to construct learnable queries (Query), keys (Key), and values (Value) for each modality feature.
where is the projection matrix for each modality, is the subspace dimension, and num_heads is the number of attention heads. Figure 3 shows the model architecture of the multi-head attention mechanism, which learns information from different subspaces by running multiple self-attention layers in parallel. The multi-head cross-attention mechanism essentially works similarly to the multi-head attention mechanism, with the distinction that in multi-head attention, the queries (Q), keys (K), and values (V) come from the same sequence, while in multi-head cross-attention, the queries (Q) come from one sequence, and the keys (K) and values (V) come from another sequence. This enables cross-attention to capture the associative information between different sequences.
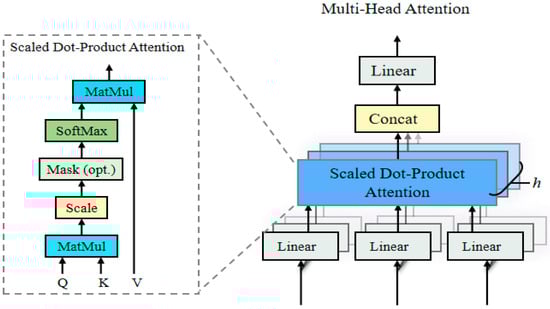
Figure 3.
Multi-Head Attention Model Architecture.
Figure 4 illustrates the working process of the multi-head cross-attention mechanism used in this paper, where the cross-modal attention scores can be calculated using the following scaled dot product:
where represents other modalities. After learning the interactive feature information between different modalities through the multi-head cross-attention mechanism, the final learned cross-modal interactive features can be represented as:
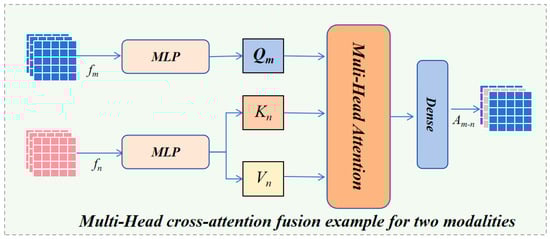
Figure 4.
Multi-Head Cross-Attention Method.
In the second stage, we employ an end-to-end trainable gated fusion mechanism to dynamically adjust the contribution weights of each modality. This mechanism transforms the concatenated multimodal features into gating scores through a linear transformation:
The normalized transformation obtained through the softmax gating function is:
where represents the dynamically learned contribution weights of each modality. The feature weighting for each modality can be expressed as:
The final feature output after weighted fusion is:
3.4. Defect Prediction
In the software defect decision output stage, we use a fully connected layer to make the final decisions on defective and non-defective instances, where the input is the fused multimodal feature representation . The final output can be expressed as:
where is the Sigmoid function:
and are the weights and biases of the output. The closer the output value is to 1, the higher the probability of the presence of a defect.
To enhance the model’s generalization ability and prevent overfitting while considering the class imbalance issue, the loss function in this study combines weighted binary cross-entropy and label smoothing techniques. The binary cross-entropy loss function can be expressed as:
where N is the number of samples, is the true label of the i-th sample, and is the predicted probability of the model for the i-th sample being the positive class. To prevent overfitting, we introduce label smoothing on top of the binary cross-entropy loss function:
where represents the smoothing coefficient, and is the uniform distribution. After introducing the label smoothing technique, the loss function can be expressed as:
In the software defect prediction process, class imbalance is a common phenomenon. As we can see from the dataset description in Table 1, different projects exhibit a certain degree of class imbalance. To mitigate the negative impact of class imbalance on the model, we introduce class weights into the loss function. The calculation of each class weight can be expressed as:
where is the number of samples belonging to class i, is the weight of class i, and C is the total number of classes. In the case of defect prediction, since it is a binary classification problem, we have C = 2. The loss , considering the class weights, can be expressed as:
where is the class weight corresponding to the true label .

Table 1.
Dataset Description.
4. Experimental Settings
4.1. Dataset
We selected a total of 24 versions of 9 projects from the Promise public dataset to validate the experiments in this study. Table 1 provides an overview of the dataset used in this study, detailing project names, version identifiers, project descriptions, average file counts per project, and corresponding average defect rates. The reasons for choosing these projects are as follows:
- These projects have been widely used in software defect prediction research [15,40,41], providing a reliable benchmark for our comparative experiments.
- All of these projects are real software projects from the Apache Foundation, which is conducive to evaluating the effectiveness of our method.
- These projects contain sufficient information that can be used for software defect prediction, such as filenames, version numbers, descriptions, and defect labels. Additionally, we can find the corresponding source code from GitHub and the Apache official website based on the project names and version numbers.
4.2. Baseline Methods
We selected six benchmark methods for comparison to evaluate the performance of the proposed GMCA-SDP method.
- Bayesian Network (BN) [42]: A software defect prediction approach that employs Bayesian networks to identify the probabilistic connections between software metrics and defect patterns.
- Deep Belief Network (DBN) [11]: A method that uses deep belief networks (DBN) to automatically extract semantic features for software defect prediction.
- CNN [6]: A software defect prediction method that inputs the Abstract Syntax Tree (AST) and uses CNN to capture the semantic features of source code, combining them with traditional metric features.
- LSTM [43]: A technique that utilizes LSTM to automatically extract semantic and contextual features from the AST for the purpose of software defect prediction.
- SDP-BB [44]: A software defect prediction approach that integrates Bidirectional Long Short-Term Memory networks (BiLSTM) with BERT. This method enhances prediction accuracy by harnessing the strengths of both deep learning models to capture the semantic features of the code.
- CNN-MLP [29]: A software defect prediction method that combines semantic features and traditional features by learning semantic features through CNN and processing traditional features with MLP.
4.3. Performance Measures
In order to evaluate the performance of the GMCA-SDP method, we selected F1-score, AUC, and G-mean to assess the effectiveness of the method. These metrics are frequently employed in the research process of predicting software defects [45,46]. We denote the counts of true positives, true negatives, false positives, and false negatives with TP, TN, FP, and FN, respectively. The definitions of these metrics are provided below:
The F1 score, known as F1, evaluates both precision and recall, making it ideal for datasets with imbalanced classes, especially in defect detection. Its value ranges from 0 to 1, and a higher score, closer to 1, indicates a better balance in minimizing false negatives and false positives.
The G-measure is the harmonic mean of recall and (1 − error rate), and it is often used to assess the classification performance of models on imbalanced datasets.
The area under the ROC curve (AUC) evaluates a model’s ranking ability and generalization performance by calculating the true positive rate and false positive rate at different thresholds. The range of AUC is [0.5, 1], where a higher value indicates a stronger ability of the model to distinguish between defective and non-defective samples. Moreover, AUC is insensitive to threshold selection, making it particularly suitable for assessing the stability of classifiers.
4.4. Parameters Setting
The method proposed in this study is implemented based on the TensorFlow 2.11.0 deep learning framework and Python 3.7.16. During the AST feature extraction process, we used Word2Vec to embed the AST sequences with an embedding dimension of 40, and the number of CNN filters used was 32, with a kernel size of 12. In the CFG feature extraction process, we employ a two-layer graph convolutional network with hidden unit dimensions of 128 and 64, using the ReLU activation function and Dropout regularization. While extracting three-modal interaction features through the multi-head attention mechanism, we set the number of attention heads to 4 and the dimension of the projection layer to 64. We used an MLP to map the three types of features uniformly to a 128-dimensional feature space for dimensional alignment. The entire model is trained in an end-to-end manner, with all components being jointly optimized within a unified framework. During the training process, the learning rate is set to 0.0002 with 200 iterations.
5. Results and Discussion
In this section, we have designed three research questions to assess the effectiveness of our proposed GMCA-SDP method:
RQ1: Does multimodal feature fusion improve the performance of SDP?
RQ2: Does our proposed GMCA-SDP method perform better compared to baseline methods?
RQ3: Does our proposed MHCA model outperform other fusion methods in terms of effectiveness?
During the experiment, we adopted a historical version of the same project as the training set and a more recent version as the validation set. Take the Ant project as an example: we chose versions Ant-1.5, Ant-1.6, and Ant-1.7 for the experiments. For the first set of experimental tasks, Ant-1.5 was used as the training set and Ant-1.6 as the validation set; for the second set, Ant-1.6 served as the training set and Ant-1.7 as the validation set. In the analysis of experimental results, we use TR to represent traditional metric features.
5.1. RQ1: Does Multimodal Feature Fusion Improve the Effectiveness of SDP?
To investigate the effectiveness of multimodal feature fusion in software defect prediction, we conducted experiments under three conditions and recorded the results: In the first condition, we performed software defect prediction using only the AST (represented as AST); In the second condition, we fused the AST and CFG for software defect prediction (represented as AST+CFG); In the third condition, we fused the AST, CFG, and traditional handcrafted features for software defect prediction (represented as AST+CFG+TR).
Table 2 presents the specific performances of single-modal method (AST), two-modal fusion method (AST+CFG), and three-modal fusion method (AST+CFG+TR) in terms of F1, AUC, and G-mean for each experimental task. Figure 5, Figure 6 and Figure 7 graphically illustrate the contents of Table 2 using line graphs, and Figure 8 shows the performance improvement ratios of the AST+CFG method compared to the AST method, the AST+CFG+TR method compared to the AST method, and the AST+CFG+TR method compared to the AST+CFG method in terms of F1, AUC, and G-mean. From Table 3 and Figure 5, Figure 6, Figure 7 and Figure 8, it can be observed that the AST+CFG+TR method outperforms the AST+CFG method on most datasets, while the AST+CFG method outperforms the AST method.
Table 2.
Results of F1, AUC, and G-mean for the three cases: AST, AST+CFG, and AST+CFG+TR.
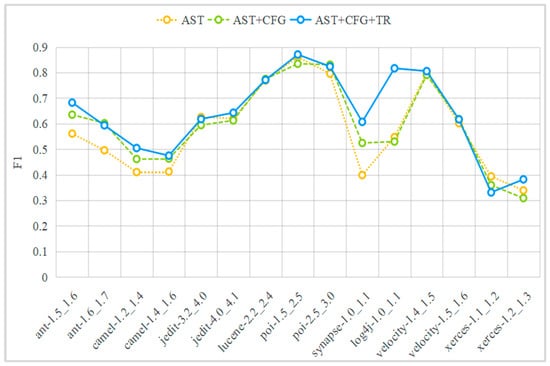
Figure 5.
F1 performance.
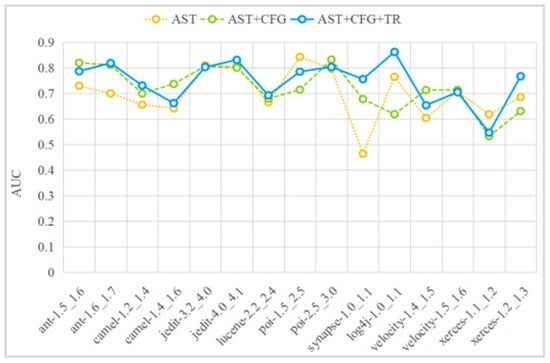
Figure 6.
AUC performance.
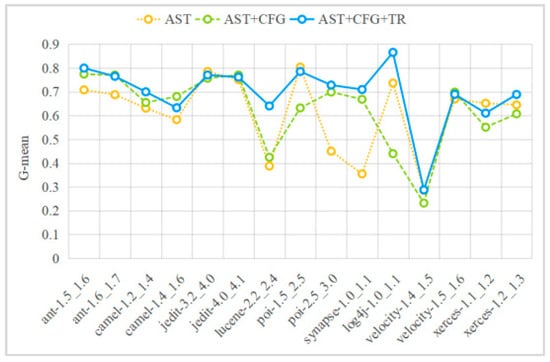
Figure 7.
G-mean performance.
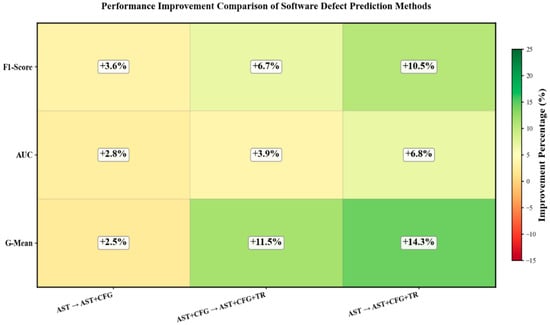
Figure 8.
Performance Improvement Comparison of Software Defect Prediction Methods.
Table 3.
F1 values of the GMCA-SDP method and the six baseline methods.
Figure 9, Figure 10 and Figure 11 present the median, upper quartile, and lower quartile for the three methods across all experiments using box plots, while Figure 12 shows the comparison of the means for the three methods. From Figure 9, Figure 10, Figure 11 and Figure 12, it can be seen that in terms of performance metrics F1, AUC, and G-mean, the median and mean of the AST+CFG+TR method are higher than those of the other two methods, and the median and mean of the AST+CFG method are higher than those of the AST method.
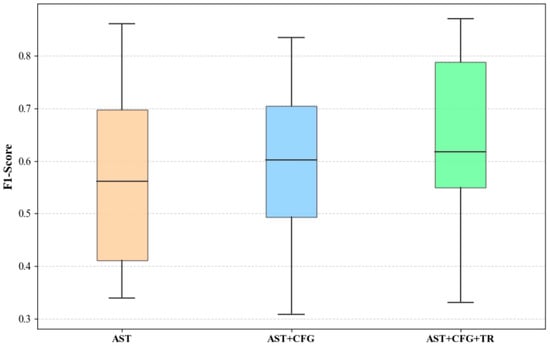
Figure 9.
F1 Box Plot Comparison.
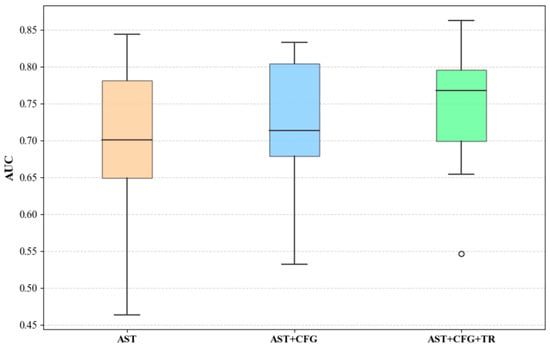
Figure 10.
AUC Box Plot Comparison.

Figure 11.
G-Mean Box Plot Comparison.
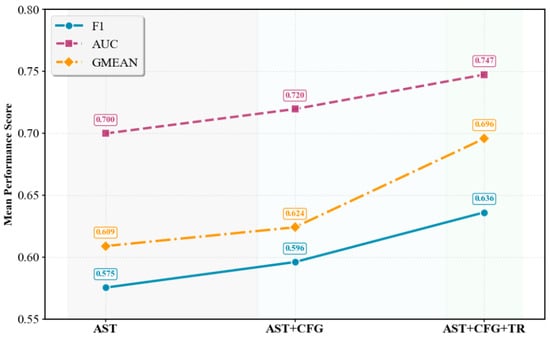
Figure 12.
F1, AUC, G-mean Means.
Based on the above experimental analysis, we can conclude that our proposed methods for fusing three modalities outperform the results of two-modal fusion and single-modal effects. This indicates that our methods effectively capture the feature information from different modalities and can perform complementary fusion of this information to enhance the representation capability of software defects.
5.2. RQ2: How Does Our Proposed Method Perform Compared to Other Software Defect Prediction Methods?
To tackle this question, we compared our proposed GMCA-SDP method with the six state-of-the-art software defect prediction approaches described in Section 4.2.
Table 3, Table 4 and Table 5 present the performance of the GMCA-SDP method compared to six baseline methods in terms of F1, AUC, and G-mean, with the maximum values highlighted in bold. Figure 13 visualizes the data from Table 3, Table 4 and Table 5 as line charts. Figure 14 displays a performance ranking heatmap of different methods across various experimental tasks, with green indicating the highest ranks and red the lowest. From Table 3, Table 4 and Table 5 and Figure 13 and Figure 14, we can see that the performance of GMCA-SDP outperforms the baseline methods on most datasets.
Table 4.
AUC values of the GMCA-SDP method and the six baseline methods.
Table 5.
G-mean values of the GMCA-SDP method and the six baseline methods.
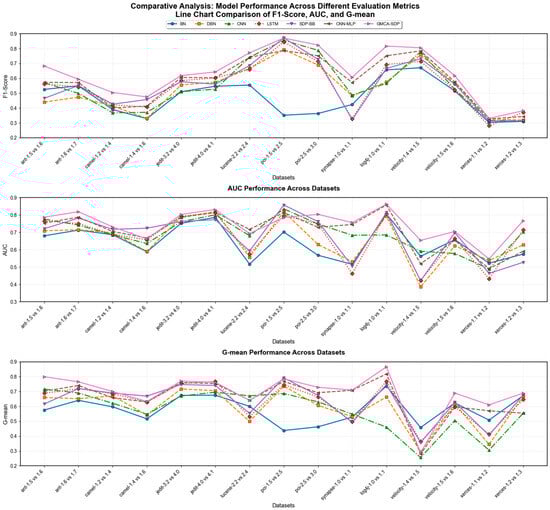
Figure 13.
Comparison of different methods on F1, AUC, and G-mean metrics across all experimental tasks.
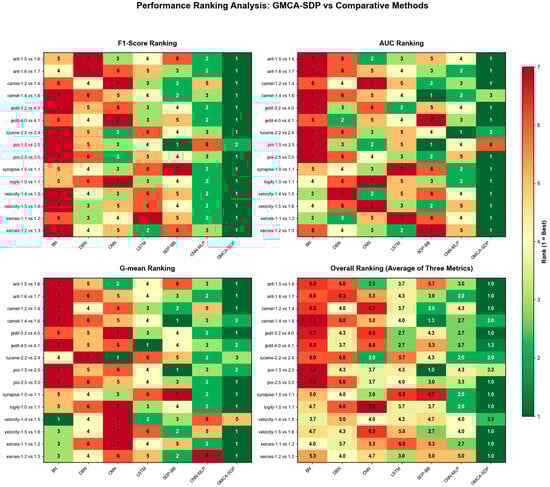
Figure 14.
Heatmap of performance rankings for different methods in terms of F1, AUC, and G-mean across all experimental tasks.
Figure 15 presents the average values of F1, AUC, and G-mean metrics for different methods across all experimental tasks as a line chart. Figure 16, Figure 17 and Figure 18 depict the experimental results from Table 3, Table 4 and Table 5 as box plots(The green triangles represent the average values). From Figure 15, Figure 16, Figure 17 and Figure 18, it is evident that our proposed GMCA-SDP method outperforms the six comparative methods in both average performance and median performance across all experimental tasks. In terms of average values, GMCA-SDP improved F1 by 19.9%, AUC by 10.7%, and G-mean by 14.1% compared to the baseline methods. Additionally, we observed that in the two experimental sets of the xerces project (xerces-1.1_1.2 and xerces-1.2_1.3), the F1-scores were consistently relatively low. We attribute this to significant class imbalance across different versions of xerces, coupled with substantial data distribution shifts, which collectively led to the decline in model performance.
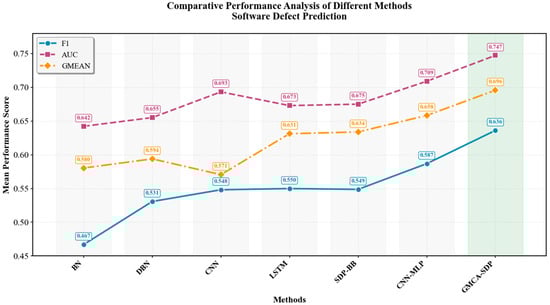
Figure 15.
Comparison of the average F1, AUC, and G-mean values for each method across all experimental tasks.
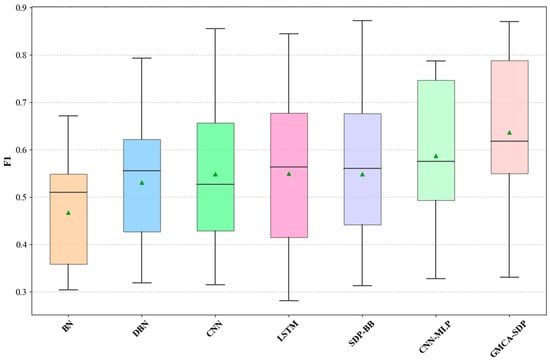
Figure 16.
Box plot of F1 scores for GMCA-SDP and six baseline methods.
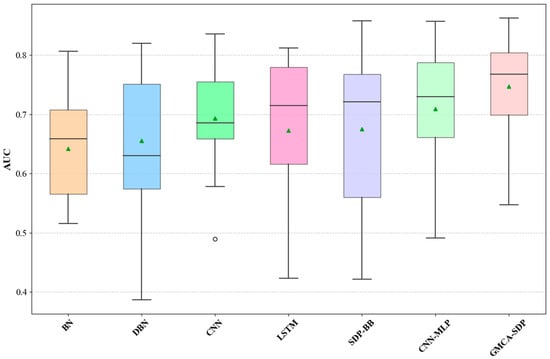
Figure 17.
Box plot of AUC scores for GMCA-SDP and six baseline methods.
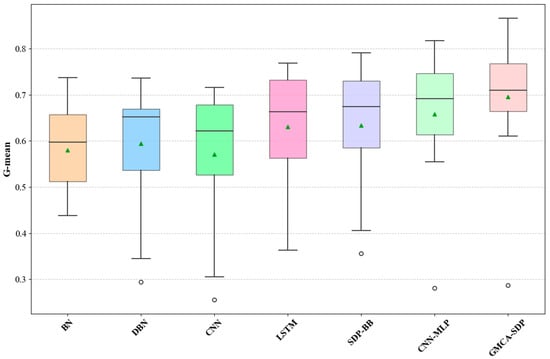
Figure 18.
Box plot of G-mean scores for GMCA-SDP and six baseline methods.
In summary, we conclude that our proposed GMCA-SDP method outperforms the selected baseline methods. The CNN-MLP method follows closely behind GMCA-SDP, while the overall performance of BN is weaker than that of the other methods. Our experiments also indicate that semantic-based defect prediction methods are superior to traditional metric-based approaches.
5.3. RQ3: Is Our Proposed GMCA Method More Effective Compared to Other Fusion Methods?
To investigate the performance of our proposed multimodal data fusion method GMCA, we selected three commonly used data fusion methods in the field of software defect prediction for comparison: concatenation, addition, and gating. Table 6, Table 7 and Table 8 present the specific performance of the four methods in terms of F1, AUC, and G-mean across all experimental tasks. To provide a clearer observation of the performance of different methods, Figure 19 visualizes the data from Table 6, Table 7 and Table 8 as line charts, while Figure 20 presents a ranking heatmap of the F1, AUC, and G-mean performances for different methods across different experimental tasks. From Table 6, Table 7 and Table 8, as well as Figure 19 and Figure 20, it is evident that the fusion effect of the GMCA method outperforms the comparative methods on most datasets.
Table 6.
Comparison of F1 performance for GMCA, Add, Concat, and Gate in each experimental task.
Table 7.
Comparison of AUC performance for GMCA, Add, Concat, and Gate in each experimental task.
Table 8.
Comparison of G-mean performance for GMCA, Add, Concat, and Gate in each experimental task.
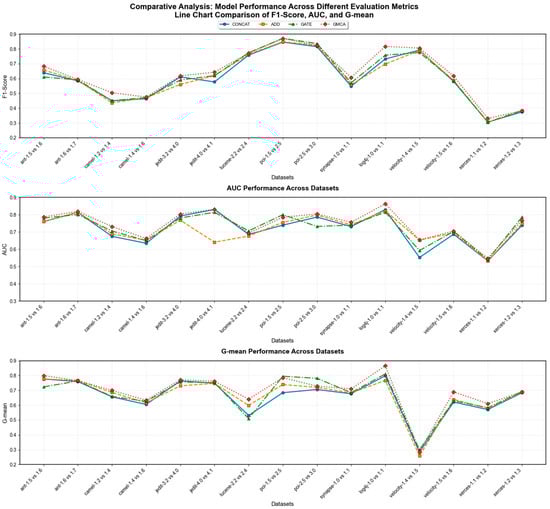
Figure 19.
Comparison of box plots for F1 values of GMCA, Add, Concat, and Gate across all experimental tasks.
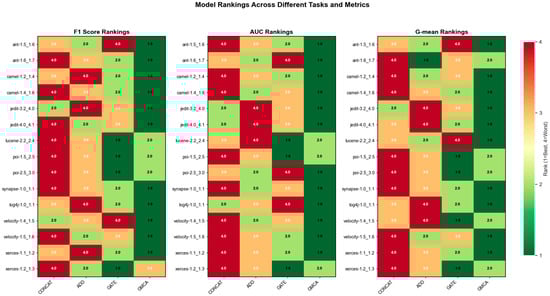
Figure 20.
Heatmap of performance rankings for F1, AUC, and G-mean.
To further observe the performance of GMCA, Figure 21 averages the ranking heatmap from Figure 20 to show the average performance of GMCA, Add, CONCAT, and Gate on each metric, where green indicates a higher ranking and red indicates a lower ranking. In Figure 22, we present the percentage increase in the average values of F1, AUC, and G-mean for the GMCA method compared to the baseline methods. From Figure 21 and Figure 22, it is clear that, from an average value perspective, GMCA ranks highest and performs best. Specifically, the average F1 value of GMCA improved by 5.1%, 5.0%, and 3.8% compared to CONCAT, ADD, and GATE, respectively. The average AUC value increased by 3.9%, 4.3%, and 2.4% compared to CONCAT, ADD, and GATE, respectively, while the average G-mean value improved by 5.8%, 4.4%, and 3.7% compared to CONCAT, ADD, and GATE, respectively. Figure 23, Figure 24 and Figure 25 illustrate the performance of the four methods across all experimental tasks as box plots, further demonstrating that GMCA outperforms CONCAT, ADD, and GATE.
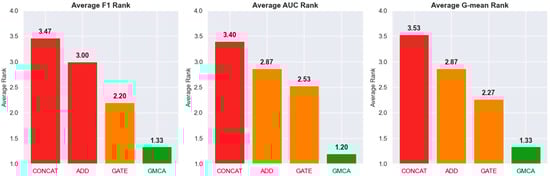
Figure 21.
Average rankings of F1, AUC, and G-mean.
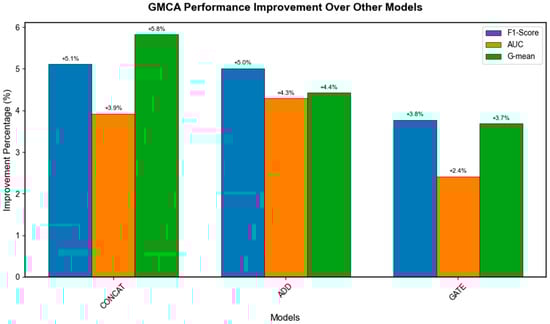
Figure 22.
Percentage increase in average values of F1, AUC, and G-mean for GMCA compared to baseline methods.
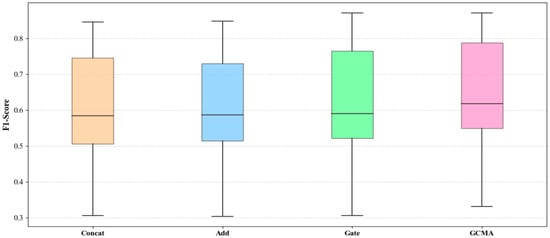
Figure 23.
Comparison of F1 box plots for GMCA, Add, Concat, and Gate across all experimental tasks.
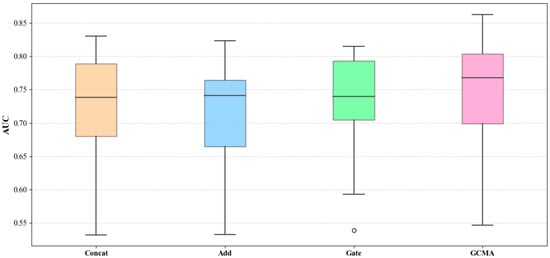
Figure 24.
Comparison of AUC box plots for GMCA, Add, Concat, and Gate across all experimental tasks (Outliers are represented by circles).
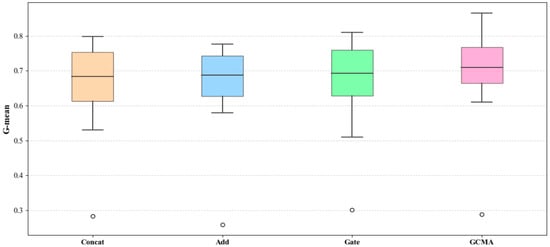
Figure 25.
Comparison of G-mean box plots for GMCA, Add, Concat, and Gate across all experimental tasks (Outliers are represented by circles).
From the comparison of the specific performances of the four methods on each experimental task, as well as their average and median performances, it is evident that GMCA exhibits the best performance, followed by the GATE method. The main difference between these two methods and CONCAT and ADD lies in their consideration of the contribution differences among different modalities. GMCA outperforms GATE because it not only accounts for these differences but also further explores the semantic interaction information between modalities. This comparative experiment demonstrates that taking into account the interactive feature information between different modalities and their contribution differences is beneficial for improving the effectiveness of software defect prediction.
6. Conclusions and Future Work
In recent years, advances in deep learning have enabled the application of diverse code representations to defect prediction, driving a shift in feature usage from single-modal to multi-modal characteristics. Following this trend, we introduce a multi-modal interactive feature fusion software defect prediction method based on gated cross-attention mechanism. This approach emphasizes evaluating the effectiveness of multi-modal fusion strategies and their influence on defect prediction model performance. Through 15 experimental trials conducted on 24 versions of 9 open-source projects, our results indicate that multi-modal fusion techniques consistently exceed the performance of single-modal methods. Furthermore, the proposed fusion technique, which explicitly incorporates cross-modal interaction, outperforms standard fusion strategies such as concatenation, additive fusion, and gating mechanisms.
This study mainly focuses on Java projects in a WPDP scenario. Regarding future research, we intend to extend our method to other programming languages like Python and C, and at the same time further verify its effectiveness in cross-project software defect prediction (CPDP) scenarios.
7. Threats to Validity
7.1. Implementation Methods
For the baseline methods used in this paper, including BN, DBN, CNN, LSTM, SDP-BB, and CNN-MLP, we attempted to reimplement the methods according to the related descriptions provided by the authors in the paper, as the authors did not provide the complete source code. However, the absence of certain details may lead to variations in performance.
7.2. Dataset Selection
We selected nine open-source Java projects from the PROMISE dataset to validate the effectiveness of our experiments. These selected projects may not cover all types of software projects. Furthermore, we only tested our proposed model on Java projects. In this regard, we cannot guarantee that our model is applicable to all programming languages. Therefore, for projects not included in the nine selected ones or those developed in other languages (such as Python or C), our proposed method may yield better or worse results.
7.3. Conclusion Validity
The validity of research conclusions refers to the reasonableness of the conclusions drawn. In this study, we conducted multiple experiments on large-scale projects to mitigate threats to the validity of the research findings. Therefore, based on the experimental data obtained, statistically significant results should be achievable.
Author Contributions
Conceptualization, R.W. and F.L.; methodology, R.W.; formal analysis, F.L.; writing—original draft preparation, R.W.; writing—review and editing, R.W. and F.L.; supervision, F.L. All authors have read and agreed to the published version of the manuscript.
Funding
This study was supported by the Project “Research on Key Technologies of Full-Lifecycle Quality and Risk Management and Control for Railway Information Systems” (Grant No. P2022S007) from China State Railway Group Co., Ltd., and the Project “Research on Optimization Construction Scheme and Key Technologies of Development and Testing Platform of China State Railway Group Co., Ltd.” (Grant No. K24L00170) from China Railway Information Technology Big Data Technology Co., Ltd.
Institutional Review Board Statement
Not applicable.
Informed Consent Statement
Not applicable.
Data Availability Statement
The original data presented in the study are openly available in https://github.com/DanielWang2019/promisedata.git (accessed on 16 October 2025).
Conflicts of Interest
The authors declare that this study received funding from China State Railway Group Co., Ltd. and China Railway Information Technology Big Data Technology Co., Ltd. The funder was not involved in the study design, collection, analysis, interpretation of data, the writing of this article or the decision to submit it for publication.
References
- Pachouly, J.; Ahirrao, S.; Kotecha, K.; Selvachandran, G.; Abraham, A. A Systematic Literature Review on Software Defect Prediction Using Artificial Intelligence: Datasets, Data Validation Methods, Approaches, and Tools. Eng. Appl. Artif. Intell. 2022, 111, 104773. [Google Scholar] [CrossRef]
- Liu, J.; Zhu, X.; Liu, C.; Cui, X.; Liu, Q. CPGBERT: An Effective Model for Defect Detection by Learning Program Semantics via Code Property Graph. In Proceedings of the 2022 IEEE International Conference on Trust, Security and Privacy in Computing and Communications (TrustCom), Wuhan, China, 9–11 December 2022; pp. 274–282. [Google Scholar] [CrossRef]
- Chidamber, S.R.; Kemerer, C.F. A Metrics Suite for Object Oriented Design. IEEE Trans. Softw. Eng. 1994, 20, 476–493. [Google Scholar] [CrossRef]
- Harrison, R.; Counsell, S.J.; Nithi, R.V. An Evaluation of the MOOD Set of Object-Oriented Software Metrics. IEEE Trans. Softw. Eng. 1998, 24, 491–496. [Google Scholar] [CrossRef]
- McCabe, T.J. A Complexity Measure. IEEE Trans. Softw. Eng. 1976, SE-2, 308–320. [Google Scholar] [CrossRef]
- Li, J.; He, P.; Zhu, J.; Lyu, M.R. Software Defect Prediction via Convolutional Neural Network. In Proceedings of the 2017 IEEE International Conference on Software Quality, Reliability and Security (QRS), Prague, Czech Republic, 25–29 July 2017; pp. 318–328. [Google Scholar] [CrossRef]
- Fang, D.; Liu, S.; Liu, A. Gated Homogeneous Fusion Networks with Jointed Feature Extraction for Defect Prediction. IEEE Trans. Reliab. 2022, 71, 512–526. [Google Scholar] [CrossRef]
- Dam, H.K.; Tran, T.; Pham, T.; Ng, S.W.; Grundy, J.; Ghose, A. Automatic Feature Learning for Vulnerability Prediction. arXiv 2017, arXiv:1708.02368. [Google Scholar] [CrossRef]
- Nagappan, N.; Ball, T.; Zeller, A. Mining Metrics to Predict Component Failures. In Proceedings of the ICSE ’06: Proceedings of the 28th International Conference on Software Engineering, Shanghai, China, 20–28 May 2006; ACM: Shanghai, China, 2006; pp. 452–461. [Google Scholar] [CrossRef]
- Kamei, Y.; Shihab, E.; Adams, B.; Hassan, A.E.; Mockus, A.; Sinha, A.; Ubayashi, N. A Large-Scale Empirical Study of Just-in-Time Quality Assurance. IEEE Trans. Softw. Eng. 2013, 39, 757–773. [Google Scholar] [CrossRef]
- Wang, S.; Liu, T.; Tan, L. Automatically Learning Semantic Features for Defect Prediction. In Proceedings of the ICSE ’16: Proceedings of the 38th International Conference on Software Engineering, Austin, TX, USA, 14–22 May 2016; pp. 297–308. [Google Scholar] [CrossRef]
- Dam, H.K.; Pham, T.; Ng, S.W.; Tran, T.; Grundy, J.; Ghose, A.; Kim, T.; Kim, C.-J. Lessons Learned from Using a Deep Tree-Based Model for Software Defect Prediction in Practice. In Proceedings of the 2019 IEEE/ACM 16th International Conference on Mining Software Repositories (MSR), Montreal, QC, Canada, 25–31 May 2019; pp. 46–57. [Google Scholar] [CrossRef]
- Liu, H.; Li, Z.; Zhang, H.; Jing, X.-Y.; Liu, J. CFG2AT: Control Flow Graph and Graph Attention Network-Based Software Defect Prediction. IEEE Trans. Reliab. 2024, 74, 3412–3426. [Google Scholar] [CrossRef]
- Rajnish, K.; Bhattacharjee, V.; Chandrabanshi, V. Applying Cognitive and Neural Network Approach over Control Flow Graph for Software Defect Prediction. In Proceedings of the 2021 Thirteenth International Conference on Contemporary Computing, Noida, India, 5–7 August 2021; ACM: Noida, India, 2021; pp. 13–17. [Google Scholar] [CrossRef]
- Wang, H.; Zhuang, W.; Zhang, X. software Defect Prediction Based on Gated Hierarchical LSTMs. IEEE Trans. Reliab. 2021, 70, 711–727. [Google Scholar] [CrossRef]
- Abdu, A.; Zhai, Z.; Abdo, H.A.; Algabri, R. software Defect Prediction Based on Deep Representation Learning of Source Code from Contextual Syntax and Semantic Graph. IEEE Trans. Reliab. 2024, 73, 820–834. [Google Scholar] [CrossRef]
- Li, X.; Zhu, Z. Software Defect Detection Based on Feature Fusion and Alias Analysis. In Proceedings of the 2023 IEEE International Test Conference in Asia (ITC-Asia), Matsue, Japan, 12–14 September 2023; pp. 1–6. [Google Scholar] [CrossRef]
- Lu, P.; Hu, L.; Mitelpunkt, A.; Bhatnagar, S.; Lu, L.; Liang, H. A Hierarchical Attention-Based Multimodal Fusion Framework for Predicting the Progression of Alzheimer’s Disease. Biomed. Signal Process. Control 2024, 88, 105669. [Google Scholar] [CrossRef]
- Qiu, S.; E, B.; He, J.; Liu, L. Survey of Software Defect Prediction Features. Neural Comput. Appl. 2024, 37, 2113–2144. [Google Scholar] [CrossRef]
- Abdu, A.; Zhai, Z.; Algabri, R.; Abdo, H.A.; Hamad, K.; Al-antari, M.A. Deep Learning-Based Software Defect Prediction via Semantic Key Features of Source Code—Systematic Survey. Mathematics 2022, 10, 3120. [Google Scholar] [CrossRef]
- Hassan, F.; Farhan, S.; Fahiem, M.A.; Tauseef, H. A Review on Machine Learning Techniques for Software Defect Prediction. Tech. J. 2018, 23, 63–71. [Google Scholar]
- Rahman, F.; Devanbu, P. How, and Why, Process Metrics Are Better. In Proceedings of the 2013 35th International Conference on Software Engineering (ICSE), San Francisco, CA, USA, 18–26 May 2013; pp. 432–441. [Google Scholar] [CrossRef]
- Halstead, M.H. Elements of Software Science; Operating and Programming Systems Series; Elsevier Science Inc.: New York, NY, USA, 1977. [Google Scholar]
- Sun, Y.; Wu, F.; Wu, D.; Jing, X.-Y.; Sun, Y. Multi-View Learning Based on Product and Process Metrics for Software Defect Prediction. Appl. Intell. 2025, 55, 406. [Google Scholar] [CrossRef]
- Viet Phan, A.; Le Nguyen, M.; Thu Bui, L. Convolutional Neural Networks over Control Flow Graphs for Software Defect Prediction. In Proceedings of the 2017 IEEE 29th International Conference on Tools with Artificial Intelligence (ICTAI), Boston, MA, USA, 6–8 November 2017; pp. 45–52. [Google Scholar] [CrossRef]
- Ni, C.; Wang, W.; Yang, K.; Xia, X.; Liu, K.; Lo, D. The Best of Both Worlds: Integrating Semantic Features with Expert Features for Defect Prediction and Localization. In Proceedings of the ESEC/FSE ’22: 30th ACM Joint European Software Engineering Conference and Symposium on the Foundations of Software Engineering, Singapore, 14–18 November 2022; ACM: Singapore, 2022; pp. 672–683. [Google Scholar] [CrossRef]
- Lin, J.; Lu, L. semantic Feature Learning via Dual Sequences for Defect Prediction. IEEE Access 2021, 9, 13112–13124. [Google Scholar] [CrossRef]
- Fan, G.; Diao, X.; Yu, H.; Yang, K.; Chen, L. Deep Semantic Feature Learning with Embedded Static Metrics for Software Defect Prediction. In Proceedings of the 2019 26th Asia-Pacific Software Engineering Conference (APSEC), Putrajaya, Malaysia, 2–5 December 2019; pp. 244–251. [Google Scholar] [CrossRef]
- Abdu, A.; Zhai, Z.; Abdo, H.A.; Algabri, R.; Al-masni, M.A.; Muhammad, M.S.; Gu, Y.H. Semantic and Traditional Feature Fusion for Software Defect Prediction Using Hybrid Deep Learning Model. Sci. Rep. 2024, 14, 14771. [Google Scholar] [CrossRef]
- Zhou, C.; He, P.; Zeng, C.; Ma, J. Software Defect Prediction with Semantic and Structural Information of Codes Based on Graph Neural Networks. Inf. Softw. Technol. 2022, 152, 107057. [Google Scholar] [CrossRef]
- Poria, S.; Cambria, E.; Bajpai, R.; Hussain, A. A Review of Affective Computing: From Unimodal Analysis to Multimodal Fusion. Inf. Fusion 2017, 37, 98–125. [Google Scholar] [CrossRef]
- Gao, J.; Li, P.; Chen, Z.; Zhang, J. A Survey on Deep Learning for Multimodal Data Fusion. Neural Comput. 2020, 32, 829–864. [Google Scholar] [CrossRef]
- Zhao, F.; Zhang, C.; Geng, B. Deep Multimodal Data Fusion. ACM Comput. Surv. 2024, 56, 216. [Google Scholar] [CrossRef]
- Hung, S.-W.; Lo, S.-Y.; Hang, H.-M. Incorporating Luminance, Depth and Color Information by a Fusion-Based Network for Semantic Segmentation. In Proceedings of the 2019 IEEE International Conference on Image Processing (ICIP), Taipei, Taiwan, 22–25 September 2019; pp. 2374–2378. [Google Scholar] [CrossRef]
- Mohla, S.; Pande, S.; Banerjee, B.; Chaudhuri, S. FusAtNet: Dual Attention Based SpectroSpatial Multimodal Fusion Network for Hyperspectral and LiDAR Classification. In Proceedings of the IEEE/CVF Conference on Computer Vision and Pattern Recognition Workshops, Seattle, WA, USA, 14–19 June 2020. [Google Scholar]
- Zeng, C.; Zhou, C.Y.; Lv, S.K.; He, P.; Huang, J. GCN2defect: Graph Convolutional Networks for SMOTETomek-Based Software Defect Prediction. In Proceedings of the 2021 IEEE 32nd International Symposium on Software Reliability Engineering (ISSRE), Wuhan, China, 25–28 October 2021; pp. 69–79. [Google Scholar] [CrossRef]
- Mikolov, T.; Chen, K.; Corrado, G.; Dean, J. Efficient Estimation of Word Representations in Vector Space. arXiv 2013, arXiv:1301.3781. [Google Scholar] [CrossRef]
- Das, D.; Mathews, N.S.; Mathai, A.; Tamilselvam, S.; Sedamaki, K.; Chimalakonda, S.; Kumar, A. COMEX: A Tool for Generating Customized Source Code Representations. arXiv 2023, arXiv:2307.04693. [Google Scholar] [CrossRef]
- Grover, A.; Leskovec, J. node2vec: Scalable Feature Learning for Networks. In Proceedings of the KDD ’16; Association for Computing Machinery, New York, NY, USA, 13–17 August 2016; pp. 855–864. [Google Scholar] [CrossRef]
- Xu, J.; Wang, F.; Ai, J. defect Prediction with Semantics and Context Features of Codes Based on Graph Representation Learning. IEEE Trans. Reliab. 2021, 70, 613–625. [Google Scholar] [CrossRef]
- Sharma, T.; Kechagia, M.; Georgiou, S.; Tiwari, R.; Vats, I.; Moazen, H.; Sarro, F. A Survey on Machine Learning Techniques for Source Code Analysis. arXiv 2022, arXiv:2110.09610. [Google Scholar] [CrossRef]
- Okutan, A.; Yıldız, O.T. Software Defect Prediction Using Bayesian Networks. Empir. Softw. Eng. 2012, 19, 154–181. [Google Scholar] [CrossRef]
- Deng, J.; Lu, L.; Qiu, S. Software Defect Prediction via LSTM. IET Softw. 2020, 14, 443–450. [Google Scholar] [CrossRef]
- Uddin, M.N.; Li, B.; Ali, Z.; Kefalas, P.; Khan, I.; Zada, I. Software Defect Prediction Employing BiLSTM and BERT-Based Semantic Feature. Soft Comput. 2022, 26, 7877–7891. [Google Scholar] [CrossRef]
- Giray, G.; Bennin, K.E.; Köksal, Ö.; Babur, Ö.; Tekinerdogan, B. On the Use of Deep Learning in Software Defect Prediction. J. Syst. Softw. 2023, 195, 111537. [Google Scholar] [CrossRef]
- Nevendra, M.; Singh, P. A Survey of Software Defect Prediction Based on Deep Learning. Arch. Comput. Method. Eng. 2022, 29, 5723–5748. [Google Scholar] [CrossRef]
Disclaimer/Publisher’s Note: The statements, opinions and data contained in all publications are solely those of the individual author(s) and contributor(s) and not of MDPI and/or the editor(s). MDPI and/or the editor(s) disclaim responsibility for any injury to people or property resulting from any ideas, methods, instructions or products referred to in the content. |
© 2025 by the authors. Licensee MDPI, Basel, Switzerland. This article is an open access article distributed under the terms and conditions of the Creative Commons Attribution (CC BY) license (https://creativecommons.org/licenses/by/4.0/).