2.1. Mathematical Description
In a collaborative work environment, a set of employees completed several tasks. Each employee participated in at least two tasks, and each task involved at least two employees. Let
(indexed by
) represent the set of tasks, and
(indexed by
) represent the set of employees. For each task
, the set of employees working on that task is denoted by
. For each
and
, we denote the actual contribution ratio of
to
as
. These actual contribution ratios are unobservable, intending to reflect the truly deserved contribution degrees of employees in the task. For each task
, the sum of the actual contribution ratios of all employees involved in the task must equal 100%, i.e.,
,
. Each task has a total monetary reward
, which is to be distributed among the employees based on their contribution ratios. The actual reward that employee
should receive for task
, denoted by
, is determined by the actual contribution ratio
, which is calculated as:
Conventional Method. The conventional reward allocation method often requires employees to assess their own contribution ratios to the tasks that they have been involved in. In this case, the reward distribution is then based on each employee’s self-assessment of their contribution. In our study, we define this reward distribution approach as Conventional Method. Specifically, for each task
and employee
, the self-assessed contribution ratio of
to
is denoted as
, where this value reflects the employee’s perception of their effort and input to the task. Then, the reward allotted to
for
in Conventional Method, denoted by
, can be calculated as:
where
represents the total sum of the self-assessed contribution ratios for all employees involved in task
. This normalization ensures that the total of the self-assessed contribution ratios for all employees in each task equals 100%.
In Conventional Method, the reward distribution is based entirely on individual self-assessments of contributions. However, personal evaluations are inherently prone to biases, such as overestimating one’s own contribution ratios or underestimating one’s own efforts due to modesty. These biases can lead to inaccurate and unfair reward allotment, as the distribution depends solely on subjective judgment.
Method 0. To address the biases in self-assessment within collaborative settings, a state-of-the-art method introduces an evaluation trend bias [
9]. In this method, which is referred to as Method 0 in our study, each employee
is assigned a fixed evaluation trend bias
, where
indicates a tendency to underestimate their contributions, and
reflects a tendency to overestimate their contributions. Then, in this method, the corrected contribution ratio for employee
in task
, denoted as
, is adjusted by the evaluation trend bias as:
. The objective of this method is to modify the self-assessed contribution ratios by accounting for each employee’s individual bias tendency, ensuring the total contribution ratios within each task align as closely with 100% as possible. This alignment is critical, as the sum of all contribution ratios for any given task is inherently required to equal 100%. Specifically, the quadratic optimization model in Method 0 is formulated as follows:
The objective function (3) aims to minimize the total squared difference between the sum of modified contribution ratios for all employees in each task and 100%. Constraint (4) ensures that each employee’s estimated trend for their contribution ratios remains consistent across all the tasks they are involved in. Constraints (5) and (6) are the domains of the decision variables.
After solving the quadratic optimization model, the allotment rewards in Method 0, denoted by
, can be calculated based on the modified contribution ratios as follows:
Despite accounting for individual evaluation trend bias, Method 0 still relies on employees’ self-assessed contribution values, which cannot avoid comparisons between employees and may still significantly differ from actual contributions. To address this issue, it is necessary to adjust the existing award allotment methods of relying on personal evaluations.
In this study, we build upon the framework of Conventional Method by introducing a ranking mechanism to refine the reward distribution. In this framework, employees are asked to report their self-assessed contribution ratios across the different tasks they have participated in. These contribution ratios are then ordered by the employer to determine the order of each employee’s contribution ratio across all tasks that they have participated in, from highest to lowest. Specifically, based on the self-assessed contribution ratios , let represent the index of the task that employee considers to have the -th highest contribution ratio among all the tasks that they have participated in, e.g., corresponds to the task with the highest contribution ratio. The number of tasks that employee has participated in is denoted as ; then the ordered list for employee can be represented as . In this list, the indices in front correspond to tasks with contribution ratios greater than or equal to those behind. After ranking, only the ranking order is retained, and the specific self-assessed contribution ratio values provided by employees are discarded. This allows the employer to evaluate the employees’ relative contribution ratios across the tasks that they have participated in, rather than having the employees compare their performance to others, which helps reduce bias caused by external comparisons.
Specifically, we propose two methods, namely Method 1 and Method 2, which utilize the above ranking mechanism to adjust the self-assessed contribution ratios and improve the accuracy of reward distribution. To achieve this, we need to decide on modified contribution ratios for each employee in each task, which is denoted by
in Method 1 and
in Method 2. These ratios are modified to align with employees’ self-assessed task orders.
Table 1 provides a summary of the employed notations.
Method 1. The objective of this method is to modify the contribution ratios of employees for each task, ensuring that the total contribution ratios for each task sum as close as possible to 100%. We formulate the quadratic optimization model as follows:
The objective function (8) minimizes the total squared difference between the sum of modified contribution ratios for all employees in each task and 100%. Specifically, for each task, it calculates the squared difference between the sum of employees’ contribution ratios and 100%, and then sums these squared differences across all tasks. The goal is to minimize the total of these discrepancies, ensuring the total contribution ratios for each task are as close as possible to 100%. Constraints (9) ensure that the modified contribution ratios for each employee are consistent with their self-assessed rankings. Constraints (10) are the domains of the decision variables.
After solving the quadratic optimization model, the allotment rewards in Method 1, denoted by
, can be calculated based on the modified contribution ratios as follows:
While Method 1 improves upon Method 0 by incorporating a ranking mechanism to modify self-assessed contribution ratios, it still has certain limitations, as Method 1 treats the deviation in contribution ratios uniformly across all tasks, regardless of the differences in the available rewards of each task. While this method does ensure that the overall deviation of contribution ratios is minimized, it does not account for the fact that tasks with larger rewards could disproportionately affect the overall fairness of the reward distribution. To address this issue, we introduce Method 2, which refines Method 1 by incorporating the reward of each task into the optimization process.
Method 2. We revise the objective function of optimization model for Method 1 by incorporating differences in total task rewards. Specifically, the refining quadratic optimization model is formulated as follows:
The objective function (12) minimizes the total squared difference between the sum of the allocated rewards and the total available rewards. Specifically, for each task, it calculates the squared difference between the sum of all employees’ modified contribution ratios, multiplied by the task’s reward, and the total reward for that task. After calculating this term for each task, the model sums these squared differences across all tasks. The goal is to minimize the total discrepancy, ensuring that the reward distribution aligns as closely as possible with the total available task rewards. Constraints (13) guarantee that each employee’s modified contribution ratios align with their self-assessed orders. Constraints (14) are the domains of the decision variables.
After solving the revised quadratic optimization model, the allotment rewards in Method 2, denoted by
, can be calculated based on the new modified contribution ratios as follows:
Example 1. An illustrative example of the mathematical difference between Method 1 and Method 2.
Consider a scenario with two tasks (
,
) and two employees (
,
): task
has a reward of 1000 USD and task
has a reward of 5000 USD, i.e.,
,
. The actual contribution ratios are:
,
,
,
. Employees provide self-assessed contributions as follows:
,
,
,
. Then we can obtain the rankings from these self-assessed contribution ratios:
,
. For Method 1, We formulate the quadratic optimization model as follows:
For Method 2, We formulate the quadratic optimization model as follows:
It is notable that the constraints for both methods are the same. However, the objective functions are different. Method 1 focuses on adjusting the self-assessed contribution ratios to make both terms— and —approach 100%. In contrast, Method 2 takes into account the differences in rewards for each task. The two terms in Method 2’s objective function can be seen as weighted, where the model prioritizes aligning the higher reward task’s contribution ratio closer to 100%. Thus Method 2 tend to make the term approach 100%, while making deviate further from 100%.
2.2. Evaluation Metrics
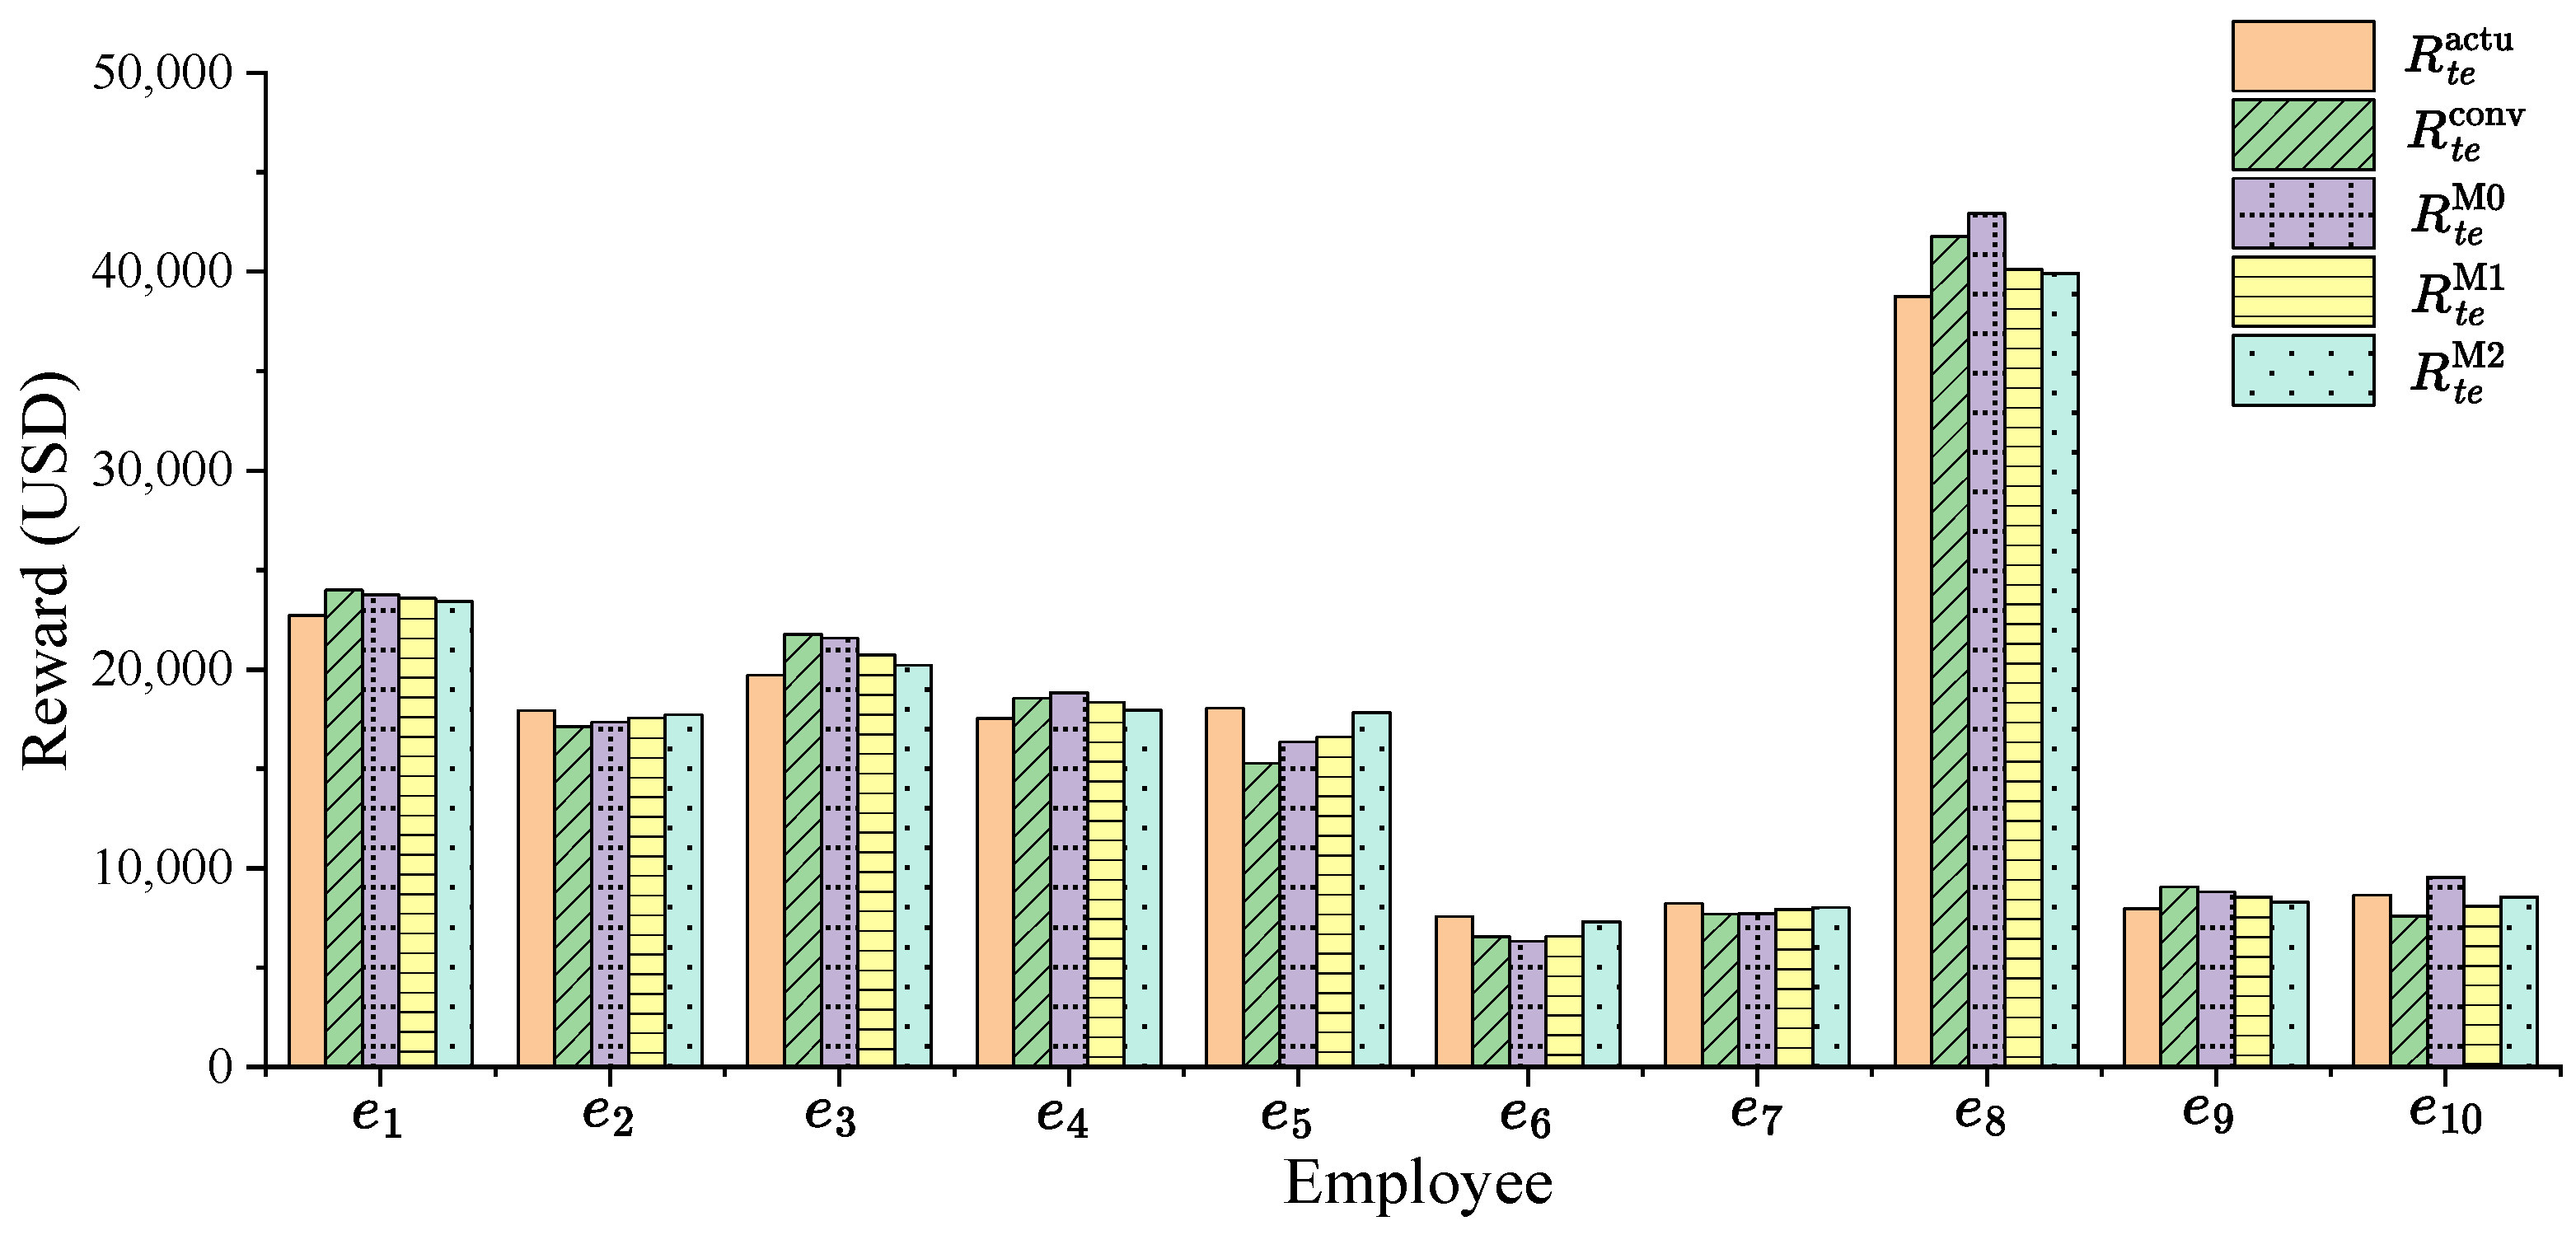
To assess the effectiveness of the proposed methods and compare them against conventional approaches, we utilize the sum of squared errors (SSE). For comparison, we define the baseline loss values for Conventional Method, Method 0, Method 1, and Method 2 based on the total squared deviations of each employee’s allotted reward from their actual deserved reward across all tasks that they have participated in, denoted as
,
,
, and
, respectively. These losses are calculated as follows:
Then, compared to Conventional Method, we define the loss reduction percentage for each employee
using Method 0, Method 1, and Method 2, denoted by
,
, and
, respectively, which can be calculated as follows:
Positive values of
,
, or
mean that, for employee
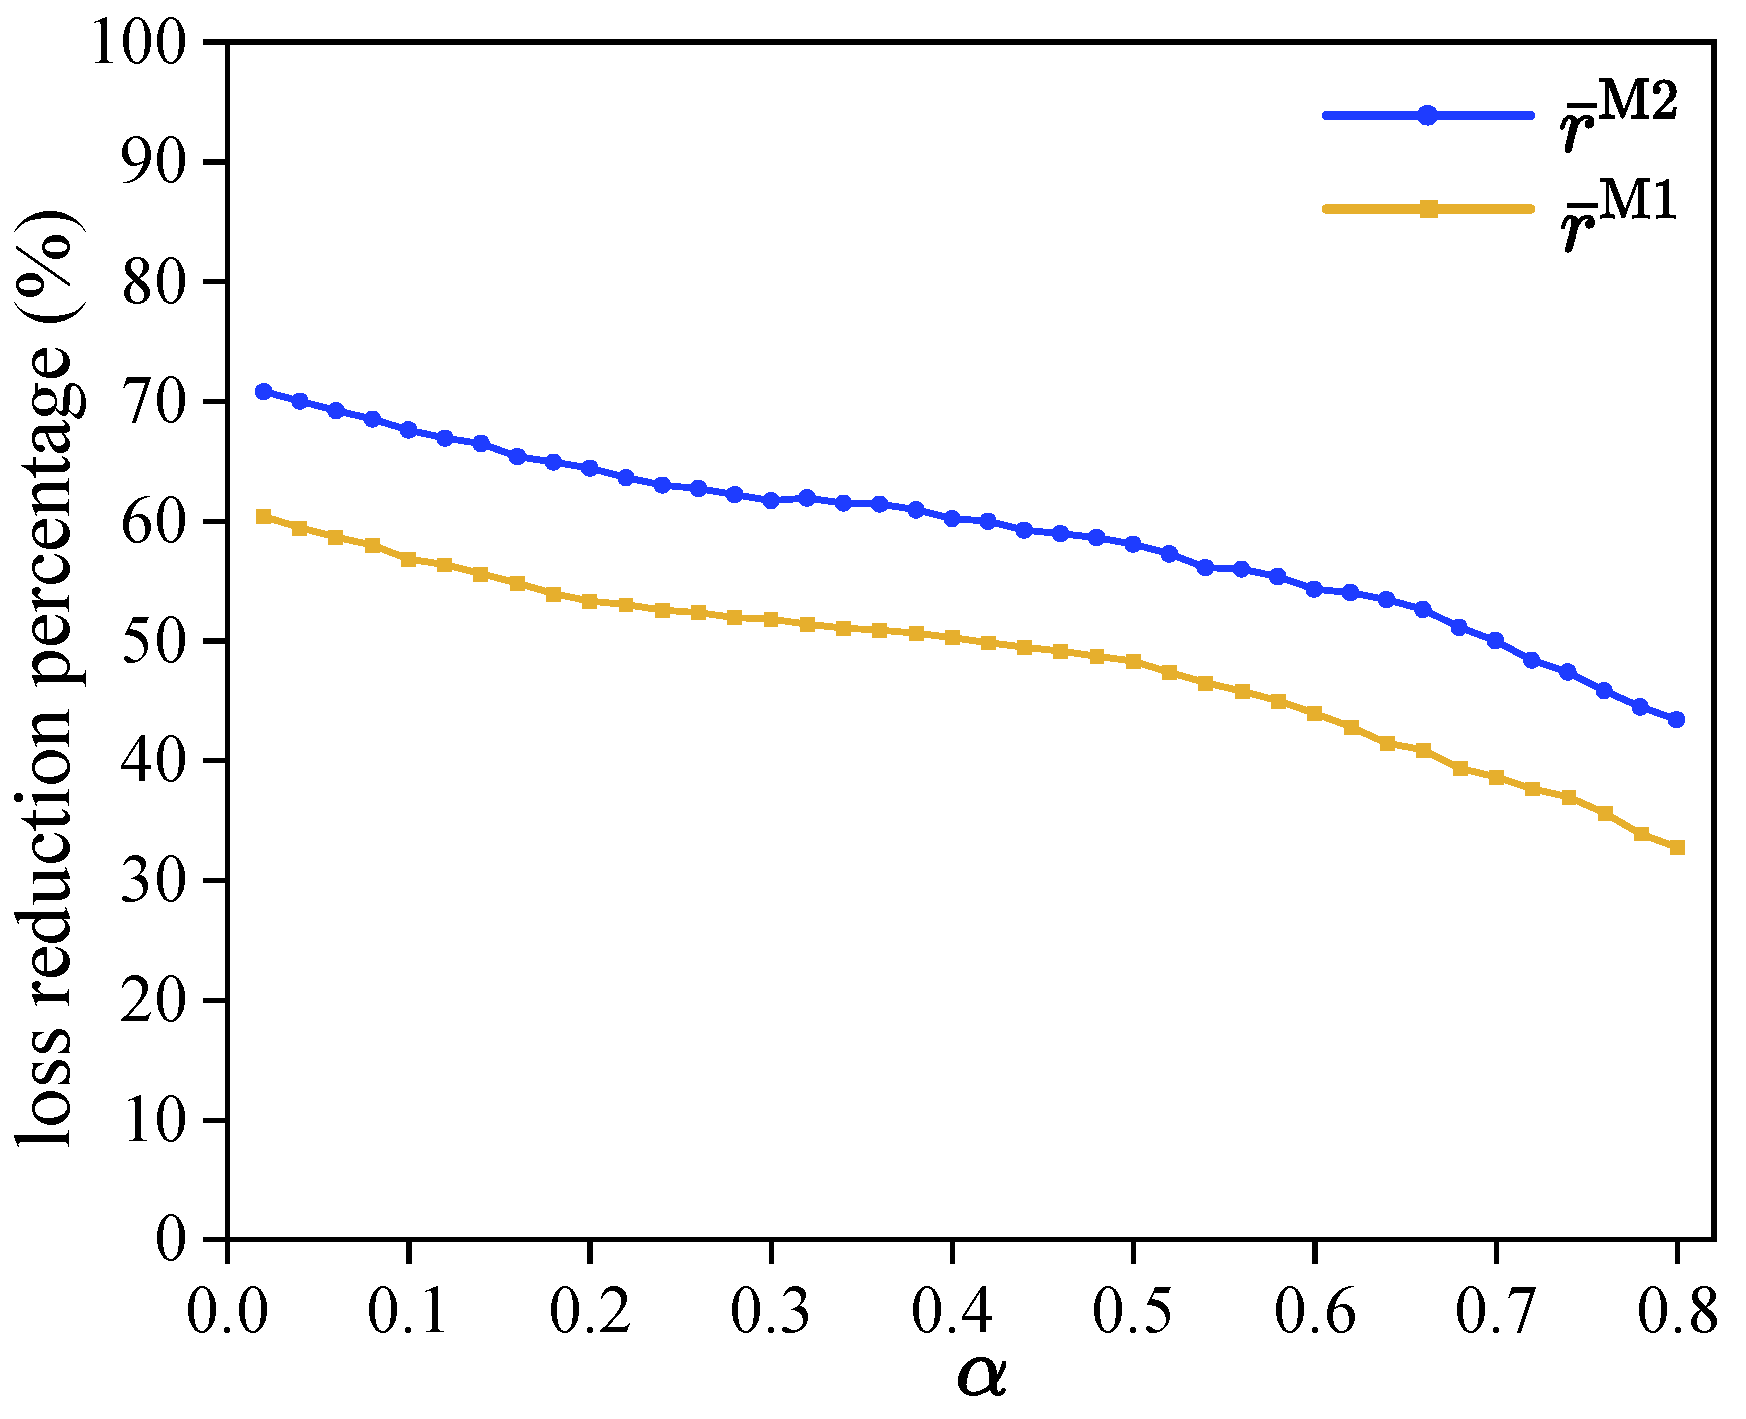
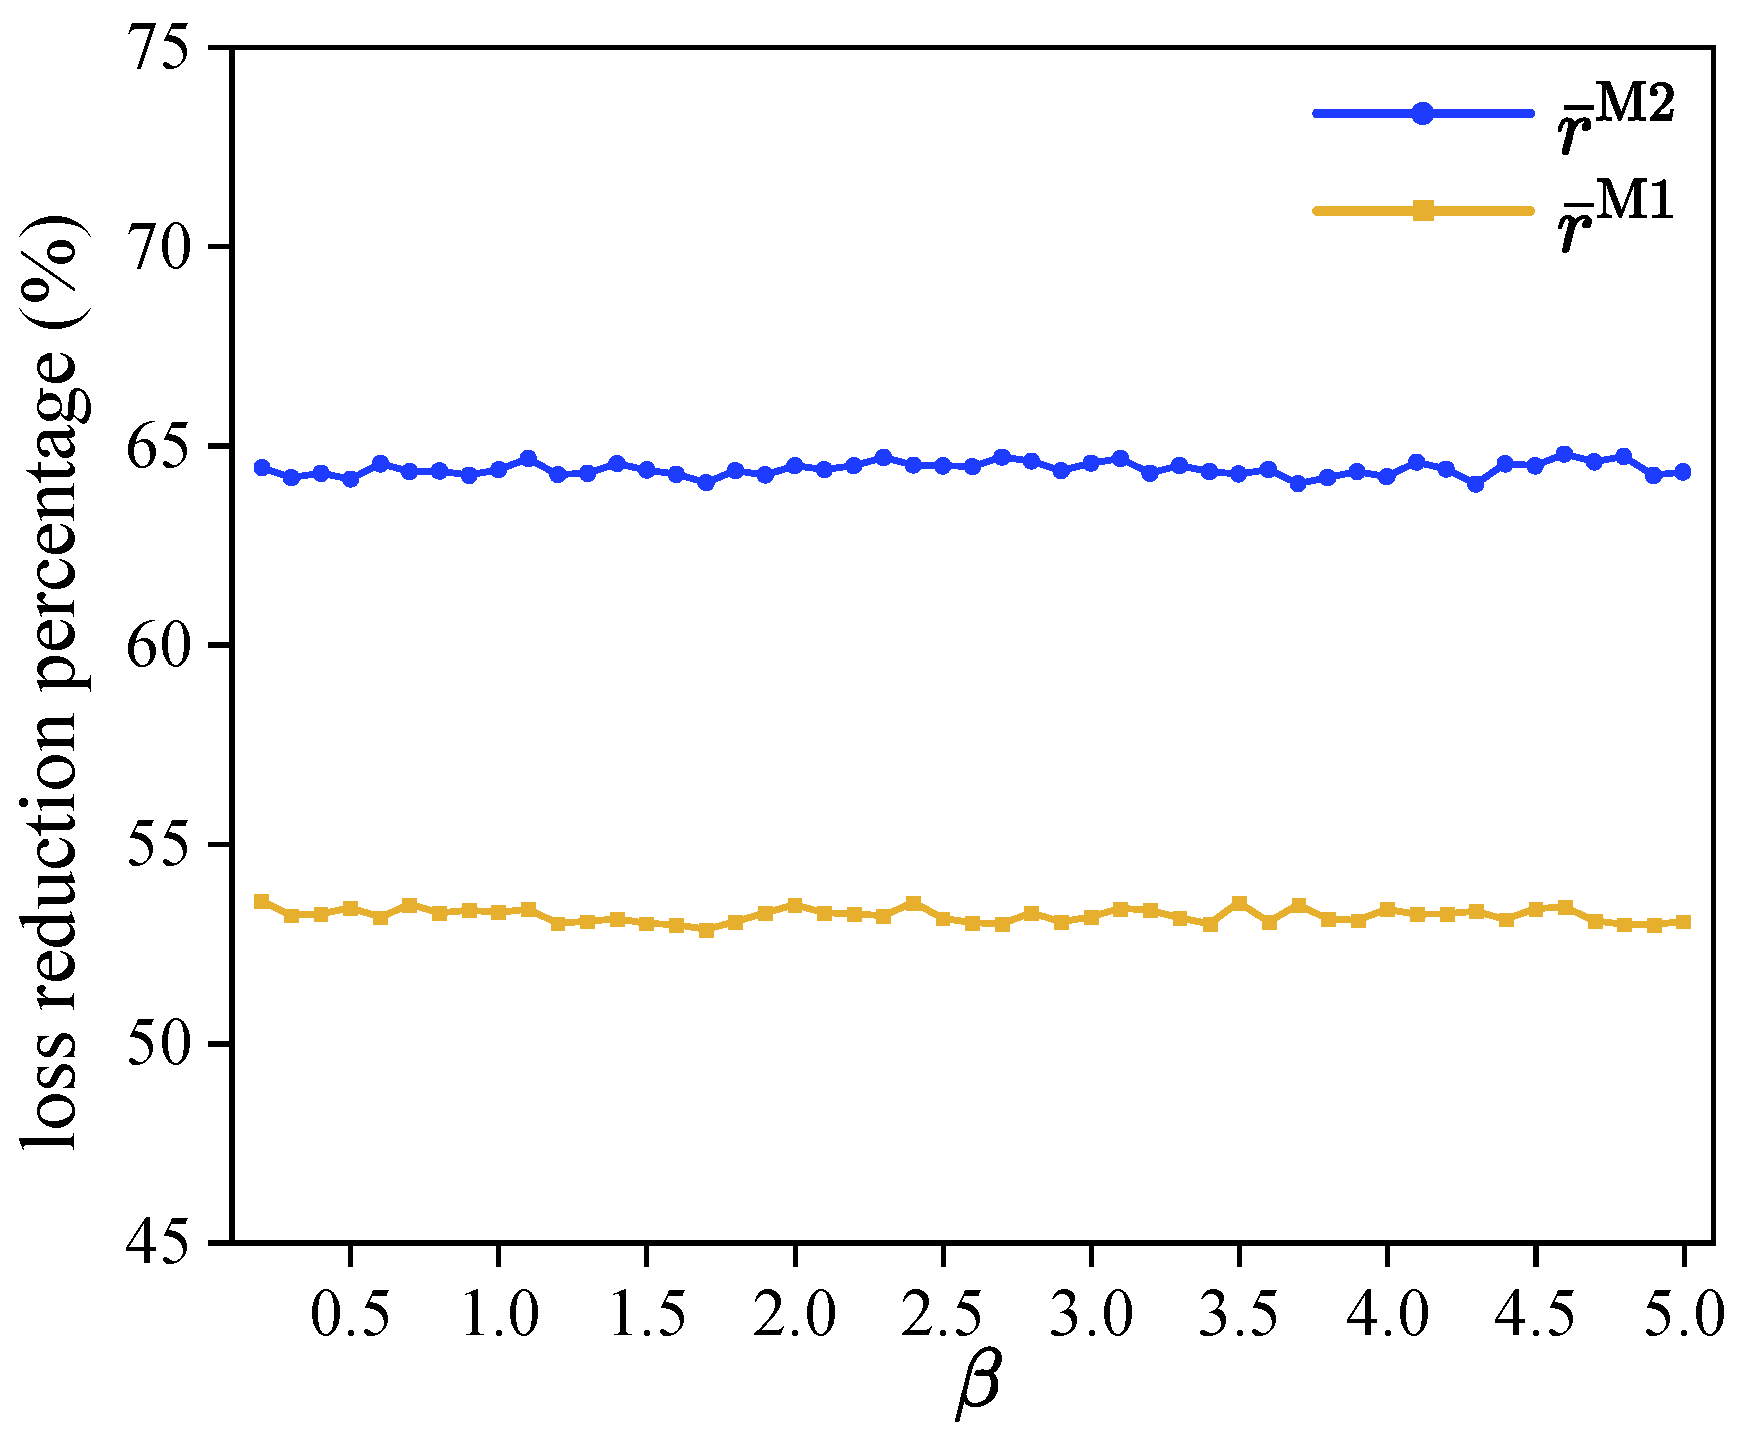
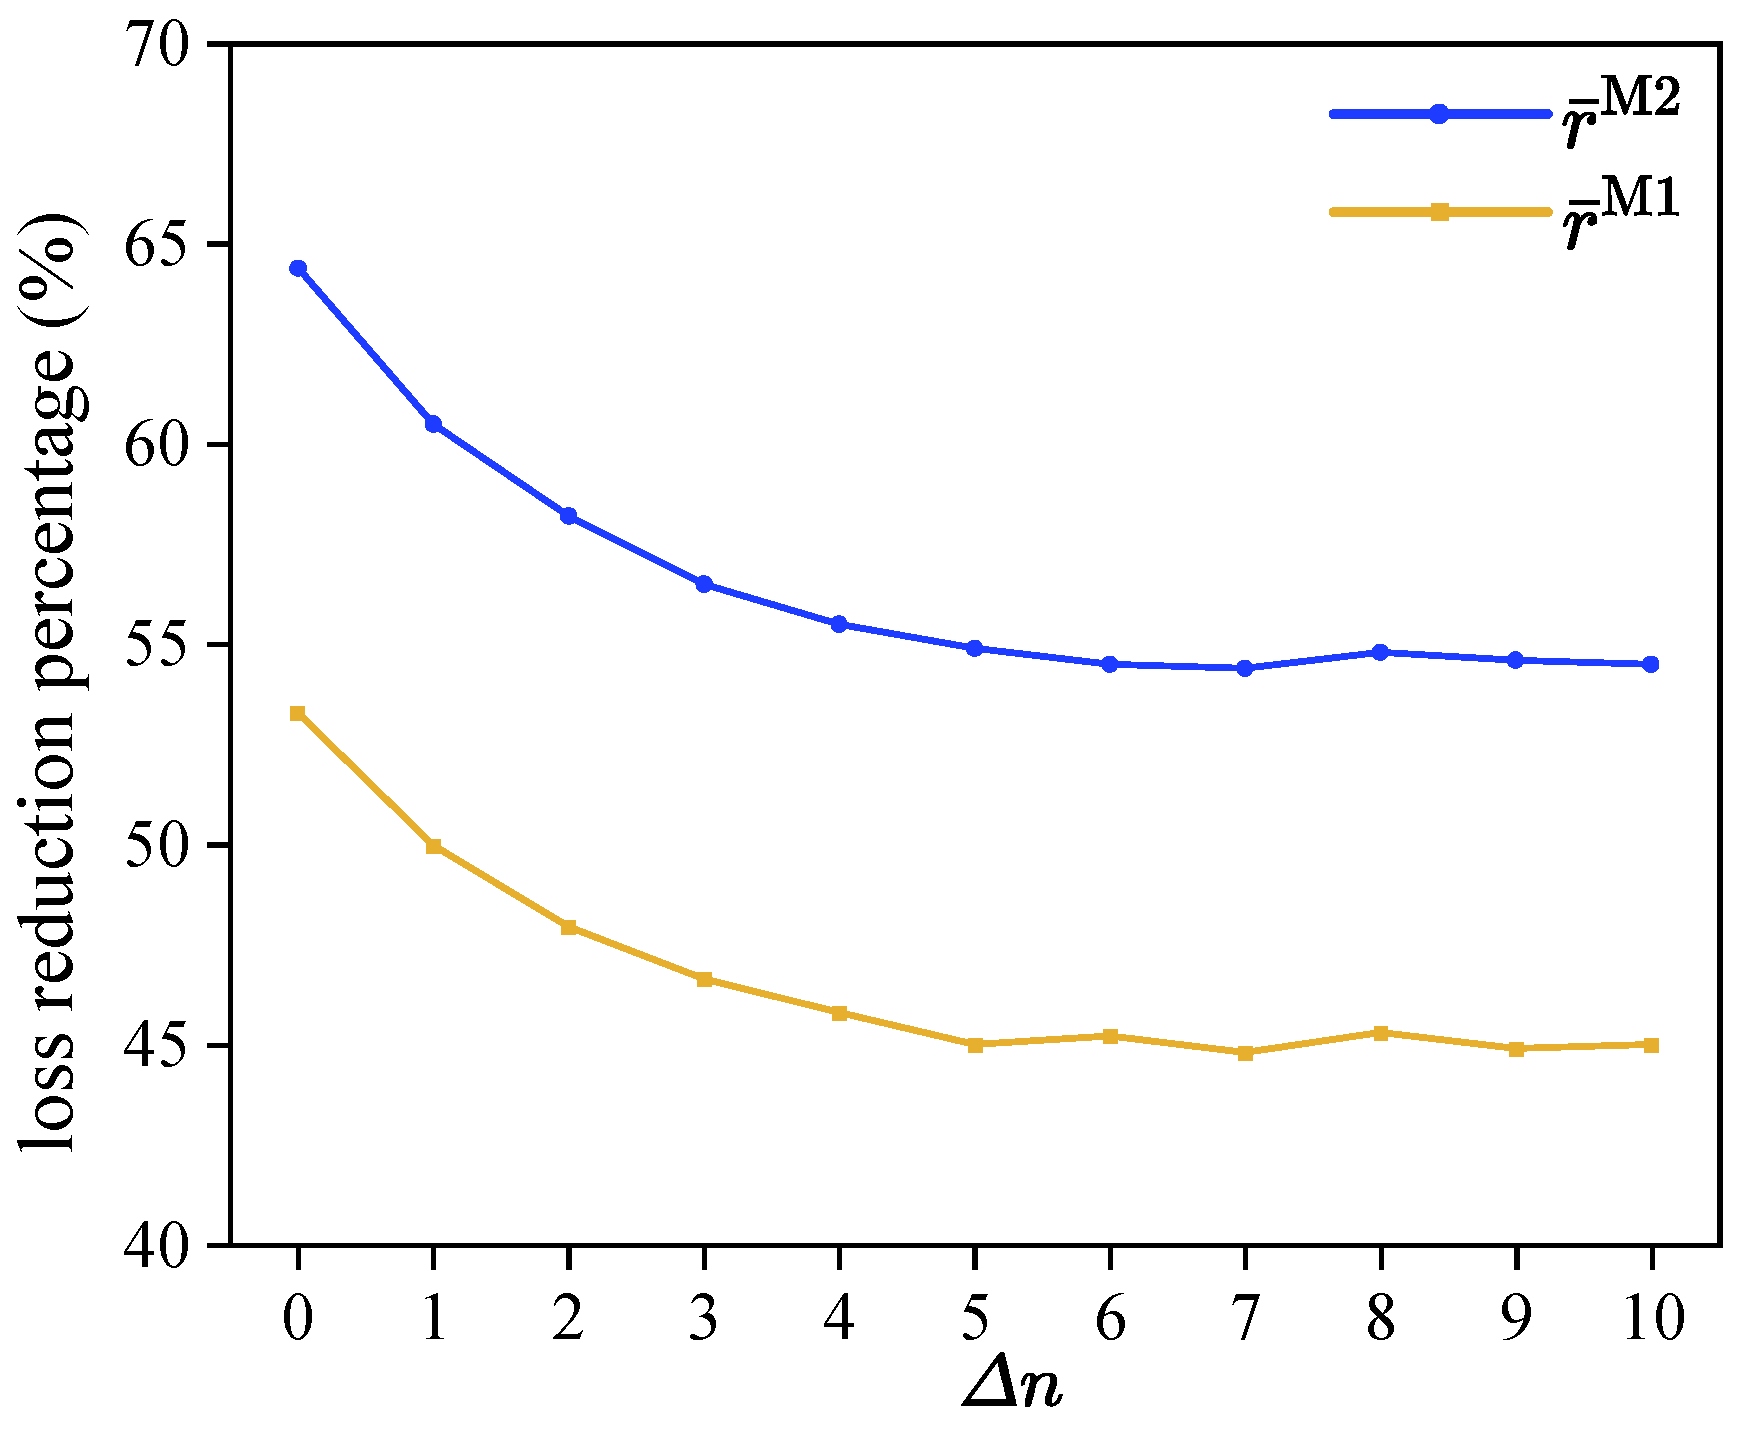
, the reward allocations in Method 0, Method 1, or Method 2 are closer to the actual rewards compared to Conventional Method. To calculate the overall improvement, we average the loss reduction percentages across all employees. Specifically, the overall loss reduction for Method 0, Method 1, and Method 2, denoted as
,
, and
, can be calculated as:
The Formulas (22)–(25) represent the sum of squared deviations between the rewards allotted to each employee and their actual deserved reward under each method. Squaring the differences amplifies larger misalignments, ensuring that significant discrepancies between the allocated and actual rewards are given more weight in the evaluation. In Formulas (26)–(28), we calculate the loss reduction percentage for each employee for Method 0, Method 1, and Method 2 compared to Conventional Method. This quantifies how much closer the reward allocation in the three methods is to the actual rewards. Larger values of , , and indicate more significant improvements in aligning the allocated rewards with the actual deserved rewards, meaning that the methods are more effective at minimizing the discrepancies. Finally, the overall loss reduction for Method 0, Method 1, and Method 2 is calculated by averaging the individual loss reductions across all employees, as shown in Formulas (29)–(31). This gives a comprehensive measure of the methods’ overall effectiveness in improving reward distribution fairness across the entire system.


