1. Introduction
To meet the growing global demand for a stable and affordable energy supply, the industry is increasingly challenged to develop technologies capable of withstanding a new era of complex drilling conditions. Given the abundance of underground resources such as oil, natural gas, and coal, the safe and efficient development of these energy sources has become a priority worldwide. As a result, many countries are continuously advancing drilling technologies to enhance performance, safety, and sustainability [
1]. Drilling technology was first used in the oil mining industry, and now, MWD technology is widely used in the mining industry [
2]. MWD provides various types of drilling parameters in the process of coal mining [
3], and the drilling parameters that can be captured include drilling depth, drilling pressure, rotational speed, torque, and thrust [
4]. In field applications, drilling parameters are associated with rock parameters, which can provide a data basis for rock quality evaluation and stability evaluation [
5] to estimate rock mass conditions [
6]. During drilling, the measurement-while-drilling system captures complex data and generates a large number of data sets that are not easy to process [
7]. How to effectively use the data is an important prerequisite for improving the efficiency of measurement while drilling [
8] so as to achieve the purpose of accurate dynamic monitoring [
9].
Monitoring while drilling is a key task in mining engineering. Andrii Velychkovych [
10] used damping to reduce the risk of vibration and shock. Mehrbod Khoshouei [
11] combined vibration acoustic signals with drilling rig parameters to monitor drilling-specific energy (SE). Chunhua Lu [
12] proposed a system to receive signals from adjacent wells, which effectively improves the signal strength and reduces the occurrence of faults. The above research realizes signal reception by transmitting the cutting-rock-breaking parameters of the drill bit during the drilling process of the drilling rig [
13] and then carries out prediction while drilling. Therefore, some scholars have studied the rock-breaking mechanism of the drill bit from the root and revealed the basic theory of MWD technology [
14]. Weiji Liu [
15] analyzed the rock-breaking mechanism of the PDC bit and studied the mechanical interaction between the PDC bit and rock. Bei Jiang [
16] deduced the relationship between digital borehole parameters (DDP) and c-φ parameters (c is cohesion, φ is internal friction angle) according to the principle of rock-cutting limit equilibrium. Haoteng Wang [
17] established a cutting energy model to describe the relationship between rock-cutting energy characteristics and mechanical parameters. Mingming He [
18] studied the anisotropy of drilling mechanical properties during rock cutting to better evaluate the mechanical properties of rocks in storage environments. At present, the research focus of the cutting mechanism is on bit-rock interaction [
19,
20], but the basic theoretical relationship between bit drilling parameters and rock parameters in the drilling process needs to be clarified.
Most scholars have used laboratory tests [
21] and numerical simulations [
22] to construct the relationship between rock parameters and drilling parameters for LWD monitoring technology. Guanghui Wang [
23] constructed a drilling model to reveal the correlation between cuttings’ weight and rock mass stress during drilling. Yanlong Li [
24] improved the drilling process monitoring (DPM) system and established the mathematical relationship between drilling efficiency and drilling parameters. Sajjad Kalantari [
25] proposed a model for estimating rock parameters using drilling data. Feng Shangxin [
26] conducted drilling tests using a rotary non-percussive drilling rig to study the effects of the drilling parameters, contrast energy (SE), and drilling rate (ROP) and rock properties. Yi-Ming Li [
27] extracted the three-dimensional parameter field of rock based on the numerical control drilling parameters by establishing the damage model. It is worth noting that the above research only explores the relationship between drilling parameters and rock parameters on the surface layer [
28] and does not deeply analyze and monitor the changes of original data during drilling [
29].
With the development of machine learning technology, more and more scholars combine machine learning theory with rock strength prediction while drilling [
30]. Artificial neural networks have been widely used [
31]. Osama Siddig [
32] used more than 2200 data points to develop and test artificial neural networks and build related models. The RBF neural network shows strong generalization ability [
33]. Mingqiang Wei [
34] established the optimal RBF model and proposed a new data-driven rock mechanic parameter (RMP) prediction method. Mingming He [
35] applied the deep convolutional neural network (DCNN) technology to the estimation of rock mechanic parameters during continuous drilling. Most of the previous work has focused on using machine learning models to express the relationship between rotational speed and uniaxial compressive strength [
36,
37], and less attention has been paid to other drilling parameters and rock parameters.
In this paper, uniaxial compression, uniaxial tensile, and triaxial compression tests of rock are carried out to accurately obtain various parameters of rock. Various types of sensors (Kenaiwo, Nanjing, China) were developed, a small drilling rig platform was built, and different speeds were used to drill the same kind of rock-gneiss under the same confining pressure conditions, and various parameters in the drilling process were collected at the same time. By observing the variation of drilling parameters during drilling, the influence of rotation speed on drilling efficiency and various parameters is analyzed. According to the data collected by the sensor, the rock-breaking information is fully captured. The coupling relationship of drilling parameters is analyzed by the Pearson method, a quantitative model of ‘drilling parameters-lithology’ was established, and the experiment of drilling different-strength rocks under the same drilling speed is supplemented. The correlation between rock mechanic parameters and drilling parameters is studied, and the feasibility of a dynamic monitoring scheme of the drilling rig is discussed.
2. Study Objectives
In view of the challenges faced by MWD technology in the process of mining drilling, the internal correlation mechanism between drilling parameters and rock mechanical parameters was systematically studied through the self-built small drilling rig experimental platform, aiming to improve the perception and analysis ability of the MWD system under complex geological conditions.
This study significantly improved MWD performance from the following three aspects:
1. Signal decoupling: Through the systematic experiment of fixed lithology (gneiss), the quantitative influence of rotational speed change on MWD core parameters such as torque and drilling speed was clarified, which provided a theoretical basis for distinguishing ‘lithology change’ and ‘operation parameter influence’ and effectively reduced the risk of MWD data misreading.
2. Improvement of lithology identification accuracy: A high-precision quantitative model of drilling parameters and rock strength parameters was established, especially the strong correlation between torque and tensile strength (R2 = 0.9966), which provided a reliable algorithm for real-time inversion of rock mass mechanical parameters based on MWD data.
3. Mechanism clarification: In-depth analysis of the internal coupling relationship between the corresponding drilling parameters promoted the optimization of drilling parameters in practical engineering applications, avoided energy loss and rig wear, and promoted the development of mining drilling from empirical operation to an intelligent and refined direction.
3. Equipment and Methods
3.1. Drilling Platform Construction
Large drilling rigs are often used in the mining of underground work in coal mines [
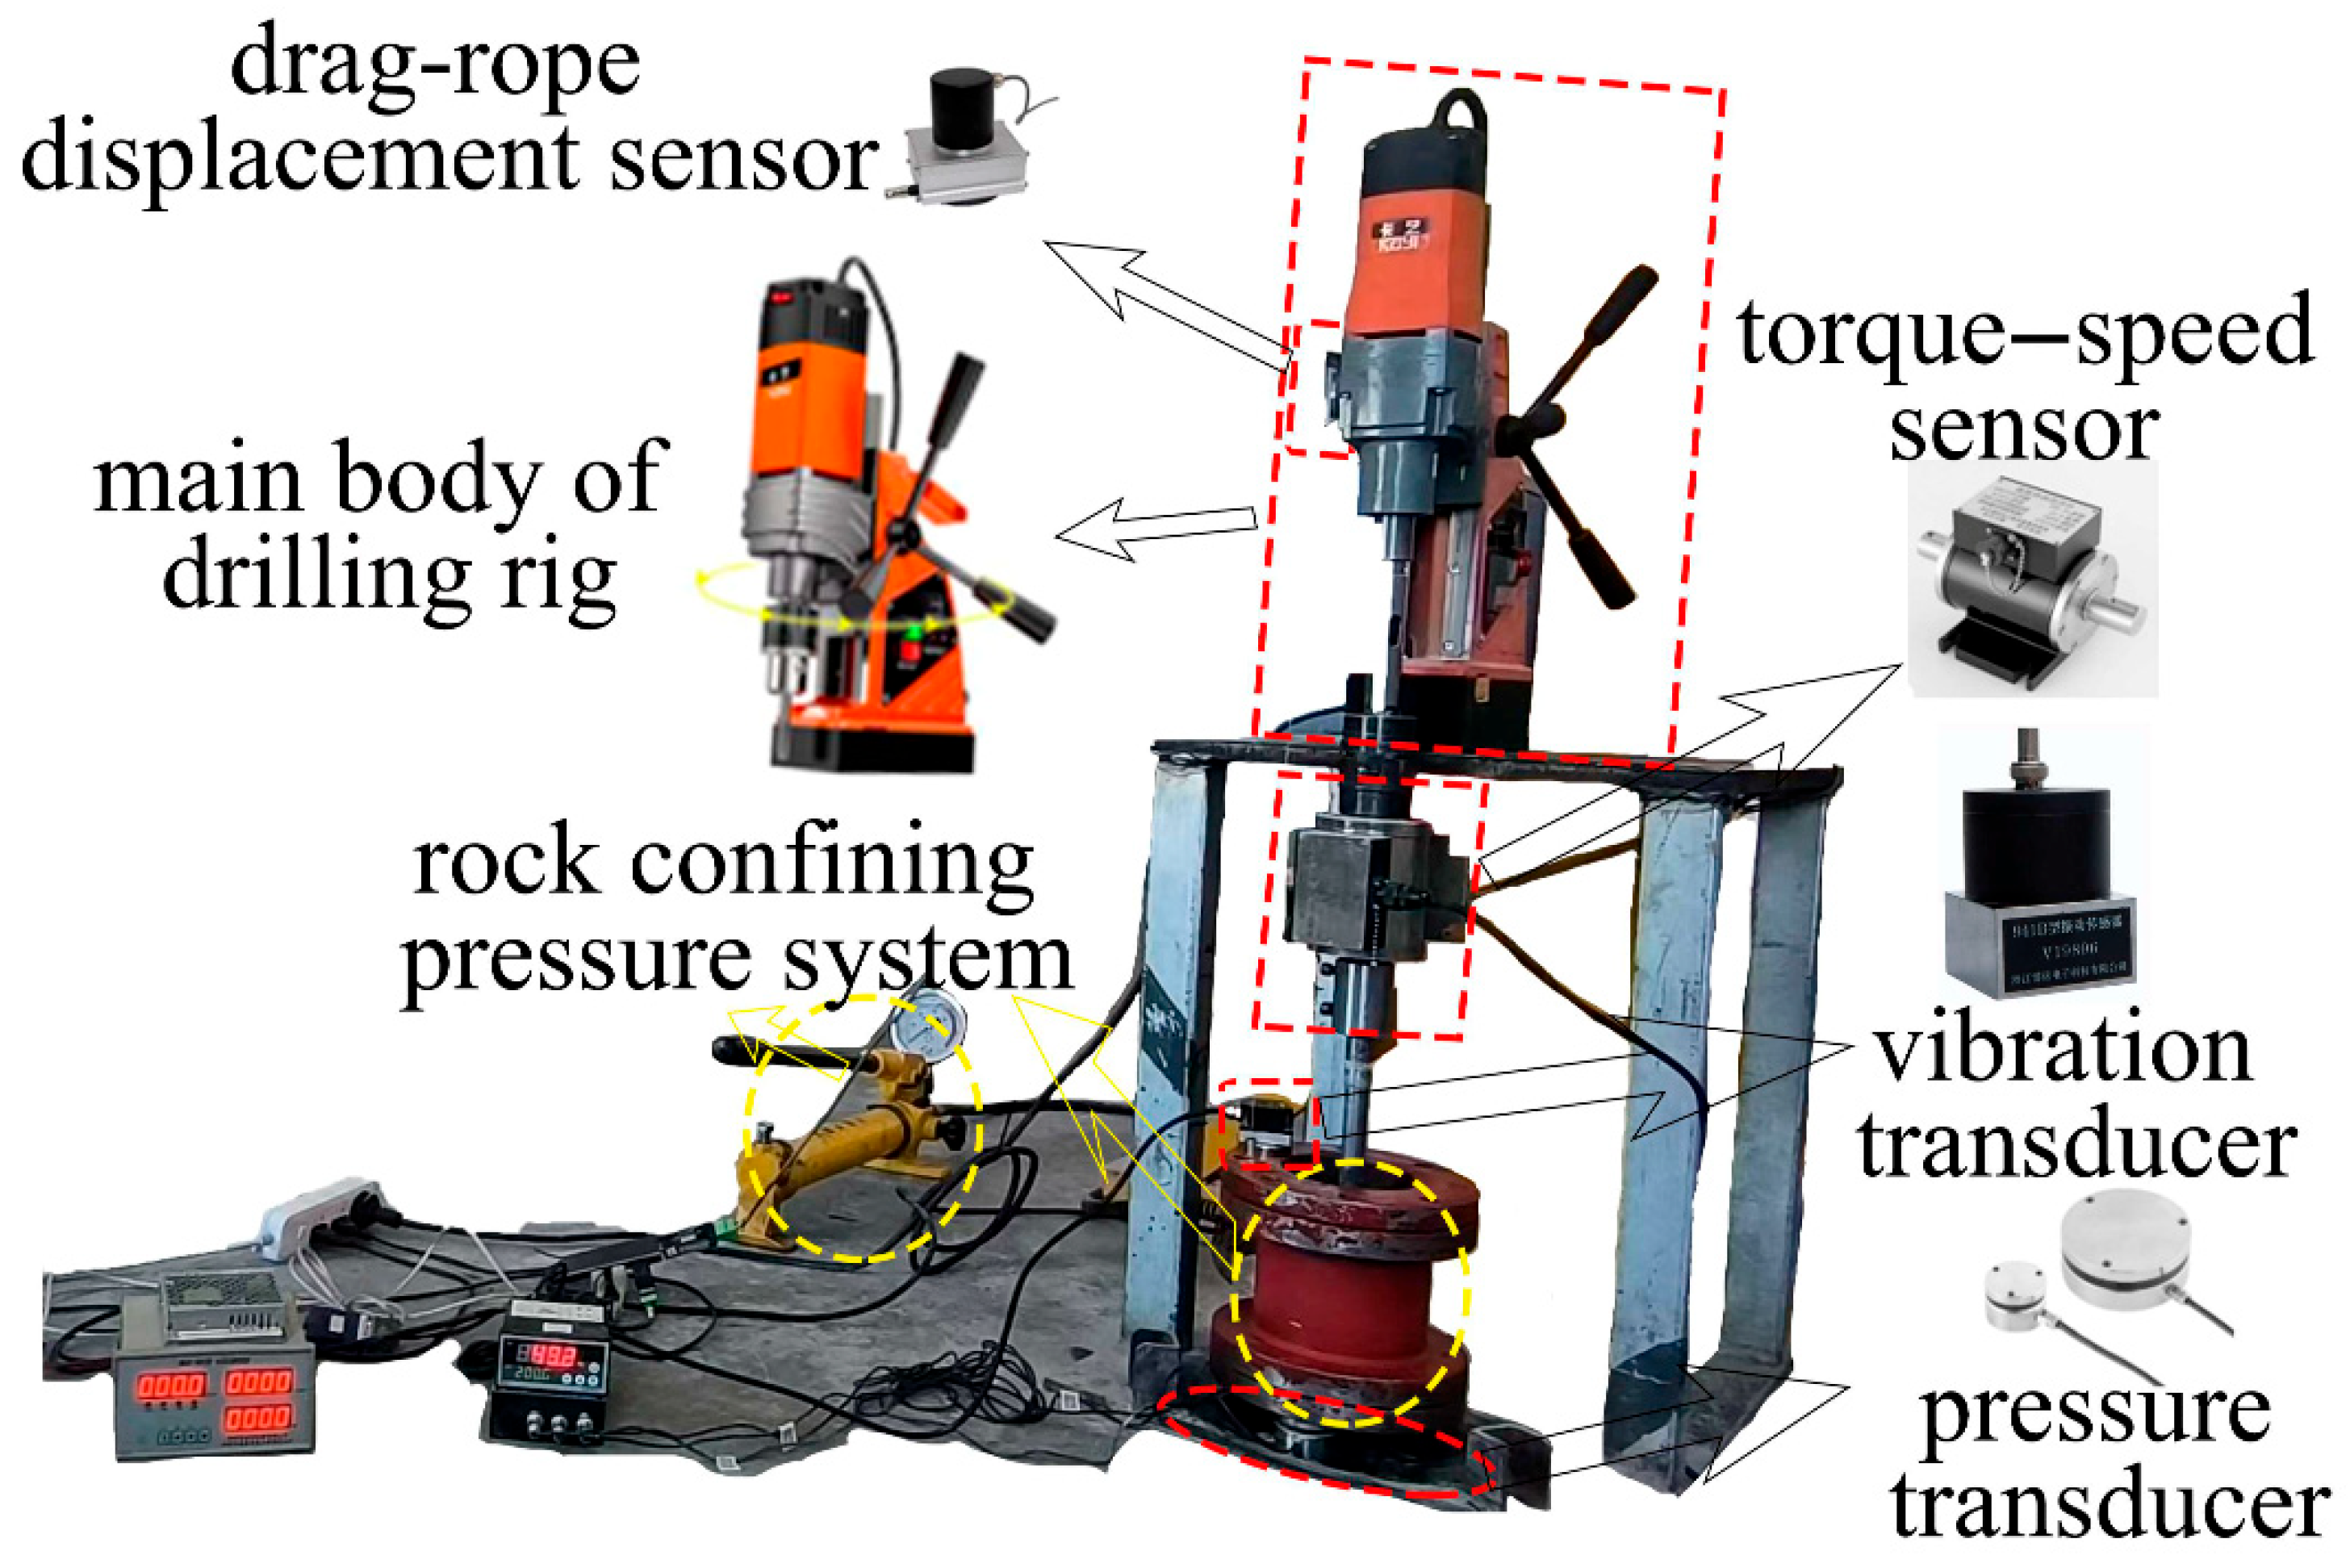
29]. In order to make the experiment more accurate, a small drilling rig was developed to explore the relationship between drilling parameters and rock parameters. The experimental platform is shown in
Figure 1. The small drilling platform was mainly based on the D8860RE magnetic drill (Carding Tools, Nantong, China), and the data monitoring system was added, which was equipped with the rock confining pressure system. The drilling rig mainly included a power system, a control system, a guide rail drilling system, and an ultra-strong suction magnetic seat device. The technical parameters are shown in
Table 1. The rotation speed of the drilling rig was generated by the power system, and the speed control button of the adjustment control system realized the stepless speed regulation. The drill bit was controlled to move on the guide rail by rotating the tripod handle, and the test piece was drilled. It should be noted that this drilling platform belonged to semi-automatic control. The data monitoring system was manually opened before the drilling started, and the drilling pressure was manually controlled during the experimental drilling process. After the drilling was completed, the stop button was pressed, the data monitoring system was closed, and the drill bit was controlled to rise up along the guide rail.
The dynamic digital characterization of drilling rig data is very important in the study of the relationship between drilling parameters and rock parameters [
38]. The data monitoring system included a cable displacement sensor, a dynamic torque–speed sensor, a three-axis vibration sensor, a pressure sensor, and its corresponding data collection software (AIC MAGNETICS Ltd., Shanghai, China). The experimental platform was equipped with multiple types of sensors, which could dynamically monitor drilling parameters during drilling and realize multi-parameter precision monitoring. The sensor was easy to install and disassemble, and the data transmission was rapid and accurate. The technical parameters are shown in
Table 2.
The displacement sensor was installed on the main body of the drilling rig. During the drilling process, the change of the drill pipe drove the change of the rope of the displacement sensor. The dynamic torque–speed sensor was installed on the drill pipe to monitor the rotational torque exerted by the drill bit on the rock and the rotational speed of the drill bit during the rotation process [
39]. The device outputted 60 pulses per rotation cycle. The sensor monitoring software recorded dynamic data with high precision. The three-axis vibration sensor was magnetized on the rock confining pressure system. The sensor converted the vibration mechanical quantity of the rock during the drilling process into an electric quantity [
40], and the acquisition system monitored the dynamic displacement change of the rock confining pressure system. Three pressure sensors were placed at the bottom of the rock to prevent the instability of the center of gravity. The uniform placement of pressure sensors can effectively measure the force exerted by the drill bit on the rock. The system was equipped with instruments to display the value directly, which was convenient for manual rotation of the tripod handle to control the drilling pressure during the experiment.
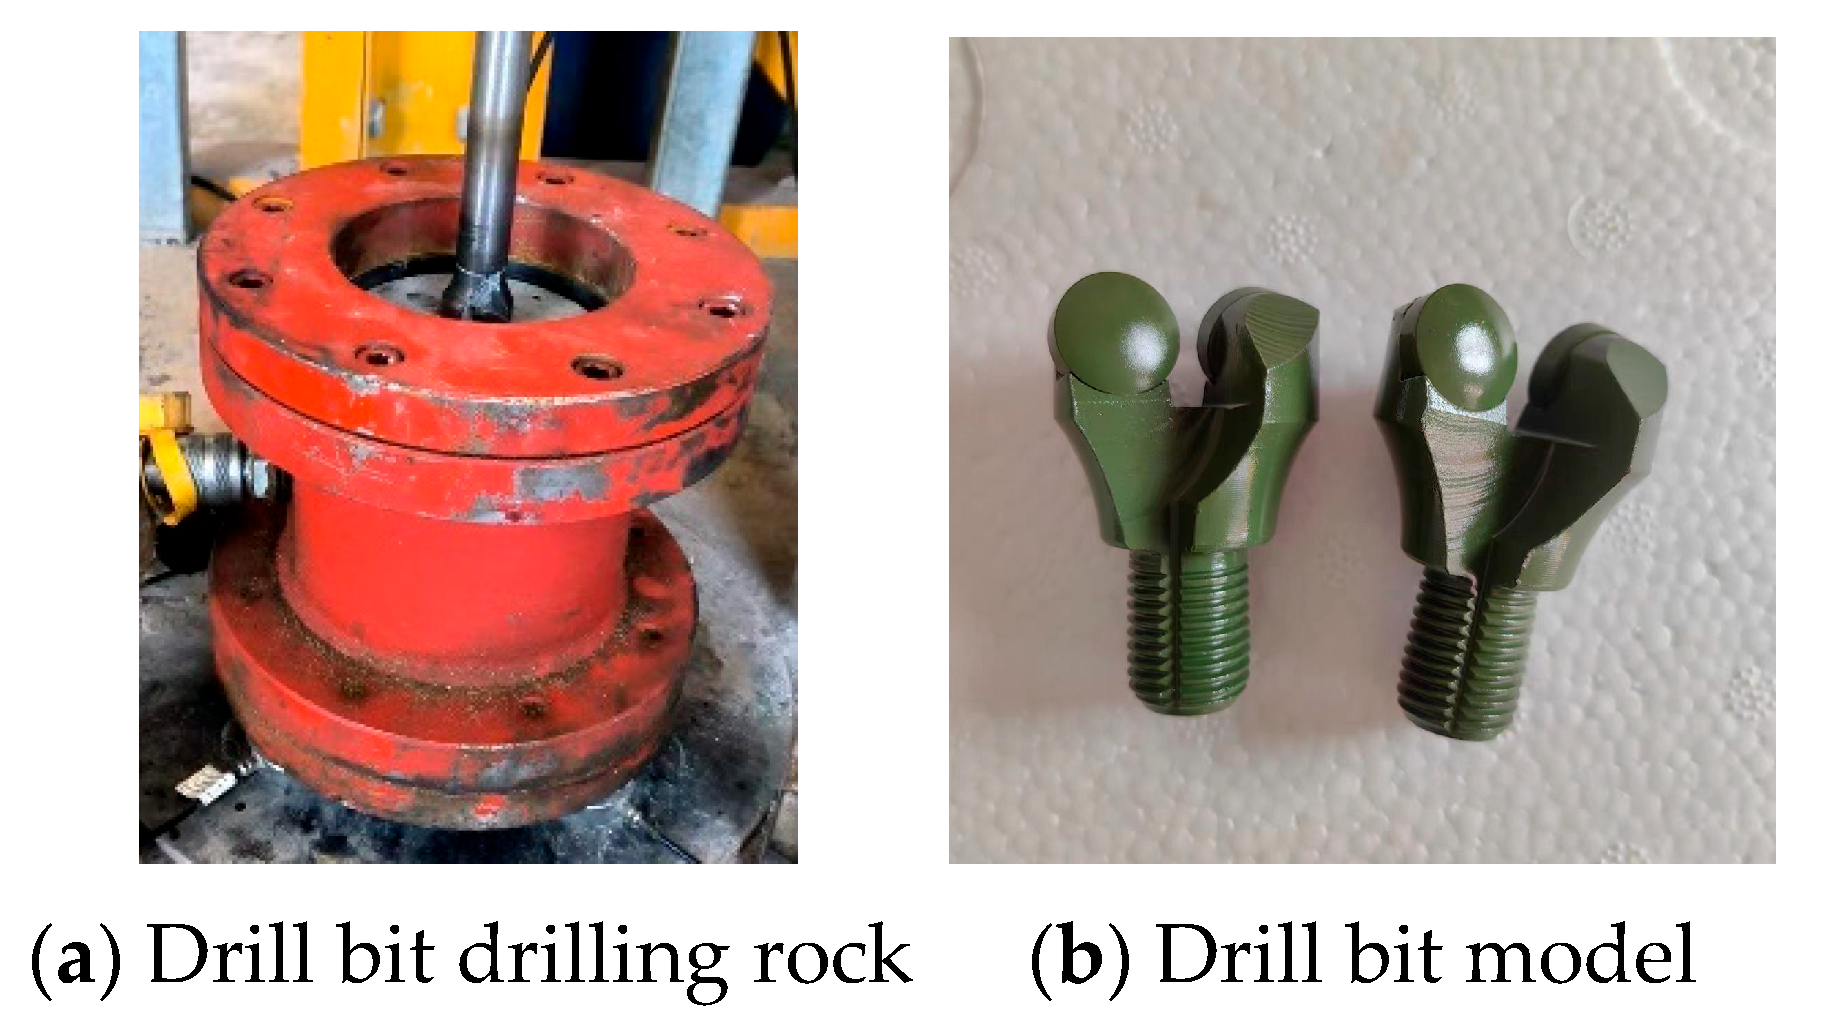
The drilling rig adopted a double-wing PDC bit with a diameter of 28 mm. The PDC tooth was composed of a cemented carbide matrix and a polycrystalline diamond layer, as shown in
Figure 2. It has high wear resistance and stability [
41,
42]. The drill bit drilled and cut the original rock mass. The rock cracked at any point around the PDC tooth, and the crack expanded to the surrounding area to form debris.
The rock confining pressure system consisted of a hollow steel cylinder with a detachable end and its supporting equipment. A polyurethane rubber sleeve was installed in the device, which contained a U-shaped seal to form a pressurized chamber for the hydraulic fluid. The tensile strength of the rubber film was more than 38 MN/m
2, and the hardness was 95. An inlet with a 9.525 mm quick connection and an outlet with a plug were installed for the saturation of the pressurized chamber, as shown in
Figure 3. Before the experiment, the cylindrical rock sample was inserted into the chamber through the closed membrane. Using a manual pump, the cylinder was immersed in hydraulic oil, which was retained in the annular space formed between the rubber film and the cylinder. The dashboard was observed and stopped after applying 2 MPa confining pressure. Each end of the rubber film was integrated with a ‘U’-shaped seal and was equipped with a rebar cylinder. This operation made it possible to fix the rock during the drilling process.
3.2. Materials and Rock Mechanic Parameter Experiment
In practical engineering, underground rock is often in a triaxial stress state. In order to accurately obtain rock mechanical parameters, uniaxial compression test, uniaxial tensile test, and triaxial compression test were carried out. In this experiment, the surrounding rock of the Calchaer fluorite mine was selected as the experimental material. The surrounding rock of the ore body belonged to gneiss, which exists in a large number of underground mines and is typical. The collected rock was made into a φ50 × 100 mm sample to carry out uniaxial compression test and triaxial compression test, and the φ50 × 25 mm sample was subjected to uniaxial tensile test.
The uniaxial compression test adopted the mine rock mechanical property test system. The rock uniaxial compression test data are shown in the summary
Table 3, and the uniaxial compressive strength calculation formula is shown in Formula (1):
where
Rc—uniaxial compressive strength, MPa;
Pmax—maximum failure load of rock specimen, N;
A—compression area of specimen, mm2.
The uniaxial tensile test adopted the Brazilian splitting method. The uniaxial compression test data of the rock are shown in
Table 4. The uniaxial tensile strength calculation formula is shown in Formula (2):
where
σt—uniaxial tensile strength of rock specimen, MPa;
Pmax—failure load, N;
D, H—the diameter and height of the specimen are, respectively, mm.
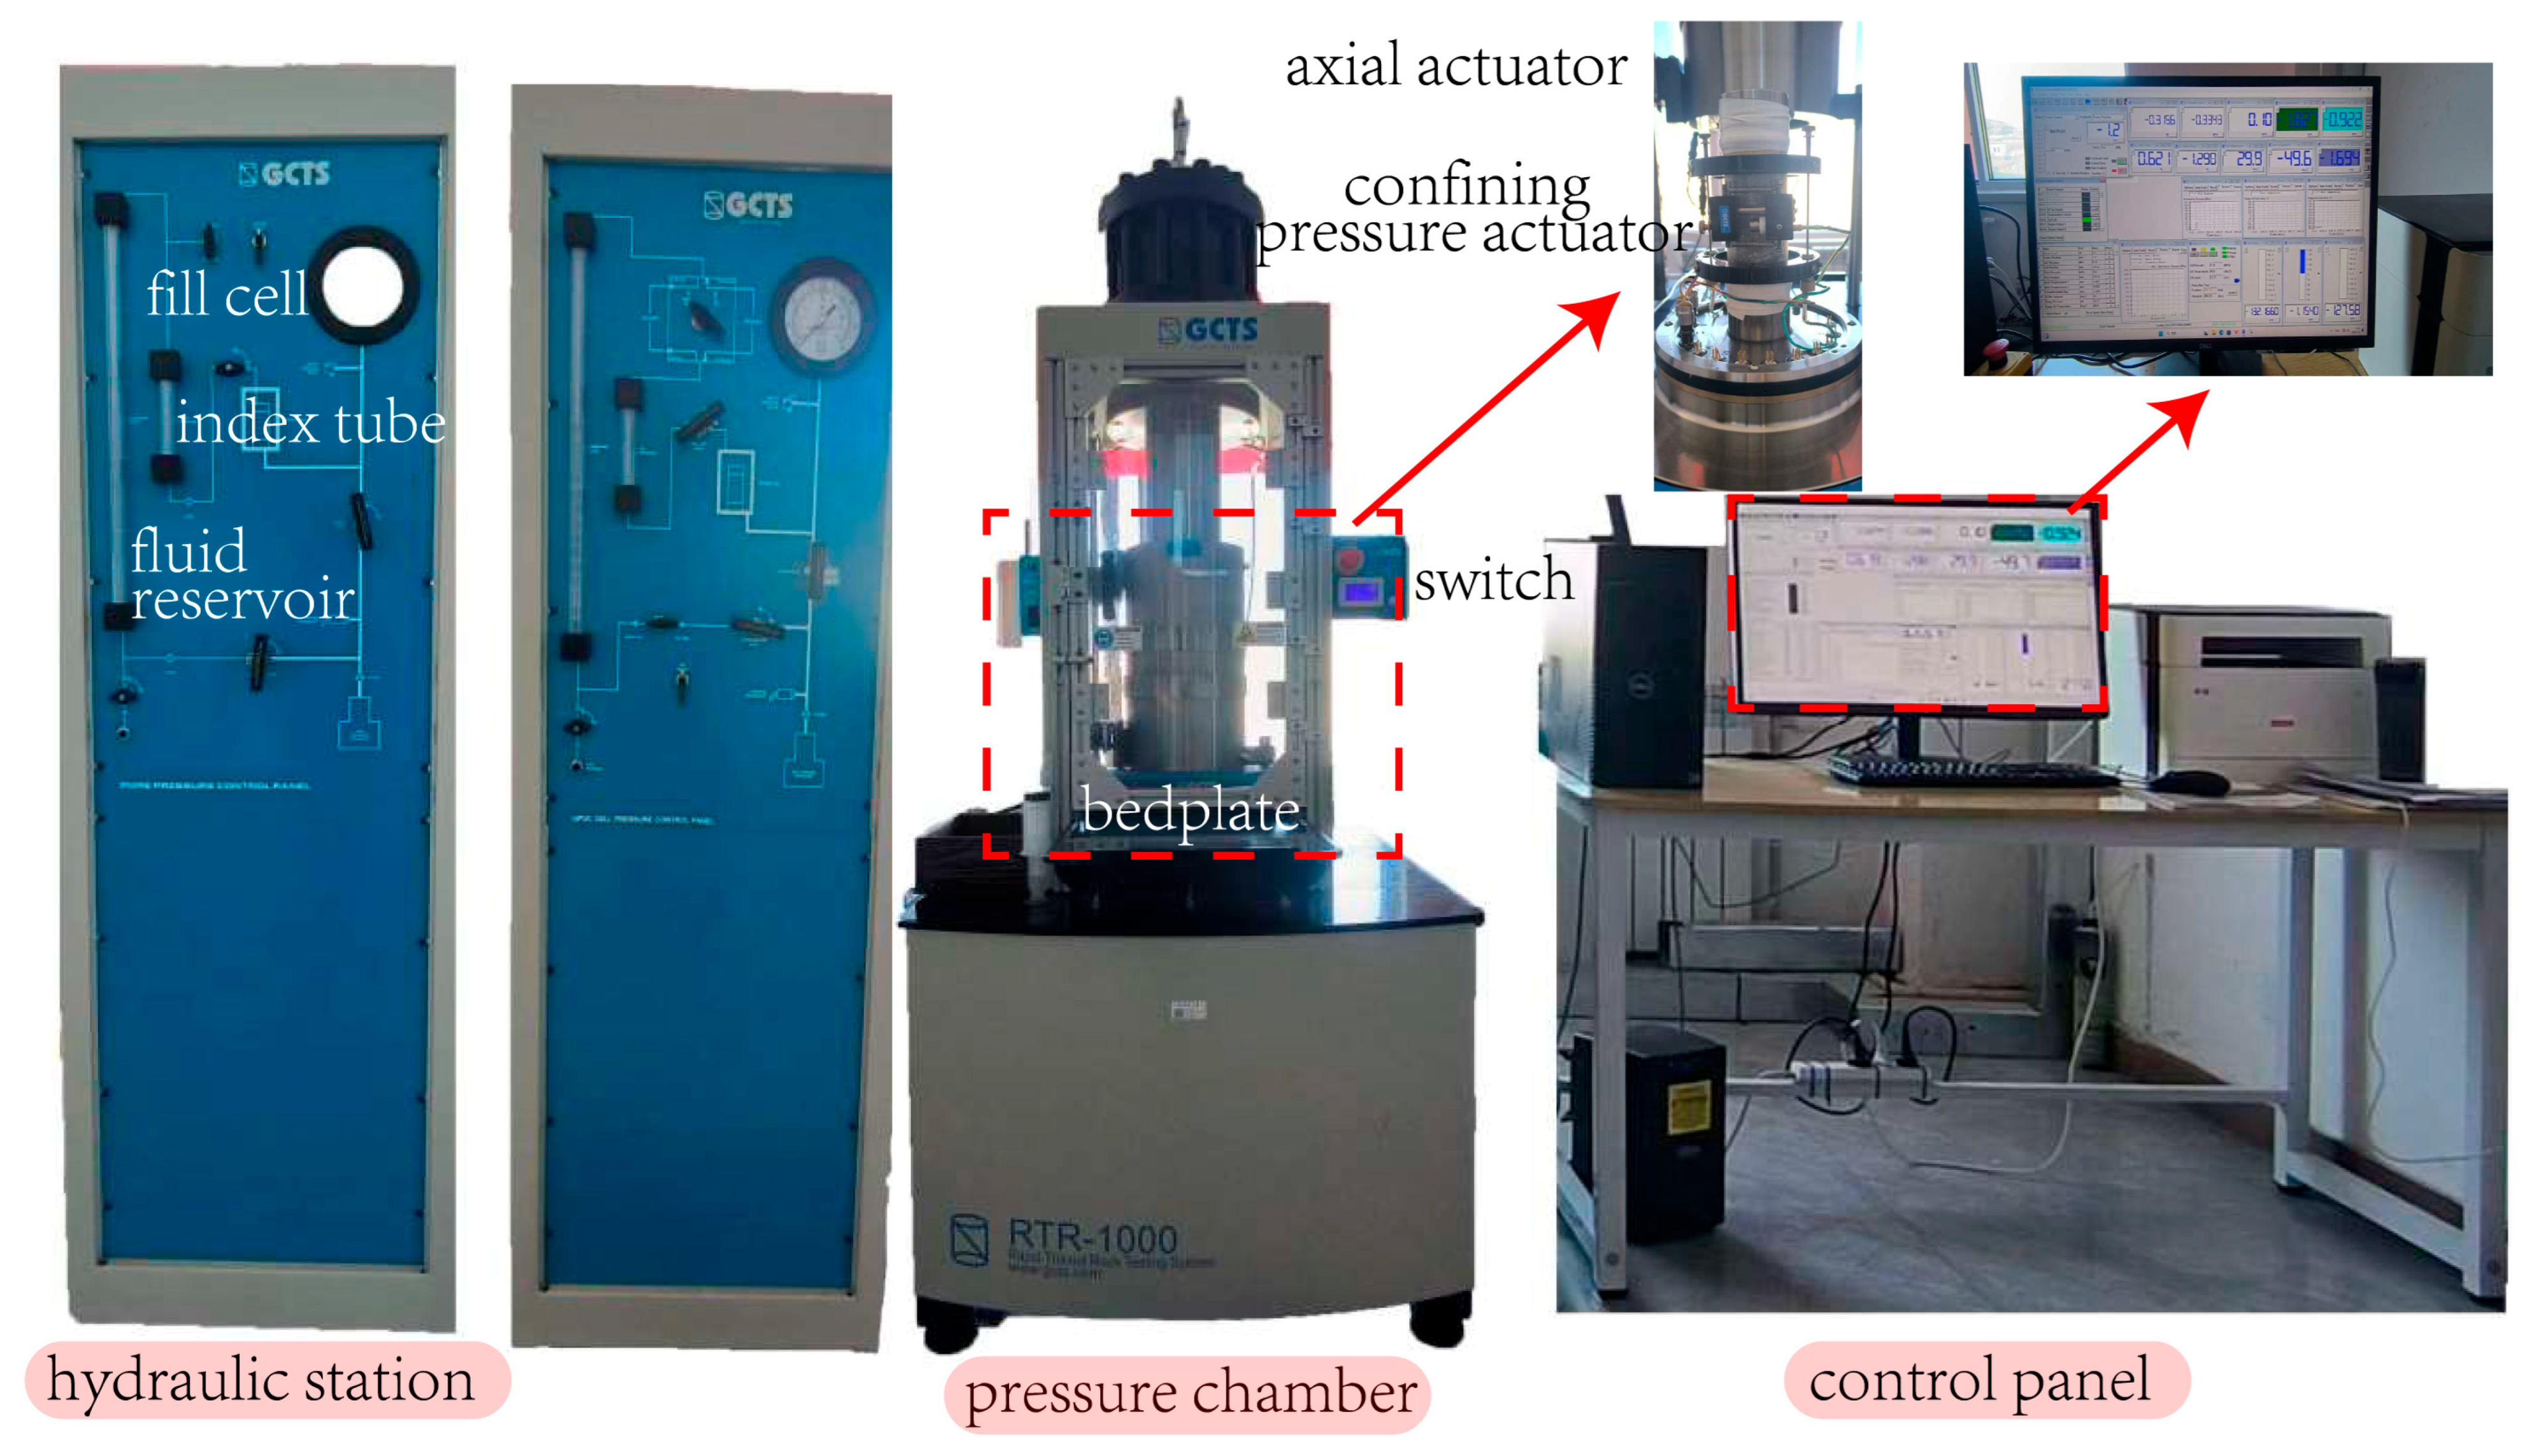
The triaxial compression test adopted the American GCTS RTR-1000 high-temperature and high-pressure rock mechanic test system, as shown in
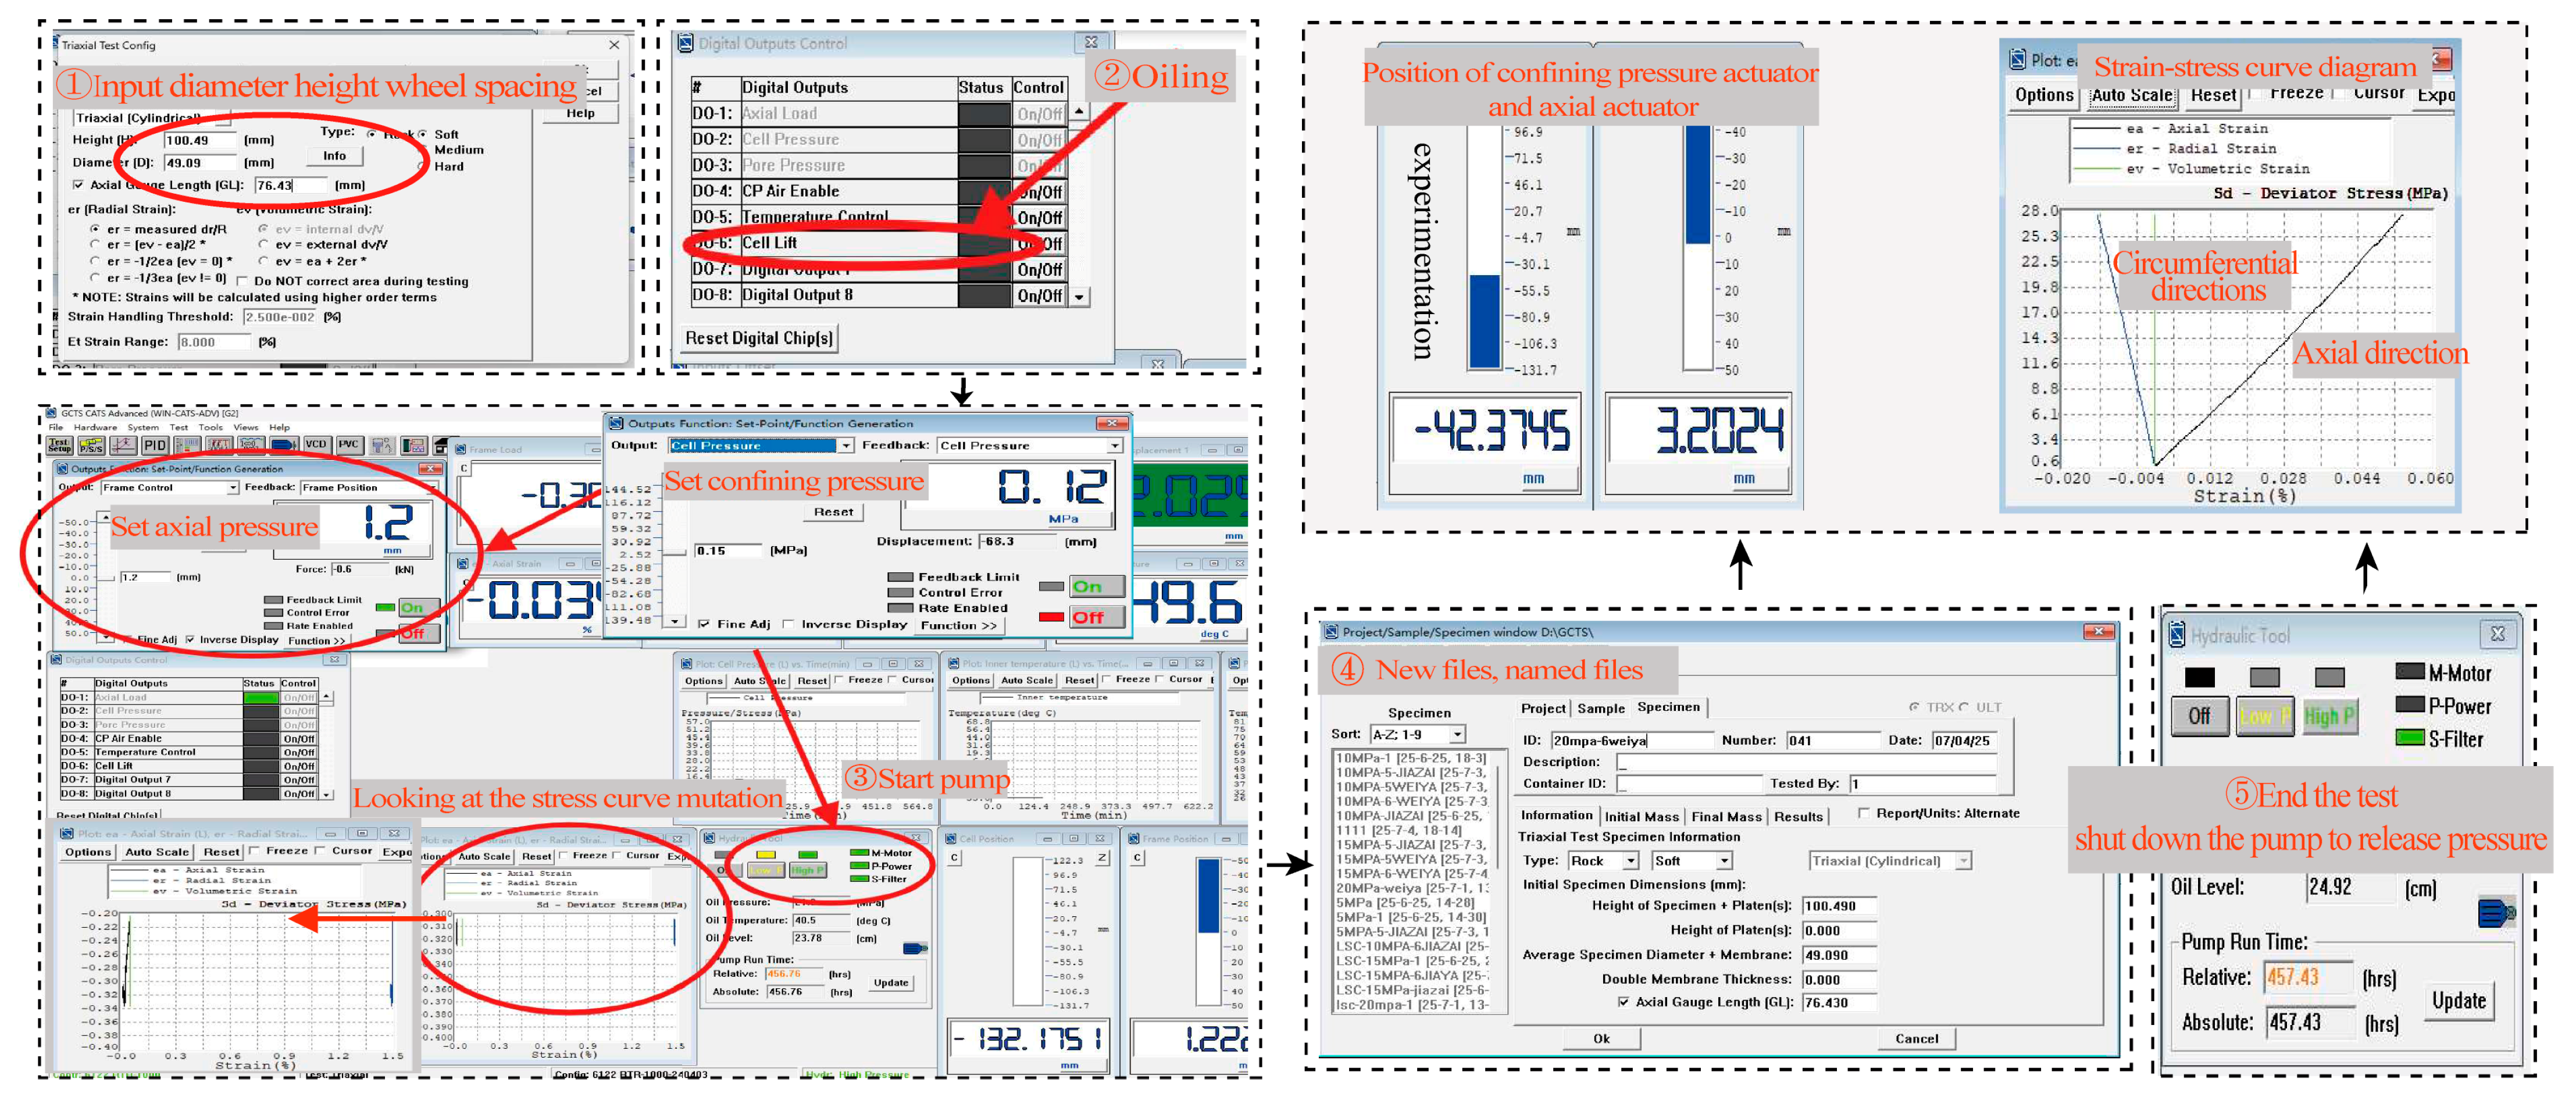
Figure 4. The GCTS RTR-1000 rock triaxial test system is a high-performance rock mechanic test equipment developed and manufactured by the American GCTS company (Silicon Valley, CA, USA), which is specially designed for the conventional triaxial test of rock. The high-strength stainless steel pressure chamber equipped with the system is designed with O-ring and hydraulic double seals to ensure reliable sealing in high-pressure environments. The system is especially suitable for testing standard rock samples with a diameter of 50 mm and a height of 100 mm. The instrument operation steps are shown in
Figure 5. The Mohr–Coulomb strength criterion is a classical theory to describe the shear failure of rock and soil mass. The core of the Mohr–Coulomb strength criterion is to establish the linear relationship between shear strength and normal stress [
43], and then, the internal friction angle (φ) and cohesion (c) are obtained by fitting the experimental data. The triaxial compression test data of rock are shown in
Table 5. The axial peak stress at 10 MPa was higher than that at 15~20 MPa, which did not meet the expectation of the Mohr–Coulomb criterion. This phenomenon was mainly due to the inherent micro-heterogeneity of gneiss specimens and the anisotropy of internal structural plane distribution, but it still clearly showed the trend of rock strength increasing with the increase of confining pressure. The calculation formula is shown in Formula (3):
where
τ—shear strength of rock when shear failure occurs, MPa;
σn—normal stress on shear plane, MPa;
S0—rock cohesion, MPa;
Φ—the internal friction angle of rock, °.
3.3. Drilling Process
This paper mainly studies the relationship between drilling parameters and rock parameters. The self-built drilling platform is used to carry out rock-drilling experiments at different speeds. The variation law of drilling parameters during the drilling process is analyzed, and the feasibility of studying rock parameters through drilling parameters is explored, which lays a foundation for dynamic monitoring of the drilling process [
44].
In this experiment, the rock was placed in the rock confining pressure system. The specimen was φ110 × 145 mm, as shown in
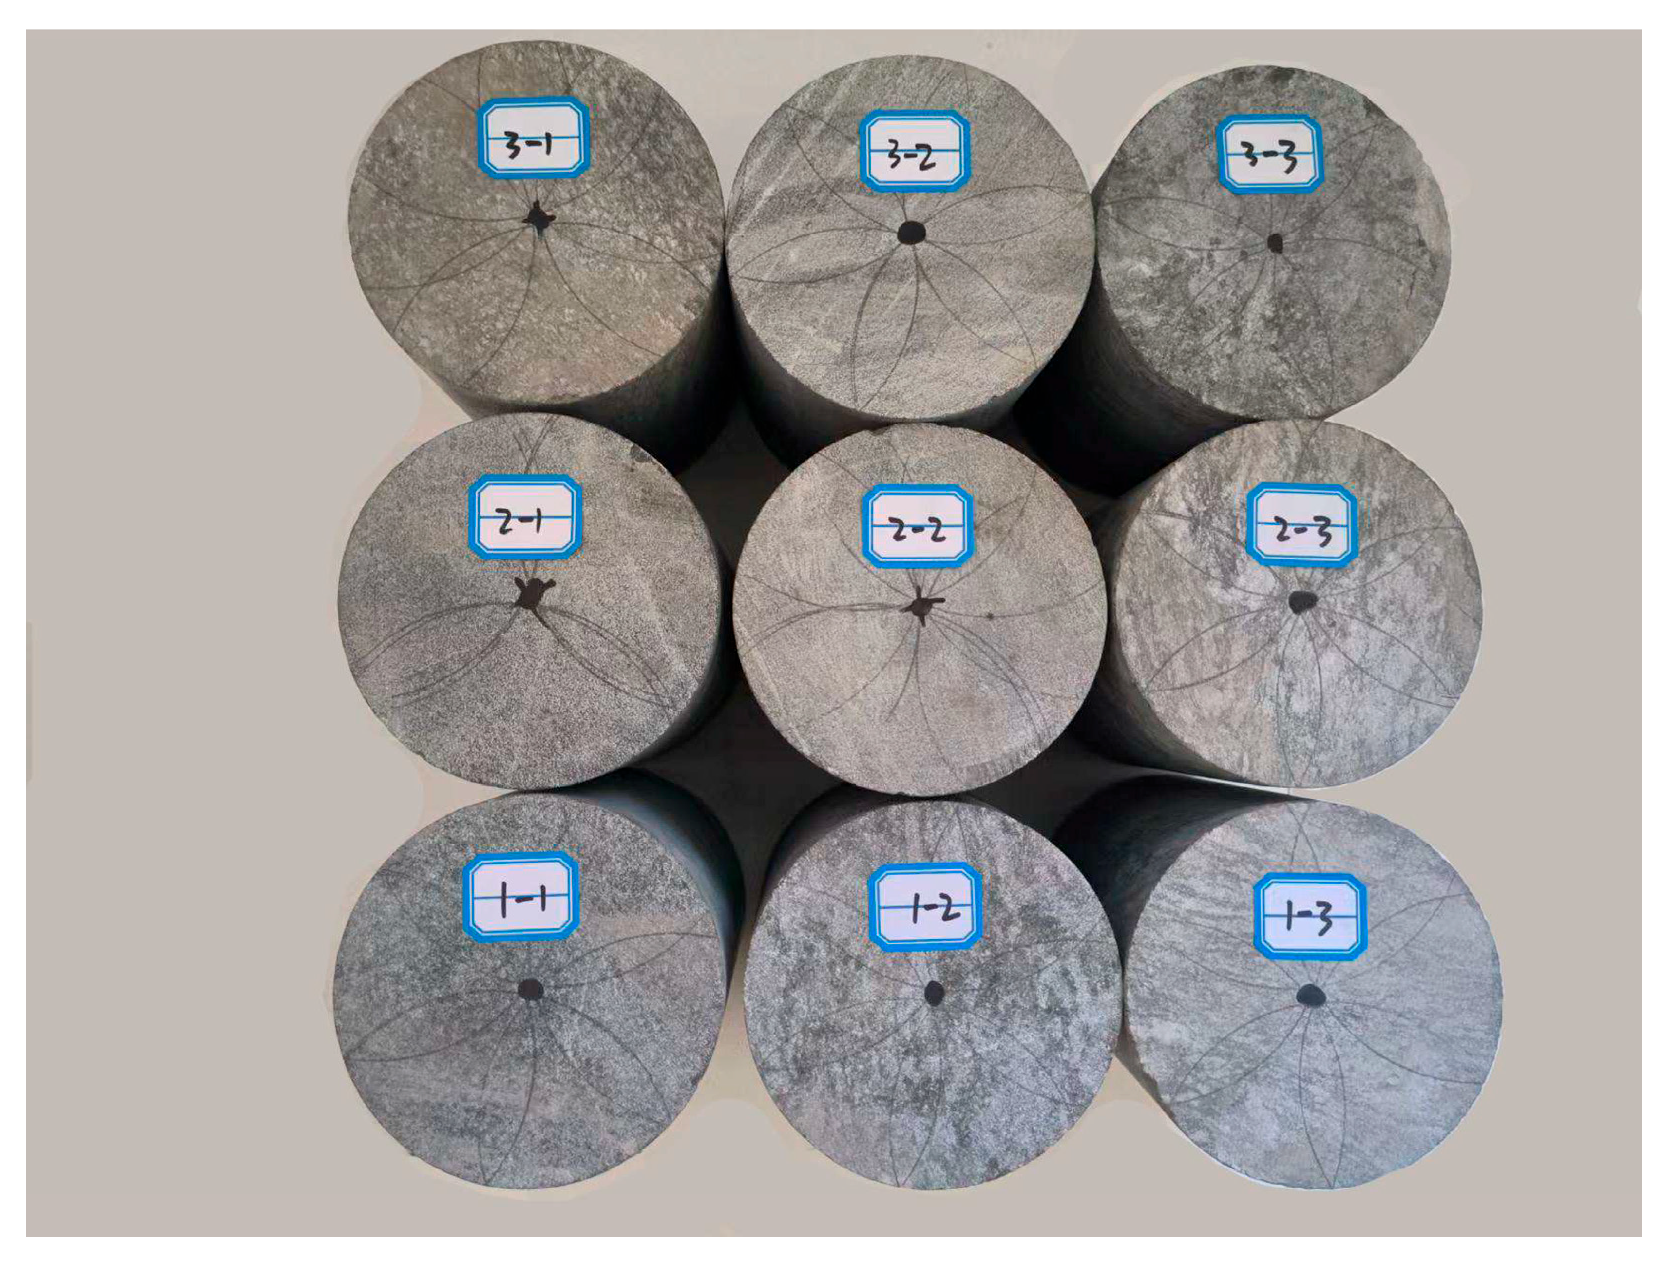
Figure 6. The manual pump was used to keep the hydraulic oil in the annular space formed between the rubber film and the cylinder. The confining pressure was applied at 2 MPa to ensure that the specimen was fixed during drilling. Before the experiment, multiple sensors were installed in the main body of the drilling rig, the data monitoring software was opened, each sensor was debugged to the best state, and the rotation speed was adjusted to the specified target by rotating the knob. The position of the magnetic suction drilling rig was adjusted on the test bench so that the drill bit was aligned with the center of the test piece, and the drill bit was slightly offset during the drilling process. We do not discuss this situation. In the preliminary experiment, the phenomenon of sticking easily occurred when the rotation speed was too slow, and it was not easy to observe the effective experimental phenomenon when the rotation speed was too fast. After several attempts, this experiment set three initial rotation speeds of 330 r/min, 360 r/min, and 390 r/min, and the drilling depth was 120 mm. Three parallel drilling experiments were carried out for each rotation speed, and a total of 9 rock samples were drilled. After the end of the experiment, we stopped drilling and closed the data monitoring software to store the drilling parameters and then opened the drilling rig to take the drill bit out of the rock. The load caused by friction and deformation was deducted from the data. The drilling results of the test piece are shown in
Figure 7.
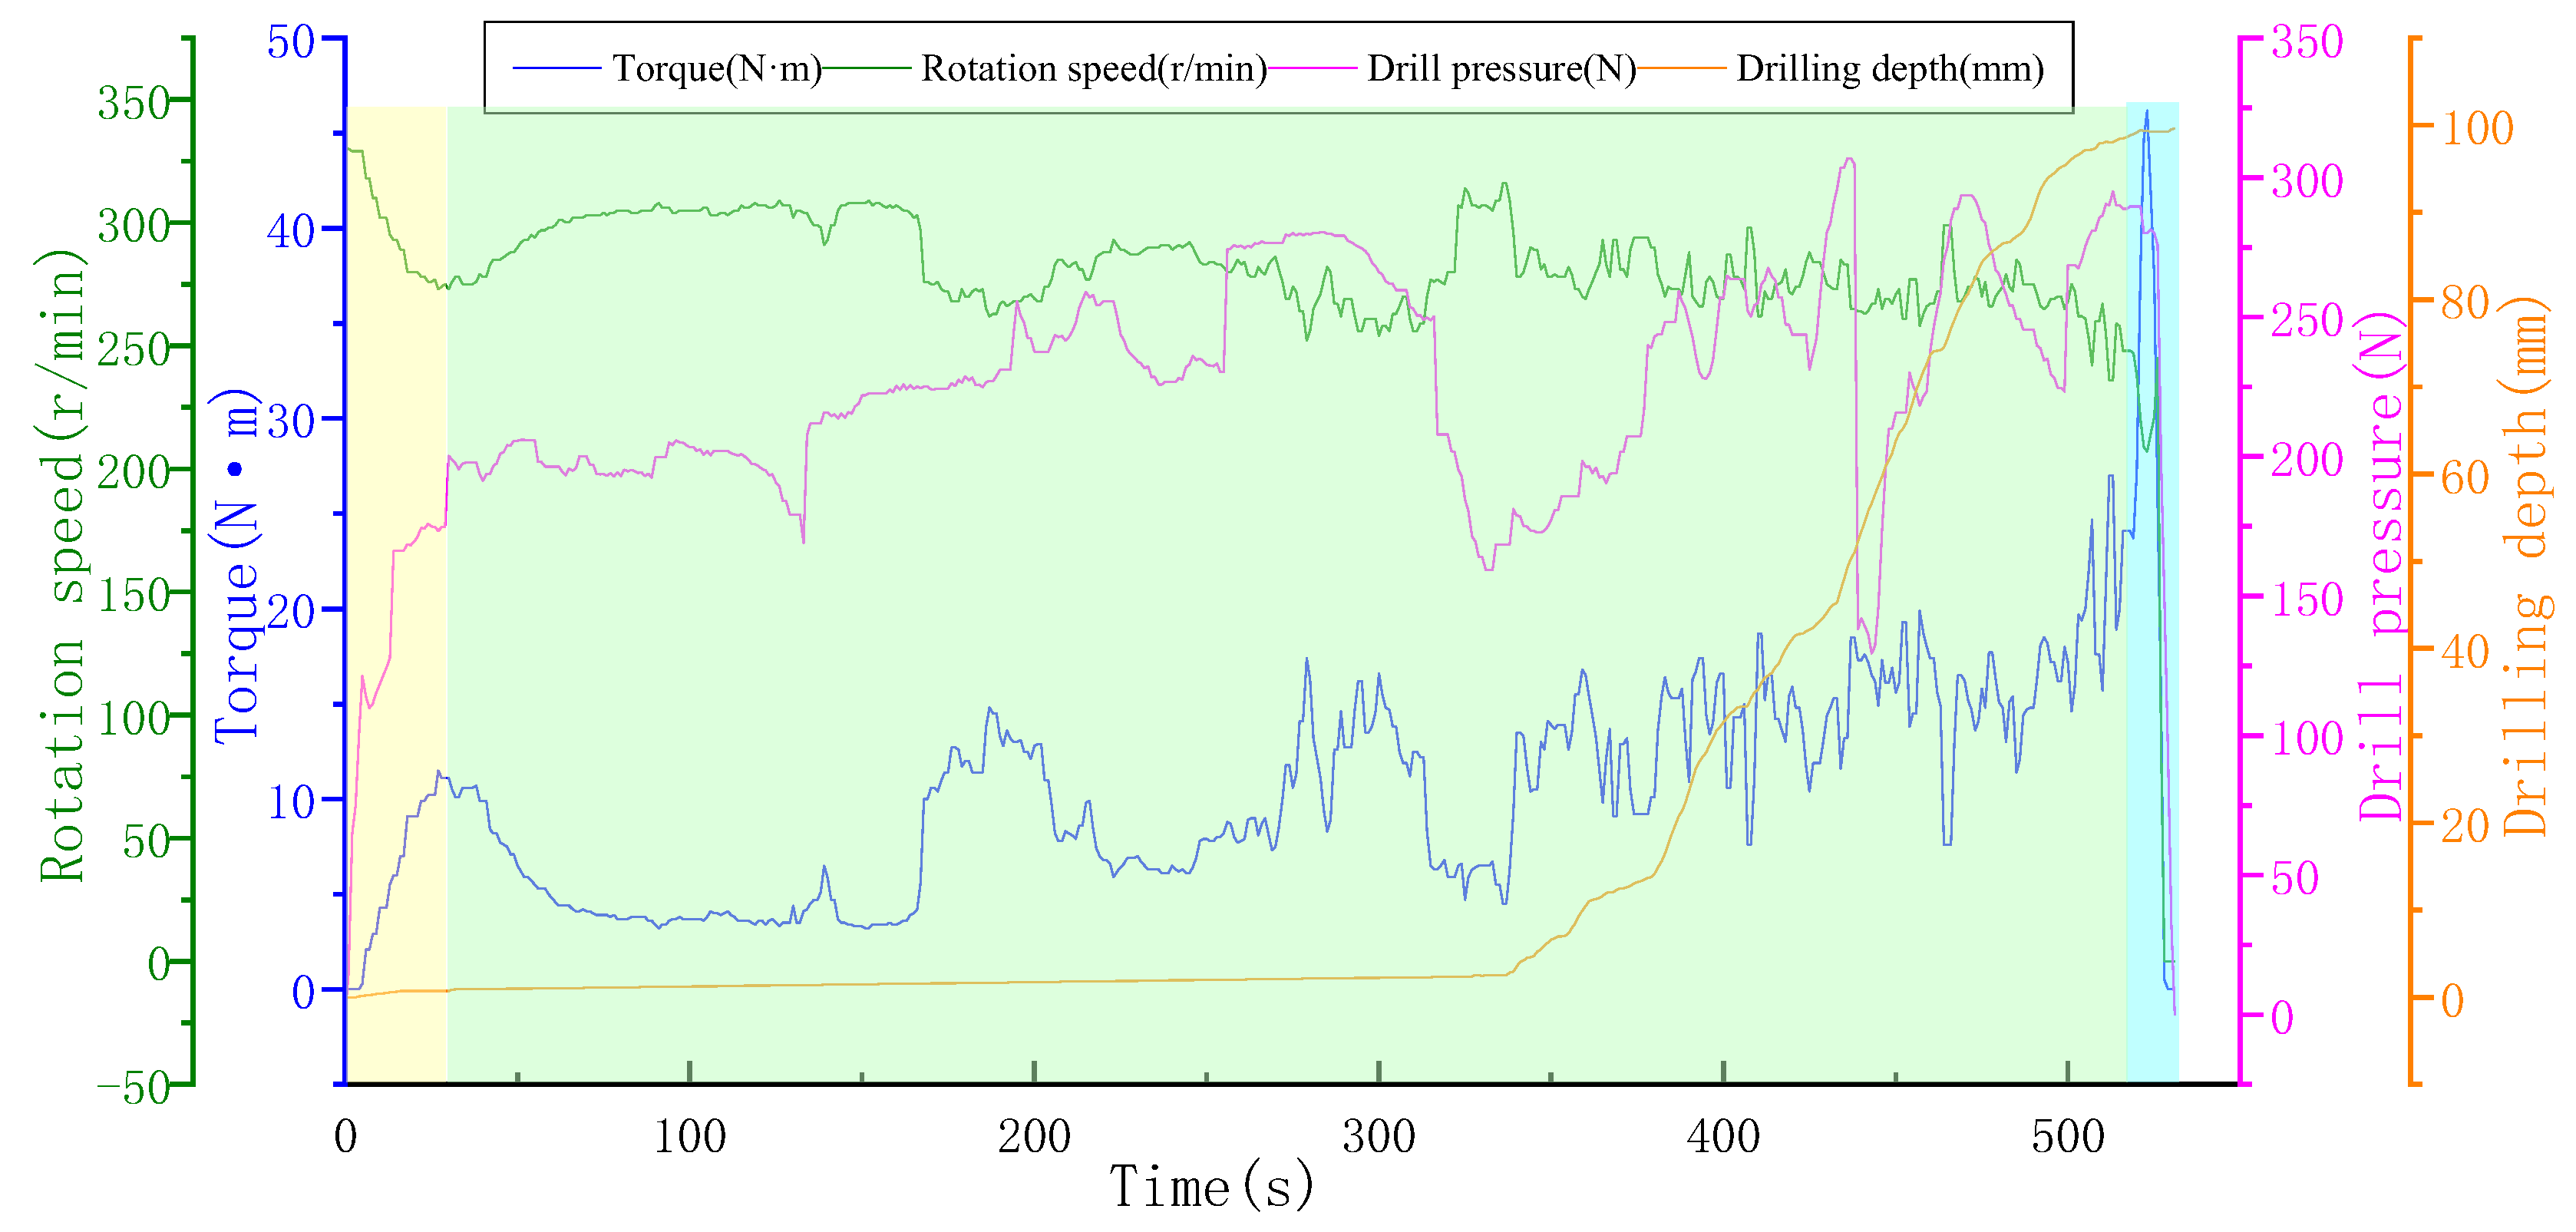
Based on the dynamic response characteristics of drilling parameters obtained by the drilling monitoring system, this study divided rock drilling into three stages: initial drilling stage, crack propagation stage, and drill bit retreating stage.
Figure 8 shows the change in 1-1 measurement data of a 330 r/min specimen. In the initial stage of drilling (the yellow part of
Figure 8), the drill bit was in a strong constraint environment, and it was subjected to large friction resistance and cutting resistance when contacting rock. The rotation speed decreased sharply, the torque and drilling pressure rose rapidly, and the parameters fluctuated greatly. In the crack propagation stage (the green part of
Figure 8), the friction between the drill bit and the rock reached a dynamic balance and fluctuated around a certain value, and the rotation speed tended to be stable. With the deepening of drilling, the drill bit moved into the loose small test block after penetrating the large test block. At this time, the drill bit was in a weak constraint environment, and the drilling depth increased sharply. Due to the internal heterogeneity and local fragmentation of the specimen, the WOB showed a large fluctuation. When drilling into a large test block, the WOB was large, and the WOB decreased rapidly at the moment of penetration. In the backward stage of the drill bit (blue part of
Figure 8), the drill bit stopped drilling; the resistance decreased; the rotational speed, torque, and WOB decreased significantly; and the parameters changed sharply, indicating that the drilling was completed. The results show that the monitoring system was set up reasonably and the data collected was effective. The dynamic response of the parameters in each stage provides a theoretical basis for revealing the relationship between drilling parameters and rock parameters.
4. Results and Discussion
4.1. The Effect of Rotation Speed
In order to study the influence of rotation speed on drilling efficiency and various parameters, this study carried out drilling experiments with three different specifications of initial rotation speed on gneiss under fixed confining pressure.
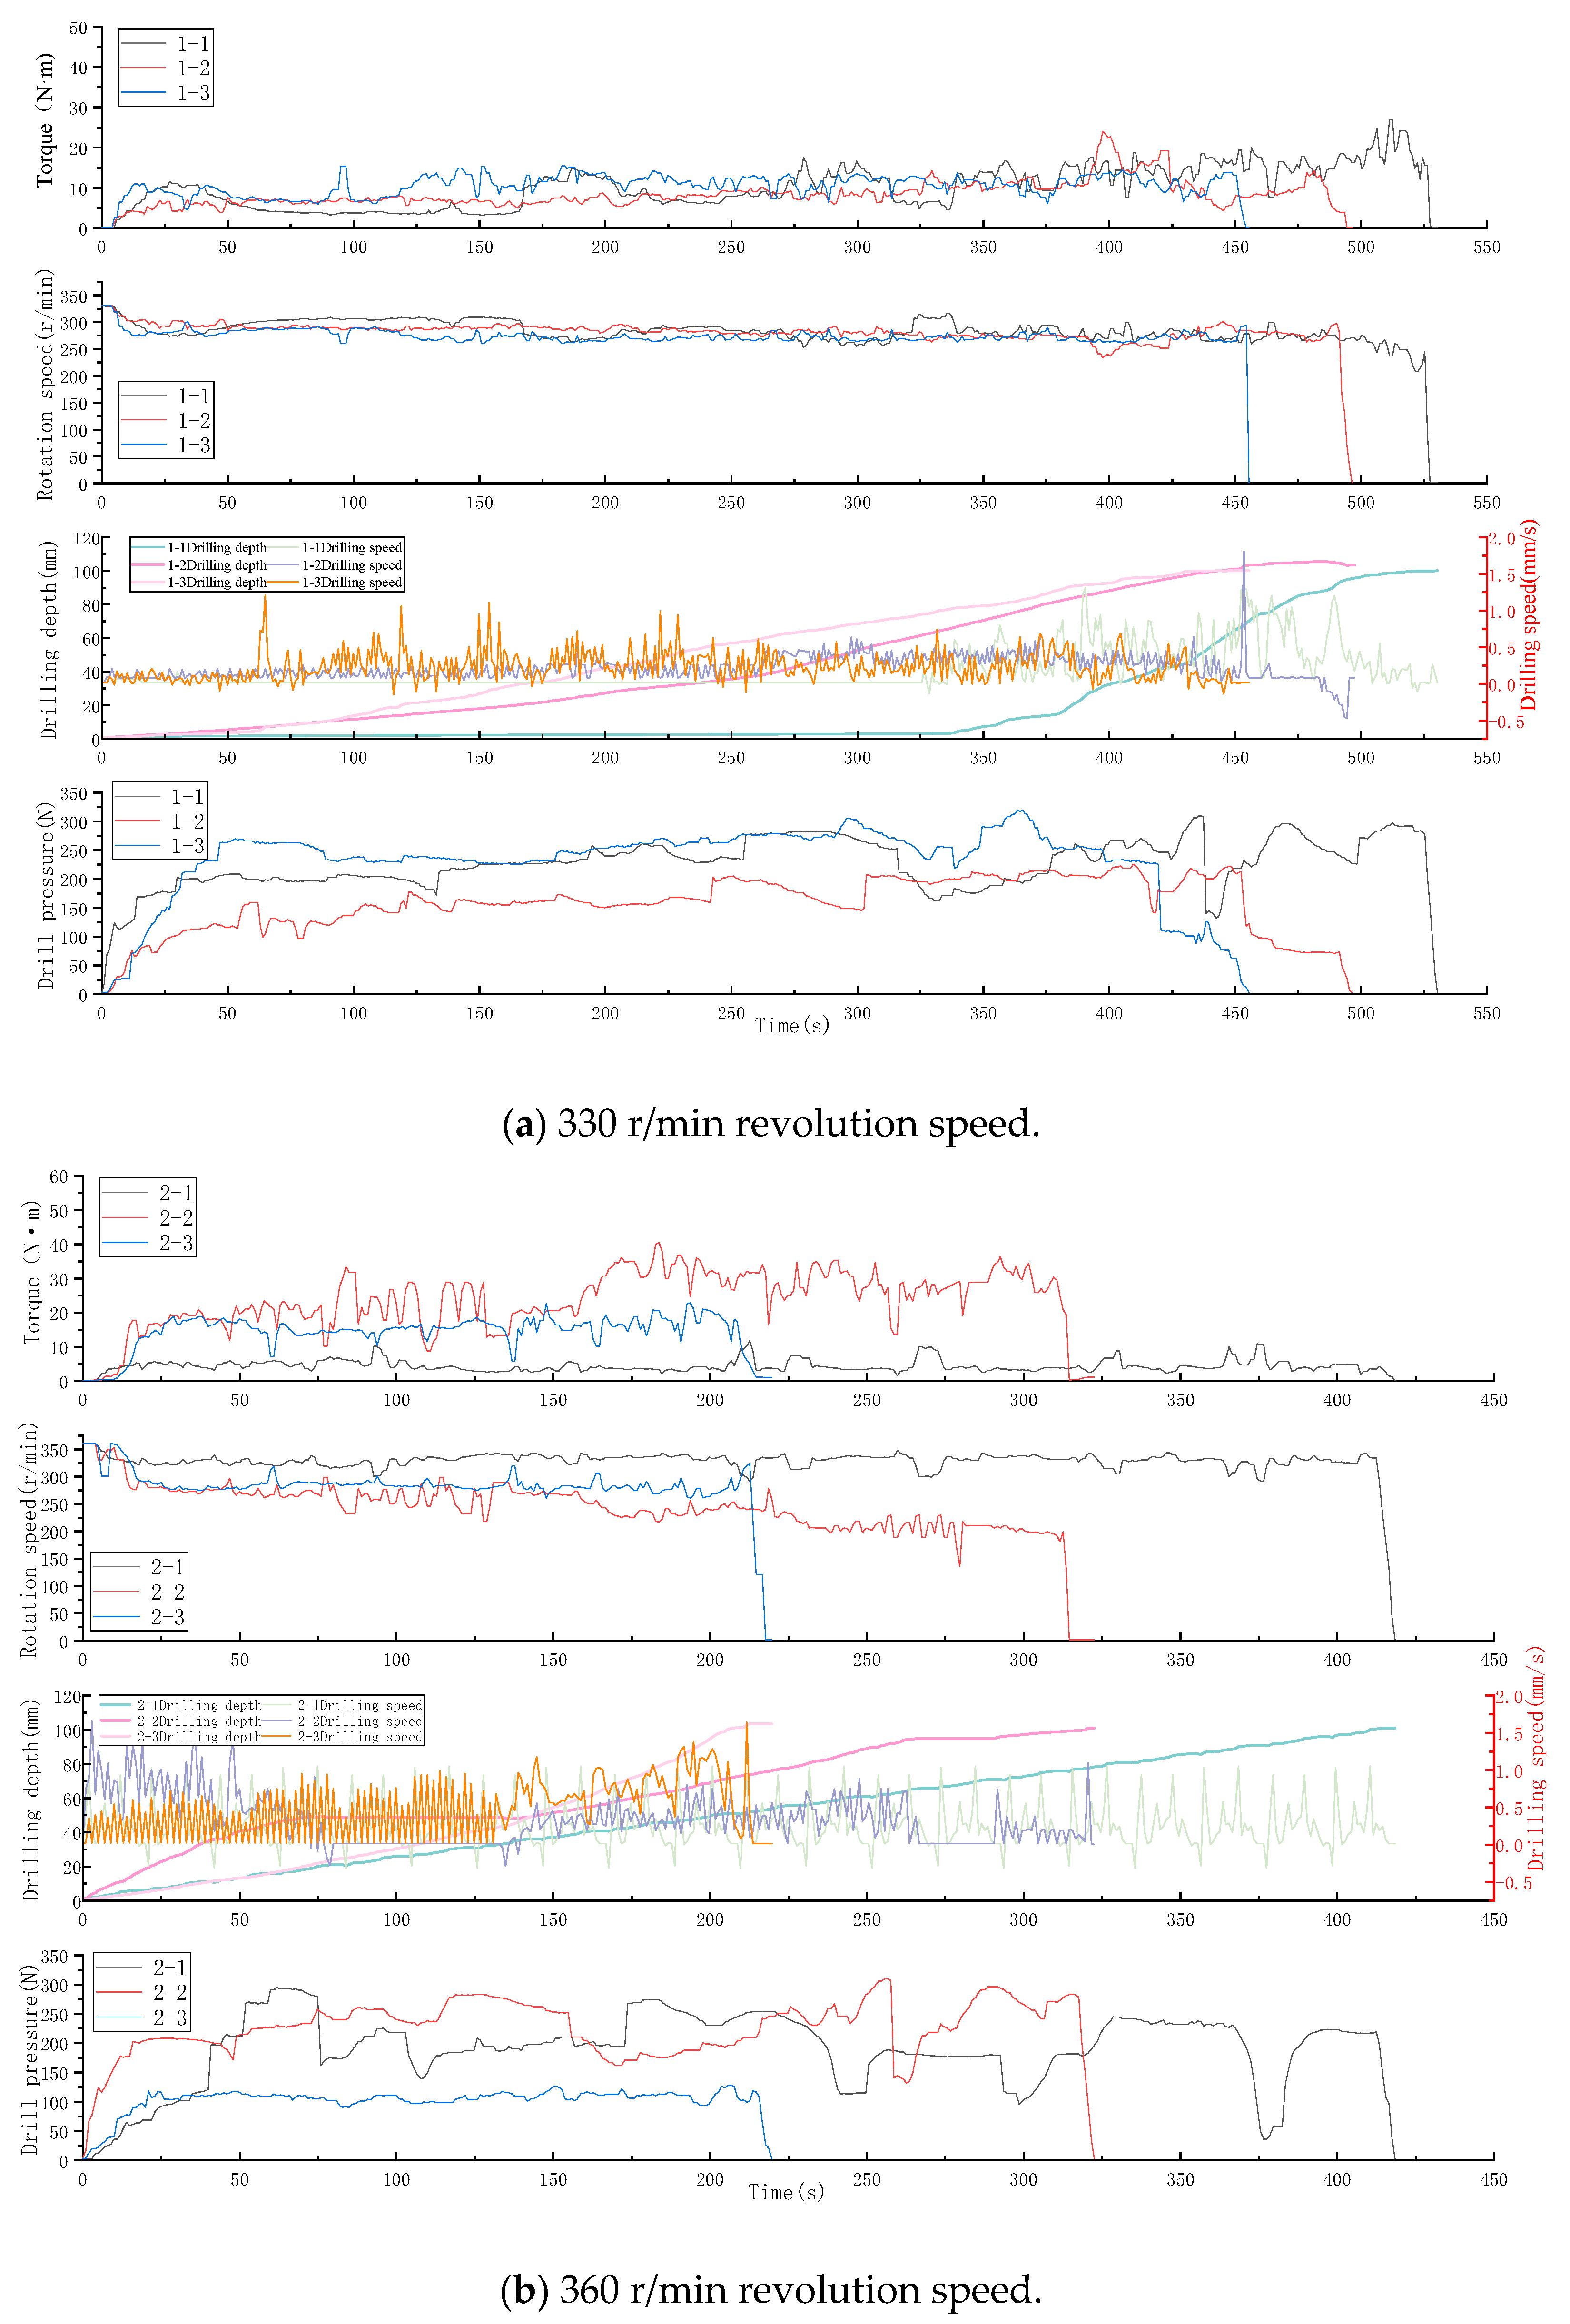
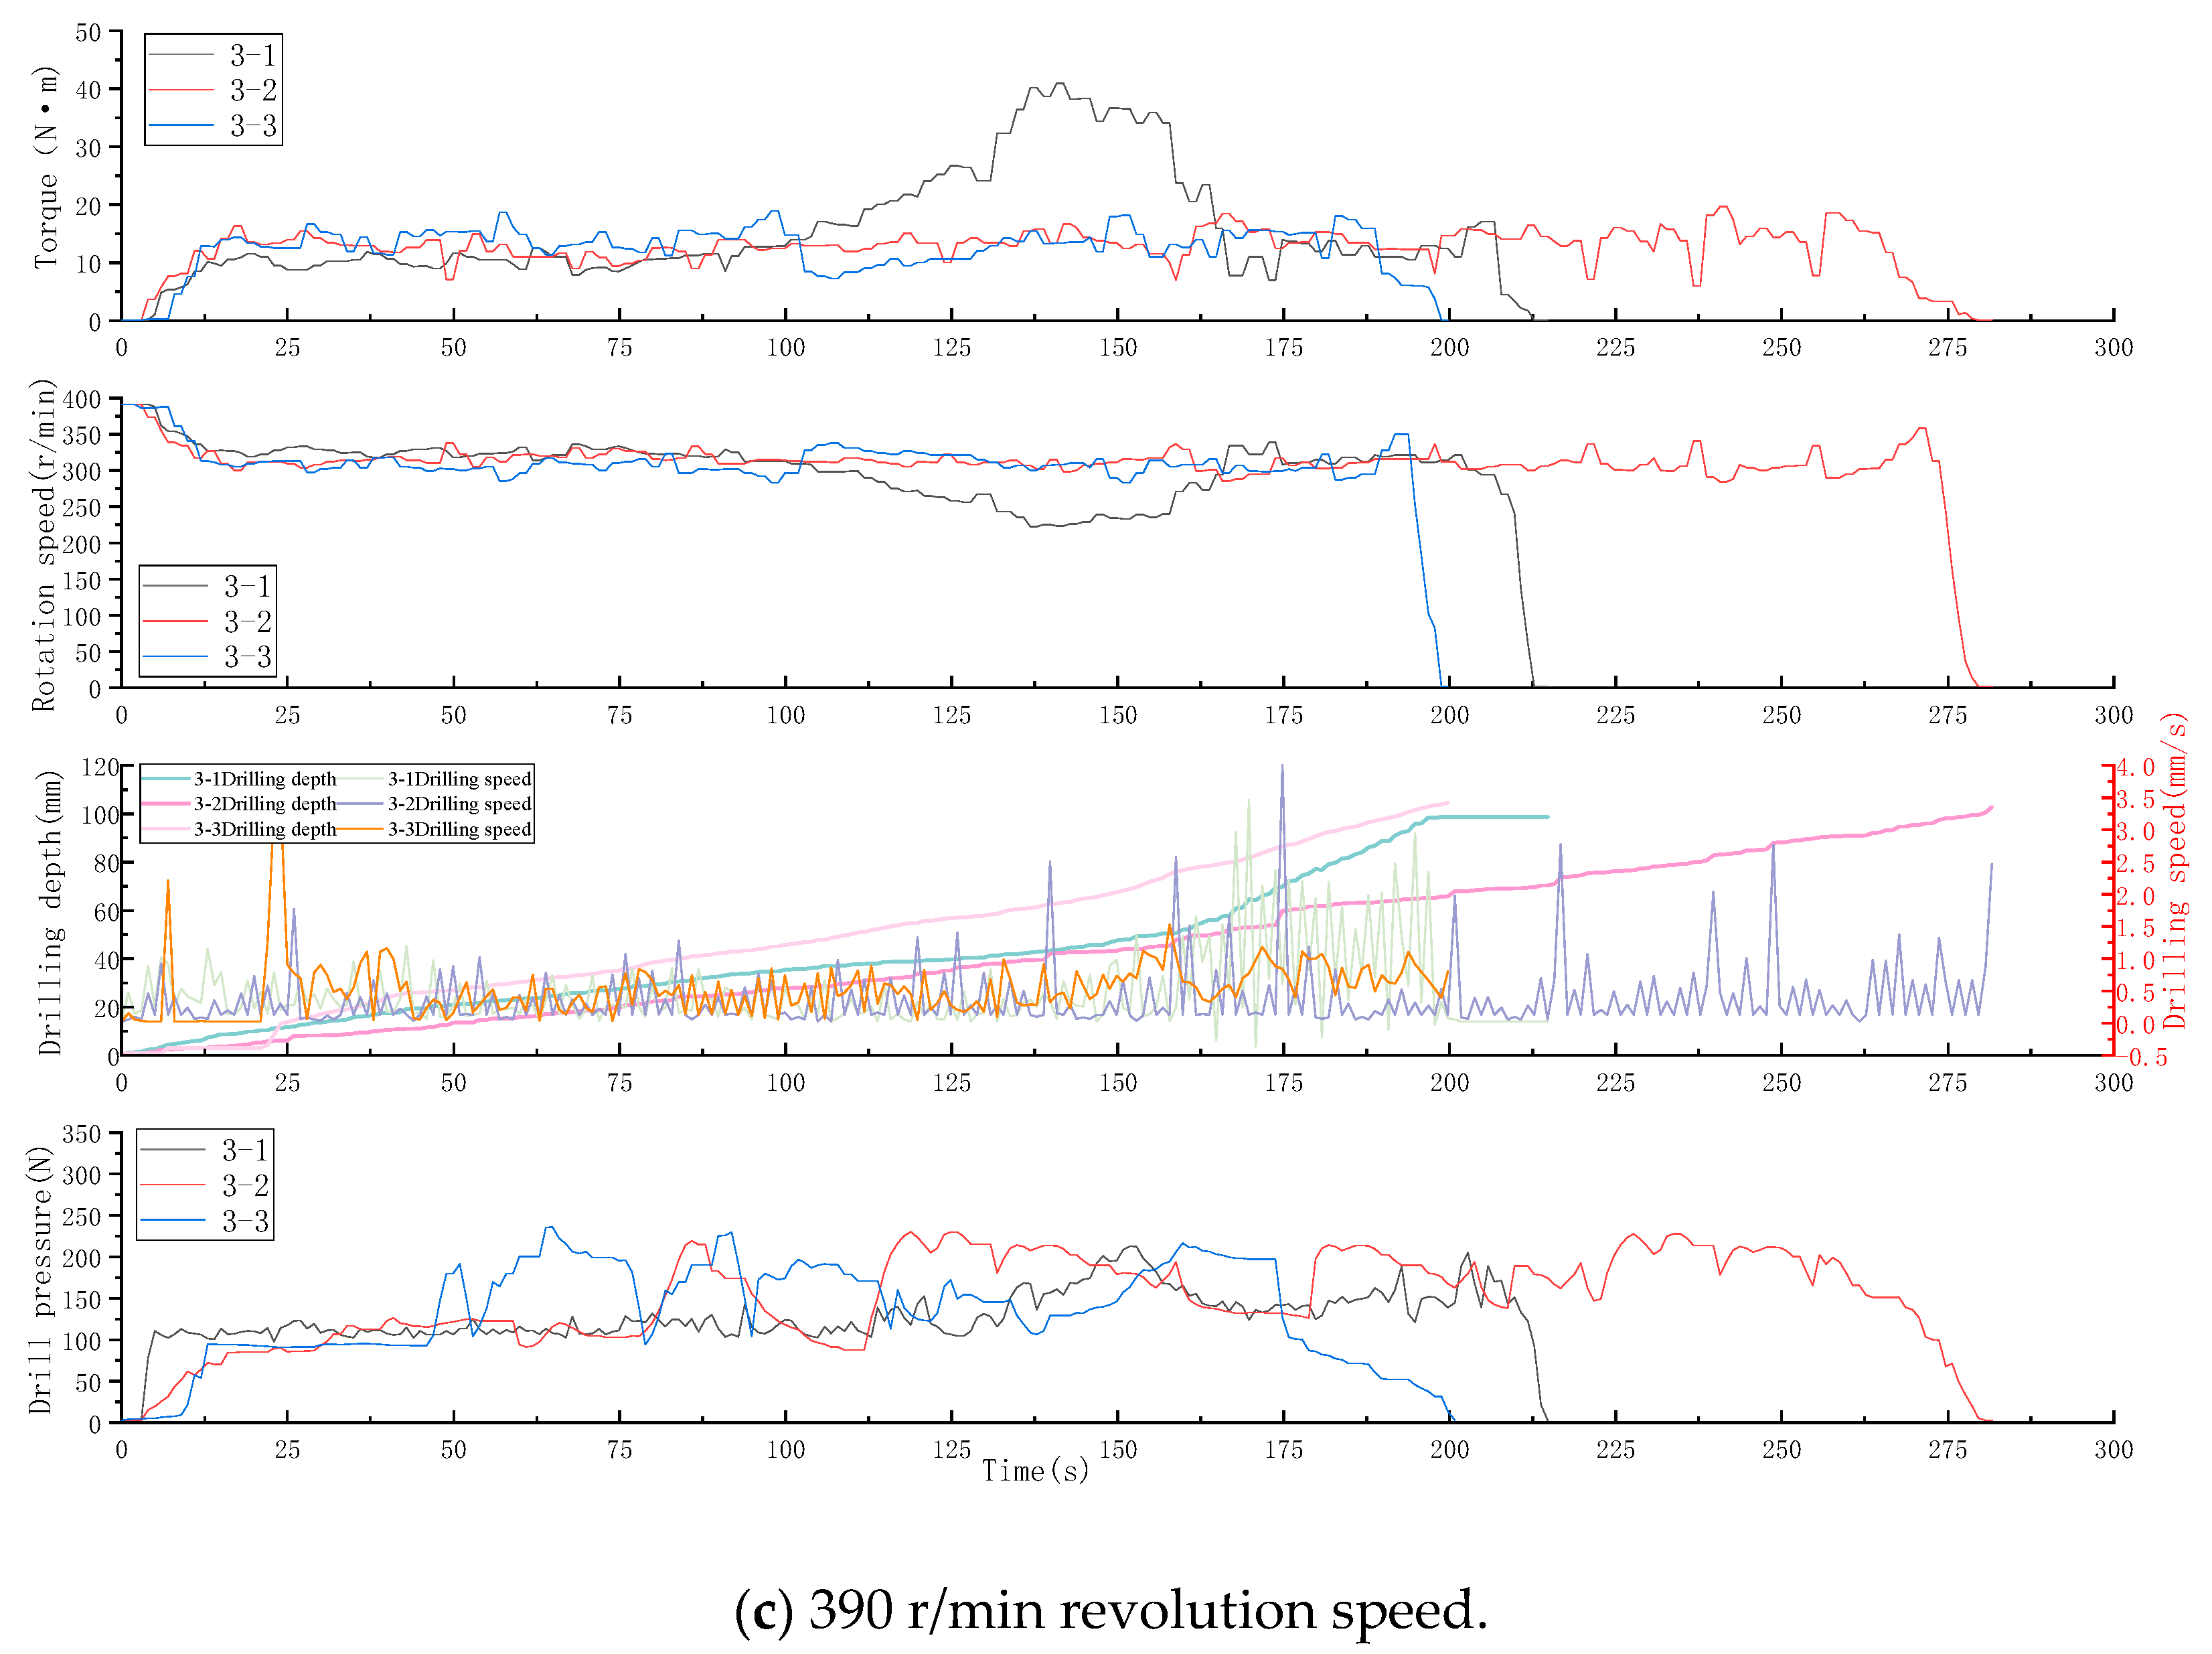
Figure 9 shows the dynamic response of drilling parameters during drilling, including rotation speed, torque, drilling depth, drilling speed, and weight on bit.
Figure 9a shows the change in drilling parameters at 330 r/min,
Figure 9b shows the change in drilling parameters at 360 r/min, and
Figure 9c shows the change in drilling parameters at 390 r/min. All data before drilling are in the initial value; in the initial stage of drilling, the rotational speed of the bit and the rock began to decrease at the moment of contact, and the torque and pressure increased rapidly. In the crack propagation stage, the parameters were basically stable, and the drilling pressure fluctuated greatly. In the bit retreating stage, all drilling parameters returned to normal. According to
Figure 9, it can be seen that the variation of parameters is similar. Due to the difference in rock mechanic parameters and internal heterogeneity, the fluctuation range of drilling parameters is different.
From the experimental results, with the increase in rotational speed, the drilling speed increased significantly. At 330 r/min, the average drilling speed was about 0.19 mm/s; when the rotation speed increased to 360 r/min and 390 r/min, the average drilling speed increased to 0.34 mm/s and 0.44 mm/s, respectively. This phenomenon was mainly due to the increase in the number of times the drilling teeth cut rock per unit time with the increase in rotational speed so as to improve the frequency of rock breaking and the efficiency of cuttings generation. It can be found that at the same initial rotation speed, the drilling torque rises sharply first, the friction force and cutting force between rock and drill bit are gradually stable after drilling, and the torque is relatively stable. The torque fluctuation of 2-2 and 3-1 rocks is large because of the heterogeneity inside the rock. At the same time, the torque also shows a significant increasing trend with the increase in rotational speed. The torque fluctuation range is 0–27 N·m at 330 r/min and increases to 0–40.9 N·m at 390 r/min. The reason can be attributed to two aspects: one is that the friction heat effect between the drill bit and the rock interface is intensified at high rotation speed, which leads to the change in local rock strength and the increase in cutting resistance; second, the cuttings are not discharged in time, resulting in repeated grinding, which further increases the torque load. In addition, the experimental platform is operated by the experimental personnel to operate the rotating rod drilled by the drilling rig, and the semi-automatic control is implemented. The force exerted by the operator is as uniform as possible, so the drilling pressure does not change significantly at different speeds, but at 330 r/min, the speed is low, the rock drilling is difficult, and the drilling pressure is slightly larger; when the rotary speed is higher at 390 r/min, the bit is easier to cut into the rock, thus reducing the drilling pressure, and the drilling pressure decreases slightly with the increase in the rotary speed.
When drilling samples at the same rotational speed, although all samples are from the same gneiss, there are inevitable differences between them at the micro- and meso-scales. If the micro-crack network inside a sample is more developed, it is easier for the drill bit to use these defects during drilling, causing crack propagation and penetration, which is manifested as higher drilling efficiency and shorter drilling time. A denser and more complete sample requires the drill bit to consume more energy to ‘create’ new cracks, so the drilling time is longer. In addition, the average cutting time at 330 r/min is 494 s, the average cutting time at 330 r/min is 321.67 s, and the average cutting time at 390 r/min is 232.67 s. With the increase in rotation speed, the more times the drill bit cuts rock per unit time, the shorter the rock-cutting time is. Therefore, 390 r/min is 261.33 s shorter than 330 r/min.
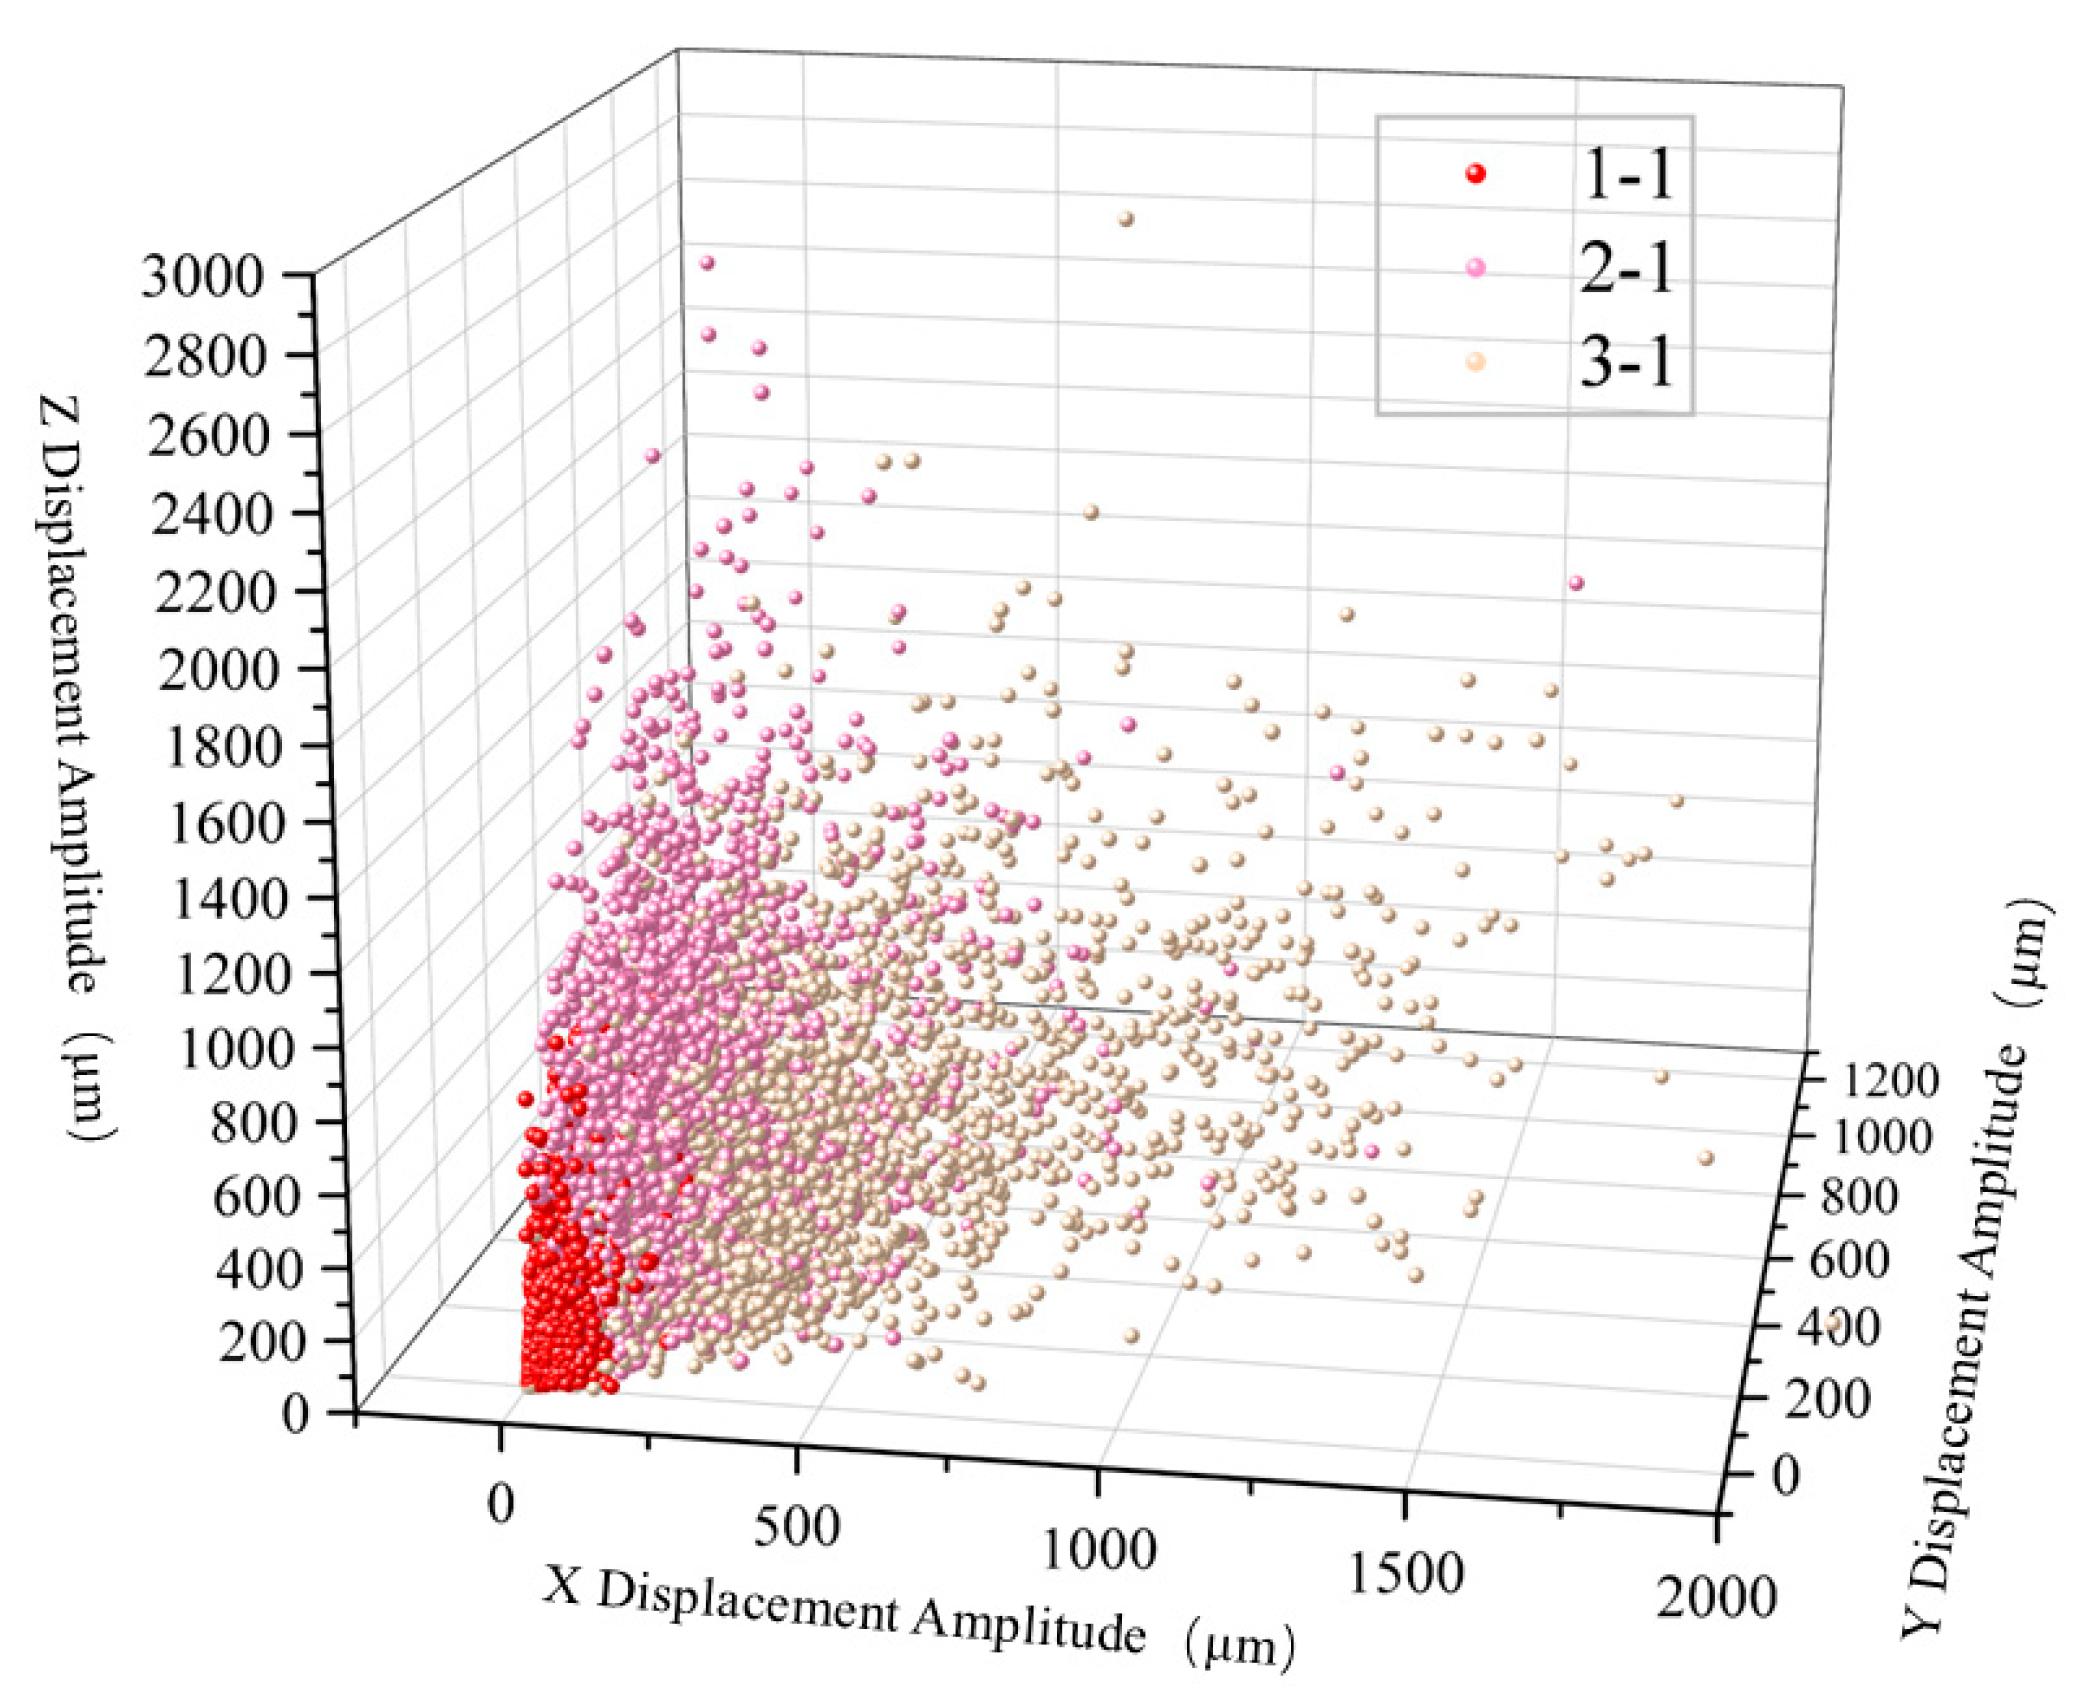
In short, in the experiment of drilling the same lithology specimen under the same confining pressure, the rotational speed is the key operating parameter, and the rotational speed has a great influence on the drilling speed, torque, weight on bit, and drilling time. It should be noted that the fluctuation of drilling parameters is related to the vibration of the drilling rig. The vibration parameters of 1-1, 2-1, and 3-1 are shown in
Figure 10. It can be observed that the vibration amplitude of the drilling rig is small, and the fluctuation law of the experimental parameters is reasonable.
4.2. Research on Coupling Relationship of Drilling Parameters
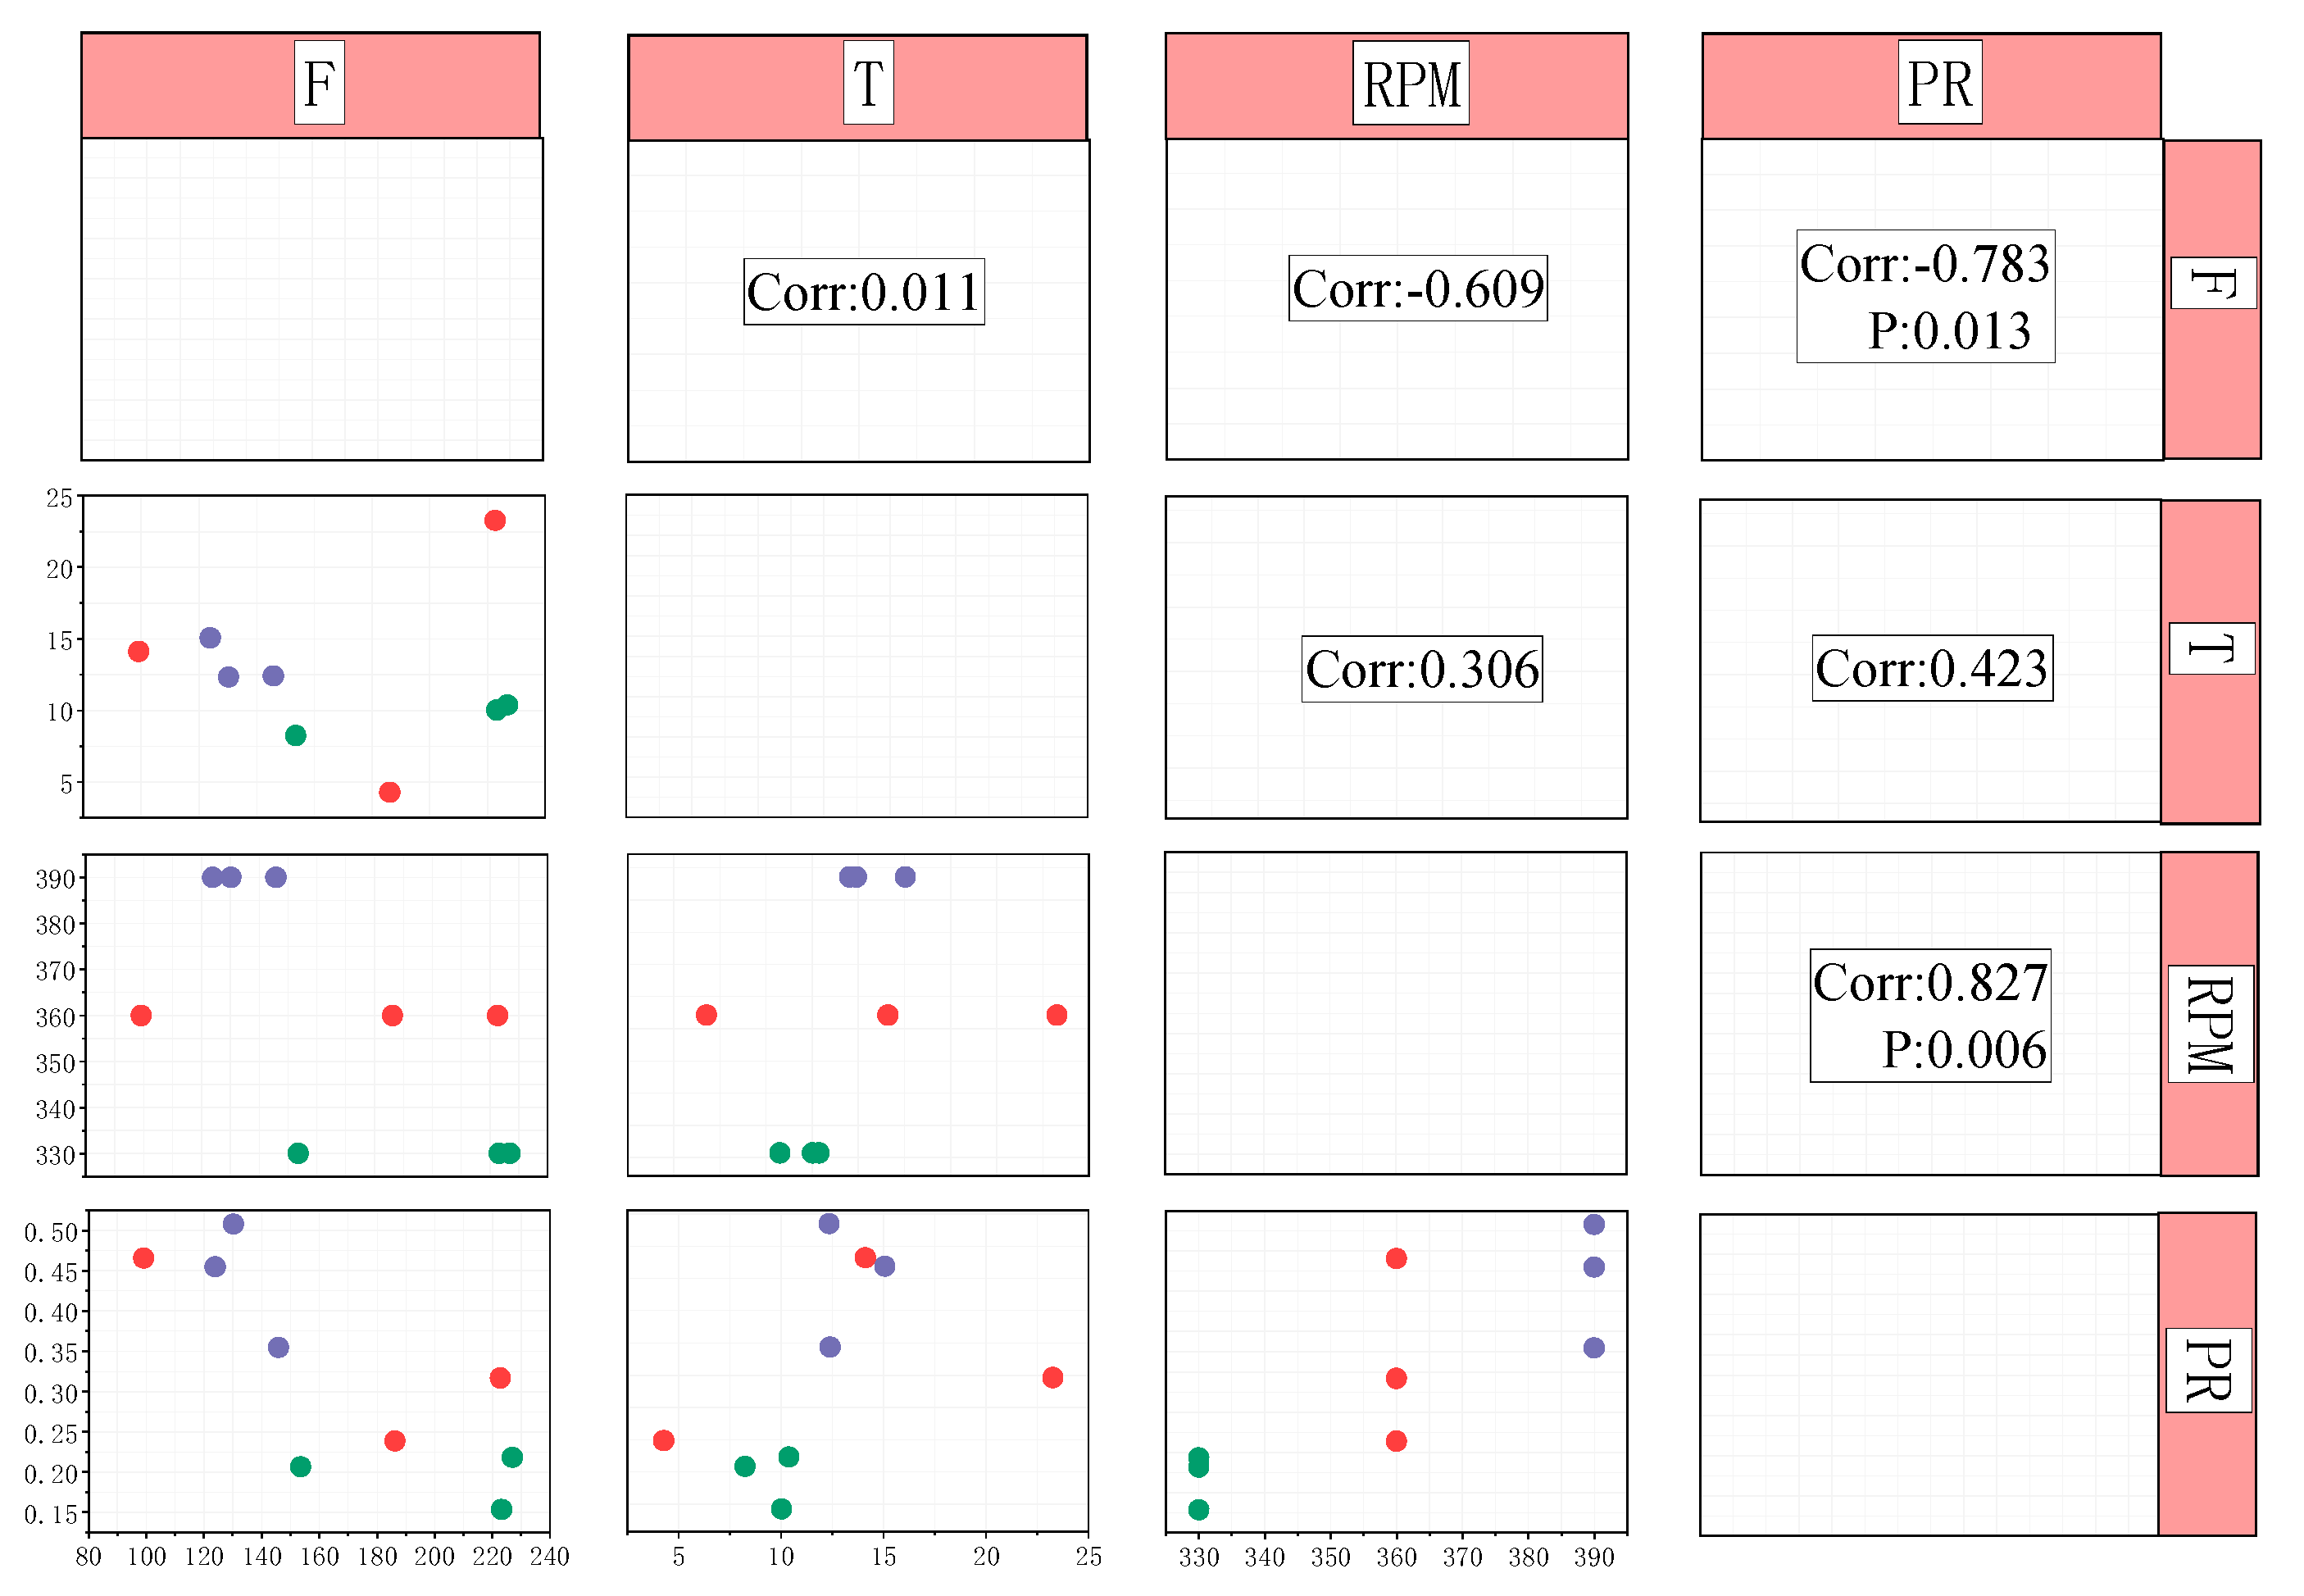
Although this study focuses on the relationship between drilling parameters and rock parameters, the internal coupling relationship between drilling response parameters is also worthy of in-depth analysis to reveal the energy distribution and rock-breaking mechanism during drilling. The Pearson method was used to calculate the correlation degree of torque (T), weight on bit (F), drilling speed (PR), and rotational speed (RPM) to identify the degree of interaction between the parameters. The scatter matrix diagram of the above experimental data is shown in
Figure 11, which illustrates the pairwise correlation of variables and the differences between different groups.
Pearson correlation method is suitable for two continuous variables to detect whether there is a correlation between two continuous variables [
45]. The Pearson correlation coefficient r tends toward 1 or −1, which indicates strong positive correlation or strong negative correlation, respectively; the value of Sig.
p less than 0.05 indicates that the correlation is significant, and greater than 0.05 indicates that the correlation is not significant. The upper triangle of the figure shows the Pearson correlation coefficient between variables, which is marked when the significance level is
p < 0.05. The scatter plot below the diagonal line reveals the correlation trend between variables. Points of different colors represent different groups: green represents the 330 r/min group, red the 360 r/min group, and purple the 390 r/min group. The analysis results show that the correlation between F and PR is −0.783,
p < 0.05, indicating a strong negative correlation. When the drilling speed is increased, the friction resistance and cutting resistance of the cutting process change, which reduces the drilling pressure. RPM and PR show a high correlation,
p = 0.006; the correlation coefficient is 0.827, the speed increases, the number of times per unit time bit cutting rock increases, rock-breaking frequency increases, and it can effectively improve the rate of penetration.
In summary, there is a significant coupling effect between drilling parameters, and the drilling speed has a strong driving relationship with WOB and rotational speed. The r value of torque and WOB is close to 0, indicating that there is no obvious correlation. The r values of torque, rotational speed, and drilling speed are 0.306 and 0.423, respectively, indicating that rotational speed and drilling speed have little influence on torque. This result shows that in the actual drilling parameter optimization process, it is necessary to comprehensively consider the balance between multiple parameters so as to avoid the energy loss and drilling rig wear caused by a single increase of rotational speed and neglect of other parameter changes.
4.3. Correlation Analysis of Rock Mechanic Parameters and Drilling Characteristics
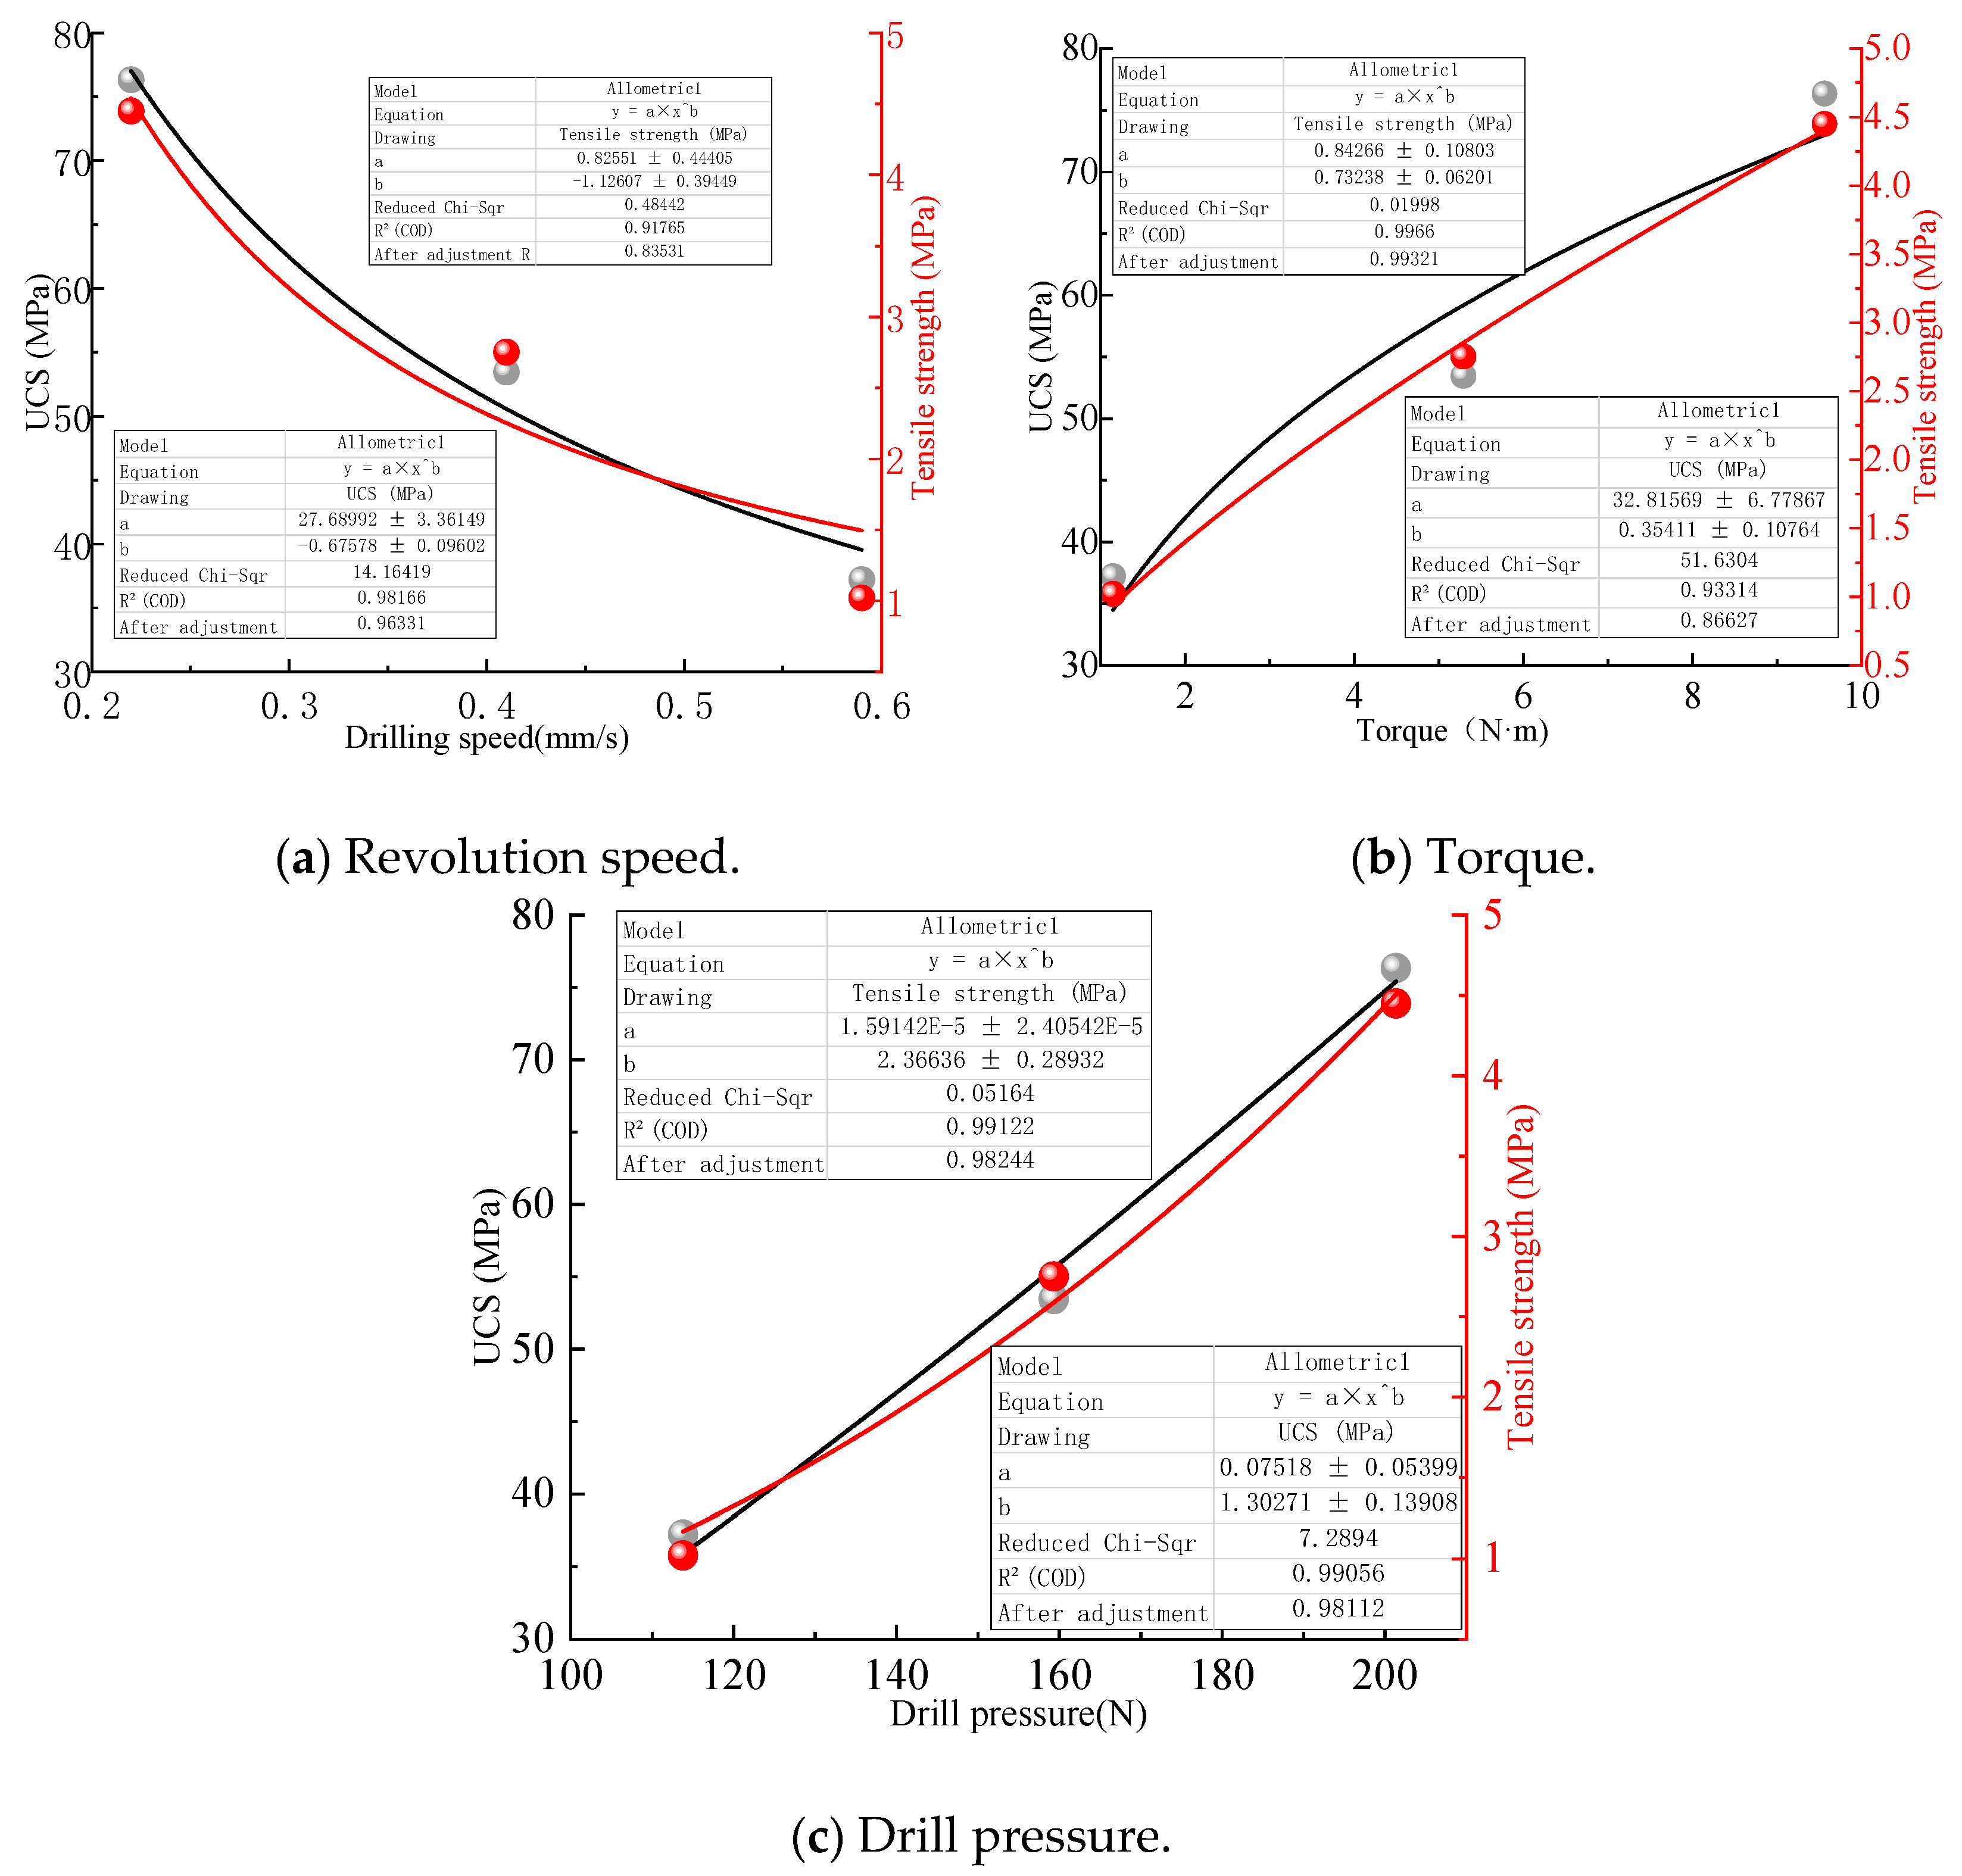
There is an inseparable relationship between drilling parameters and rock parameters. In this study, the correlation analysis between rock mechanical properties and drilling response parameters is further carried out, which provides a theoretical basis for identifying lithologic parameters according to drilling parameters. To study the coupling relationship between drilling parameters and lithologic parameters at 330 r/min, based on the above experiments, the 330 r/min-speed-drilling rock-drilling experiments with different strengths are supplemented to obtain more drilling parameter data and rock parameter data to ensure that the conclusion is reasonable and feasible. The tensile strength and compressive strength of rock reflect the mechanical index of rock resistance to failure. The shear strength characteristics of rock are determined by cohesion (c) and internal friction angle (φ), which are the core mechanical properties that control its resistance to drilling tooth cutting failure. The data obtained from the test are fitted, and the fitting curve is shown in
Figure 12.
Figure 12a shows the relationship between drilling speed and compressive strength and tensile strength. With the increase in rock strength, the drilling speed obviously decreases. Higher rock strength means that the cementation between particles in rock is stronger, and it is more difficult to shear. PDC drill teeth need to consume more energy and longer action time to produce and expand cracks, thus reducing rock-breaking efficiency.
Figure 12b shows the relationship between torque and rock strength, and rock strength is positively correlated with torque.
Figure 12c shows the relationship between WOB and rock strength. The WOB increases with the increase in rock strength. The main function of the WOB is to provide sufficient normal force for the drilling teeth to press into the rock and put it in a critical failure state. The higher the rock strength is, the greater the critical normal stress required to cause damage is, so greater drilling pressure is required.
The power function
is used to fit, and the quantitative relationship between drilling parameters and rock strength parameters is established. The fitting results are shown in
Table 6. For the above fitting function, the goodness-of-fit R
2 is used to represent the degree of fitting. The drilling parameters and uniaxial compressive strength R
2 are 0.98166, 0.93314, and 0.99056, respectively, and the overall fitting effect is good. The drilling parameters and tensile strength R
2 are 0.91765, 0.9966, and 0.99122, respectively, showing a strong correlation between the tensile strength of the drilling parameters, and the fitting relationship is stable. On the whole, the fitting result of torque and uniaxial tensile strength is the best, up to 0.9966, indicating that tensile strength has a great influence on torque. This is because the cutting action of the drill bit is essentially a process of applying shear force to make the rock tensile and shear failure. The higher the tensile strength of the rock is, the stronger the ability to resist the stripping of the cuttings is, resulting in a significant increase in cutting resistance (torque).
The strong correlation between the above drilling parameters and rock strength parameters is derived from the deep mechanical roots of the shear strength parameter cohesion c and internal friction angle φ determined by triaxial tests. The high cohesion value means that the cementation between rock mineral particles is strong, and the drilling teeth must consume enough energy (reflected in higher torque) to destroy the rock skeleton structure to produce effective cuttings. This sets a higher ‘energy threshold’ for the rock-breaking process, which is one of the main reasons for the decrease in drilling speed and the increase in torque. The internal friction angle indicates the sensitivity of the shear strength of the rock to the normal stress. During the drilling process, the normal stress provided by the drilling pressure greatly strengthens the local shear strength of the rock while crushing the rock. This means that the drill bit needs to overcome a rock that has been ‘strengthened’ by its own weight on the bit. In order to destroy it, a greater rotational force (torque) must be applied.
These three drilling response parameters can reflect the rock strength parameters to a certain extent. Therefore, in order to realize the prediction of rock strength, the drilling speed can be used as a macro-index to identify the rock strength, and the torque is particularly sensitive to the tensile failure characteristics of the rock. It is the optimal parameter for the inversion of rock strength, and the drilling pressure can also be used as an input parameter for rock strength prediction.
5. Study Limitations
Although the research has achieved remarkable results in establishing quantitative relationships, it still has some inherent limitations. All experiments in this study used gneiss as a rock. Although gneiss is a typical underground rock, the fracture mechanism and drilling response of rocks with different mineral composition, structure, and genesis (such as granite, limestone, sandstone, etc.) are significantly different. The paper clearly points out that the drilling platform is semi-automatic control, and the drilling pressure is controlled by the manual operation of the rotating tripod handle. Although researchers try to keep the force applied evenly, it will inevitably introduce human error and uncertainty. All drilling experiments were carried out under a fixed confining pressure of 2 MPa. However, in actual mining drilling, the confining pressure environment of the underground rock mass varies with depth.
Based on the above limitations, future research work can be carried out in the following directions. The experimental platform is upgraded to realize the automatic control of the servo motor of the drilling pressure, and the closed-loop dynamic control of the speed and torque is further introduced. Future studies should also eliminate human error and achieve more accurate and repeatable experimental data collection. The power function model with a clear physical mechanism established in this study is embedded into the machine learning model as a priori knowledge. Using machine learning to deal with noise and complexity in experimental data, a prediction model with high accuracy and strong interpretability is developed.
6. Conclusions
In this paper, rock mechanic experiments are carried out; a small drilling platform is built to dynamically collect the changes in drilling parameters during rock drilling, and the influence of rotation speed on drilling efficiency and various parameters is analyzed. The fitting relationship between rock mechanic parameters and drilling parameters is established, and the feasibility of a dynamic monitoring scheme of the drilling rig is discussed, which provides a theoretical basis for the intelligent identification of rock. From the parameter recording of each sensor to the real-time monitoring and inversion of lithology and mechanical parameters based on physical mechanisms.
(1) In order to explore the relationship between drilling parameters and rock parameters, a drilling platform was built to carry out rock-drilling experiments at different speeds. The dynamic response characteristics of drilling parameters were obtained with the drilling monitoring system. High precision, multi-parameter, and dynamic monitoring are realized. The confining pressure system in the equipment is closer to the real underground stress state. Rock-drilling experiments with initial speeds of 330 r/min, 360 r/min, and 390 r/min were carried out. The rock drilling was divided into three stages: the initial drilling stage, crack propagation stage, and bit retreat stage.
(2) All data before drilling are in the initial value; in the initial stage of drilling, the rotational speed of the bit begins to decrease at the moment of contact with the rock, and the torque and pressure increase rapidly. In the crack propagation stage, the parameters are basically stable, and the drilling pressure fluctuates greatly. In the bit retreating stage, all drilling parameters returned to normal. In short, in the experiment of drilling the same lithology specimen under the same confining pressure, the rotational speed is the key operating parameter, and the rotational speed has a great influence on the drilling speed, torque, weight on bit, and drilling time. The increase in rotational speed means that the number of PDC teeth cutting rock per unit time increases, thus accelerating the generation and expansion of cracks and improving the efficiency of rock breaking.
(3) The internal coupling relationship between drilling response parameters can reveal the energy distribution and rock-breaking mechanism during drilling. The Pearson method was used to calculate the correlation degree of torque (T), drilling pressure (F), drilling speed (PR), and rotational speed (RPM). The correlation between F and PR was −0.783, p < 0.05, indicating a strong negative correlation. The negative correlation between F and PR indicates that when the drilling speed is increased, the system automatically or artificially reduces the drilling pressure to maintain stability and avoid overload. The correlation between RPM and PR was 0.827, p < 0.05, indicating a strong positive correlation. There is a significant coupling effect between drilling parameters, in which the drilling speed has a strong driving relationship with WOB and rotational speed. RPM is positively correlated with PR, but in practice, it is necessary to comprehensively balance multiple parameters to avoid the side effects of ‘single parameter optimization’.
(4) To further explore the relationship between drilling parameters and rock parameters, the drilling experiments of drilling different-strength rocks at 330 r/min initial speed were supplemented, and the power function type was used for fitting. The fitting effect of rock strength parameters and drilling speed, torque, and WOB is better as a whole, among which the fitting result of torque and uniaxial tensile strength is the best, as R2 is as high as 0.9966, indicating that tensile strength has a great influence on torque. The quantitative relationship with clear physical meaning is established by the power function model, which has both explanatory and predictive ability. The high cohesion value means that the cementation between rock and mineral particles is strong, and the internal friction angle indicates that the shear strength of rock is sensitive to normal stress. The above research provides a theoretical basis for rock strength identification.
