Article

Study on Influence of Initial Compaction Degree and Water Content on Water-Holding and Permeability Characteristics of Loess

1
Shandong Electric Power Engineering Consulting Institute Corp., Ltd., Jinan 250013, China
2
College of Water Conservancy and Civil Engineering, Northwest A&F University, Xianyang 712100, China
*
Author to whom correspondence should be addressed.
Appl. Sci. 2025, 15(20), 11039; https://doi.org/10.3390/app152011039
Submission received: 18 September 2025 / Revised: 8 October 2025 / Accepted: 10 October 2025 / Published: 15 October 2025

Abstract

The water retention and permeability characteristics of loess are core factors governing geological disaster prevention and engineering stability in the loess regions of northwest China. This study focuses on Yangling loess, systematically conducting soil water characteristic curve (SWCC) measurements and saturated permeability tests under different initial compaction degrees and water contents using a pressure plate apparatus and a TST-55 permeameter. By combining fitting analyses of the Gardner, Fredlund–Xing, and Van Genuchten SWCC models, the study reveals the influence mechanism of initial conditions on the water retention properties of Yangling loess. Furthermore, the unsaturated hydraulic conductivity of loess was predicted using the Van Genuchten–Mualem model. Finally, a quantitative relationship model between hydraulic conductivity and multiple factors (initial compaction degree, water content, and matric suction) was constructed using the response surface methodology. The results indicate the following: (1) A higher initial compaction degree and water content lead to a higher air entry value of loess, resulting in stronger water retention capacity. Among the three models, the Van Genuchten model exhibits the optimal fitting effect for the SWCC of Yangling loess. Its parameter a (related to the air entry value) decreases significantly with increasing compaction degree, while parameter n (pore size distribution index) increases linearly. The SWCC model, considering compaction degree, established based on these findings, can accurately predict the water retention characteristics in the high suction range (0~1200 kPa). This model’s precision in the high-suction segment is particularly valuable, as it addresses a critical range for engineering applications where soil behavior transitions from near-saturated to highly unsaturated states. (2) When loess transitions from a saturated to an unsaturated state, the hydraulic conductivity decreases up to 104 times. Both increased initial compaction degree and water content lead to a significant reduction in hydraulic conductivity. This drastic reduction highlights the sensitivity of loess permeability to saturation changes, which is attributed to the rapid reduction in interconnected pore channels as soil suction increases and pore spaces are filled or compressed under higher compaction. (3) The response surface prediction model quantitatively reveals the influence weights of various factors on hydraulic conductivity in the order of matric suction > initial compaction degree > initial water content. The model exhibits a high coefficient of determination (R2 = 0.9861), enabling rapid and accurate prediction of the hydraulic conductivity of Yangling loess. This high precision confirms that the model effectively captures the complex interactions between the factors, providing a reliable tool for practical engineering calculations. This study provides a new model and experimental basis for the accurate prediction of unsaturated loess hydraulic properties. The proposed SWCC model, considering compaction degree and the response surface model for hydraulic conductivity, offers practical tools for engineers and researchers, facilitating more precise design and risk assessment in collapsible loess areas.

1. Introduction

Collapsible loess is widely distributed in the northwestern region of China [1], and it plays a crucial role in infrastructure development and agricultural production [2]. However, under the influence of global climate change, extreme rainfall events have occurred frequently in this region in recent years. Additionally, due to hydraulic erosion, the soil mass exhibits characteristics such as low erosion resistance and loose structure, making it more prone to geological hazards (e.g., landslides and subgrade collapse). These hazards pose a significant threat to soil and water conservation, ecological security, and even the safety of human lives and property in the northwestern region [3]. Meanwhile, water-related properties inherent to loess, such as collapsibility and water sensitivity, often induce significant damage to the soil mass, which in turn leads to more severe engineering accidents.
Therefore, in engineering practices (e.g., foundation treatment and stability mitigation) and agricultural production activities within collapsible loess regions, research focused on the water retention and permeability characteristics of loess holds significant theoretical significance and practical application value. The soil water characteristic curve (SWCC) is a core tool for characterizing the water retention properties of unsaturated loess. It describes the relationship between soil water content and matric suction within the soil and serves as a critical parameter that must be considered in the study of unsaturated soils [4,5,6,7]. Currently, the soil water characteristic curve (SWCC) has emerged as a primary focus of research among numerous scholars, and related studies have also been extensively conducted. Wang Jinwei et al. [8] conducted fitting analyses on unsaturated loess from the Longdong region of Gansu Province using the Gardner, Van Genuchten, and Fredlund–Xing models. Their results indicated that the Van Genuchten model exhibited the optimal overall fitting performance. Specifically, the influence of initial dry density on the SWCC was primarily observed in parameter θr (residual volumetric water content) and parameter a (associated with the air entry value), whereas parameter n was less affected by initial dry density. Zhang Lu et al. [9] investigated the soil water characteristic curves (SWCCs) of undisturbed loess from the northwestern Shanxi region and the Fenhe River Basin. Their findings revealed that the four-parameter Fredlund–Xing model exhibited the optimal fitting performance, followed by the three-parameter Gardner model (which featured simpler parameters), while the two-parameter Williams model performed the poorest. The first two models were found to be more suitable for the northwestern Shanxi region, whereas the latter was better suited for the Fenhe River Basin—this discrepancy was attributed to differences in the properties of soil samples between the two regions. Ye Tao et al. [10] performed fitting analyses on low liquid limit silty loess from the Yili region of Xinjiang using the Gardner and Van Genuchten models. Their results showed that the Gardner model exhibited high fitting accuracy only in the low suction range, whereas the Van Genuchten model achieved better overall fitting performance. Additionally, matrix suction was found to be rapidly derivable using mass water content. Cai Guoqing et al. [11] conducted soil water characteristic curve (SWCC) fitting analyses on sandy loess samples obtained from the Yangcheng Tunnel of the Haoji Railway. Their study revealed that, among three commonly used models, the Gardner model exhibited poor fitting performance, whereas both the Fredlund–Xing and Van Genuchten models achieved relatively satisfactory fitting results. Although the correlation coefficient from the Fredlund–Xing model fitting was slightly higher, the Van Genuchten model performed better in fitting the high-suction segment of the sandy loess SWCC. Additionally, dry density was found to exert a significant influence on the parameters of each model. Zhang Yaguo et al. [12] performed fitting analyses on loess samples from the southern tableland of the Jing River in Jingyang County, Shanxi Province using the Fredlund–Xing model. Their findings indicated that as the dry density of the loess increased, the values of parameters a and n in the model also increased, whereas the value of parameter m decreased. Wei Xiaoqi et al. [13] performed fitting analyses on loess samples from Heimugou, Luochuan (Yan’an, Shanxi Province) using the Van Genuchten model. Their results showed that initial water content exhibited a negative correlation with air entry value (AEV)-related parameters, and residual water content was indirectly influenced by changes in pore structure induced by initial water content. Ehsan Badakhshan et al. [14] proposed a hysteretic water retention model that accounts for soil deformability. By modifying the van Genuchten model, they established a boundary surface that defines the state of soil void ratio, suction, and saturation. This model can accurately capture the hysteretic water retention characteristics (including main curves and scanning paths) and was embedded into the finite element program Code Bright to verify its applicability to different types of soils and its performance in simulating rainfall-induced landslides.Mathieu Nuth et al. [15] focused on the research progress of hysteretic water retention curve modeling for deformable soils, and pointed out the limitation of most existing models that only consider either capillary hysteresis or void ratio dependence. Based on literature and their own experimental data, they constructed a water retention sub-model that simultaneously couples the effects of capillary hysteresis and mechanical strain through an elasto-plastic analogy (kinematic hardening). This sub-model clarifies the inherent shape of the water retention curve and the relationship between the air entry value and the void ratio, and its ability to predict complex water retention processes has been verified.
The hydraulic conductivity of soil serves as a fundamental parameter for investigating the permeability properties of unsaturated soil. Particularly in water-related engineering projects, the hydraulic conductivity of soilhas become an indispensable component of unsaturated soil research, primarily due to the concealment and severity of seepage-induced damage. Currently, two primary approaches are used for determining the unsaturated hydraulic conductivity: indirect methods and direct measurement methods. Direct measurement methods are not only complex to operate, time-consuming, and labor-intensive, but also suffer from limitations: the operability of existing measurement instruments still requires improvement, and their measurement accuracy has not yet been validated. In contrast, indirect methods for determining unsaturated hydraulic conductivity are based on the soil water characteristic curve (SWCC), with which functional relationships between hydraulic conductivity and either matric suction or water content are derived. Therefore, scholars generally prioritize the use of indirect methods for investigating unsaturated hydraulic conductivity. Among these studies, Hu Mengling et al. [16] predicted the unsaturated hydraulic conductivity of loess in the Xi’an region using the Childs-Collis-George model. Their findings revealed that unsaturated hydraulic conductivity increased with increasing volumetric water content, decreased with increasing matric suction, and also decreased with increasing dry density. Fan Jiangwen et al. [17] performed fitting analyses on the unsaturated hydraulic conductivity of loess from the Yan’an New District using the two-parameter Gardner model. Their findings revealed that, for the unsaturated permeability curves of loess with varying dry densities, significant differences in hydraulic conductivity were observed among samples with different dry densities when matric suction was less than 100 kPa. In contrast, when matric suction exceeded 100 kPa, hydraulic conductivity values showed almost no variation across the different dry density samples. Gao Junyang et al. [18] utilized the experimental principle of the wetting front advance method to calculate the unsaturated hydraulic conductivity. This calculation was based on volumetric water content, matric suction, wetting front movement velocity, and the time interval of data collected by soil moisture sensors. Their results indicated that as dry density and salt content increased, the unsaturated hydraulic conductivity of loess-like sulfate saline soil gradually decreased, with this trend being most pronounced in the low suction range. Studies by Wang et al. [19] have shown that the Kunze method and Fredlund method—both of which are based on statistical models and used to predict the unsaturated hydraulic conductivity of soils from the soil water characteristic curve (SWCC)—are inherently identical. The only distinctions between the two methods lie in the form of integral limits and integral variables. In simplified calculations, a segment count (m) ranging from 15 to 50 is considered reasonable. Due to the specific setting of integral limits, the Fredlund method is theoretically prone to overestimating results. Furthermore, the unsaturated hydraulic conductivity is highly sensitive to changes in water content when approaching saturated water content. In contrast, when approaching residual water content, the rate of change in hydraulic conductivity is small, with no significant differences observed. Arezoo Rahimi et al. [20] pointed out that the measurement range of SWCC has a significant impact on the estimated permeability function. It was also found that the influence of the SWCC measurement range is more significant than that of the selected optimal fitting SWCC equation. In conclusion, scholars at home and abroad have conducted extensive research on the water-holding characteristics and permeability characteristics of unsaturated soil. However, there are still deficiencies in systematic research on the high-suction section, quantitative analysis of the influence of initial conditions on the permeability coefficient, prediction of permeability coefficient under multi-factor coupling, and model adaptability for the characteristics of Yangling loess.
In summary, extensive research has been conducted by scholars worldwide on the water retention and permeability properties of unsaturated soils. However, gaps remain in several key areas: systematic investigations into the high suction range, quantitative analysis of how initial conditions influence hydraulic conductivity, prediction of hydraulic conductivity under multi-factor coupling effects, and the adaptability of models to the specific properties of Yangling loess.
In light of these gaps, Yangling loess was selected as the research material in this study. Systematic experiments were conducted to elucidate the mechanism by which initial compaction degree and water content affect its water retention properties within the high suction range. Additionally, the Van Genuchten model was modified to establish a compaction degree-dependent soil water characteristic curve (SWCC) prediction model. Concurrently, the correlation between initial conditions and hydraulic conductivity was quantitatively analyzed, and a multi-factor hydraulic conductivity prediction model was developed via the response surface methodology (RSM) to identify the influence weights of individual factors. Ultimately, this study provides theoretical basis and experimental support for the accurate prediction of the hydraulic properties of unsaturated loess and the mitigation of engineering hazards in collapsible loess regions.

2. Materials and Solutions

2.1. Test Material

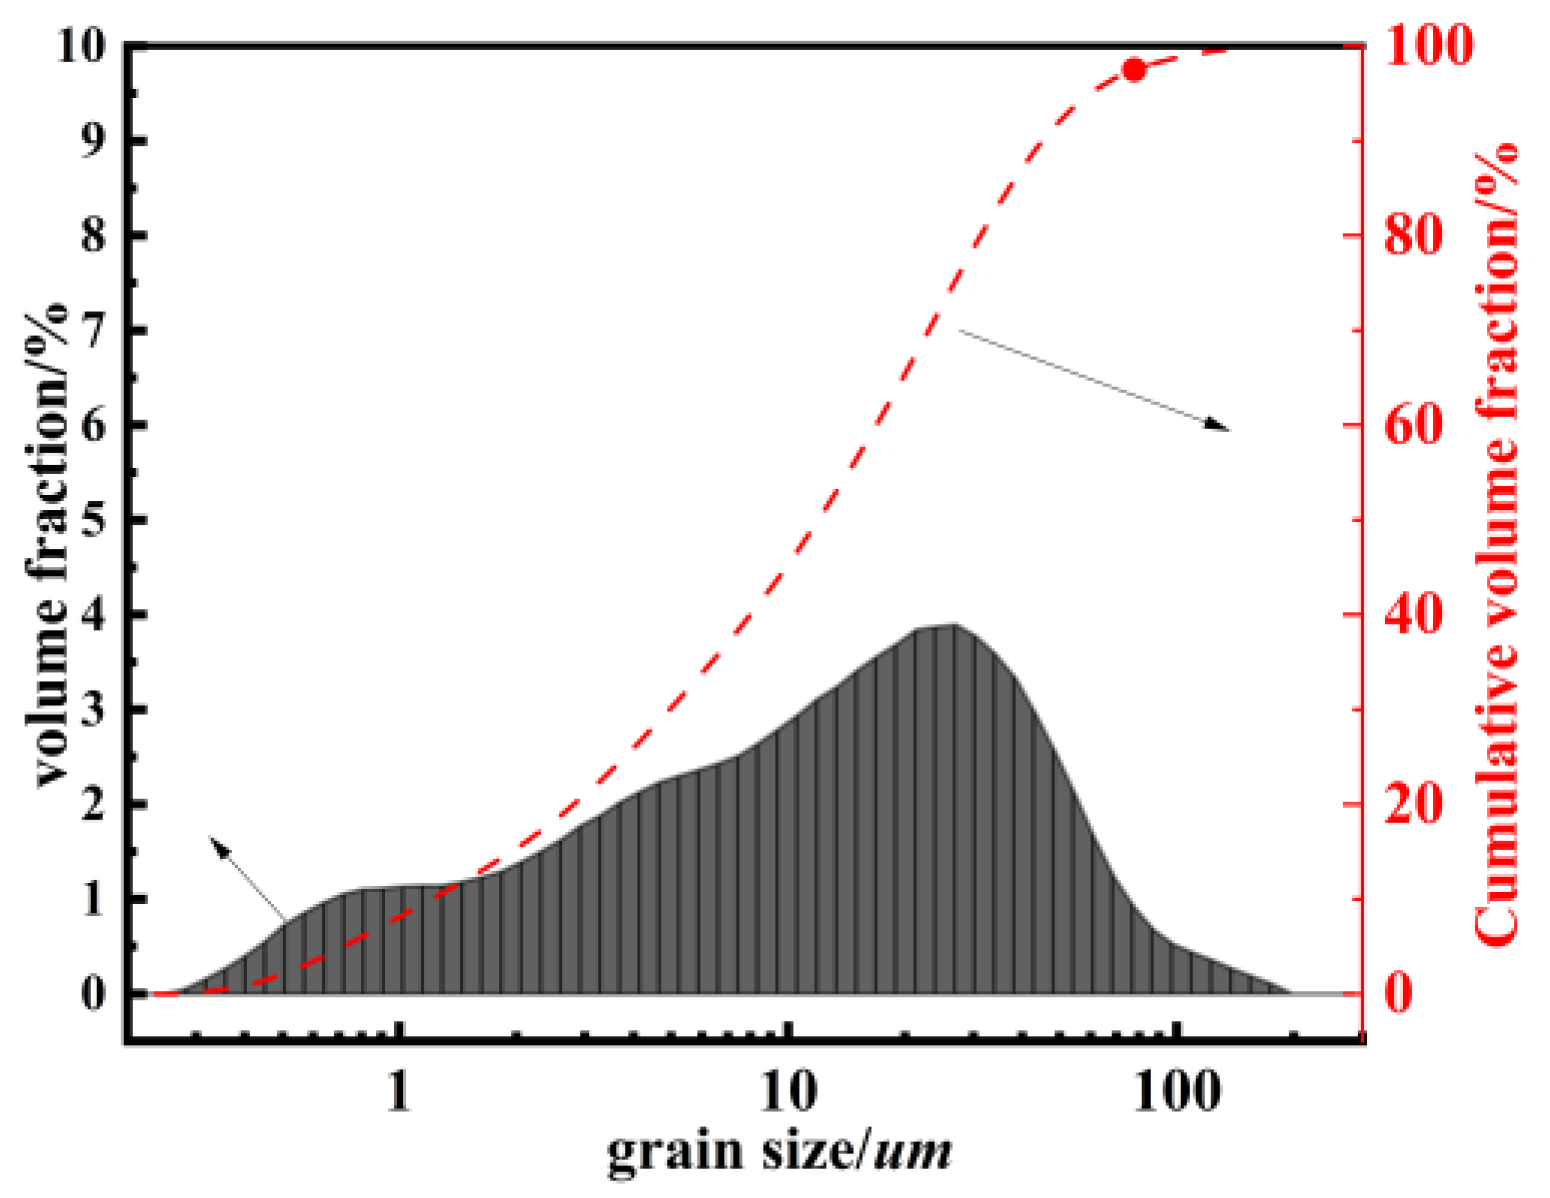
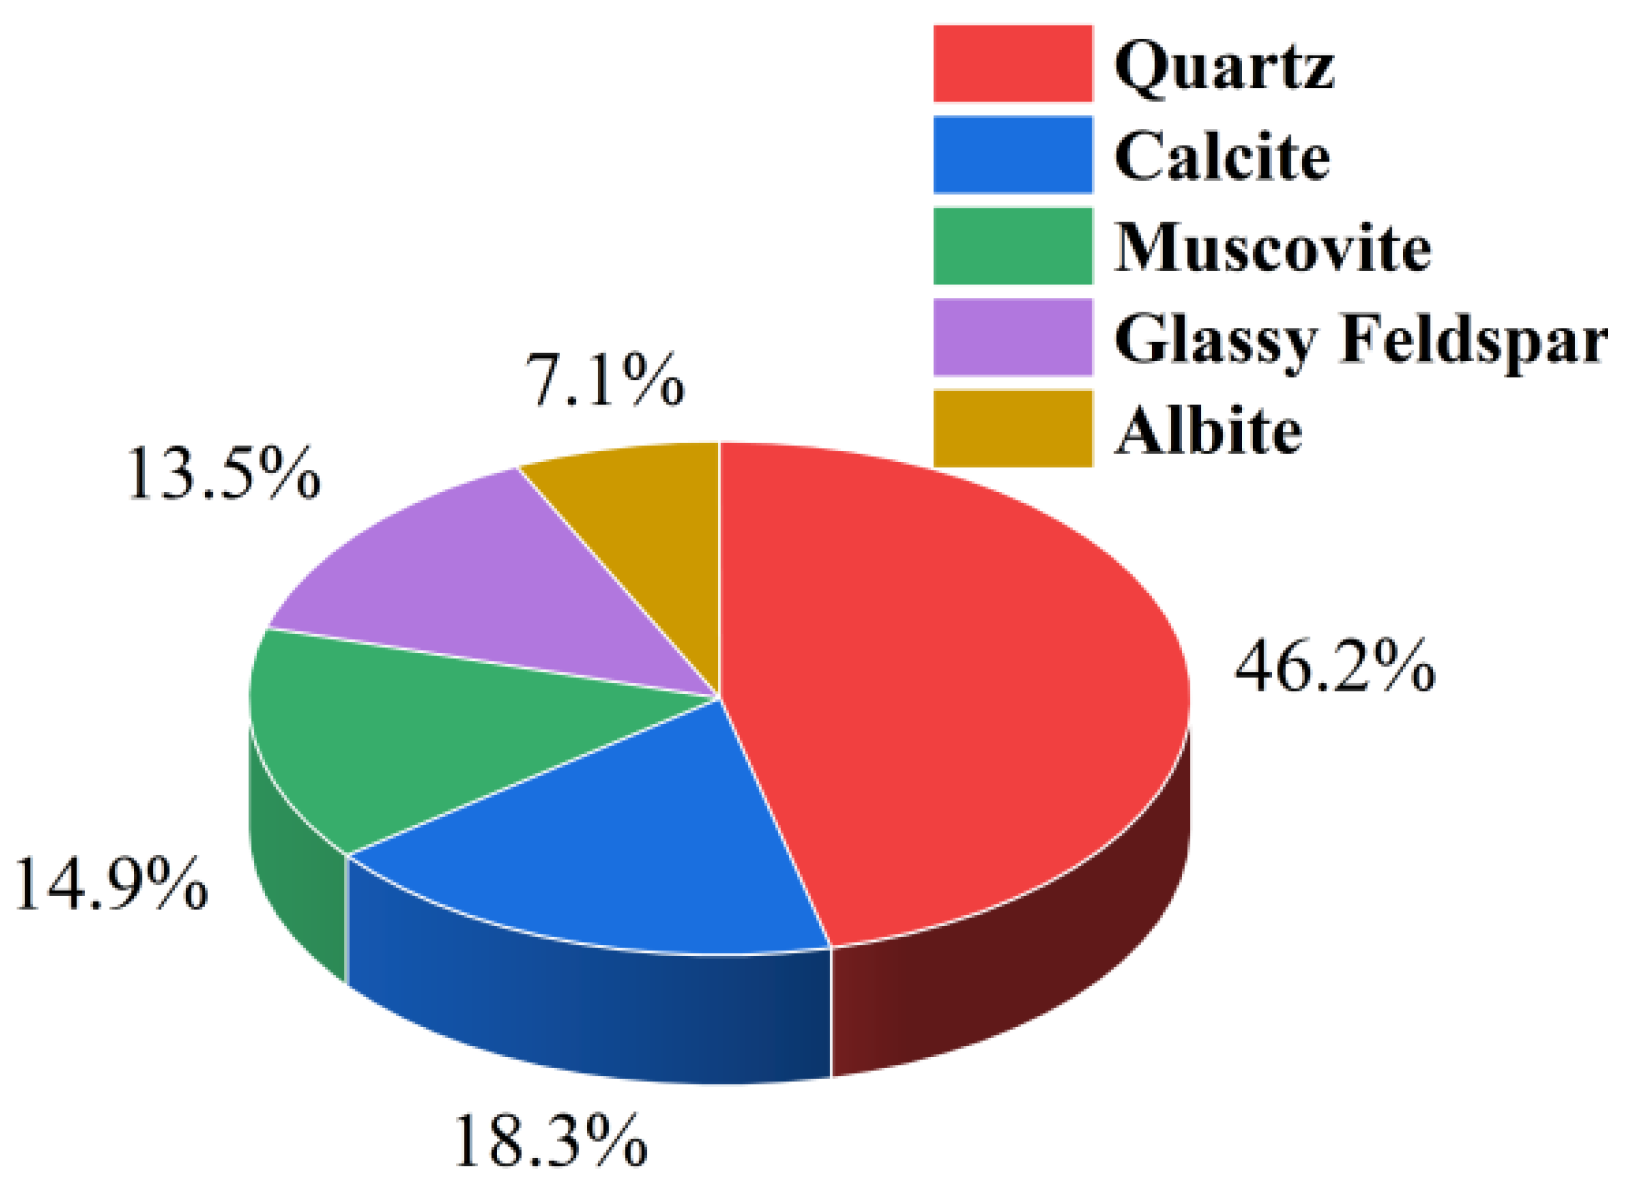
The soil samples used in this study were collected from the loess of a slope in the Yangling Demonstration Zone, Shaanxi Province, at a depth of 3.0~4.0 m below the ground surface. Under extreme rainfall conditions, the loess in this region is prone to inducing hazards such as landslides and subgrade collapse. Therefore, investigating its hydraulic properties holds direct practical significance for safeguarding the safety of regional engineering projects. The physical properties of the soil sample were as follows: optimal water content (weight ratio) = 17.2%, maximum dry density = 1.72 g/cm3, liquid limit (wL) = 32.7%, natural water content = 9.4%, plastic limit (wp) = 18.4%, plasticity index (Ip) = 14.3%, and specific gravity (Gs) = 2.72. The particle size distribution curve was determined using a Bettersize 2000 laser particle size analyzer, as presented in Figure 1; the soil was classified as silty clay. Mineral composition analysis of the soil sample was performed using an intelligent multi-functional X-ray diffractometer (Rigaku, Tokyo, Japan), with the results presented in Figure 2.
X-ray diffraction analysis revealed that the mineral composition of Yangling loess (e.g., clay mineral content, cement type) differs significantly from that of loess in regions such as Longdong (Gansu Province) [8] and northwestern Shanxi [9]. Notably, its pore distribution is more refined, which results in a more pronounced influence of compaction degree on its properties. Additionally, when compared to low liquid limit silty loess from Yili (Xinjiang Uygur Autonomous Region) [10] or undisturbed loess from Shanxi Province [9], Yangling loess exhibits a higher plasticity index (14.3). Its water retention capacity is more sensitive to initial conditions (i.e., compaction degree, water content), which necessitates the development of tailored models for this specific loess type.

2.2. Test Method

The soil water characteristic curve (SWCC) serves as a core link in investigating the mechanical properties of unsaturated soils, as it exhibits strong correlations with soil strength, hydraulic conductivity, and deformation behavior. In this study, investigations were conducted based on SWCC tests to systematically evaluate the applicability of SWCC equations for unsaturated loess. Building on these findings, research was further carried out to predict the hydraulic conductivity of unsaturated loess. Methods for obtaining the soil water characteristic curve (SWCC) are categorized into two main types: direct measurement methods and indirect measurement methods. Direct measurement methods primarily include techniques such as the tensiometer method, pressure plate method, and hygrometer method. Indirect measurement methods, on the other hand, mainly consist of approaches like the filter paper method and salt solution method. Currently, numerous methods are available for measuring matric suction. Studies by Wang et al. [21] have indicated that the pressure plate method does not disrupt soil structure, with a typical maximum measurable suction value of 15 bar. Furthermore, this method exhibits relatively reliable and stable performance. Chen Zhenghan et al. [22] pointed out that the suction of common fill, loess, expansive soil and red clay in engineering under working environment generally does not exceed 1500 kPa. Based on a comprehensive comparison of the applicability of various methods and the practical characteristics of the research material, the use of a pressure plate apparatus (suction range: 0–1500 kPa) was determined to be appropriate for measuring the matric suction of the loess in this study. Based on the basic physical properties of the loess, the test samples were classified as fine-grained soils. In accordance with the Standard for Soil Test Methods (GB/T 50123-2019) [23], the variable-head permeability test was employed.
Key factors influencing the soil water characteristic curve (SWCC) include soil mineral composition, particle gradation, dry density, shrinkage behavior, stress state, and temperature. Research has demonstrated that, aside from mineral composition, all other factors influence the SWCC by altering the soil’s pore size characteristics. This influence is ultimately manifested in the shape of the curve. Analysis revealed that the mineral composition of the soil samples used in this study was relatively consistent. The focus of this research was placed on the influence of pore size. Initial water content and dry density were selected as key variables because they are important factors affecting pore size and can be measured using simple, efficient methods. Therefore, a comparative analysis of drying curves was conducted in this study based on these two initial conditions.

2.2.1. Test Device and Procedure

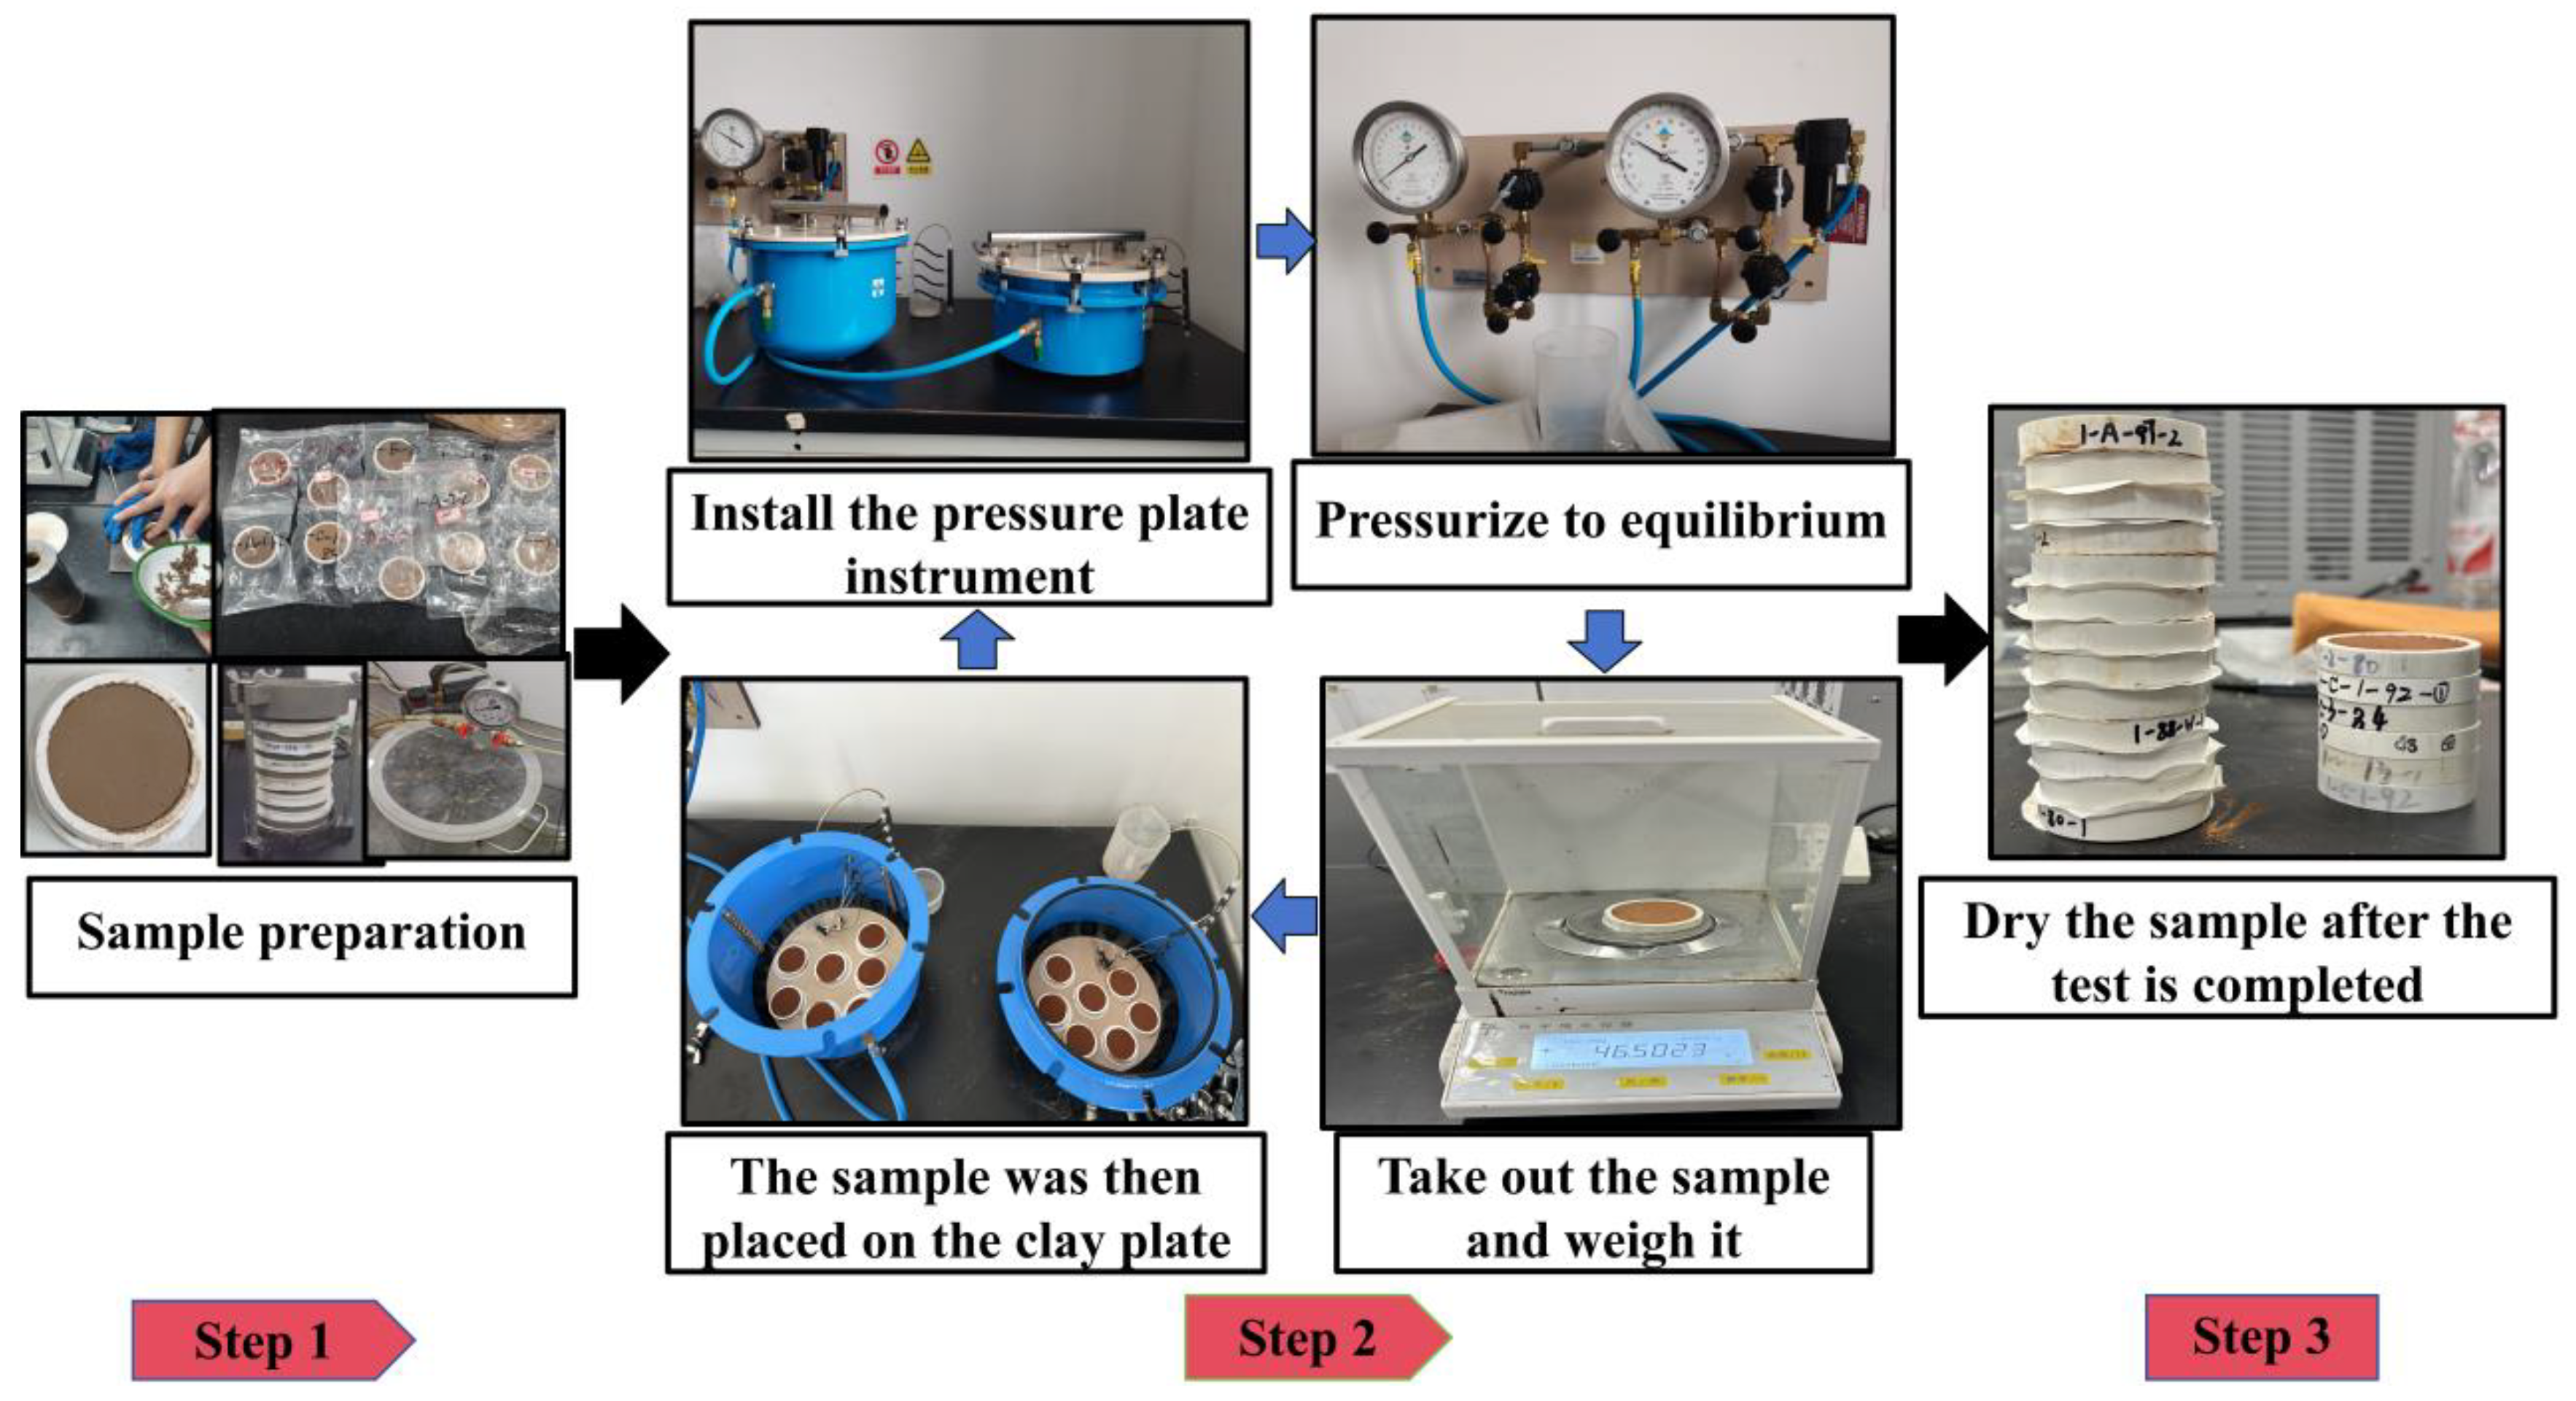
Soil Water Characteristic Test: test data were acquired using Model—1600F1 and Model—1500F2 pressure plate apparatuses manufactured by SOILMOISTURE Equipment Corp. These apparatuses primarily consist of a metal pressure vessel and a saturated ceramic plate with a high air entry value (AEV) of 15 bar, and offer a measurement range of 0.0~1.5 MPa. The steady-state multi-step outflow method is typically employed for measuring SWCCs using pressure plate apparatuses. After applying air pressure to a soil sample, the system is allowed to equilibrate until no further changes in drainage volume are observed over a specified period. Once equilibrium is achieved, the next increment of air pressure is applied. The detailed test procedure is outlined below: (1) Saturation was performed on the prepared soil samples and high air entry value (AEV) ceramic plates. Specifically, the soil samples were saturated using a vacuum saturation method, whereas the AEV ceramic plates were saturated with degassed pressurized water. (2) Saturated ceramic plates were placed on the test stand, and drainage pipes leading to the exterior were connected. Saturated soil samples were then removed, and their mass was measured first. Immediately afterward, the soil samples were placed on the ceramic plates, with care taken to ensure intimate contact between the samples and the ceramic plate surfaces. After the top cover of the pressure vessel was secured, the pressure was adjusted to the predetermined value using a pressure regulating valve. (3) The mass of water-containing volumetric flasks was measured using a precision electronic balance. Equilibrium of the soil sample under the current suction level was indicated by the cessation of water outflow from the sample. At this point, the suction was reduced to zero, and the top cover of the pressure vessel was opened. The mass of each soil sample was then weighed, after which the samples were returned to their original positions and the cover was resecured. The mass of water displaced from the soil sample was calculated from the difference between the mass of the saturated sample and its mass at equilibrium under the current suction level. This mass of displaced water was then converted to determine the volumetric water content of the sample. The above steps were repeated, with the next increment of suction applied sequentially until the entire test was completed. A flowchart of the test procedure is presented in Figure 3.
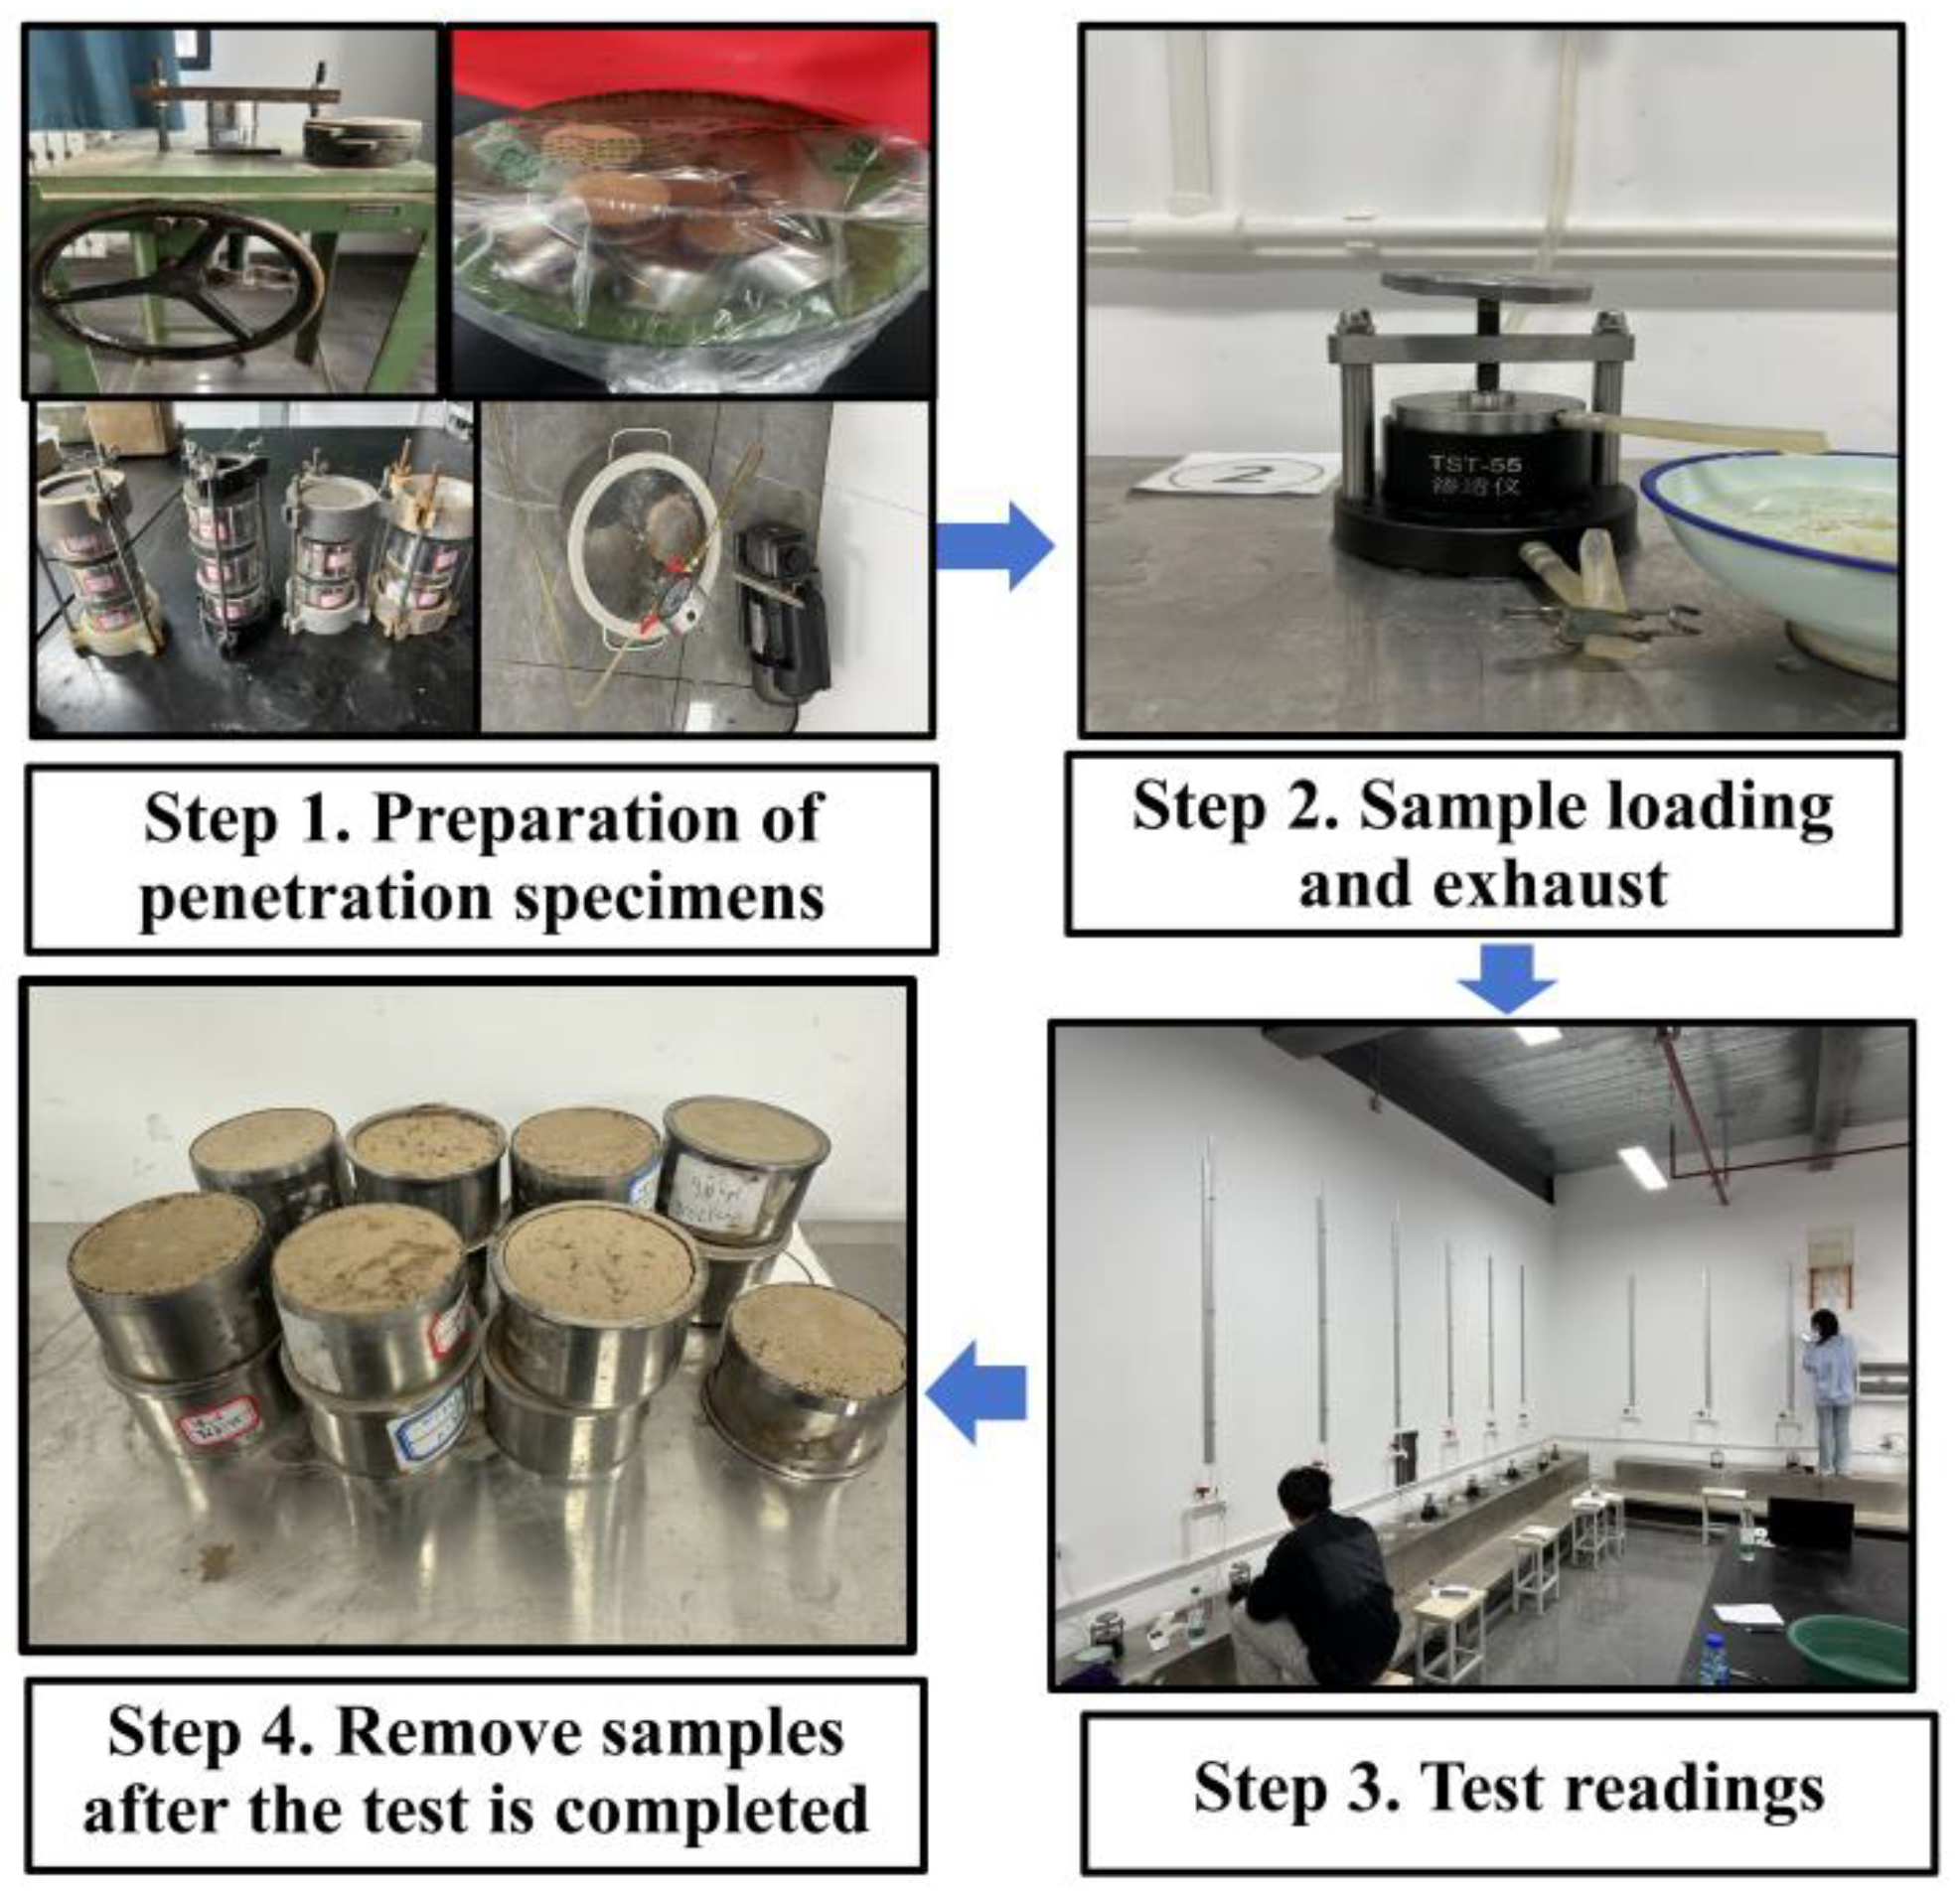
Saturated Permeability Test: The variable-head method was employed to determine the hydraulic conductivity of soil samples in a saturated state. To prevent water leakage through the gap between the soil sample and the permeameter (which would compromise test accuracy), petroleum jelly was applied to the inner surface of the cutting ring prior to sample preparation. Additionally, petroleum jelly was applied to the inner surface of the permeation cell (in contact with the cutting ring) and the rubber gaskets before testing. The experiment was conducted by using the static pressure method to prepare specimens with different initial moisture contents and compaction degrees, with a diameter of 61.8 mm and a height of 40 mm, and then placing them in a stack-type saturation device. These samples (with varying initial water contents and compaction degrees) were placed into stacked saturators. Stacked saturators containing the samples were then placed into a vacuum chamber. The chamber was evacuated using a vacuum pump for at least 1 h, after which water was added to the chamber. Water addition was stopped once the water level completely submerged the top of the stacked saturators, and the samples were allowed to stand for a minimum of 24 h before testing. It is important to note that, prior to testing, stacked saturators containing samples should not be removed from the water bath (used for water immersion saturation) or the vacuum chamber (used for vacuum saturation). Removal would cause moisture evaporation from the samples, which would reduce sample saturation and thereby compromise the accuracy of saturated hydraulic conductivity measurements. During formal testing, samples were quickly removed from the stacked saturators and placed into the permeation cells of the TST-55 permeameters. Additional saturation was maintained for 5–10 min before the test was initiated, as presented in Figure 4.
The test process is as follows:
(1) A thin, uniform layer of petroleum jelly was applied to the inner surface of the permeation cell sleeve. The cutting ring containing the soil sample was then slowly inserted into the sleeve, with care taken to ensure the water-stop gasket was properly seated and secure. After carefully removing any excess petroleum jelly that had been extruded, the upper and lower cover plates (equipped with porous stones) were installed and secured using bolts. This step was critical to ensuring a tight seal and preventing water leakage. (2) The permeation assembly (with the soil sample already installed) was connected to the head assembly. The inlet pipe was filled with water via the water supply tank. The height of the applied water head was adjusted based on the degree of compaction of the soil sample, with a maximum limit of 2 m. Once the water head had stabilized, water was injected into the permeation cylinder. The air release valve was opened, and the assembly was tilted to purge air from the bottom. This process was continued until no air bubbles were observed in the discharged water. Subsequently, the air release valve was closed, and the assembly was returned to a horizontal orientation. (3) The system was allowed to stand for a specified duration under the preset head condition. Formal permeability testing was initiated only after a continuous flow of water was observed from the outlet. The head tube was filled with water to the required height, after which the stopcock was closed. At the initiation of the test, the initial head height and start time in the variable-head tube were recorded. Changes in head height and corresponding times were measured and recorded at predetermined intervals, with concurrent recording of the water temperature at the outlet. After six consecutive sets of measurements, the water level in the head tube was raised back to the required height, and additional consecutive measurements were taken. This test sequence was repeated a total of 5 to 6 times.
The saturated hydraulic conductivity of the soil samples was calculated using the following formula:
k T = 2.3 a L A t lg H b 1 H b 2
where a = cross-sectional area of the variable-head tube, with units of cm2; L = seepage path length (in cm), which is equivalent to the soil sample height; A = the cross-sectional area of the sample (in cm2); t = the penetration time(in s); Hb1 = initial hydraulic head (in cm); Hb2 = final hydraulic head (in cm).
k 20 = k T η T η 20
where k20 = saturated hydraulic conductivity of the soil sample at standard temperature (20 °C), with units of cm/s; ηT = dynamic viscosity of water at temperature T (°C), expressed in units of 1 × 10⁻⁶ kPa·s; η20 = dynamic viscosity of water at 20 °C, also with units of 1 × 10⁻⁶ kPa·s.

2.2.2. Test Plan

All soil samples used in this study were remolded loess. Three initial water contents (9.4%, 13.0%, 17.2%) and five initial compaction degrees were selected as test variables. Compaction degrees were defined relative to the maximum dry density obtained from laboratory compaction tests, with samples prepared at 80%, 84%, 88%, 92%, and 96% compaction. The applied suction path was 0 → 30 → 60 → 100 → 150 → 200 → 300 → 400 → 500 → 600 → 800 → 1000 → 1200 kPa. For the SWCC tests, the samples were prepared using cutting rings with dimensions of 53 mm in diameter and 10 mm in height. For the saturated permeability tests, samples were prepared using a standard cutting ring sampler, with the corresponding cutting rings having dimensions of 61.8 mm in diameter and 40 mm in height. The detailed test protocol is provided in Table 1.

3. Analysis of the Water-Holding Capacity of Unsaturated Loess

The soil water characteristic curve (SWCC) describes the relationship between a soil’s water retention capacity and matric suction, serving as a critical tool for characterizing soil water retention behavior. To date, dozens of models have been developed for describing the SWCC of unsaturated soils. For the purpose of this study, three representative models—widely applied both domestically and internationally—were selected for analysis.
Gardner equation [24]:
θ ψ = θ r + θ s θ r 1 + a ψ n
where θ is the volumetric water content, %; ψ is suction, kPa; θs is saturated volumetric water content, %; θr is the residual volume water content, %; a is the soil parameter related to the air entry value ψAEV, kPa−1; n is a dimensionless soil parameter related to the soil dehumidification rate when ψ > ψAEV.
FX equation [25]:
θ ψ = θ s { ln exp 1 + ψ a n } m
where ψ is the suction corresponding to the residual water content, kPa. m is a dimensionless soil parameter related to residual water content. The meaning of the remaining symbols is the same as above.
VG equation [26]:
θ ψ = θ r + θ s θ r 1 + a ψ n 1 1 n
where n is the soil parameter related to the residual water content, dimensionless. The rest of the symbols mean the same type (3).

3.1. Influence of Initial Compaction Degree on Soil Water Curve

Figure 5 presents the fitting results of the three models for the SWCC desorption curves of soil samples with varying compaction degrees. As analyzed in conjunction with Table 2, all three models exhibited good fitting performance, with the VG model being most appropriate for the Yangling loess investigated in this study. The SWCCs of samples with varying compaction degrees exhibited a consistent overall trend: the drainage rate decreased as compaction degree increased. Specifically, for the same increment in matric suction, samples with higher compaction showed a more gradual decrease in volumetric water content as matric suction increased, compared to samples with lower compaction. Additionally, higher compaction degrees corresponded to higher air entry values. For lower compaction degrees, the SWCC exhibited a steeper slope, indicating a higher rate of water loss and weaker water retention capacity as matric suction increased. For higher compaction degrees, the SWCC was more gradual with a smaller slope, reflecting a slower water loss rate and stronger water retention capacity as matric suction increased. This phenomenon can be attributed to the fact that in highly compacted samples, soil particles were more densely packed, resulting in smaller interparticle pores. In the saturated state (where all pores are water-filled), the internal pores of highly compacted samples were smaller and fewer in number compared to those of less compacted samples. As matric suction increased, pore water within the soil was expelled. Consequently, the rate of decrease in volumetric water content with increasing matric suction was relatively slower for highly compacted samples.
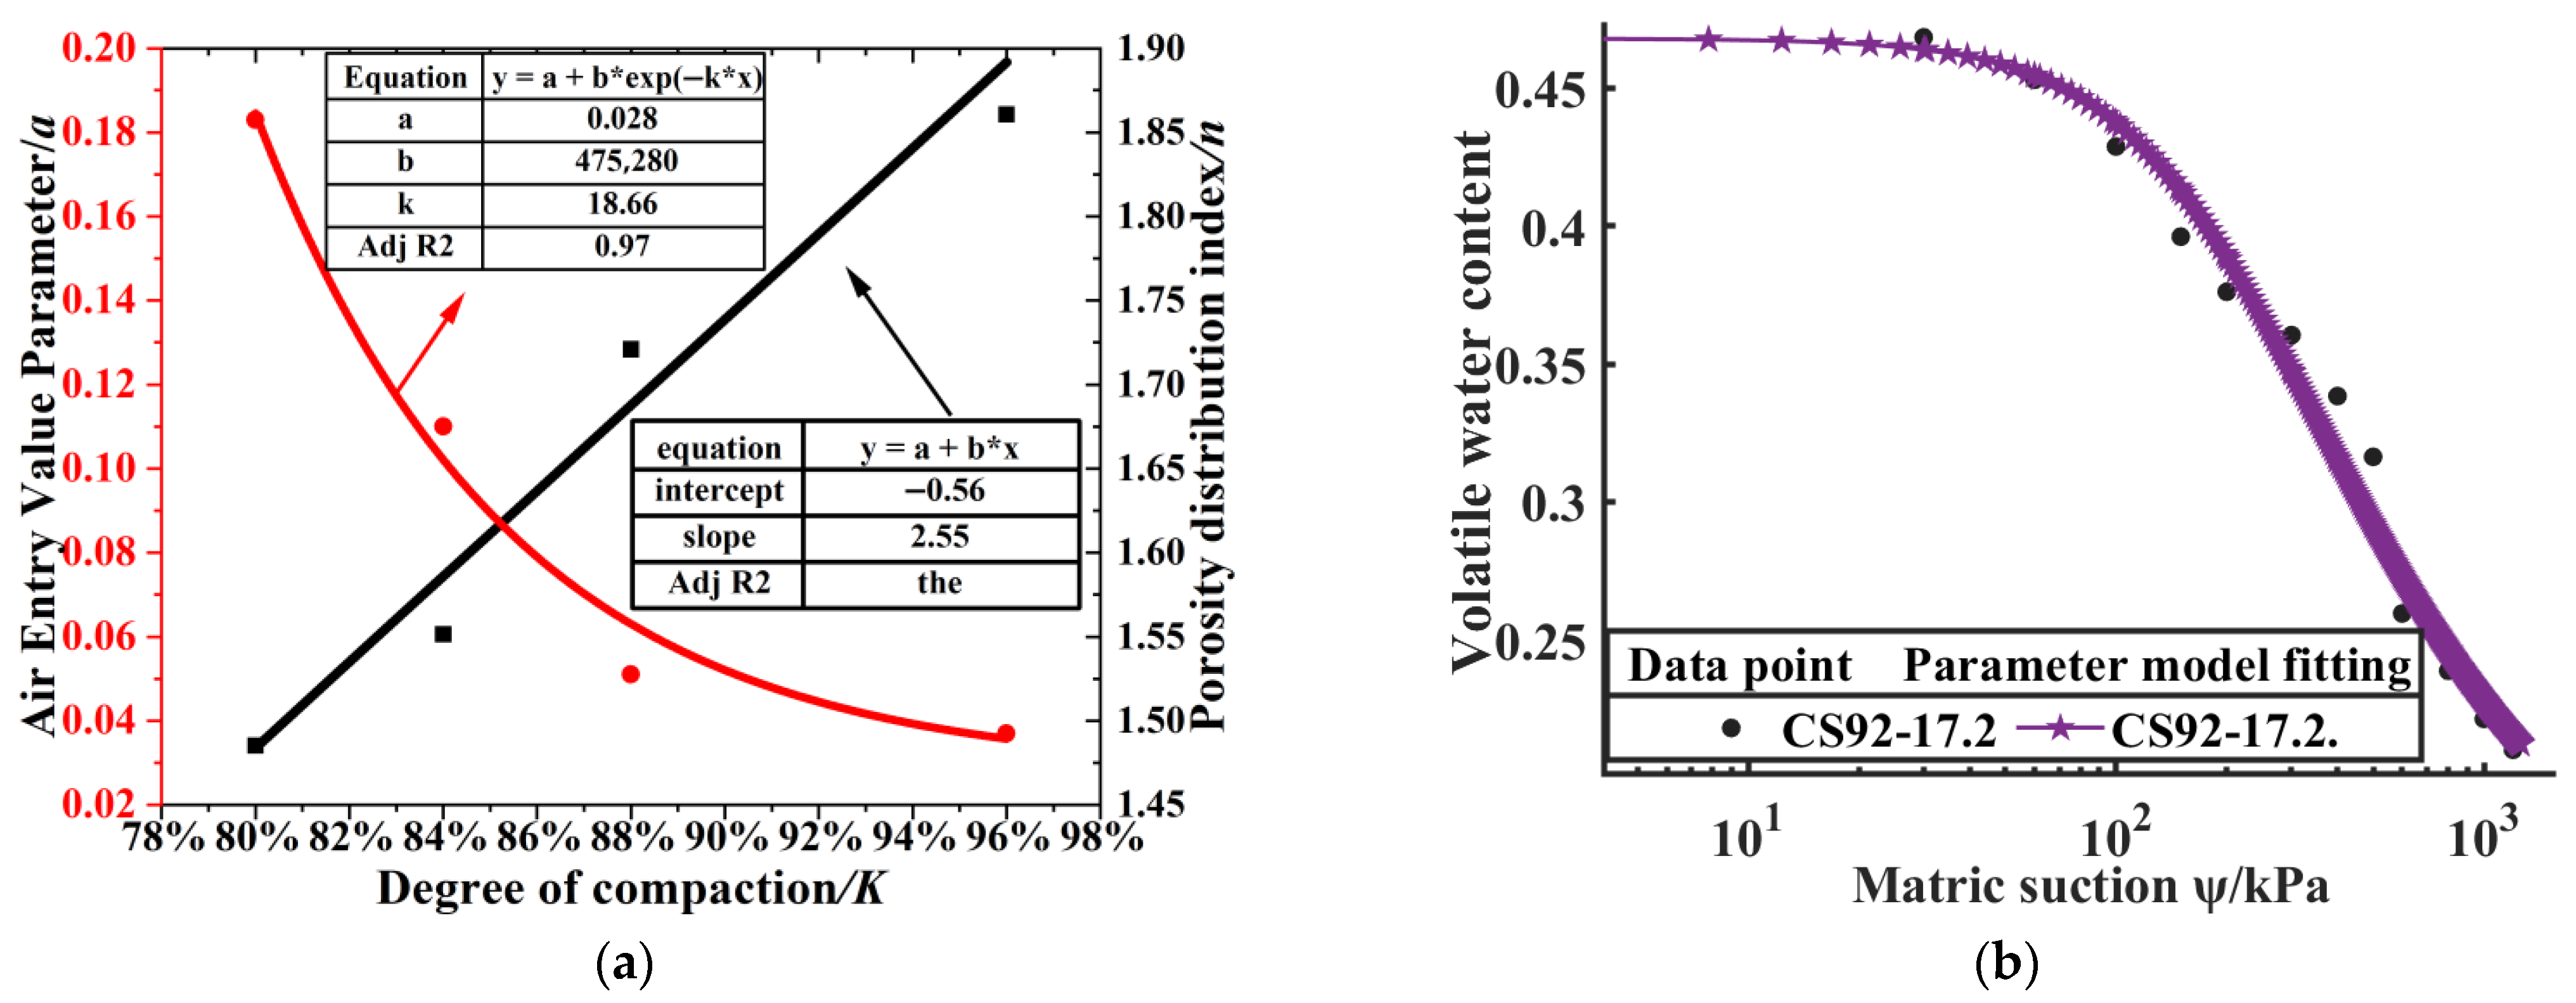
The most suitable VG model was employed in this study for parameter analysis. Figure 6 illustrates the variation trends of the VG model’s fitting parameters with increasing compaction degree.
As observed in Figure 6a, the parameter a (associated with the air entry value) decreases with increasing compaction degree, while the value of n increases with the increase in compaction degree. The specific correlation equations are given as follows:
a = 0.028 + 475280 e 18.66 K n = 0.56 + 2.55 K
Based on the VG model, the soil water curve model considering initial compaction degree can be established by substituting Equation (6):
θ ψ = θ r + θ s θ r 1 + a ψ n 1 1 n a = 0.028 + 475280 e 18.66 K n = 0.56 + 2.55 K
The aforementioned model was used to predict the SWCC of Yangling loess with an initial water content of 17.2% and a compaction degree of 92%. Predicted results were compared with measured values, with the findings presented in Figure 6b. As shown in the figure, the measured values are generally distributed around the model curve, indicating good predictive performance. The SWCC model developed in this study based on the VG model, which incorporates soil compaction degree, provides a simple and feasible approach for determining the SWCC of loess in the Yangling region.

3.2. Influence of Initial Water Content on Soil Water Curve

Figure 7 presents the SWCC desorption curves fitted by the three models for soil samples with varying initial water contents. As analyzed in conjunction with Table 3, and consistent with observations for initial compaction degree, the VG model was again found to be most suitable for the Yangling loess. As observed in the figure, under constant dry density, the SWCC of samples with higher initial water content lay above those of samples with lower initial water content, with corresponding higher air entry values. Specifically, lower initial water content corresponded to more pronounced changes in SWCC slope and lower air entry values. This was attributed to reduced plasticity in soils with low initial water content, which resulted in smaller air entry values. In contrast, higher initial water content enhanced soil plasticity and promoted more uniform pore distribution, thereby improving the samples’ water retention capacity. Air entry values also increased accordingly. Furthermore, with respect to SWCC morphology, once matric suction exceeded the air entry value, the sensitivity of curve slope to initial water content was reduced.
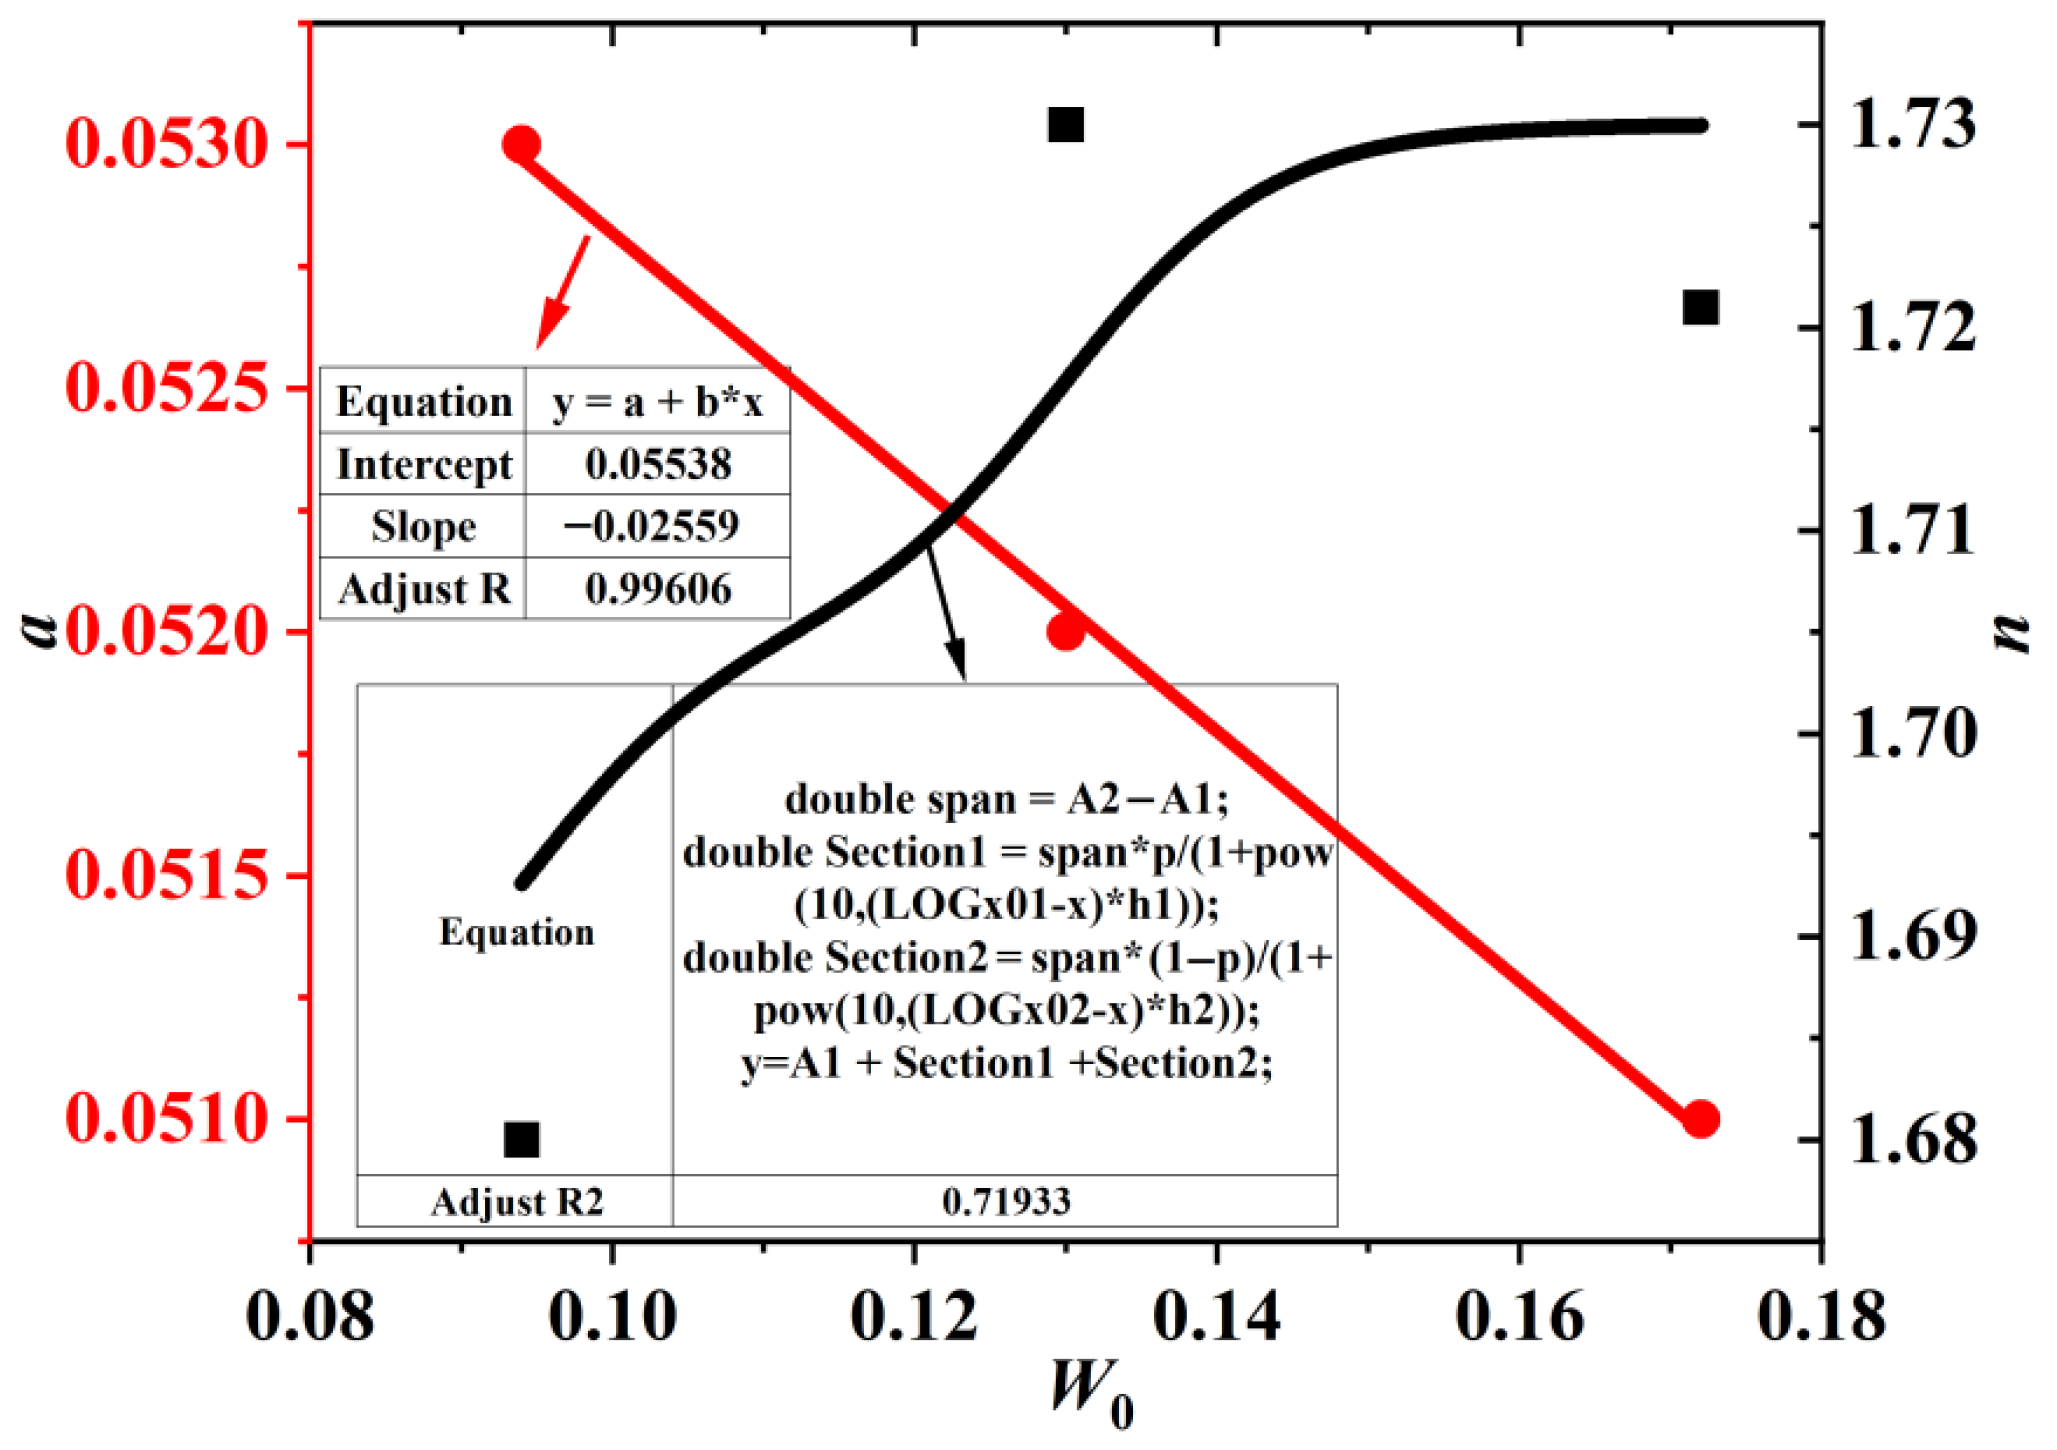
As observed in Figure 8, the parameter a decreased with increasing initial water content, and the relationship between these two variables was well described by a correlation equation. In contrast, the parameter n exhibited minimal variation, and the correlation equation derived from its data had a low coefficient of determination. Consequently, no predictive model for the parameter n with respect to initial water content was developed in this study at this time.

4. Prediction Model of Permeability Coefficient of Unsaturated Loess

The functional relationship between volumetric water content and matric suction can be derived from a known SWCC. The widely used VG-M model [26] for hydraulic conductivity prediction was employed in this study to estimate the hydraulic conductivity of Yangling loess. The VG-M model is mathematically expressed as follows:
K ( S e ) = K s S e l 1 1 S e n l ( n l ) 1 1 / n 2
where a, m, and n are the same as the meaning of the VG model, which are soil sample parameters, where m = 1 − 1/n. Ks denotes the saturated permeability coefficient. Se is the effective saturation, and its expression is as follows:
S e = θ θ r θ s θ r = 1 + a ψ n c
where a, c, n have the meaning of the VG model, ψ is matric suction, kPa.

4.1. Influence of Different Initial Conditions on the Permeability Coefficient

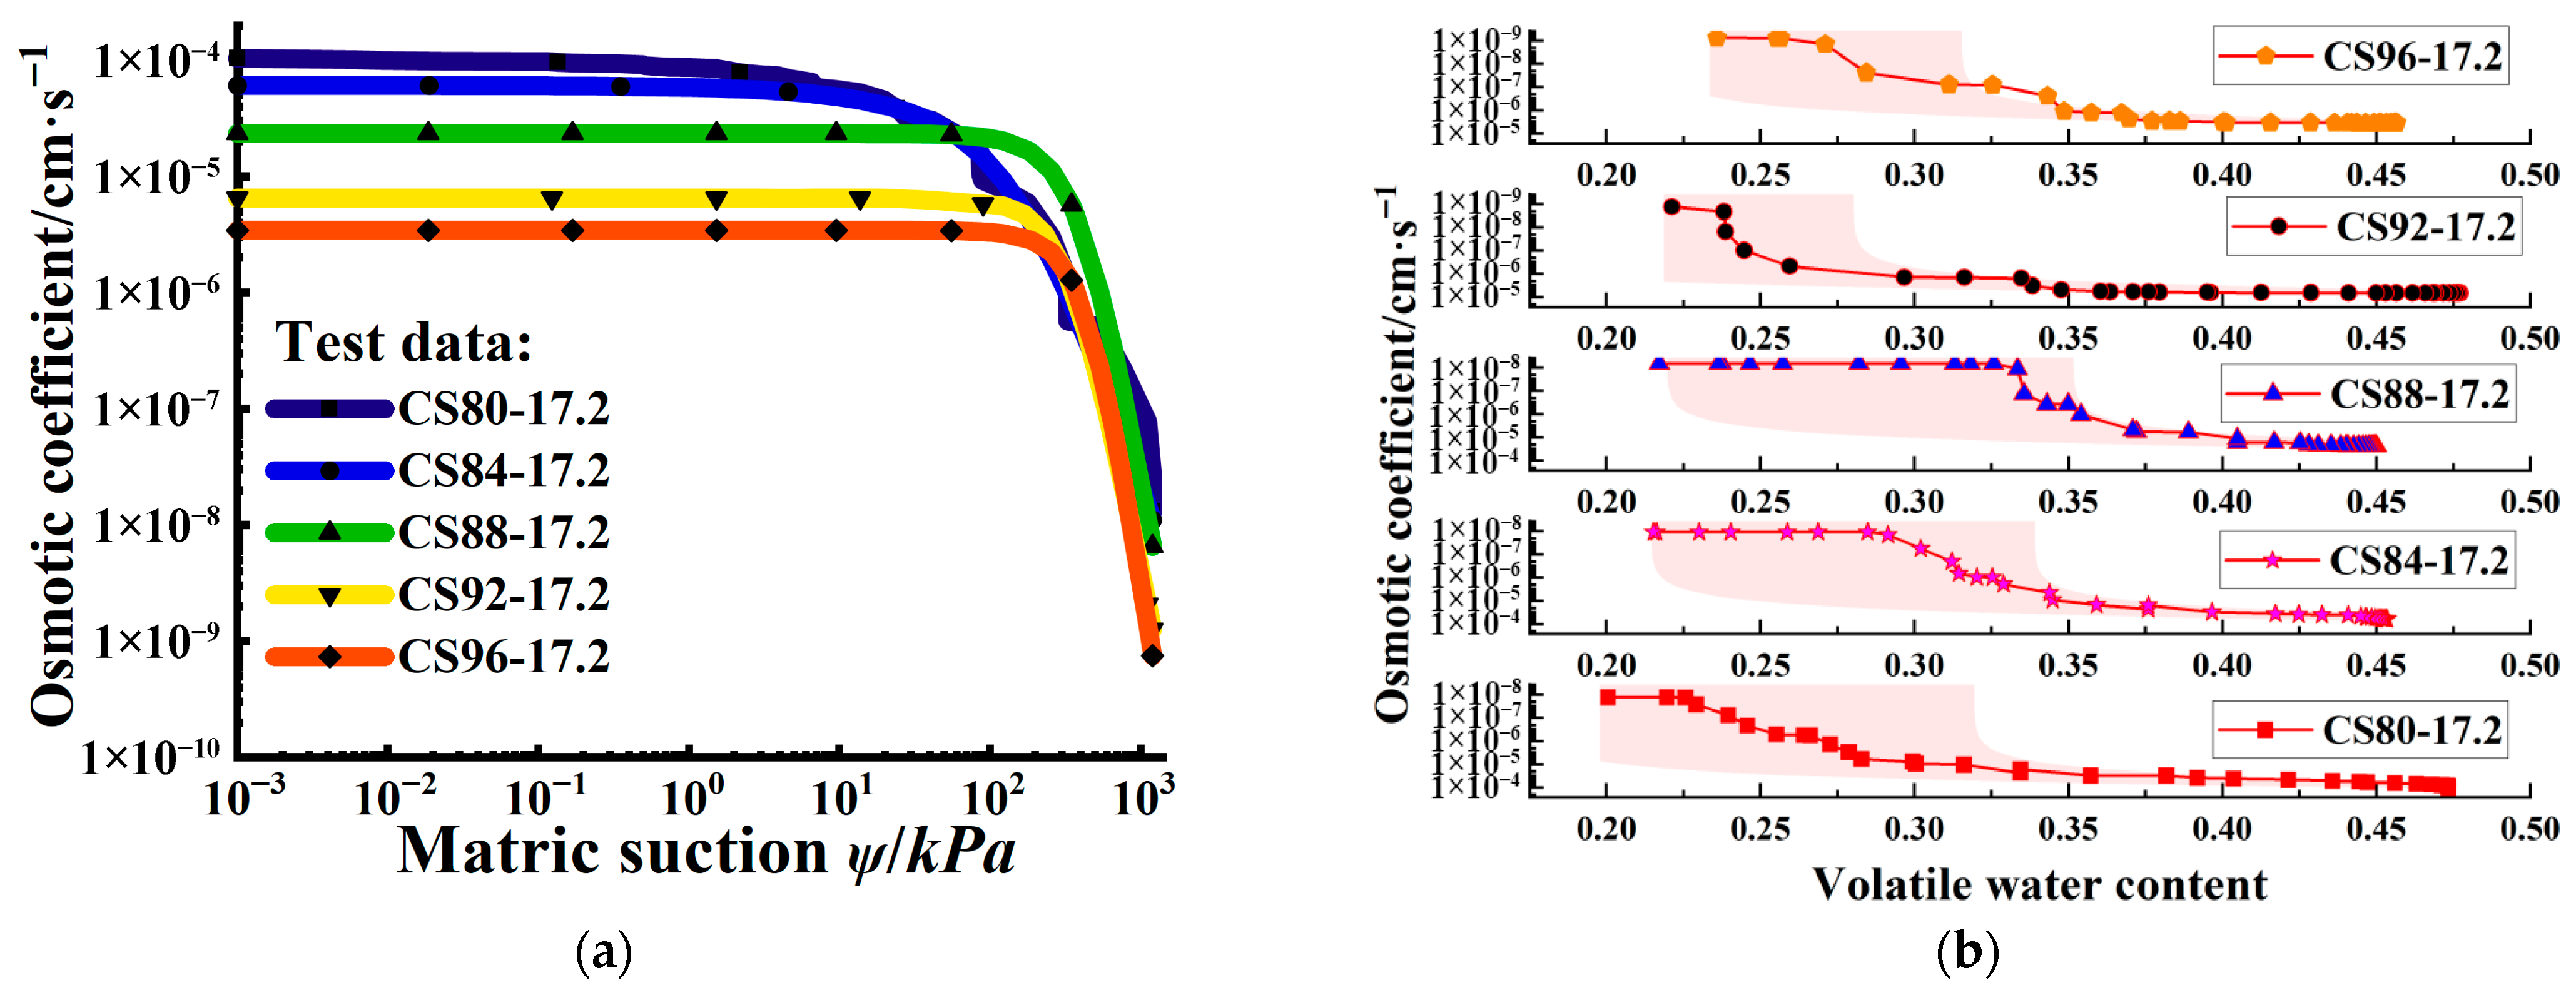
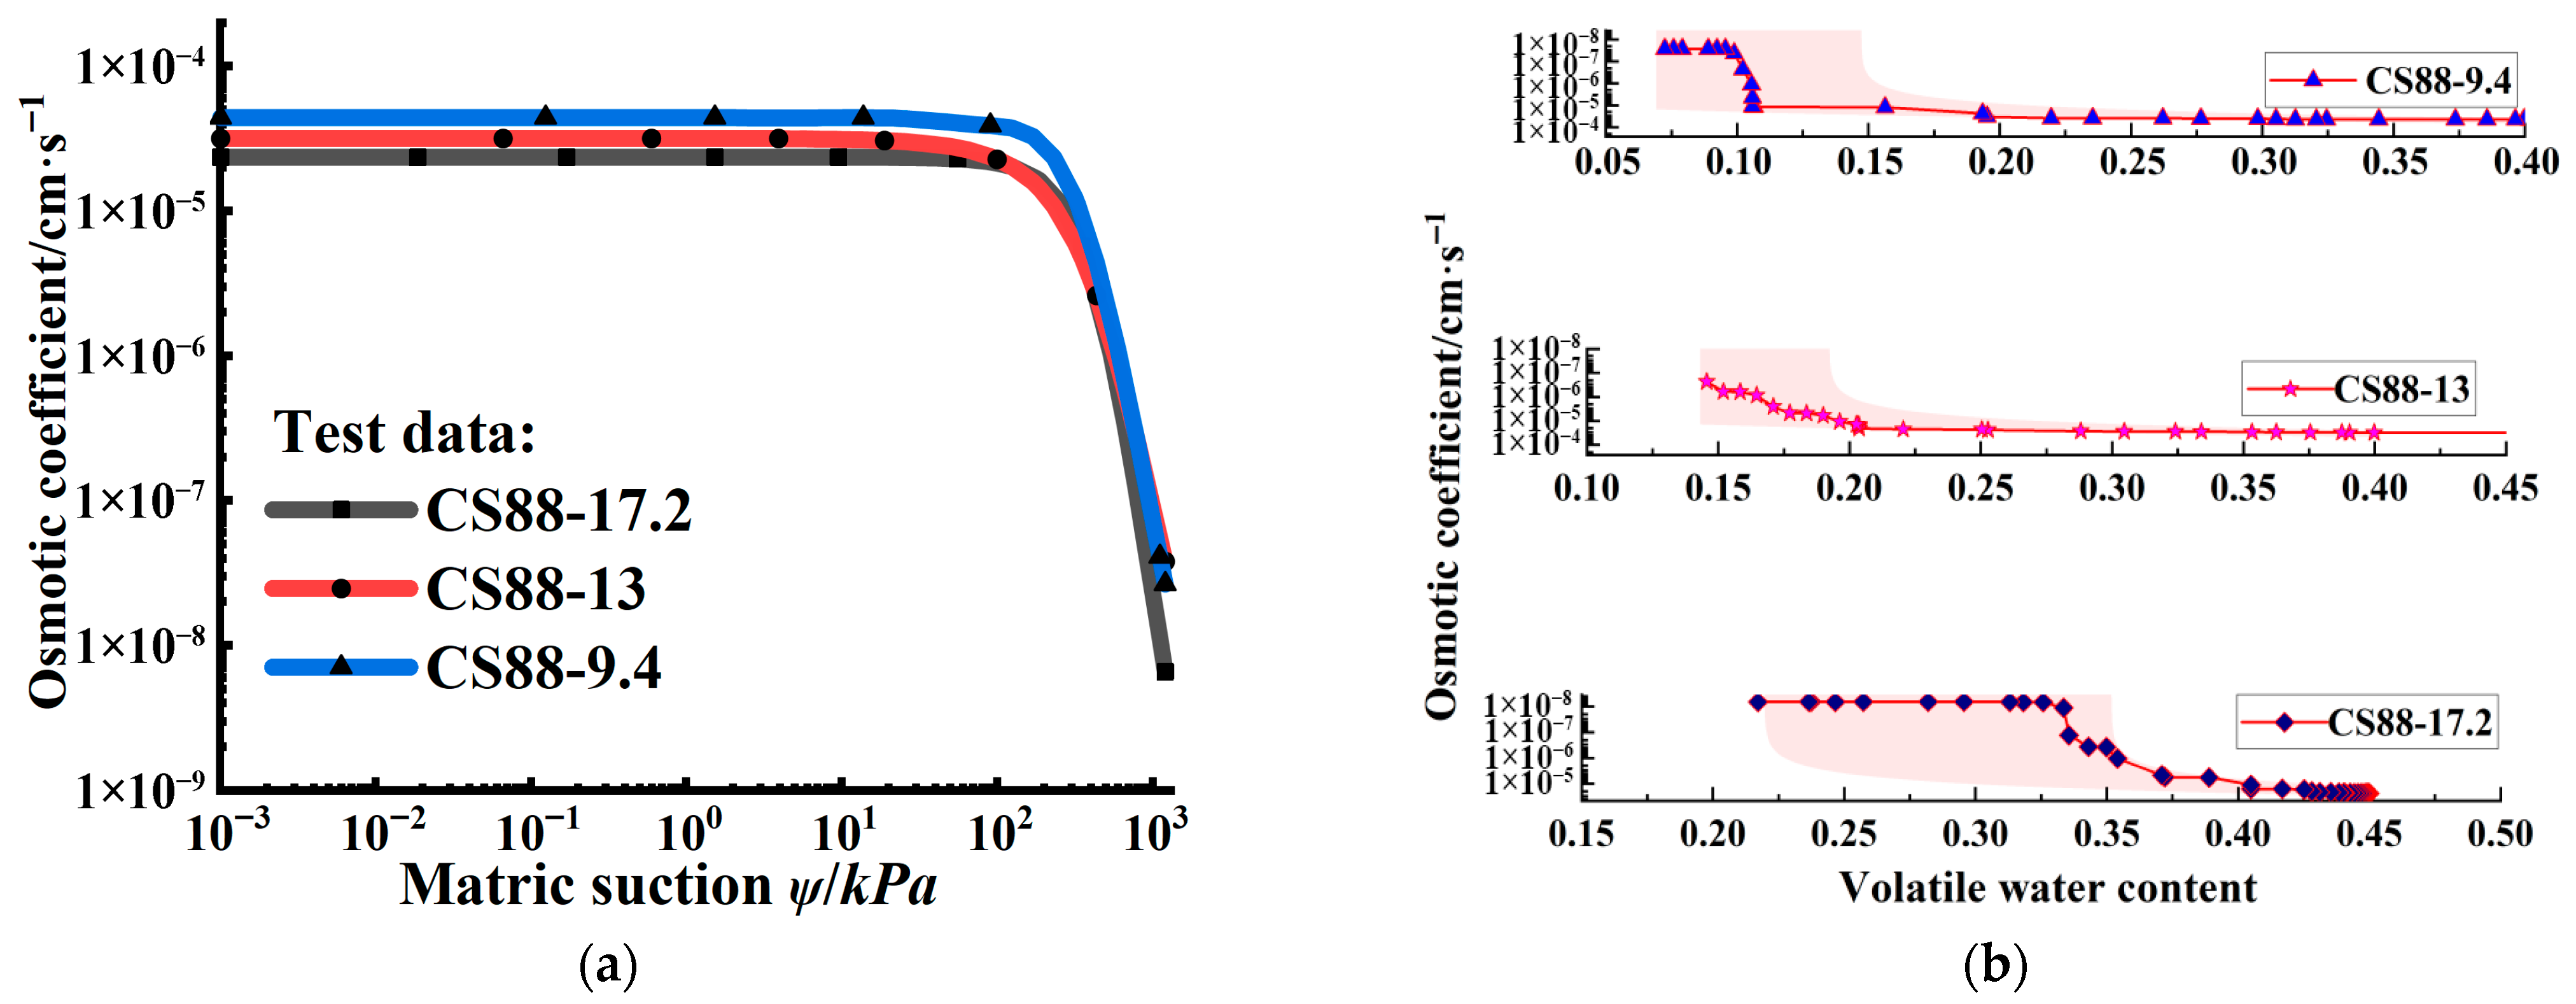
Figure 9 and Figure 10 are, respectively, the relationship curves between different initial compaction degrees, water contents and permeability coefficients. The following can be observed in the figures: (1) The hydraulic conductivity of unsaturated loess was extremely low, and it exhibited significant variability with changes in matric suction. When matric suction increased from 1 kPa to 1000 kPa, the hydraulic conductivity varied by up to four orders of magnitude (i.e., 10,000 times). (2) The trend of hydraulic conductivity with matric suction was opposite to that with volumetric water content: hydraulic conductivity decreased consistently as matric suction increased and increased consistently as volumetric water content increased. (3) Initial compaction degree and initial water content were both inversely related to hydraulic conductivity. Specifically, as initial compaction degree or water content increased, the hydraulic conductivity of unsaturated loess decreased consistently.

4.2. Response Surface Model of Permeability Coefficient

4.2.1. Experimental Design

A Box–Behnken Design (BBD) was employed to develop the experimental protocol. Initial compaction degree (A), initial water content (B), and matric suction (C) were designated as the input variables, while hydraulic conductivity (Y) was defined as the response variable for regression model development. The value ranges for these three input variables are provided in Table 4. The experimental design matrix and corresponding results are presented in Table 5.

4.2.2. Variance Analysis and Equation Fitting of the Response Surface Model

The test results were analyzed by multiple regression analysis using Design Expert 13.0 data analysis software to determine the degree of influence of different influencing factors on Loess permeability. The coefficient and significance test results of the characteristic index regression function are shown in Table 6.
It can be seen from the analysis in Table 6 that the p value of the permeability coefficient regression model is less than 0.0001, indicating that the regression model is extremely significant, indicating that the actual situation is highly consistent with the situation reflected by the regression model, and the establishment of the model is true and reliable, which can be used for the prediction and result analysis of the permeability coefficient. At the same time, the determination coefficient R2 in the table is 0.9861, and corrected determination coefficient R2adj is 0.9683, indicating that the reliability of the regression function is high. The prediction coefficient R2pre is 0.7786, and the difference between it and corrected coefficient R2adj is less than 0.20, which belongs to the reasonable data range.
Through analysis and calculations performed via software, a fitting equation describing the relationship between initial compaction degree (%), initial water content (%), matric suction (kPa), and hydraulic conductivity was derived for the range of this experimental study:
Y = 0.001095 1.7 E - 05 A 2.4 E - 05 B 3.62665 E - 07 C + 1.84225 E - 07 A B + 2.94707 E - 09 A C + 2.20907 E - 09 B C + 6.50978 E - 08 A 2 + 1.98383 E - 07 B 2 + 3.73720 E - 11 C 2
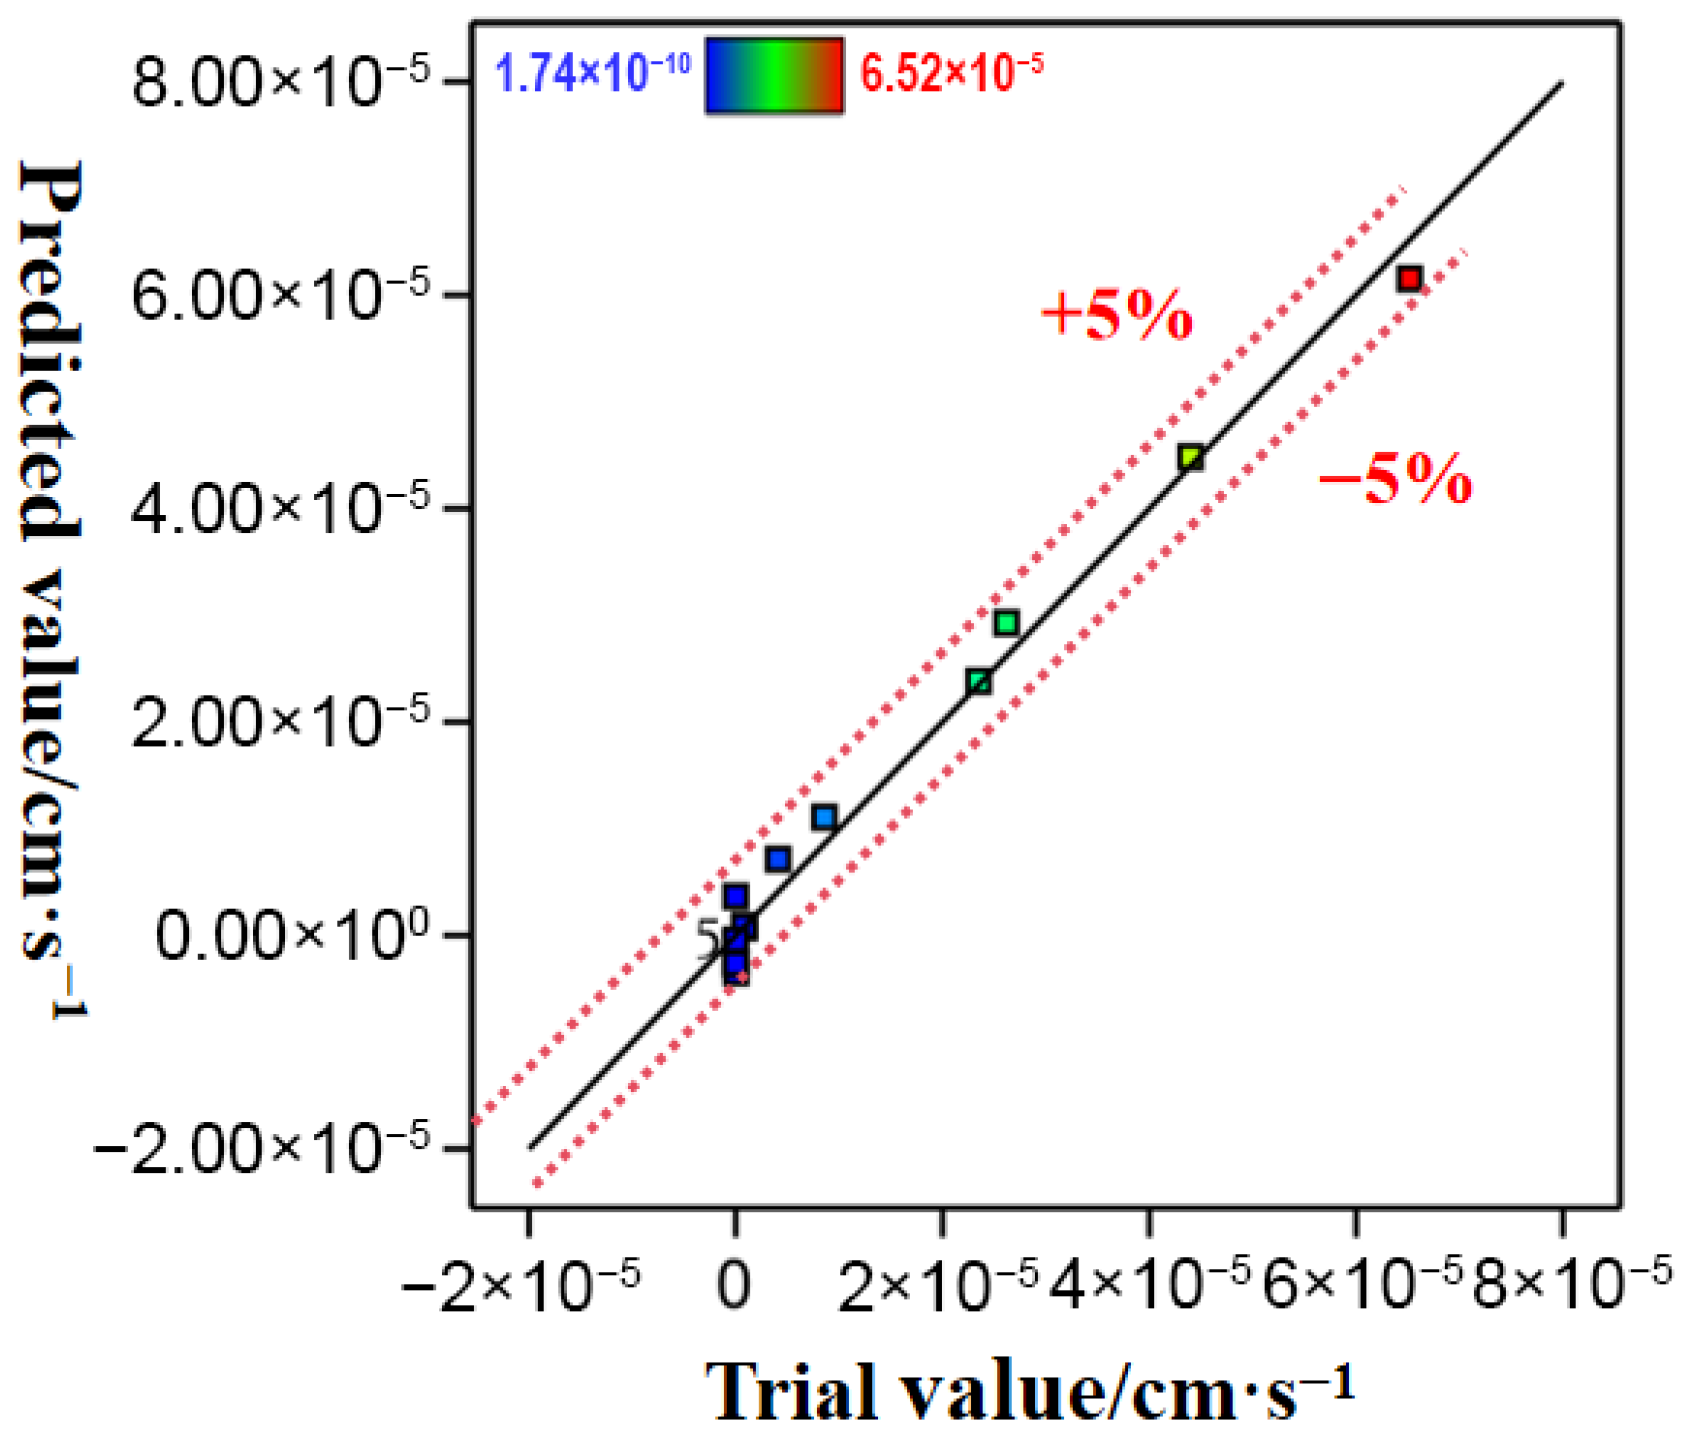
A comparison of the predicted values (derived from the aforementioned equation) and measured values for all experimental points is presented in Figure 11. As observed, the predicted and measured values for all experimental points were generally distributed along a straight line. This distribution indicates a high degree of agreement between the experimental results and model predictions, confirming that the hydraulic conductivity prediction model developed via the response surface methodology (RSM) is reliable.

4.2.3. Response Surface Analysis

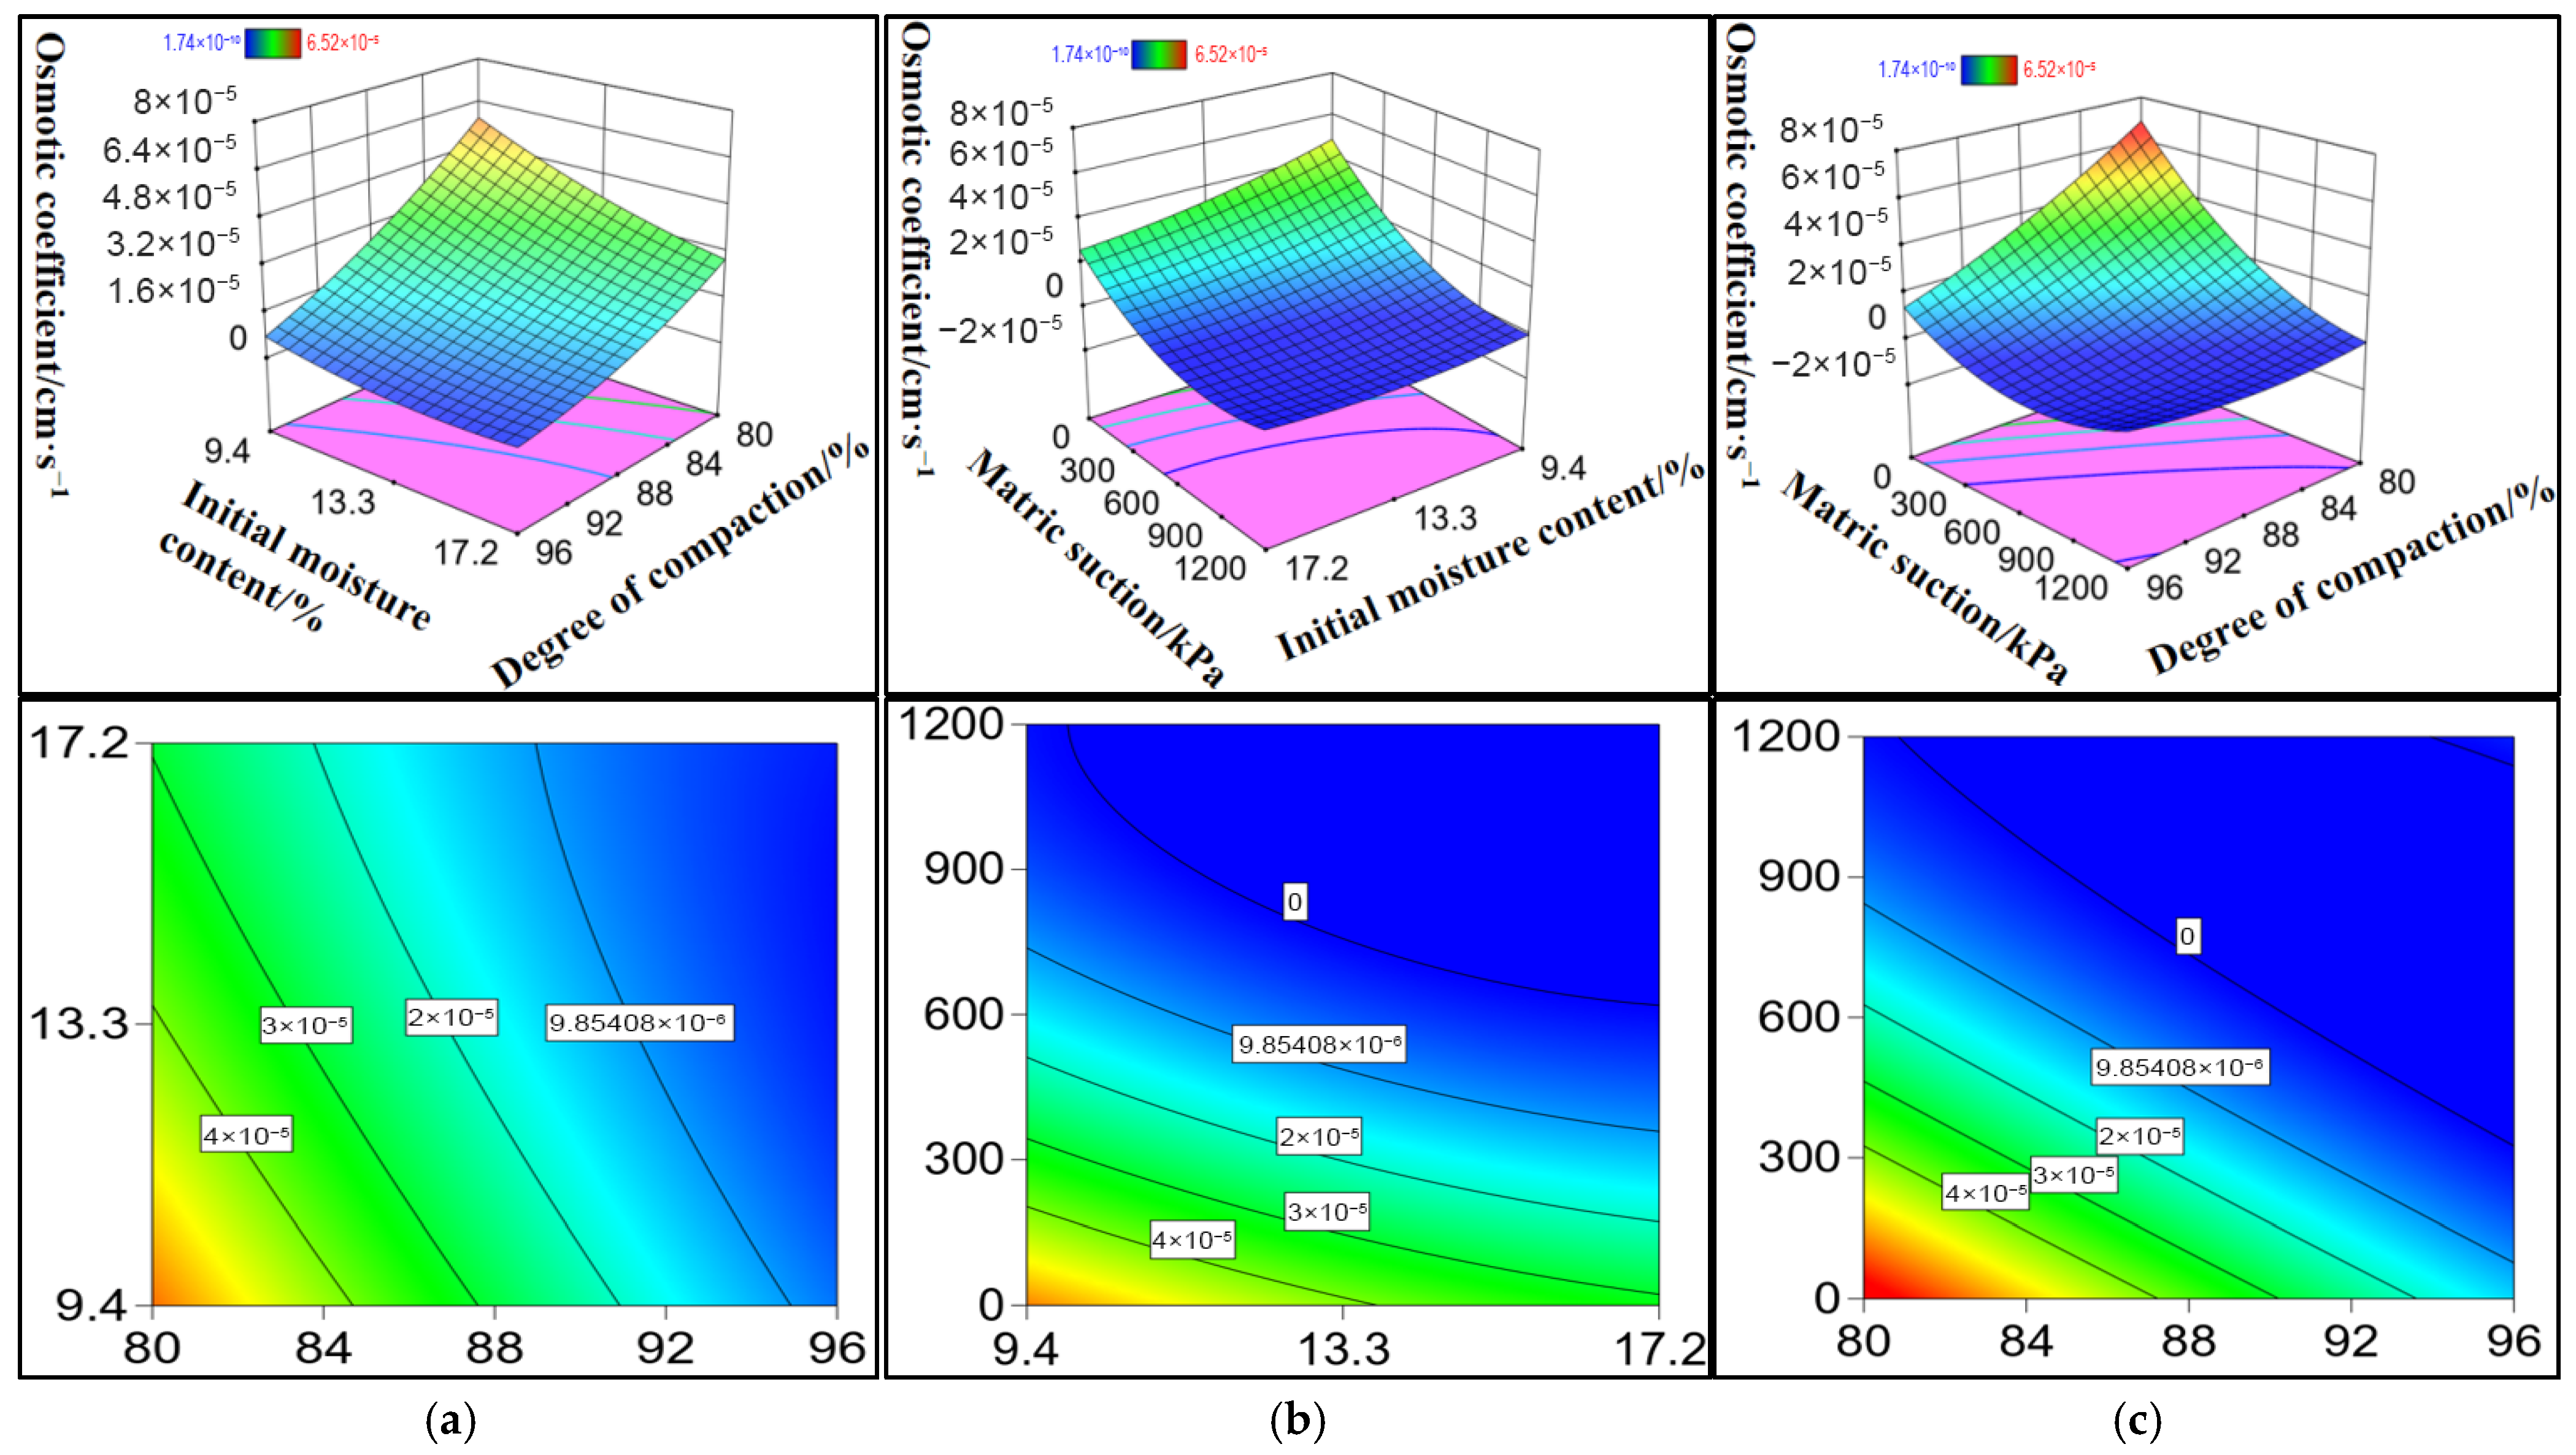
Figure 12 presents the interaction plots for all pairwise combinations of initial compaction degree (A), initial water content (B), and matric suction (C). A response surface is a three-dimensional (3D) plot of predicted values within the experimental range, which clearly and intuitively illustrates how factors influence the predicted response. A steeper slope of the response surface in a specific direction indicates a more significant influence of the corresponding factor on the predicted response [27]. Furthermore, contour plots intuitively reflect the significance of interactions between factors. Contours that are closer to a perfect circle indicate less significant interactions between the corresponding factors, whereas contours that are closer to an ellipse indicate more significant interactions. Analysis revealed that interaction terms AB and BC exerted a significant influence on the response Y (hydraulic conductivity) (p < 0.05). In contrast, factors A (initial compaction degree), B (initial water content), C (matric suction), and the AC interaction term all exerted a highly significant influence on Y (p < 0.01). The order of influence magnitude of the factors on the response Y was determined to be C > A > B.
It can be seen from Figure 12a that when the initial water content is at a low level, the permeability coefficient decreases rapidly with the increase in compaction degree; At a higher level, the permeability coefficient still shows a downward trend with the increase in compaction degree, but the decline rate is significantly slowed down, and the difference between the two trends is significant. When the compaction degree is at a low level, the permeability coefficient gradually decreases with the increase in initial water content; When the compaction degree is at a high level, the permeability coefficient shows a relatively gentle change with the increase in initial water content. Based on the above change rules, the response surface graph is steep as a whole, indicating that the interaction degree of the two factors is high and has a great impact on the results, which is consistent with the results of variance analysis.
As shown in Figure 12b, the response surface diagram is very steep. With the increase in initial water content, the permeability coefficient shows a downward trend as a whole, while with the increase in matrix suction, the permeability coefficient decreases faster. In contrast, matrix suction has a greater impact on the results, which is consistent with the significance order of the two factors. It can be seen from Figure 12c that the permeability coefficient shows a downward trend with the increase in compactness, and the rate of decline continues to decrease with the increase in matrix suction.

5. Discussion

Taking Yangling loess as the research object, this paper systematically explores the influence of initial compaction degree and water content on its water-holding and permeability characteristics. The results not only reveal the variation law of loess hydraulic characteristics under specific conditions, but also provide a valuable reference for the study of unsaturated loess engineering characteristics.
It should be noted that loess is widely distributed in China, and there are significant differences in geological origin, mineral composition, and particle size distribution of loess in different regions, resulting in regional differentiation in the applicability of the soil water characteristic curve and permeability coefficient model. The Van Genuchten model and response surface permeability coefficient prediction model established in this study for the Yangling loess need to be further discussed and tested in combination with the characteristics of loess in different regions. From the perspective of the influence of different characteristics on the applicability of the model, the core of water-holding and permeability characteristics of loess is controlled by pore structure, mineral composition, and plasticity index. Yangling loess has a high plasticity index (14.3), fine pore distribution, and significant differences in clay mineral content and cement type compared with loess in Eastern Gansu and Northwestern Shanxi, resulting in its water-holding capacity being more sensitive to initial compaction and water content.
Combined with existing studies, the adaptability of loess in different regions to the SWCC model can be summarized as shown in Table 7:
For the test of the universality of the model, it can be verified by cross-regional model. Based on the parameter equation of the Van Genuchten model of Yangling loess, the soil water characteristic curve of loess in other regions can be predicted, and the deviation can be tested by comparing the measured values. For the permeability coefficient response surface model, the “regional characteristic factors” (such as plasticity index Ip and clay mineral content) can be introduced; It can also analyze the correlation between the parameters a and n of the Van Genuchten model and soil index in loess of different regions. It is inferred that for high plasticity loess with Ip > 12, the linear correlation between parameters a and n and compactness is stronger. For low plasticity loess with Ip < 10, the particle uniformity coefficient should be introduced as a correction term. In terms of regional adaptability correction, for the Van Genuchten model, the sand content correction factor can be introduced into the parameter n for sandy loess; For the response surface permeability coefficient model, the weight coefficient of matrix suction can be increased for loess in the northwest arid area.
In general, this study deepens the understanding of the mechanism of initial conditions affecting the hydraulic characteristics of loess through the combination of test and models. The established prediction model can provide important theoretical basis and technical support for the disaster prevention and control of collapsible loess projects in Yangling and similar areas, such as landslide and subgrade collapse prevention and control.

6. Conclusions

With the increase in initial compactness and water content, the higher the air entry value of soil, the stronger the water-holding capacity, and the corresponding residual water content is also higher. Among the selected models, the VG model has the best fitting effect on the soil water characteristic curve of Yangling loess. Its parameter a (related to air entry value) decreases significantly with the increase in compaction degree, and parameter n (pore distribution index) increases linearly. Based on this, the SWCC model considering compaction degree can accurately predict the water-holding characteristics of the high-suction section (0~1200 kPa).
When loess transits from a saturated state to an unsaturated state, the permeability coefficient decreases 104 times. The increase in initial compaction degree and water content will lead to a significant decrease in permeability coefficient, which is closely related to the densification of pore structure and the complexity of water migration path.
The permeability coefficient prediction model based on the response surface method has a determination coefficient R2 of 0.9861, which can quickly and accurately predict the permeability coefficient of Yangling loess. The order of influence weight of each factor on the permeability coefficient is matrix suction > initial compaction > initial water content. The dominant influencing factors of permeability characteristics under the coupling effect of multiple factors were identified.
Author Contributions

Y.M.: Led the conceptualization and design of the study, supervised the research implementation, and revised the core content of the manuscript; J.S.: Developed experimental methods, verified the feasibility of the methods, and confirmed the reproducibility of the results; J.W.: Conducted main experiments, organized raw data, and wrote the “Materials and Methods” section; X.P.: Performed statistical analysis of data, created result figures and tables, and wrote the “Results” section; M.L.: Provided experimental materials, assisted in experimental operations, and participated in repeated experiments for result verification; Y.T.: Developed custom code for data processing, assisted in computational simulations, and polished the language of the manuscript; K.Z.: Provided access to specialized equipment, assisted in data collection for supplementary experiments, and organized supplementary datasets; Z.Y.: Wrote the “Introduction” section, conducted literature review, and revised the “Discussion” section; P.W.: Assisted in project application, managed research progress and funds, and reviewed the structure of the manuscript; Y.L. (Corresponding Author): Handled communication with the journal, ensured compliance with academic ethics, and took overall responsibility for the manuscript. All authors have read and agreed to the published version of the manuscript.

Funding

This research was funded by Shaanxi Provincial Natural Science Basic Research Program of China Technical Development (2021JLM-51) Project of Shandong Electric Power Engineering Consulting Institute Co., Ltd. (37-2025-21-K0002). And The APC was funded by Shaanxi Provincial Natural Science Basic Research Program of China Technical Development (2021JLM-51) Project of Shandong Electric Power Engineering Consulting Institute Co., Ltd. (37-2025-21-K0002).

Data Availability Statement

Some or all data, models, or code that support the findings of this study are available from the corresponding author upon reasonable request.

Conflicts of Interest

The authors declare that they have no conflicts of interest. The invoice is provided for Northwest A&F University. Note: The superscripts 1 and 2 indicate different research affiliations, which should be supplemented in the footnote of the first page of the paper; the content complies with the standards of CRediT (Contributor Roles Taxonomy).

References

  1. Huang, Y.; Wang, C.; Jiang, X.; Wang, H.; Qi, C.; Zhang, J.; Hu, H.; Yu, Q. Experimental study on water immersion of collapsible loess sites in Xianyang loess plateau. Build. Struct. 2025, 55, 143–148+101. [Google Scholar]
  2. Wang, F.; Xiao, B.; Li, S.; Sun, F. Effect of biological crust on surface aggregation, adsorption, and retention of soil nutrients on the Loess Plateau. Plant Nutr. Fertil. Sci. 2021, 27, 1592–1602. [Google Scholar]
  3. Fan, W.; Deng, L.; Yu, B.; Wei, Y.; Liang, X.; Wei, X.; Yu, N.; Fan, W. Disaster mechanism and landslide risk prevention and control of loess under extreme rainfall conditions. J. Earth Sci. Environ. 2025, 47, 285–312+282. [Google Scholar]
  4. Yang, X.; Wang, S.; Li, X.; Li, A.; Xia, H. Comparative study on soil-water characteristic curve models of purple soil in the Three Gorges Reservoir area. J. Southwest Univ. (Nat. Sci. Ed.) 2023, 45, 201–210. [Google Scholar]
  5. Zhang, Z.; Zhao, Q. Optimal soil-water characteristic curve model for silty soil. J. Luoyang Inst. Sci. Technol. (Nat. Sci. Ed.) 2023, 33, 8–13. [Google Scholar]
  6. Chu, F.; Shao, S.; Chen, C. Experimental study on the influence of dry density and vertical stress on the soil-water characteristics of intact unsaturated loess. Chin. J. Rock Mech. Eng. 2014, 33, 413–420. [Google Scholar]
  7. Jiang, T.; Wang, X.; Zhang, J. Experimental Study on Water Retention Characteristics of Bentonite and Its SEM Microscopic Qualitative Analysis. J. North China Univ. Water Conserv. Electr. Power (Nat. Sci. Ed.) 2020, 41, 90–96. [Google Scholar]
  8. Wang, J. Experimental Study on Unsaturated Soil-Water Characteristic Curve and Strength Properties of Loess in Eastern Gansu Region. Ph.D. Thesis, Lanzhou University of Technology, Lanzhou, China, 2017. [Google Scholar]
  9. Zhang, L. Laboratory Study on Shear Strength and Soil-Water Characteristic Curve of Unsaturated Loess in Shanxi. Ph.D. Thesis, Taiyuan University of Technology, Taiyuan, China, 2023. [Google Scholar] [CrossRef]
  10. Ye, T. Experimental Study on Soil-Water Characteristic Curve of Low Liquid Limit Silty Clay in Yili Area, Xinjiang. Railw. Investig. Surv. 2022, 48, 56–60. [Google Scholar] [CrossRef]
  11. Cai, G.; Han, B.; Yang, Y.; Liu, W. Experimental Study on the Soil-Water Characteristics Curve of Sandy Loess. Chin. J. Geotech. Eng. 2020, 42 (Suppl. S1), 11–15. [Google Scholar]
  12. Zhang, Y.; Liang, W.; Guo, S.; Wang, Y. Analysis of the Impact of Loess Pore Structure Evolution on Its Soil-Water Characteristics. J. Eng. Geol. 2022, 30, 1998–2005. [Google Scholar] [CrossRef]
  13. Wei, X.; Chen, P. Discussion on the Characteristics and Rapid Measurement Method of Compacted Yellow Soil in Yan’an. Geotech. Found. 2022, 36, 446–450. [Google Scholar]
  14. Hu, M.; Zhang, X.; Xu, W.; Wang, Z.; Cheng, H. Effects of Dry Density and Moisture Addition/Removal on Hydraulic Characteristics of Compacted Loess. J. Yangtze River Sci. Res. Inst. 2024, 41, 128–134. [Google Scholar]
  15. Ehsan, B.; Jean, V.; Riccardo, S. A hysteretic water retention model incorporating the soil deformability and its application to rainfall-induced landslides. Comput. Geotech. 2025, 178, 106912. [Google Scholar]
  16. Mathieu, N.; Lyesse, L. Advances in modelling hysteretic water retention curve in deformable soils. Comput. Geotech. 2008, 35, 835–844. [Google Scholar] [CrossRef]
  17. Fan, J. Research on Soil-Water Characteristics Curve and Permeability Curve of Unsaturated Reclaimed Loess Under Different Dry Density Conditions. Ph.D. Thesis, Chang’an University, Xi’an, China, 2020. [Google Scholar] [CrossRef]
  18. Gao, J. Experimental Study on Water Holding and Permeability Characteristics of Unsaturated Silt-like Saline Soil. Ph.D. Thesis, Lanzhou University of Technology, Lanzhou, China, 2023. [Google Scholar]
  19. Wang, X.; Shi, H.; Tang, Z.; Niu, C. Research on the permeability coefficient function of unsaturated soil based on statistical models. J. Yangtze River Sci. Res. Inst. 2015, 32, 102–105. [Google Scholar]
  20. Arezoo, R.; Harianto, R.; Eng-Choon, L. Effect of range of soil–water characteristic curvemeasurements on estimation of permeability function. Eng. Geol. 2015, 185, 96–104. [Google Scholar]
  21. Wang, L.; Wang, S.; Yang, B. Study on the Influence of Soil-Water Characteristic Curve on Landslide Stability Calculation Results under Fluctuating Reservoir Levels. J. China Three Gorges Univ. (Nat. Sci. Ed.) 2012, 34, 10–14. [Google Scholar]
  22. Chen, Z.; Miao, Q.; Guo, N.; Cheng, X. Several Issues Concerning the Study of Water Retention Characteristic Curve. Chin. J. Geotech. Eng. 2023, 45, 671–679. [Google Scholar]
  23. GB/T 50123-2019; Standard for Geotechnical Test Methods. Henan Provincial Water Resources Department: Zhengzhou, China.
  24. Ghezzehei, T.A.; Kneafsey, T.J.; Su, G.W. Correspondence of the Gardner and van Genuchten–Mualem relative permeability function parameters. Water Resour. Res. 2007, 43, W10417. [Google Scholar] [CrossRef]
  25. Fredlund, D.G.; Xing, A.; Huang, S. Predicting the permeability function for unsaturated soils using the soil-water characteristic curve. Can. Geotech. J. 1994, 31, 533–546. [Google Scholar] [CrossRef]
  26. Van Genuchten, M.T. A Closed-form Equation for Predicting the Hydraulic Conductivity of Unsaturated Soils. Soil Sci. Soc. Am. J. 1980, 44, 892–898. [Google Scholar] [CrossRef]
  27. Song, N.; Liu, Z.; Li, F.; Cheng, Z. Study on the Influencing Factors of Sodium Hypochlorite Disinfection Efficiency Based on Response Surface Methodology. Water Supply Drain. 2024, 60, 263–269+276. [Google Scholar] [CrossRef]
  28. Schuh, C.; Frampton, A.; Christiansen, H.H. Soil moisture redistribution and its effect on inter-annual active layer temperature and thickness variations in a dry loess terrace in Adventdalen, Svalbard. Cryosphere 2017, 11, 635–651. [Google Scholar] [CrossRef]
  29. Stolte, J.; Ritsema, C.J.; Veerman, G.J.; Hamminga, W. Establishing Temporally and Spatially Variable Soil Hydraulic Data for Use in a Runoff Simulation in a Loess Region of The Netherlands. Hydrol. Process. 1996, 10, 1027–1034. [Google Scholar] [CrossRef]
Figure 1. Particle grading curve.
Applsci 15 11039 g001
Figure 2. Mineral composition analysis.
Applsci 15 11039 g002
Figure 3. Pressure plate test flow chart.
Applsci 15 11039 g003
Figure 4. Permeation test flowchart.
Applsci 15 11039 g004
Figure 5. Fitting of soil water characteristic dehumidification curves by three models. (a) Gardner model fitting curve; (b) FX model fitting curve; (c) VG model fitting curve.
Applsci 15 11039 g005
Figure 6. VG Parameter Model. (a) Parameter variation law; (b) Parametric model prediction.
Applsci 15 11039 g006
Figure 7. Fitting of soil water characteristic drying curves by three models. (a) Gardner model fitting curve. (b) FX model fitting curve. (c) VG model fitting curve.
Applsci 15 11039 g007
Figure 8. The relationship between parameters and the initial moisture content.
Applsci 15 11039 g008
Figure 9. Relationship curve between initial compaction degree and permeability coefficient. (a) Relationship between Matric Suction and Permeability Coefficient. (b) Relationship between volumetric water content and permeability coefficient.
Applsci 15 11039 g009
Figure 10. Relationship curve between initial water content and permeability coefficient. (a) Relationship between matrix suction and permeability coefficient (b) Relationship between volumetric water content and permeability coefficient.
Applsci 15 11039 g010
Figure 11. Comparison of Predicted Values and Experimental Values.
Applsci 15 11039 g011
Figure 12. Response surface of the permeability coefficient. (a) The response surface of AB. (b) The response surface of BC. (c) The response surface of AC.
Applsci 15 11039 g012
Table 1. Testing Program.
Sample NumberCompactness/%Initial Water Content/%
CS88-9.4889.4
CS88-1313.0
CS88-17.217.2
CS80-17.28017.2
CS84-17.284
CS92-17.292
CS96-17.296
Table 2. Parameter Table of Three Models.
ParameterGardner ModelFX ModelVG Model
Number
CS80-17.2a = 0.050 n = 1.200 AdjR2 = 0.95a = 7.2770 n = 1.200 m = 0.800 AdjR2 = 0.94a = 0.183 n = 1.4853 AdjR2 = 0.99
CS84-17.2a = 0.034 n = 1.207 AdjR2 = 0.94a = 15.0479 n = 1.205 m = 0.8569 AdjR2 = 0.95a = 0.110 n = 1.5515 AdjR2 = 0.98
CS88-17.2a = 0.025 n = 1.249 AdjR2 = 0.93a = 23.7696 n = 1.245 m = 0.9239 AdjR2 = 0.95a = 0.051 n = 1.721 AdjR2 = 0.97
CS96-17.2a = 0.018 n = 1.409 AdjR2 = 0.93a = 43.8724 n = 1.2608 m = 1.200 AdjR2 = 0.95a = 0.037 n = 1.8607 AdjR2 = 0.98
Table 3. Parameters of the Three Models’ Fit.
ParameterGardner ModelFX ModelVG Model
Number
CS80-17.2a = 0.050 n = 1.200 AdjR2 = 0.95a = 7.2770 n = 1.200 m = 0.800 AdjR2 = 0.94a = 0.183 n = 1.4853 AdjR2 = 0.99
CS84-17.2a = 0.034 n = 1.207 AdjR2 = 0.94a = 15.0479 n = 1.205 m = 0.8569 AdjR2 = 0.95a = 0.110 n = 1.5515 AdjR2 = 0.98
CS88-17.2a = 0.025 n = 1.249 AdjR2 = 0.93a = 23.7696 n = 1.245 m = 0.9239 AdjR2 = 0.95a = 0.051 n = 1.721 AdjR2 = 0.97
CS96-17.2a = 0.018 n = 1.409 AdjR2 = 0.93a = 43.8724 n = 1.2608 m = 1.200 AdjR2 = 0.95a = 0.037 n = 1.8607 AdjR2 = 0.98
Table 4. Parameter Levels and Ranges.
Influence FactorLevel
(−1)(0)(+1)
Initial compaction (A)808896
Initial water content (B)9.41317.2
Matric suction (C)06001200
Table 5. Response surface test design and results.
Serial NumberInfluence FactorPermeability Coefficient/cm·s−1
Initial Compaction Degree K/%Initial Water Content W0/%Matric Suction Ψ/kPa
18017.26004.11 × 10−6
288136008.34 × 10−7
388136008.34 × 10−7
4961312001.74 × 10−10
588136008.34 × 10−7
6889.404.40 × 10−5
7801312002.65 × 10−8
888136008.34 × 10−7
9801306.52 × 10−5
10969.46004.72 × 10−8
11961308.59 × 10−6
1288136008.34 × 10−7
13809.46002.62 × 10−5
148817.212003.34 × 10−9
159617.26002.10 × 10−9
16889.412006.56 × 10−9
178817.202.35 × 10−5
Table 6. Variance Analysis of Regression Model.
FactorPermeability Coefficient/cm·s−1
Coefficientp-ValueF-Value
Model<0.0001 **55.35
Constant term+0.001095
A−0.000017<0.0001 **80.04
B−0.0000240.0028 **20.14
C−3.62665 × 10⁻⁷<0.0001 **215.42
AB+1.84225 × 10−70.0110 *11.75
AC+2.94707 × 10⁻⁹<0.0001 **70.93
BC+2.20907 × 10−90.0178 *9.50
A2+6.50978 × 10−80.0384 *6.48
B2+1.98383 × 10−70.11003.35
C2+3.73720 × 10⁻¹¹<0.0001 **67.54
R20.9861
Adj R20.9683
R2pre0.7786
‘**’ Indicates that the item is extremely significant ( p < 0.01 ), ‘*’ Indicates that the item is significant ( p < 0.05 ).
Table 7. Adaptability of Loess from Different Regions to the SWCC Model.
Major RegionsLoess TypeBest Fit Model (SWCC)Key Differentiators
Longdong, Gansu [8]Typical Malan LoessVGThe model parameter n is less affected by dry density, and the parameter n of Yangling loess increases linearly with compaction degree
Northwest Shanxi [9]Undisturbed loessFXFX model is better fitted, and Yangling VG model is better (related to pore uniformity)
ILI, Xinjiang [10]Low liquid limit silty loessVG (overall), Gardner (low suction section)Gardner in low suction section is better, and VG in Yangling section is the best
Jingyang, Shaanxi [12]Loess from the south of Jinghe RiverFXFX parameter a increases with dry density, while Yangling VG parameter a decreases with compactness
Yangcheng tunnel of Haoji Railway [11]Sandy loessVG (high-suction section), FXThe permeability coefficient of sandy loess is low sensitive to suction, and the VG-M model needs to be modified
Adventdalen Svalbard [28]Silt loamVGThe variation in parameter α is more concerned with the influence of pore sorting on the freezing suction and ice stratification
The southern part of the Netherlands [29]Fine siltstoneVGThe model parameter α varies based on the differences in the surface structure (such as crops and farming practices)
Disclaimer/Publisher’s Note: The statements, opinions and data contained in all publications are solely those of the individual author(s) and contributor(s) and not of MDPI and/or the editor(s). MDPI and/or the editor(s) disclaim responsibility for any injury to people or property resulting from any ideas, methods, instructions or products referred to in the content.