Abstract
This study investigates the evolution of lightning activity in Italy by comparing two biennia: 2010–2011 and 2020–2021. Lightning data were obtained from a lightning location system (the SIRF network) and processed to focus exclusively on cloud-to-ground (CG) strokes. The analysis covers both land and surrounding sea areas, with data filtered and validated according to the study objectives. A detailed statistical comparison of CG activity between the two periods is presented, along with an assessment of spatial distributions across the Italian territory. Furthermore, correlations between CG stroke occurrence and both sea surface temperature and land surface temperature are examined. The findings highlight temporal and spatial variations in lightning patterns over the decade and provide insights into their possible relationship with environmental conditions.
1. Introduction
Lightning constitutes a major hazard to human life, the natural environment, and various infrastructures, including power and telecommunication systems []. Its complexity attracted extensive investigation by physicists, meteorologists, and electrical engineers, with three main purposes: (i) exploiting it as a dependable indicator for forecasting severe weather events, (ii) advancing the understanding of its physical development, and (iii) improving the design of protection strategies for energy, communication, and civil installations.
With respect to forecasting applications, a robust characterization of lightning occurrence (both in terms of quantitative metrics and spatial distribution) is essential to define threshold values that, once exceeded, may indicate anomalous and potentially hazardous weather conditions. Such thresholds can be integrated into meteorological alert systems. Numerous studies across different regions [,,,,,,,,,,,,] have demonstrated a strong link between lightning activity and the evolution of heavy rainfall processes within thunderstorms. As highlighted in these works, lightning measurements enable the near-real-time identification of the most intense convective cells and the tracking of their spatial development [,,,]. This has promoted the growing interest in lightning-based forecasting and nowcasting methodologies [,,,,,,].
Experimental data represent a fundamental resource for advancing investigations and developing models in lightning research and protection design. Within this field, particular attention is typically given to the return-stroke phase of the lightning flash, due to its dominant energy content and impact. Nonetheless, other stages of the lightning flash (such as the preliminary breakdown) are also the subject of dedicated studies, especially in view of specific applications (see the review in []). Research on the lightning return stroke has attracted significant interest in electrical engineering, with contributions mainly addressing (i) the detailed modeling of its current waveform [,,,,], (ii) the computation of lightning electromagnetic fields under varying assumptions regarding soil conductivity and channel geometry [,,,,,,,,], (iii) the evaluation of overvoltages induced on overhead transmission and distribution systems [,,,,,,,,], (iv) the analysis of interactions with elevated structures such as pylons, towers, and wind turbines [,,,], and (v) the development of machine learning-based lightning location methods that exploit overvoltage waveforms induced on overhead power lines [,,,,].
Lightning local data are mainly provided by lightning location systems (LLSs). As reported in [], LLSs provide continuous coverage over large geographical domains, potentially up to continental scale, making them valuable for quantifying the exposure of technical infrastructures to lightning hazards. These systems, which consist of distributed networks of electromagnetic sensors, produce parameters such as Ground Flash Density (GFD), Ground Stroke Density (GSD), peak current distributions, flash multiplicity, and polarity. Many investigations have explored how these properties vary with geographical and climatological factors (seasonality, sea–land contrast, latitude, and altitude). Early results from the U.S. East Coast network [,] indicated that positive flashes represented less than 5% of summer lightning but peaked at about 80% in February, with winter storms being predominantly oceanic and positive. Subsequent work [] confirmed minimum positive flash occurrence in July–August and a maximum in January–February. In Europe, the authors of [] examined Greek lightning records from 2008 to 2009, identifying summer and autumn as peak seasons. Latitude effects remain debated, with some works (e.g., [,]) reporting significant correlations, while others (e.g., []) found no such relationship. Altitude-related patterns were observed in [], who detected increasing lightning activity between 500 m and 2000 m, followed by a marked decline above 2000 m.
Recent observations from the JASA Lightning Detection Network of five isolated small thunderstorms in East China showed that single-stroke flashes accounted for over 30% of all negative CG flashes and were generally associated with weaker initial stroke peak currents compared to multiple-stroke flashes []. Moreover, building on waveform analysis, the authors of [] proposed a convolutional neural network to classify lightning Low Frequency (LF)/Very Low Frequency (VLF) signals into five types, including CG, Intra-Cloud (IC), preliminary breakdown pulses, and narrow bipolar events, achieving an average accuracy above 95%, highlighting the potential of deep learning for automated lightning type identification.
In recent decades, lightning studies have been performed for Europe [,,] and for parts of the Mediterranean [,,,]. The authors of [], using Zeus LLS data, investigated correlations between lightning occurrence and factors such as elevation, slope, vegetation, and sea surface temperature (SST), identifying a positive link between SST and lightning frequency over a 10-year record. In [], spatial and seasonal patterns of CG and IC flashes in Greece were analyzed, while the authors of [] evaluated monthly and seasonal GFD variability across European latitudes. In [], a continental-scale investigation was conducted of annual, monthly, and diurnal GFD cycles, CG polarity ratios, and cumulative distributions of peak current and multiplicity by exploiting data of national LLSs integrated within the European network EUCLID. National-scale reports include [] for Austria and [] for Belgium, both detailing GFD, polarity, and lightning current properties, with spatial correlations to elevation in the Belgian case. The authors of [] analyzed 19 years of LLS records, identifying significant spatial clustering and detecting local trends potentially linked to Mediterranean warming. In [], a 10-year analysis of lightning activity over Bulgaria and the Black Sea was conducted, revealing seasonal and diurnal variations with summer peaks over land and sea, autumn dominance over the Black Sea, and a strong nighttime influence of sea surface temperature on thunderstorm formation.
For Italy, early assessments were carried out in [] shortly after the deployment of the SIRF (Italian System for Lightning Detection) network, part of EUCLID, revealing spatial variations in peak current for positive and negative flashes, seasonal distributions, and seasonal influences on peak current magnitudes. The analysis of [] reported the performance of the Italian Air Force’s LAMPINET network to derive peak current probability density functions for both polarities and their seasonal modulation, without differentiating between first and subsequent strokes, a distinction which is significant for lightning performance studies (e.g., [,,,,,,,,]). Other analyses quantified seasonal CG stroke densities without accounting for sea–land separation or latitudinal and altitudinal variability. An extensive analysis of lightning activity over Italy from 2010 to 2019 was conducted in [], using data from the SIRF network. Such a study examined GSD and the positive-to-negative stroke ratio (assessing the influence of seasonal, geographical, and orographic factors), peak current characteristics, flash multiplicity, and the spatial separation between stroke impact points within individual flashes.
The reliability of such studies is strongly related to the accuracy of LLS data, which are generally validated through comparison with direct measurements from instrumented towers or artificially triggered lightning. Comprehensive validation of EUCLID is provided in [].
This study contains an analysis of lightning activity in Italy, more precisely about how the lightning activity has been changed between the 2010–2011 biennium and the 2020–2021 biennium. Lightning data have been acquired from the SIRF network. The area of interest is Italy and the surrounding (sea and ground boundary).
Global temperatures rising is altering atmospheric conditions such as humidity, stability, and convection dynamics []. Since lightning formation is closely tied to these factors, particularly through convection and the interaction of ice and graupel particles [], temperature increases are expected to influence its occurrence []. Several studies have projected that lightning activity will increase with global warming, with estimates ranging from a 5% to 16% increase per degree of temperature rise [,,,]. Observations also suggest a positive correlation between surface temperature and lightning frequency on shorter timescales [,]. However, longer-term trends remain uncertain, and alternative modeling approaches indicate that lightning responses may vary significantly depending on how it is parameterized [,].
Because temperature affects both cloud development and storm intensity, understanding how land and sea surface warming influence lightning activity is essential for improving climate projections. More precise modeling of these relationships will help refine estimates of future atmospheric composition and the role of lightning in climate feedback mechanisms [,,].
Since lightning activity has been increasingly investigated as a potential marker of climate and global change, in this contribution, a correlation analysis between lightning occurrence and land and sea surface temperatures is proposed.
The organization of the article is as follows. Section 2 explains the SIRF data processing and the relationship between lightning activity and the geographical area where the analysis has been carried out. Section 3 reports the results obtained through this analysis, and a comparative study of lightning statistics between data recorded by SIRF in 2010–2011 and in 2020–2021 is proposed. In Section 4, a correlation analysis between CG stroke occurrence and sea surface temperature and land surface temperature is performed. Finally, some concluding remarks are proposed in Section 5.
2. Lightning Data
Data are extracted from the SIRF database covering the 2010–2011 period and the 2020–2021 period. The SIRF network is an Italian LLS, owned and operated by Centro Elettrotecnico Sperimentale Italiano (CESI S.p.A., Milan, Italy) since 1994. In the 2010–2011 configuration, it was made of 16 LF/VLF electric field sensors, VAISALA IMPACT 141-T, distributed across Italy (including the two main islands), plus 11 sensors across the Alps owned by the French, Swiss, Austrian, and Slovenian networks, using both time-of-arrival and magnetic-direction-finding methods to detect and locate lightning strikes; sensors’ distribution and distances were optimized to give a uniform and high performance detection. Between 2014 and 2015, SIRF was upgraded by replacing the IMPACT units with VAISALA LS7002 sensors, using LF/VLF detection as well. During the same period, a new location algorithm was introduced, designed to optimize the selection of signals linked to each return stroke. This upgrade resulted in improved performance, specifically in terms of detection efficiency, location accuracy, and classification accuracy. With respect to the previous configuration, the upgraded system shows some improvements in performance. The earlier setup provided detection efficiencies of about 90% for CG flashes and 80% for CG strokes above 2 kA, with a median location accuracy close to 500 m and an overall classification capability of 95% in distinguishing CG from IC events. In the post 2015 configuration, the detection efficiency is estimated at 95% for CG flashes and 90% for CG strokes above 2 kA, while the median location accuracy is around 250 m. The classification capability is also slightly higher (98%). According to [], the median error for the peak current estimate is about 20%, compared with direct tower measurements. Further details can be found in []. The SIRF network is always operated with redundancy and operational scheme to guarantee 24 h/24 and 7 d/7 of availability and steady performances.
It is worth to specify that, since 2020, the management of the SIRF network has been transferred from CESI S.p.A. to the French company METEORAGE. During 2020–2021, METEORAGE underwent several changes in the Italian sensor network (including relocations and replacements). These variations, together with the sensor upgrade introduced in 2014–2015, may affect the performance of the network. Consequently, the results obtained for the two considered periods (2010–2011 and 2020–2021) must be interpreted in light of these differences.
In this contribution, not all types of lightning flashes detected by SIRF are involved: it was considered appropriate to exclude all data concerning IC strokes, because they represent a minor risk for power systems. Thanks to this operation, the dataset was significantly reduced. It is worth to specify that the IC are events of higher frequency and weaker peak current, hence the farther from the network they occur, the more difficult it is for the PLS (Precision Lightning Sensors) to detect them. As pointed out in [,], there is always the uncertainty that IC strokes are misinterpreted as positive CG strokes. However, SIRF classification tool is assumed to be robust for the purpose of this analysis
Since one of the aims of the analysis is lightning occurrence variability between sea and land, it was decided to consider the area under investigation depicted in Figure 1, which extends for 750,072 km2 and includes part of the Mediterranean Sea, to perform sea-based and land-based analyses.

Figure 1.
Domain of interest for lightning analysis.
In order to enable a rigorous comparison, as previously performed in [], the spatial extents of marine and terrestrial surfaces were selected to be as similar as possible. Specifically, the marine domain considered in this work encompasses 448,734 km2, while the corresponding terrestrial domain covers 301,338 km2. The maritime region was additionally defined so as to remain sufficiently close to the Lightning Detection Network, ensuring comparable detection capabilities, supported also by the contribution of nearby sensors located in other countries throughout the observation period.
The analysis also incorporates the potential influence of topographic elevation on lightning occurrence within the Italian territory. Since the SIRF dataset does not provide elevation at the point of ground impact, this parameter has been integrated as a new attribute. Elevation values were derived using a Digital Elevation Model (DEM), which represents the terrain surface in three dimensions on the basis of elevation data. For each recorded strike, the DEM was linked to the geographical coordinates supplied by SIRF, thereby providing the corresponding ground altitude. Typically, a DEM is available in raster form, where each cell stores the elevation above mean sea level. When employed within a Geographic Information System (GIS), DEMs can generate additional layers of information whose applications are numerous, particularly in the field of geospatial analysis and natural hazard mitigation.
The parameters investigated in the present study are listed below, with further details provided in the subsequent section:
- Seasonal maps and monthly variation in GSD;
- Monthly variation in the negative-to-positive cloud-to-ground stroke ratio;
- Diurnal cycle lighting occurrence across different seasons;
- Seasonal distributions of strike-point elevation and its dependence on latitude;
- Monthly variation in the mean peak current at the channel base;
- Distribution of flash multiplicity and the spatial separation between stroke impact points within a flash;
- Distribution of the current peak for positive first strokes, negative first strokes, and negative subsequent strokes.
3. Lightning Activity: Results and Discussion
3.1. Seasonal Maps of CG Strokes
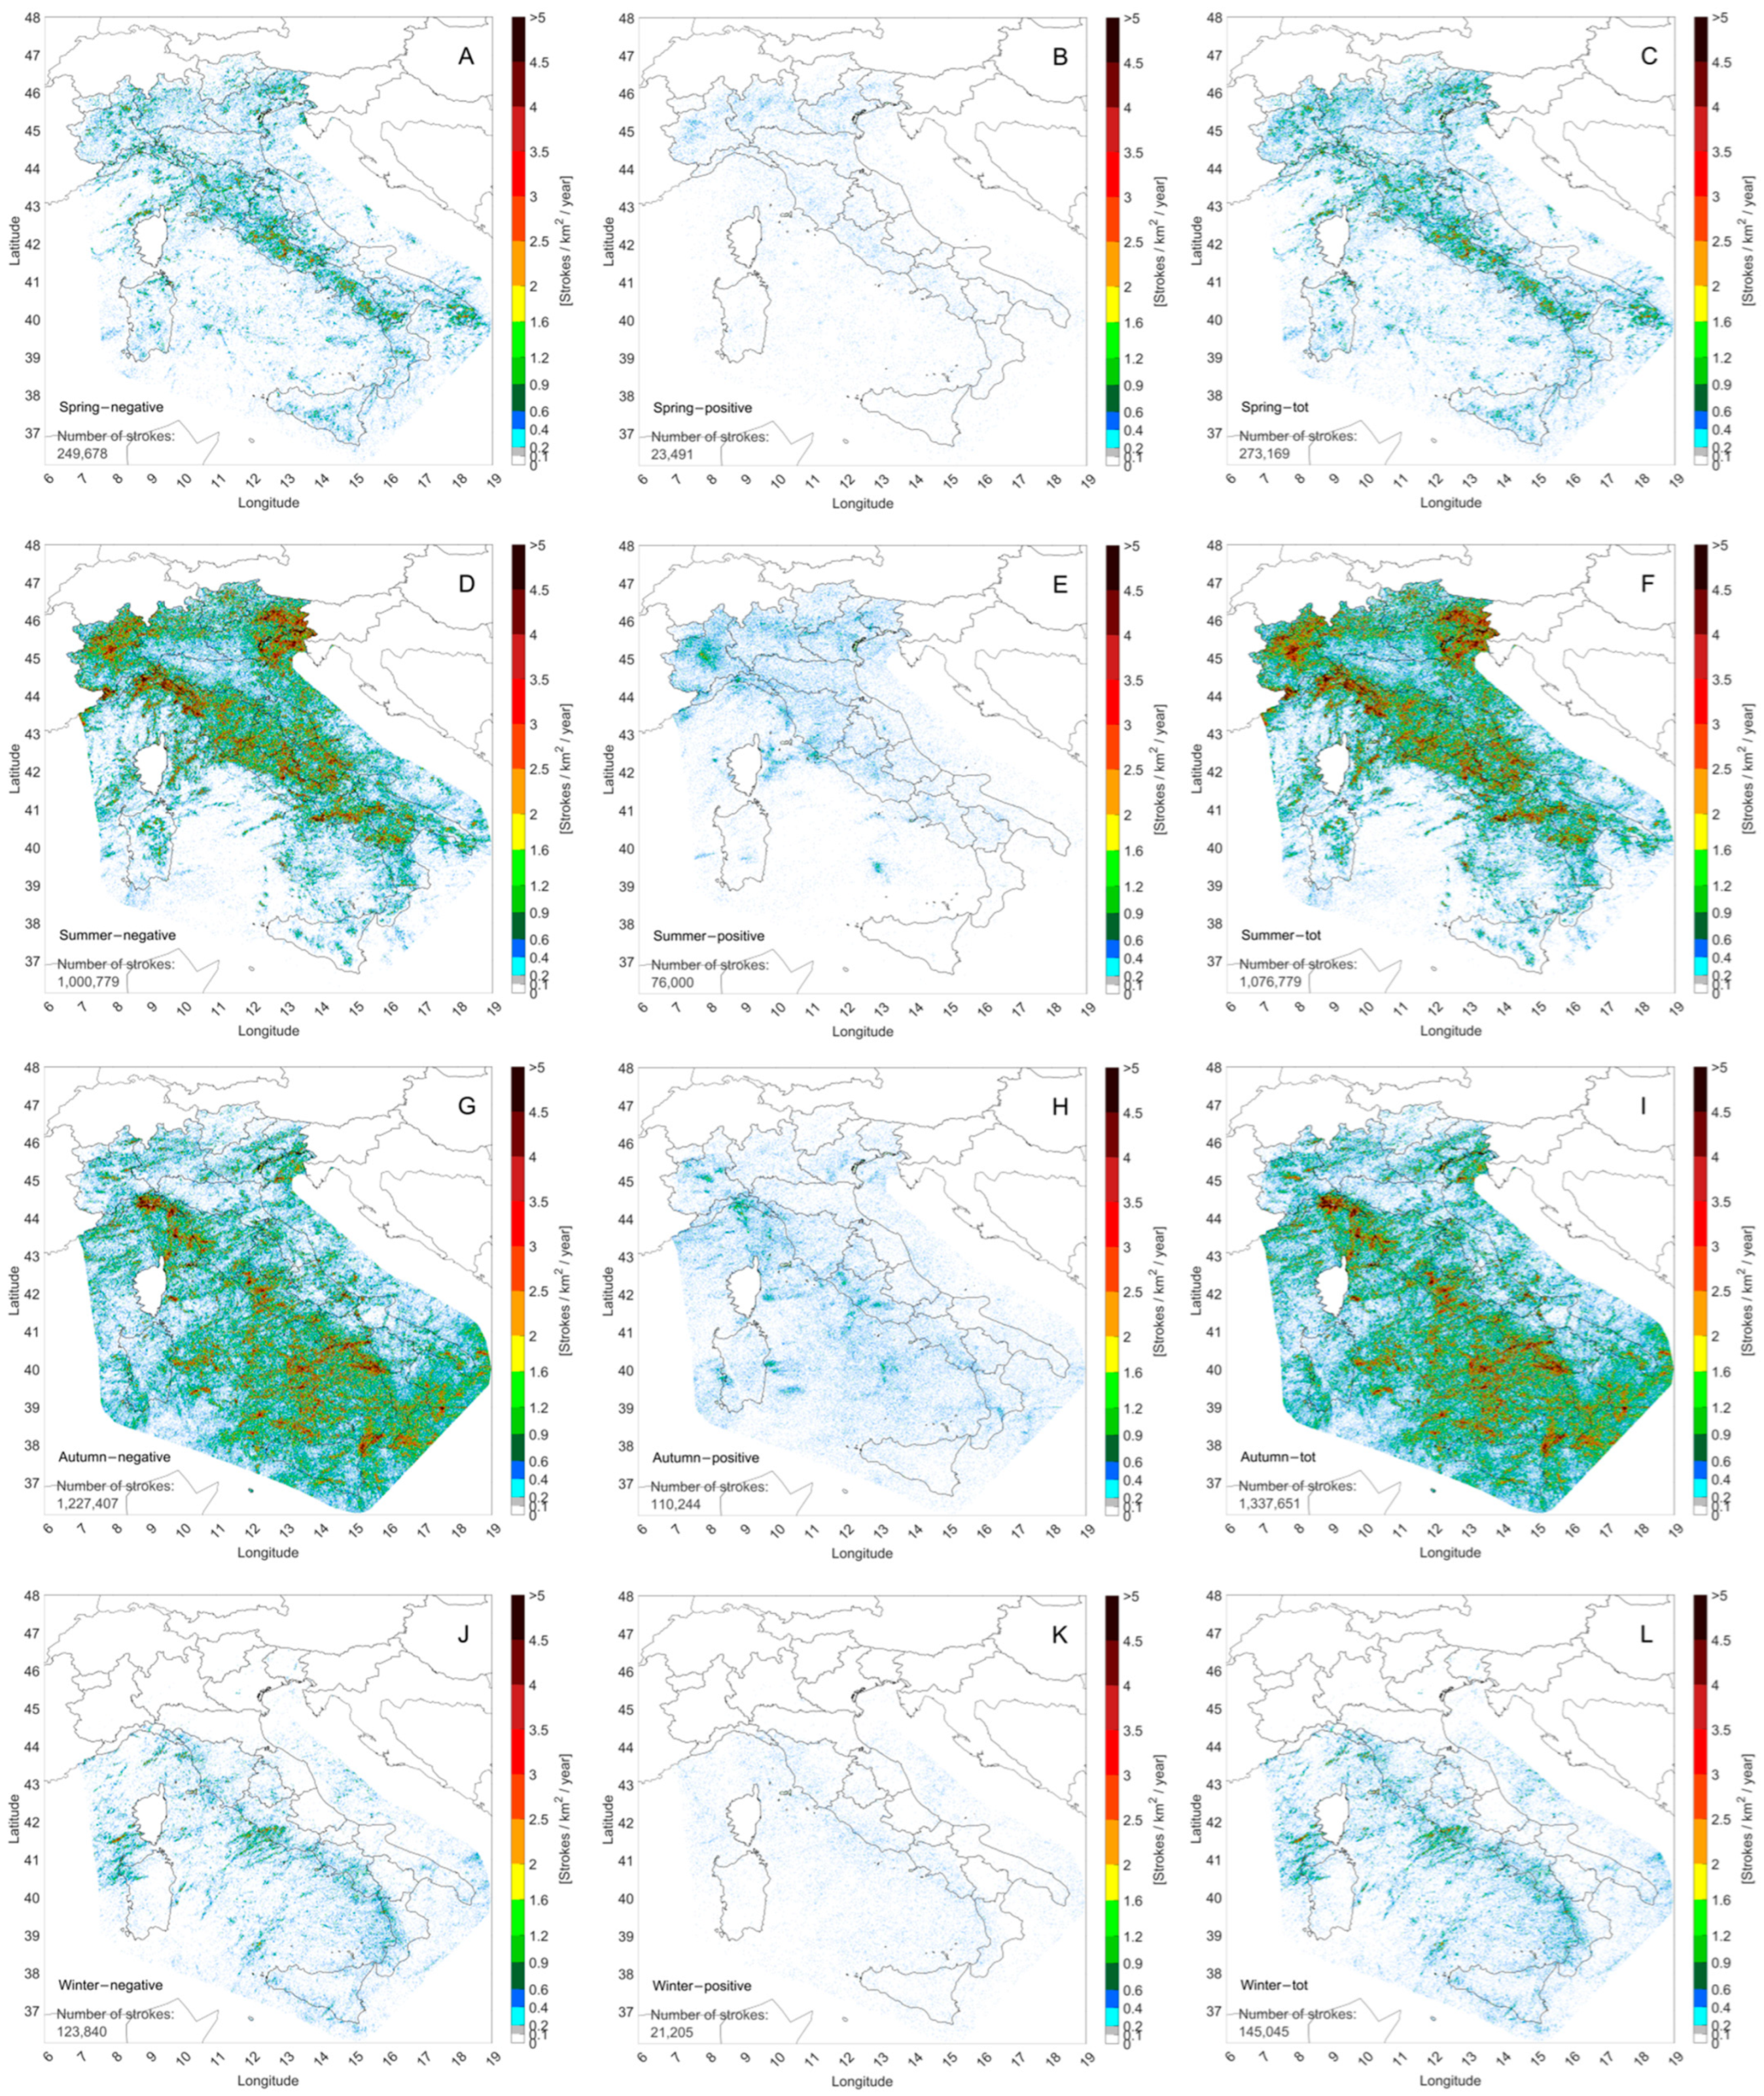
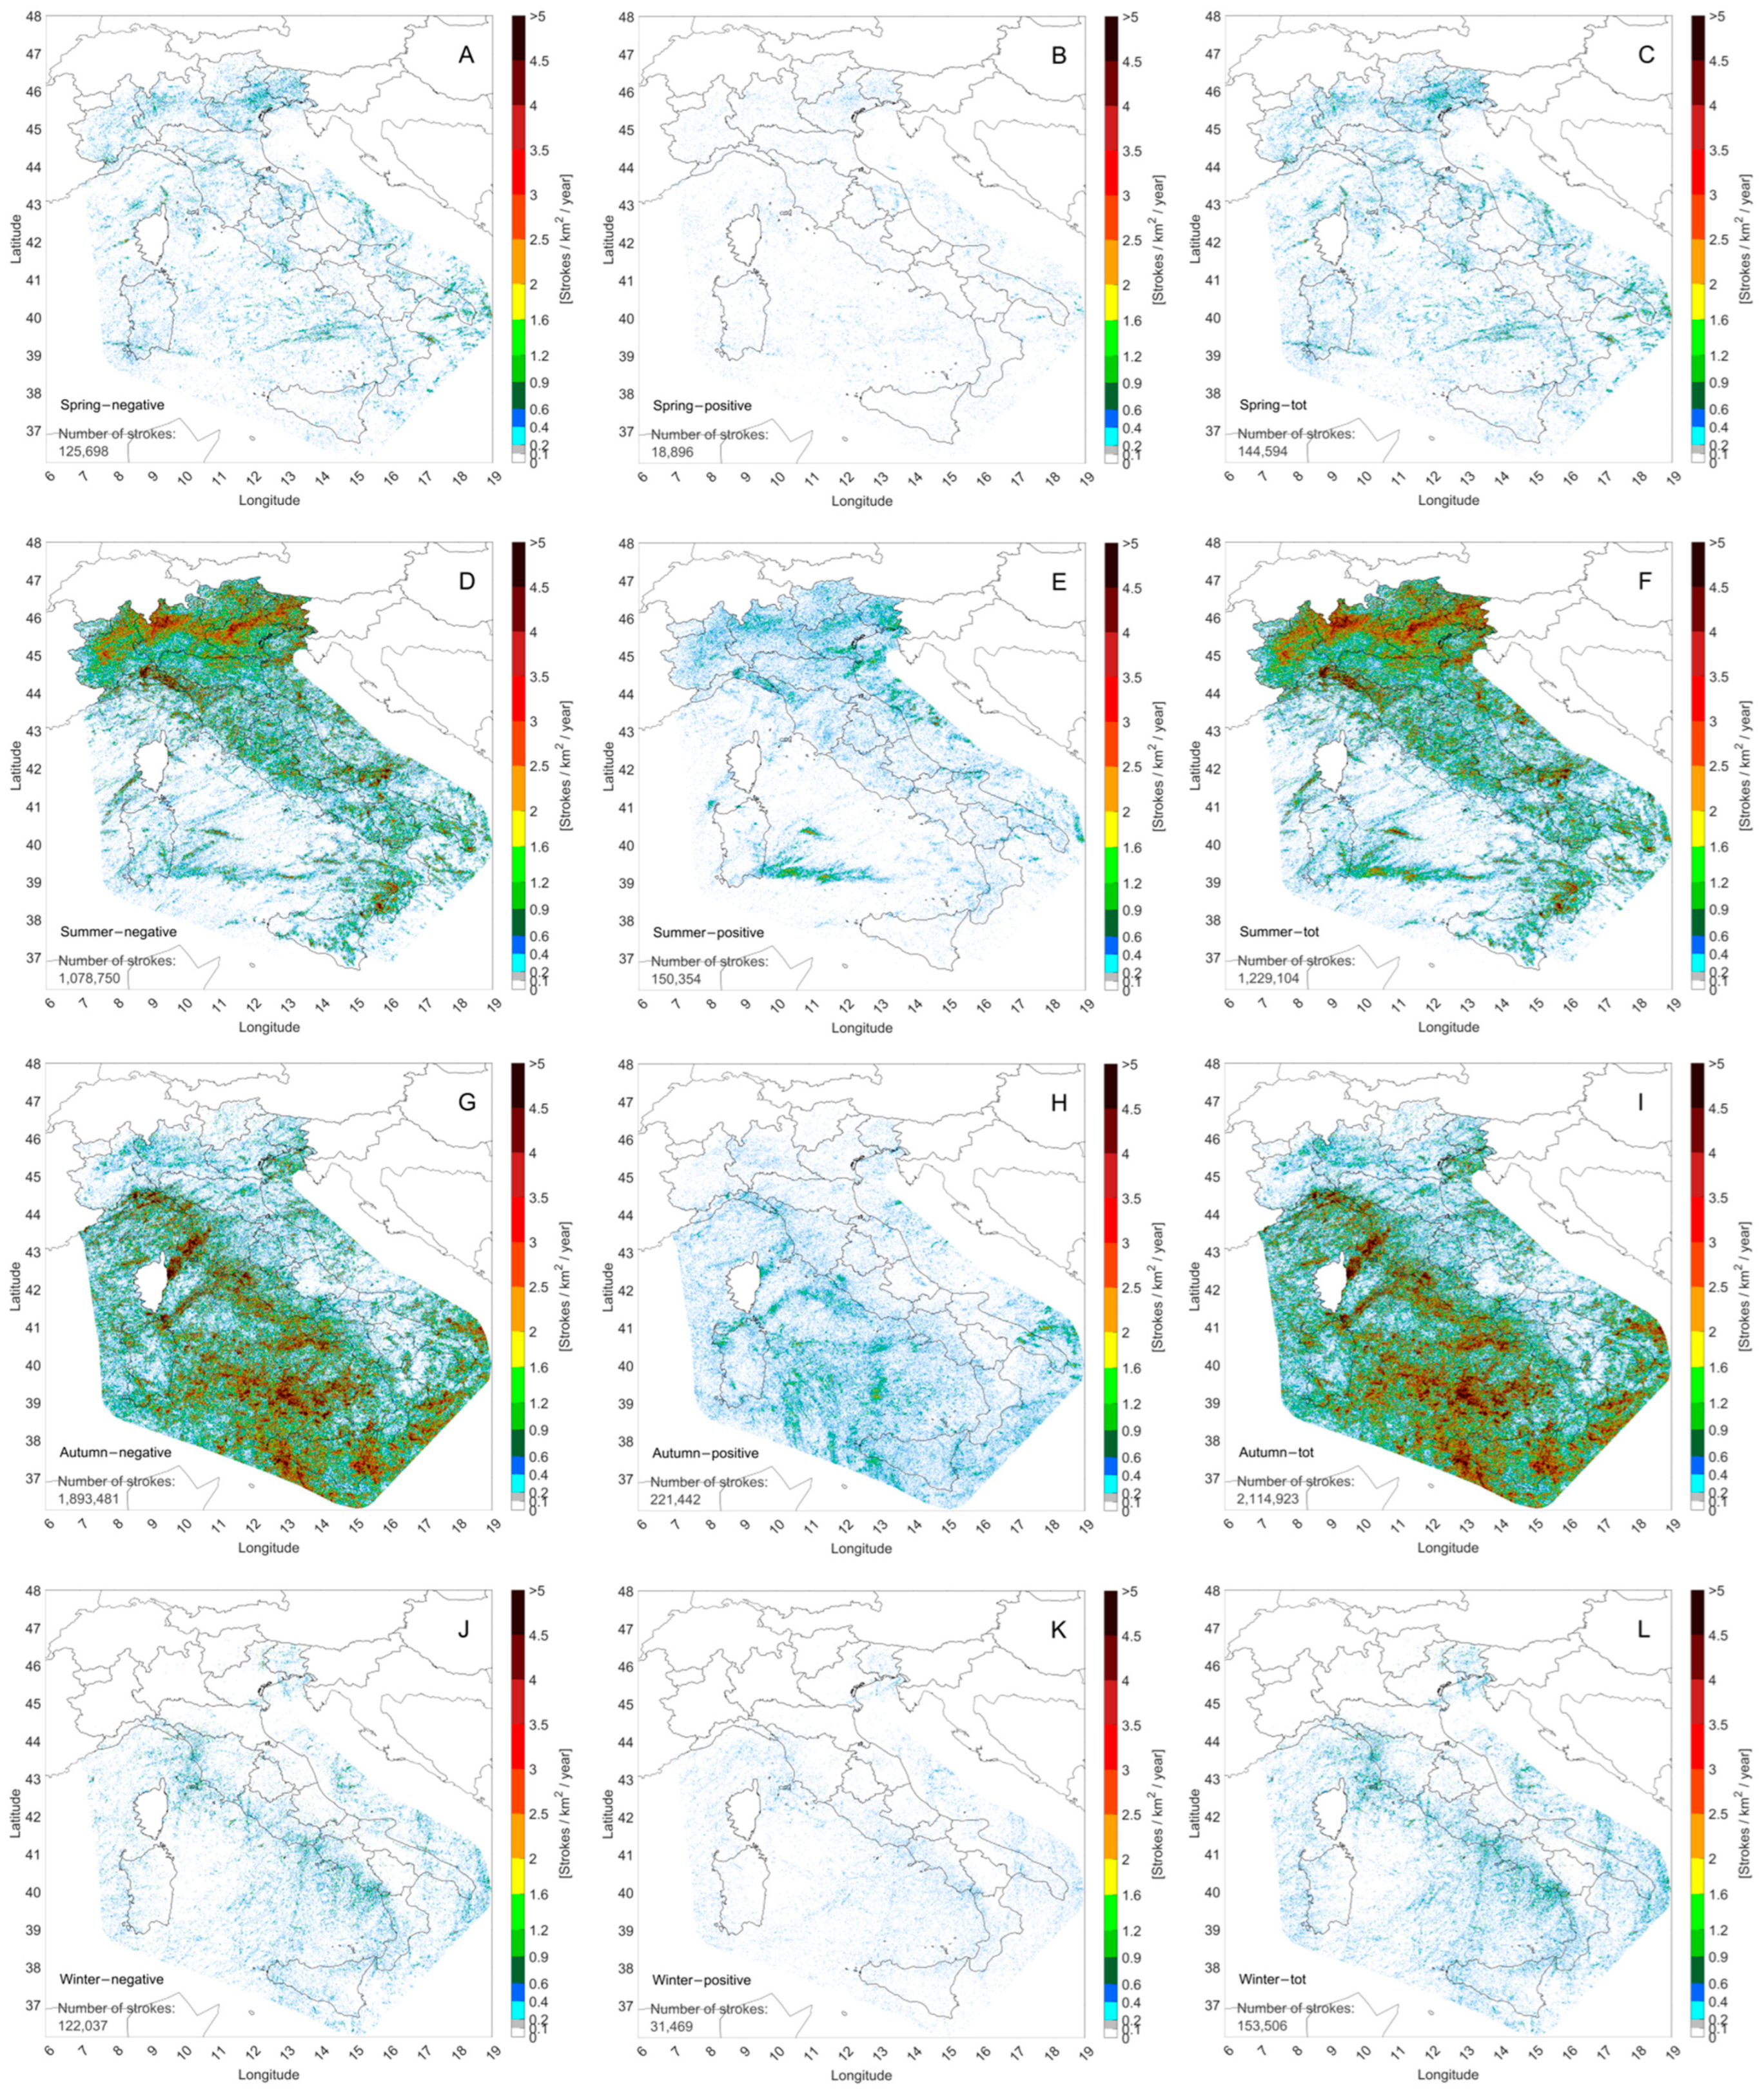
Figure 2 and Figure 3 show the seasonal spatial distribution of the negative (left column), positive (central column), and total CG (right column) events over the 2010–2011 and 2020–2021 periods, respectively. For this purpose, measurements were reported to a 1 × 1 km2 grid, cumulated by season and divided by the length of the considered period. The same data are collected in Table 1.

Figure 2.
Seasonal spatial distribution of CG strokes over the 2010–2011 period. Negative (A), positive (B), and total (C) events during spring. Negative (D), positive (E), and total (F) events during summer. Negative (G), positive (H), and total (I) events during autumn. Negative (J), positive (K), and total (L) events during winter.

Figure 3.
Seasonal spatial distribution of CG strokes over the 2020–2021 period. Negative (A), positive (B), and total (C) events during spring. Negative (D), positive (E), and total (F) events during summer. Negative (G), positive (H), and total (I) events during autumn. Negative (J), positive (K), and total (L) events during winter. The total number of CG strokes detected by the CESI-SIRF network during the 2010–2011 period is 2,832,644, whereas that detected by the METEORAGE-SIRF network during the 2020–2021 period is 3,642,127. Thus, a 29% increment in CG lightning activity in Italy has been recorded.

Table 1.
Count of negative, positive, and total CG strokes over the 2010–2011 and 2020–2021 periods.
Comparing the total number of strokes, a significant seasonal variability in lightning activity is highlighted: for both periods the highest number of total strokes is recorded in autumn (September–October–November—SON, panel I), followed by summer (June–July–August—JJA, panel F); much less events are detected during spring (March–April–May—MAM, panel C) and winter (December–January–February—DJF, panel I). However, it should be noted that, in summer and winter a similar number of total strokes has been detected in the two periods; on the other hand, strong differences in 2020–2021 records with respect to 2010–2011 records appear in spring (−47%) and autumn (+58%), mainly due to negative strokes. Although the impact of positive strokes on the total count is less relevant; it is worth noting that their increment is +83%, with strong contributions given by summer (+98%) and autumn (+101%) events.
Some local differences in seasonal spatial distributions of CG lightning can be observed in the two periods. In 2010–2011 during spring, the negative CG strokes (and therefore the total ones) are concentrated along the western coast of the peninsula and around the northeast regions, whereas in 2020–2021 are more concentrated on the Po valley. Similar considerations can be made for the total CG strokes in summer. On the other hand, considering the total CG strokes in autumn, the areas with the greatest concentration are, in general, the same in both periods (i.e., on the coastal regions of western Italy and especially over the sea); however, the stroke density of 2020–2021 is much higher than that of 2010–2011. In winter, the areas with the greatest concentration remain practically the same in both periods, i.e., the western coast of the peninsula. The only difference is the presence of an additional hot spot, located to the northeast in Friuli Venezia-Giulia, in the biennium 2020–2021.
3.2. Monthly Variation in CG Stroke Density
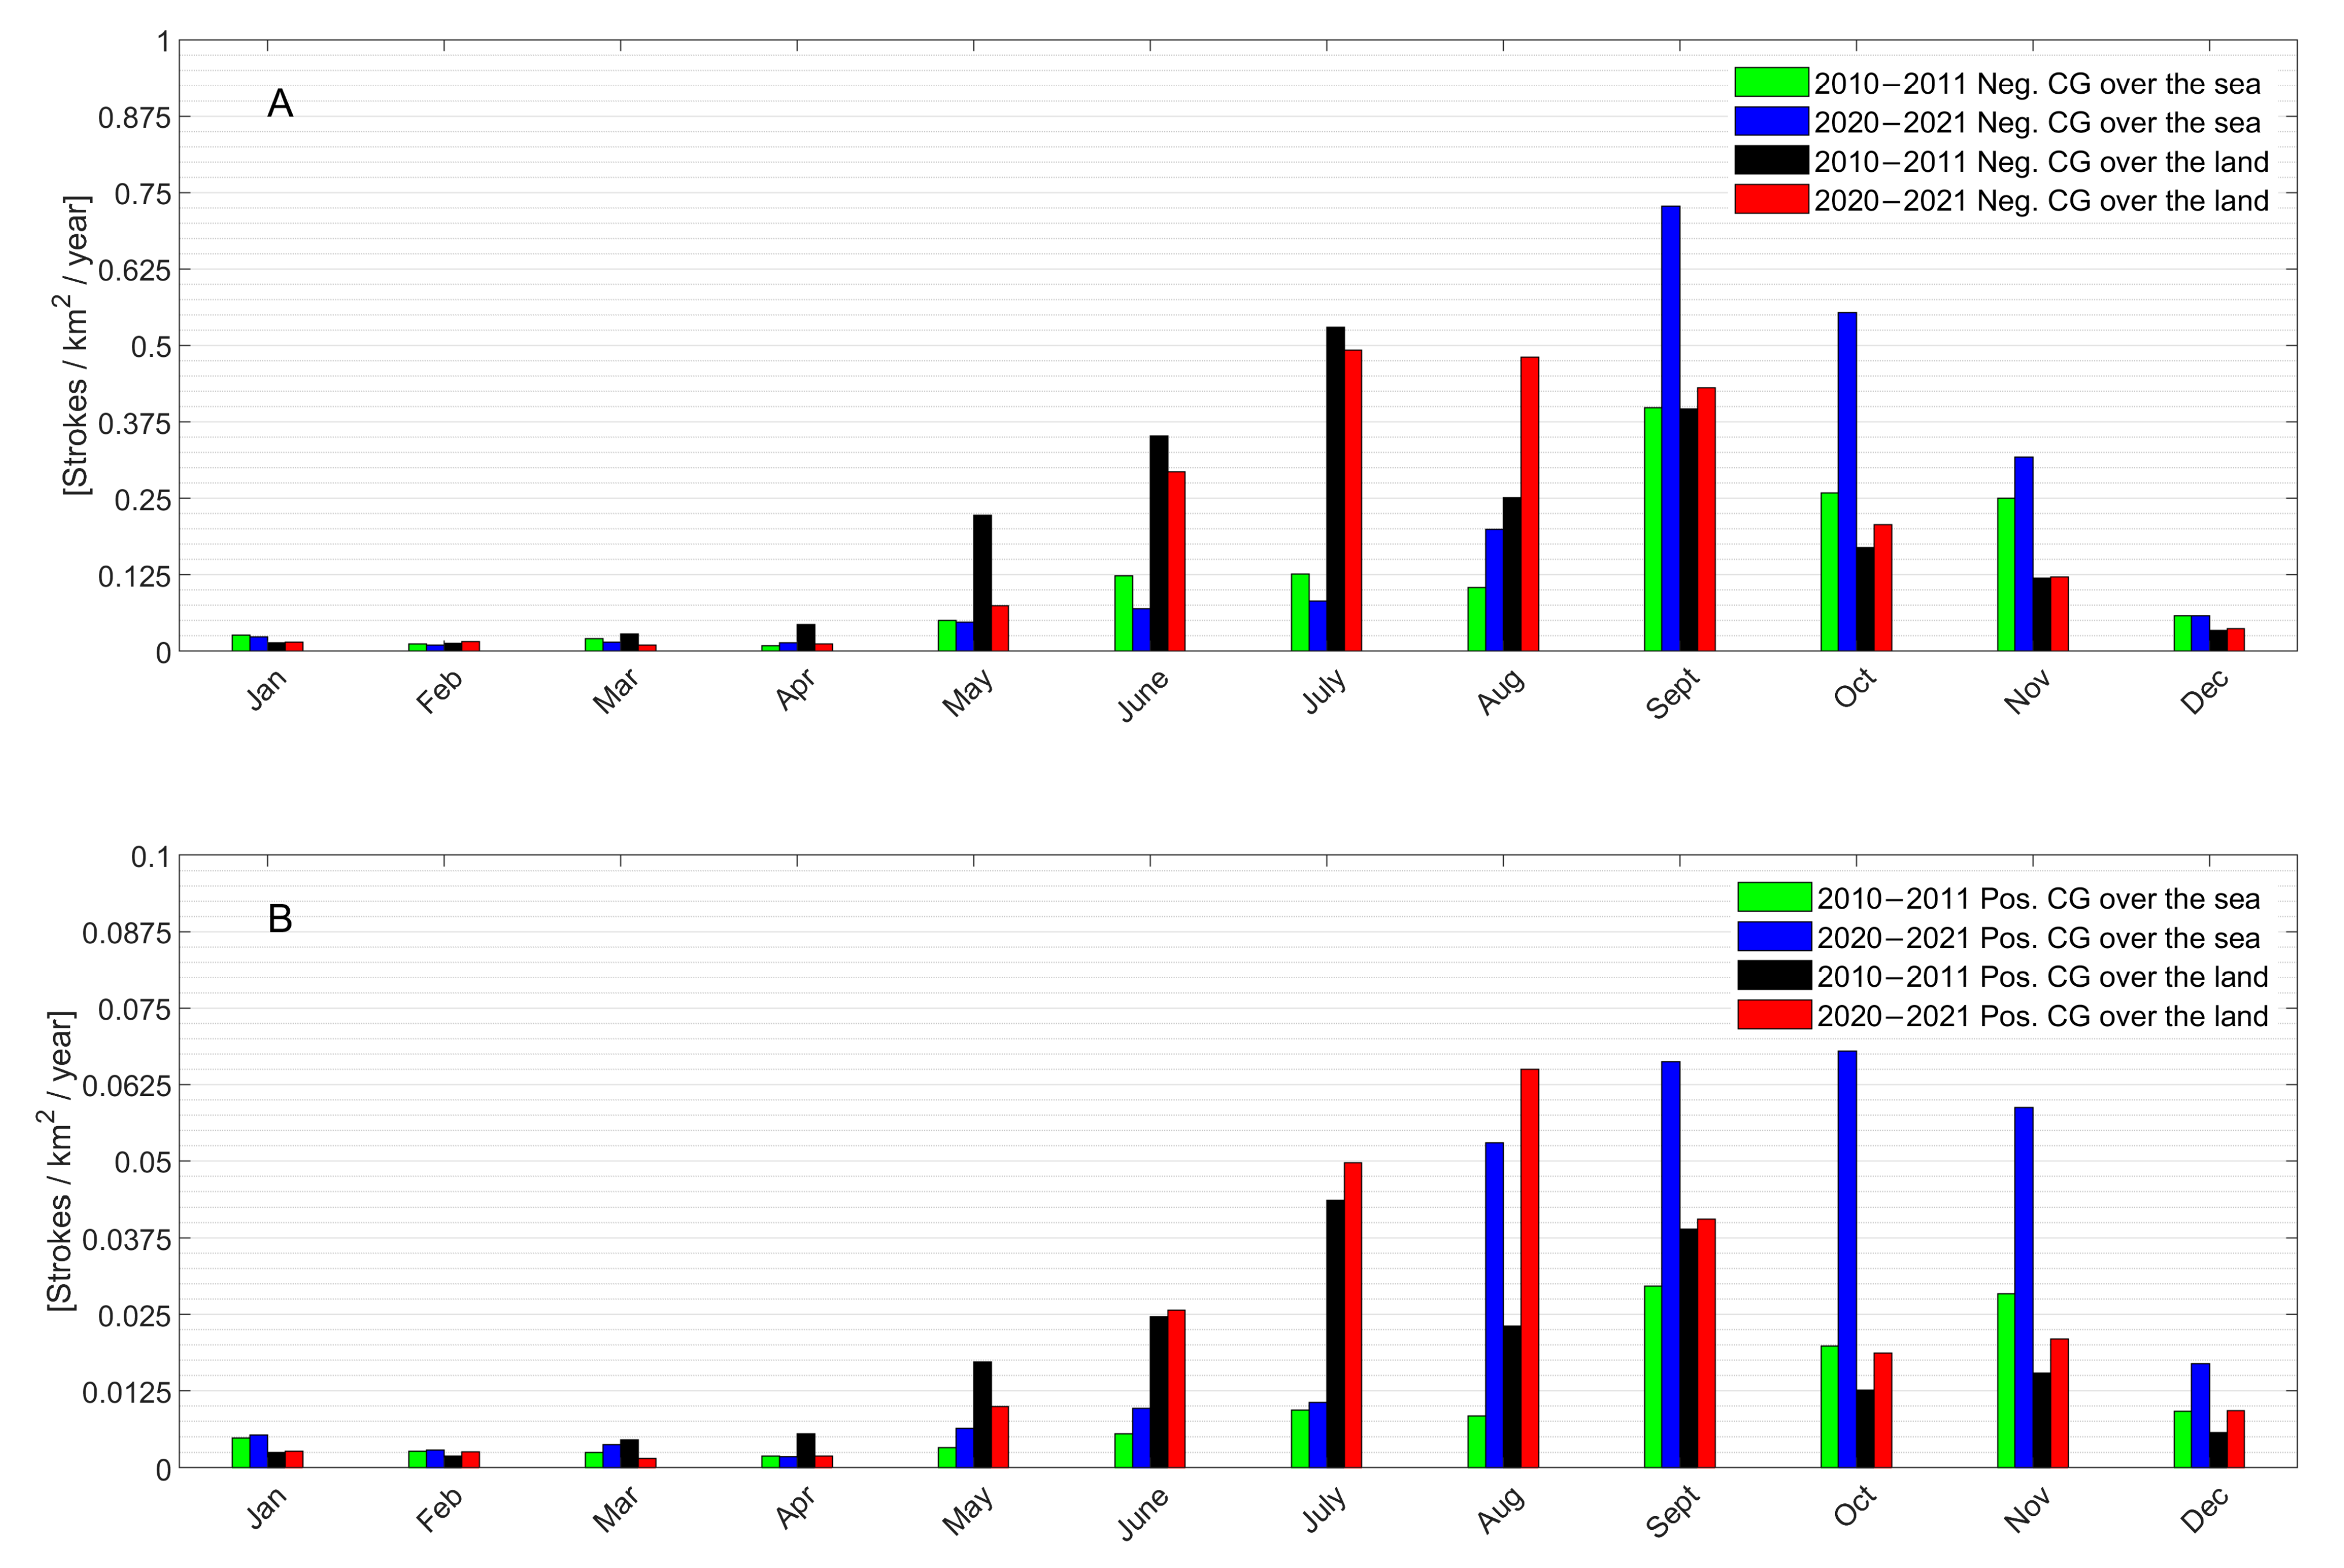
The monthly behavior of the stroke density, i.e., the ratio between the yearly number of lightning strokes occurring over an area and the corresponding surface in km2, is investigated in this section. Figure 4 shows the monthly mean density of negative CG strokes (panel A) and positive CG strokes (panel B) over the sea and land for the 2010–2011 and 2020–2021 periods.

Figure 4.
Monthly density of negative CG strokes (panel A) and positive CG strokes (panel B) over the sea and the land. Comparison between the 2010–2011 and the 2020–2021 biennia.
The extension of sea and land surfaces has been considered similar in size as much as possible to make a robust comparison. Thus, in this study, the land surface is 448,734 km2 and that of the sea is 301,338 km2.
It is important to point out that the monthly mean density of positive CG strokes both over the sea and land in 2010–2011 and in 2020–2021 are always lower than 0.05 and 0.07 strokes km2 yr−1, respectively. Thus, their values are almost negligible with respect to those of negative CG strokes.
Despite a slightly different magnitude, a similar trend can be observed in all panels. Very low values from January to April are followed by an increase until a maximum is reached between July and September. Then, during autumn and winter, a decrease to values comparable with those of the first months of the year.
CG stroke density in 2010–2011 reaches greater values over the land in summer, whereas in 2020–2021, the highest densities are over the sea during autumn. Regardless of the polarity, in the 2010–2011 (2020–2021) period, CG lightning activity is more relevant over the sea than over land from October (September) to January.
3.3. Monthly Variation in the Negative/Positive CG Strokes Ratio
Figure 5 represents the monthly behavior of the ratio between negative CG and positive CG strokes over the sea and over the land for the 2010–2011 and 2020–2021 period.

Figure 5.
Monthly negative/positive CG stroke ratio over the sea and the land. Comparison between the 2010–2011 and the 2020–2021 biennia.
As regards the 2010–2011 period, the negative CG strokes are between 4.5 and 26.5 times the positive ones, whereas in the 2020–2021 period, the negative CG strokes are between 3.5 and 12 times the positive ones.
The most significant difference that can be highlighted by observing the two figures is that in 2020–2021, the ratio between negative CG and positive CG strokes is always higher over the land than over the sea, except for January, February, April, and December; for the 2010–2011 period the opposite holds true: in 2021, the ratio between negative CG and positive CG strokes is always lower over the land than over the sea, except for April, May, and September.
The ratio recorded in 2020–2021 over the sea is remarkably lower than that recorded in 2010–2011. Indeed, in 2010–2011, the ratio varies between 4.5 and 26.5, whereas in 2020–2021, between 3.5 and 12.0. Over the land, this feature is less marked, since the stroke ratio is between 4.5 and 14.0 in 2010–2011, 3.5 and 12.0 in 2020–2021.
3.4. Seasonal Diurnal Cycle Distributions
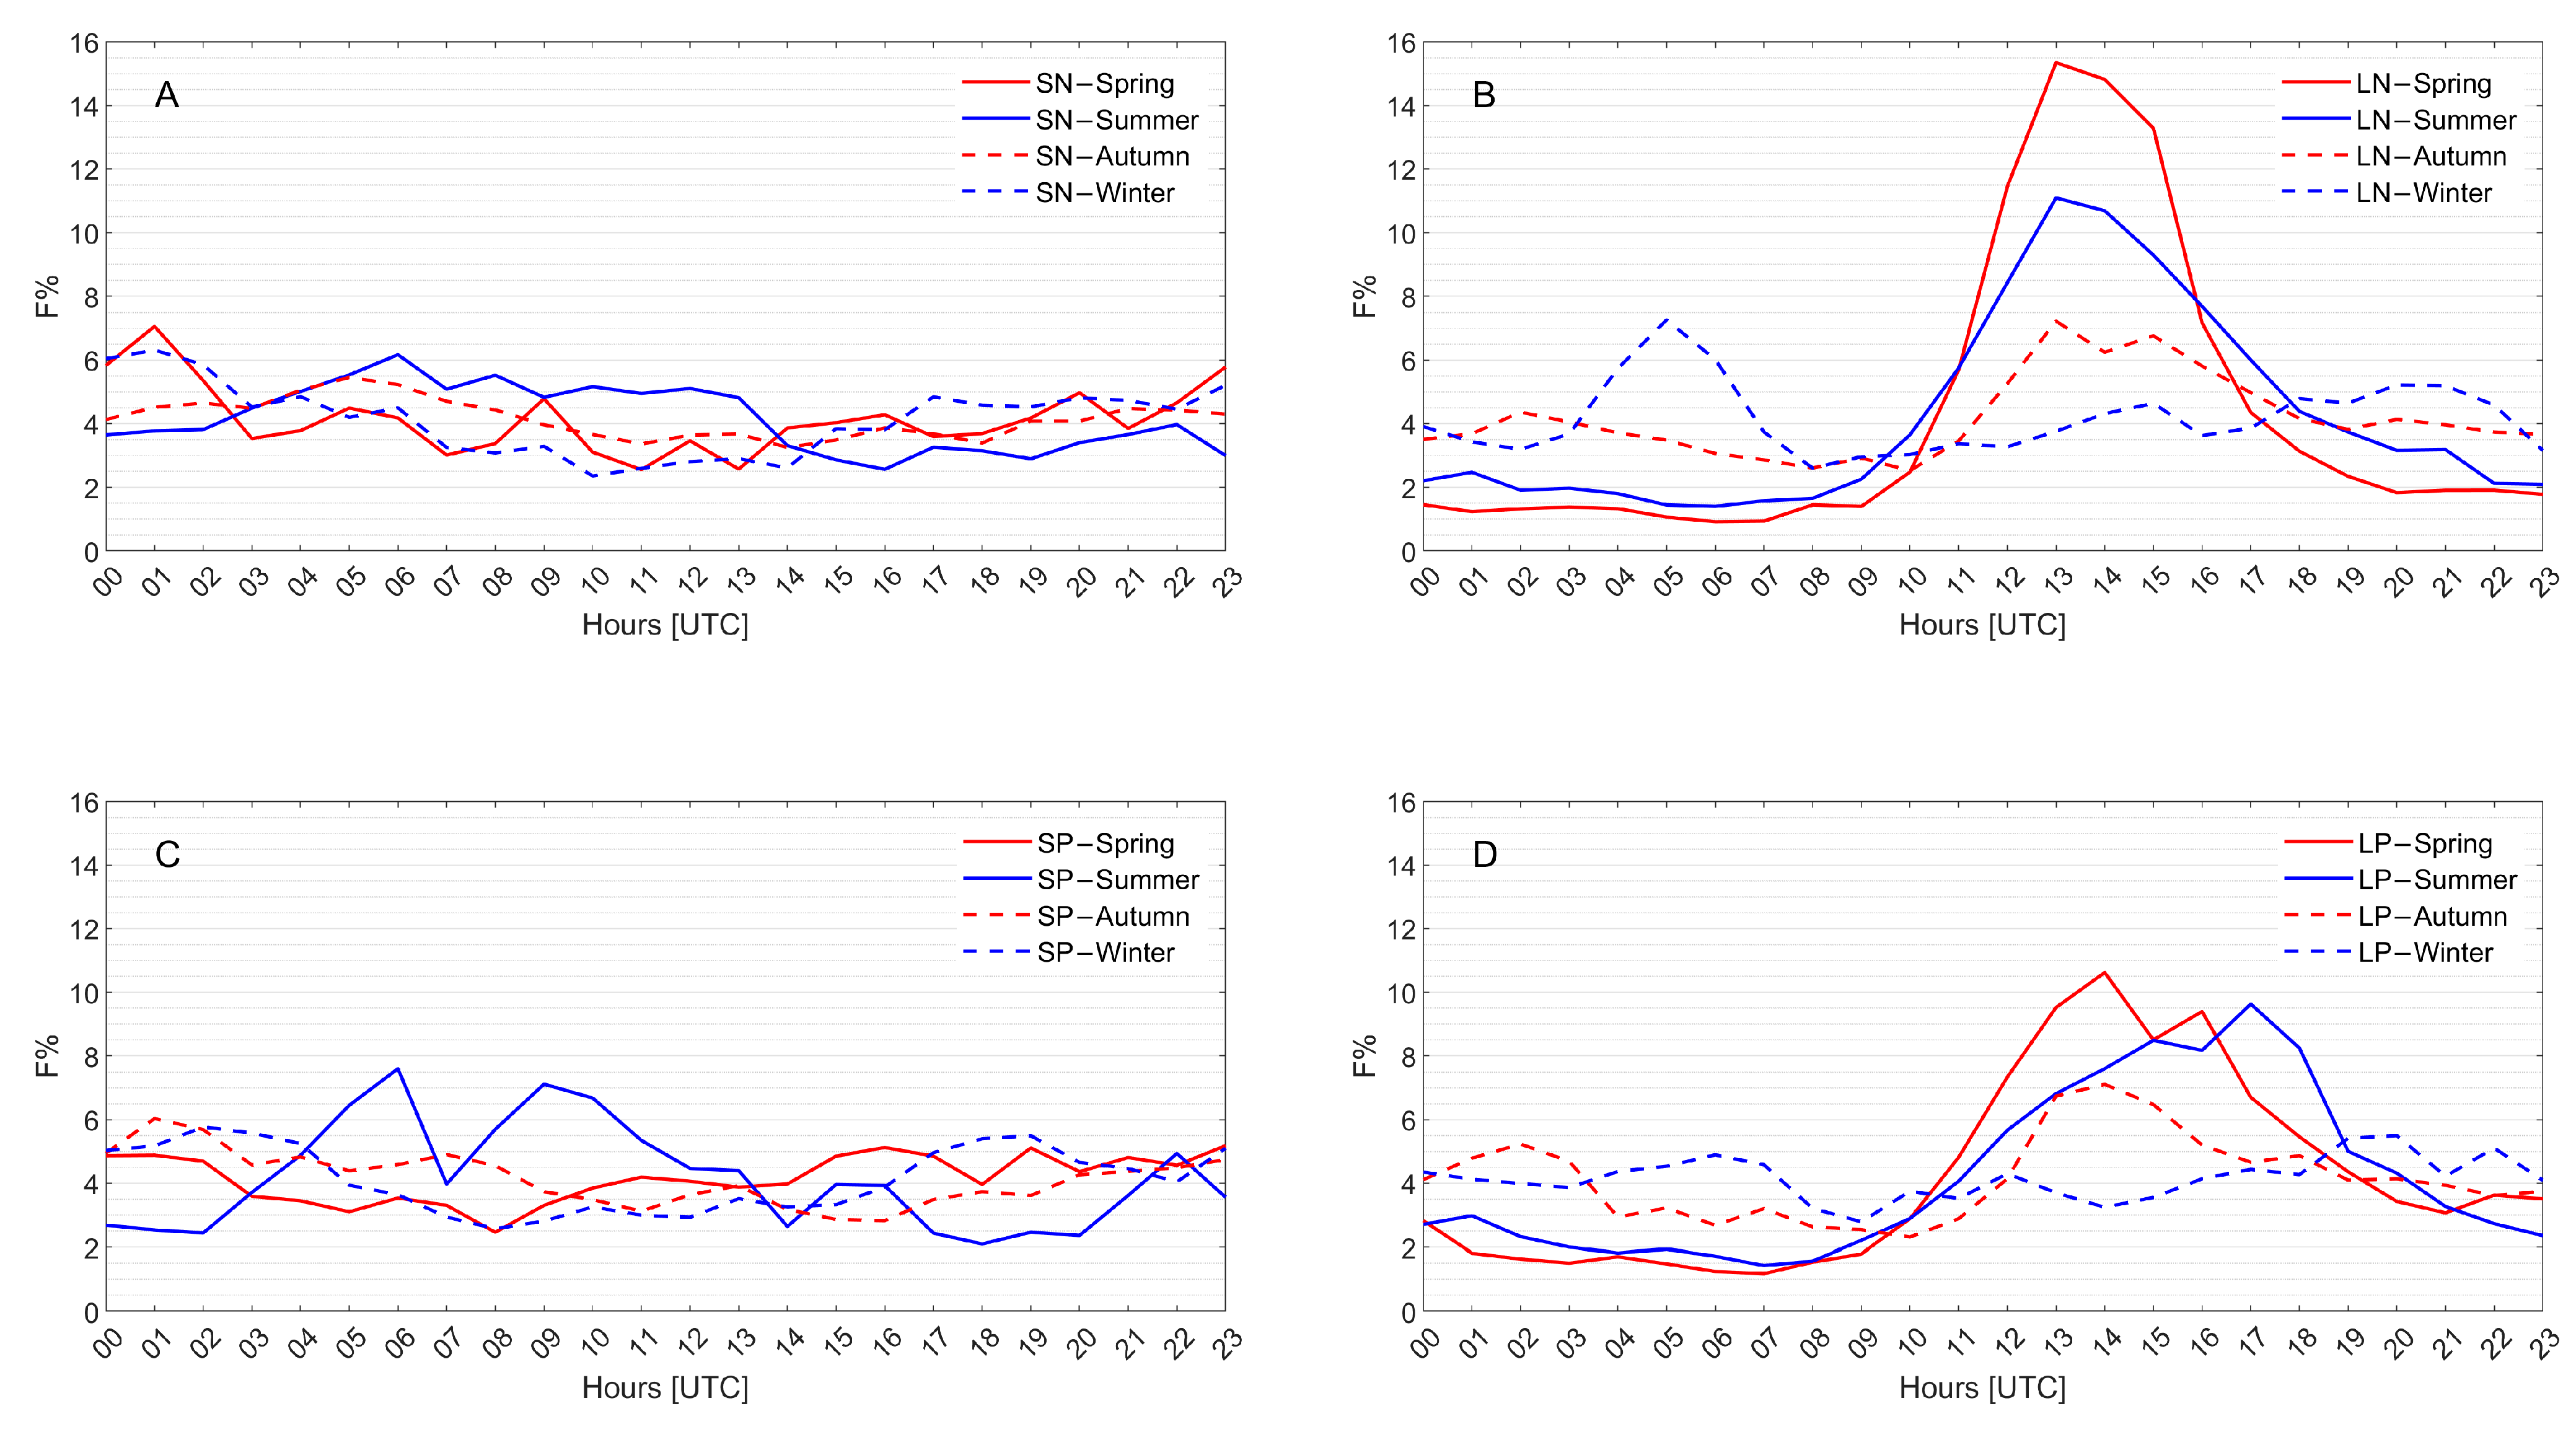
Knowledge of the diurnal cycle variability in lightning distribution supports comprehension of severe weather development. Thus, the seasonal diurnal cycle distributions are obtained by evaluating the percentage of CG strokes per hour of the diurnal cycle for each season. The total number nh of CG strokes (positive or negative that over the sea or the land) occurring between hour h and h + 1 is evaluated. Finally, the frequency of occurrence F% is evaluated for each h as follows:
Regardless of the polarity, in both Figure 6 and Figure 7, the lightning activity over the sea (panels A and C) appears quite constant throughout the diurnal cycle for all seasons. For what concerns both negative and positive CG strokes over the land, the highest concentration occurs between the late morning and the afternoon (10–18 UTC) (panels B and D) in each season, except for winter. Moreover, generally in spring and summer, the lightning activity peak measured during midday hours is more relevant than in other seasons. The reason is due to the excessive heating from sunlight on land during the warmest hours of the diurnal cycle that increases turbulent mixing of heat and moisture in the boundary layer supporting the convective initiation. During the warm season, strong daytime heating makes surface air parcels warmer and more buoyant, enhancing their rise. As these moist parcels ascend, latent heat release further accelerates the updrafts. Higher buoyancy allows more of the available Convective Available Potential Energy (CAPE) to convert into kinetic energy, producing stronger convection. Stronger updrafts promote charge separation in clouds, favoring electrified storms and lightning formation []. Land heats up much faster than the sea during the daytime because it has a lower heat capacity. As a result, air parcels over land become warmer and more buoyant than over the sea, producing stronger updrafts. These results are consistent with the findings of the study conducted in the Mediterranean region by [].

Figure 6.
Frequency of occurrence F% for each hour of the diurnal cycle for negative CG over the sea (SN-panel A) and over the land (LN-panel B), positive CG over the sea (SP-panel C) and over the land (LP-panel D) during spring, summer, autumn, winter 2010–2011.

Figure 7.
Frequency of occurrence F% for each hour of the diurnal cycle for negative CG over the sea (SN-panel A) and over the land (LN-panel B), positive CG over the sea (SP-panel C) and over the land (LP-panel D) during spring, summer, autumn, winter 2020–2021.
3.5. Seasonal Distribution of the Point of Impact Elevation and Its Latitude Dependence
Several investigations have examined the link between lightning occurrence and terrain elevation, with the objective of assessing the influence of orographic uplift on the initiation of convection and the potential for lightning development. In many climatological analyses, lightning activity over the Italian peninsula is often generalized within the broader context of Southern Europe (e.g., []), without accounting for the distinctive characteristics of the Italian landscape, which includes diverse climatic regions. The presence of markedly steep topography (particularly in the northern sector, dominated by the Alps, and along the spine of the peninsula, shaped by the Apennines) renders broad-scale information on lightning frequency inadequate. Such generalized assessments fail to provide the level of detail required to support civil protection strategies or to guide industrial operations (including wind energy production and the management of electrical distribution networks) in the implementation of safety measures and operational procedures.
Within this context, the present analysis evaluates the spatial distributions of negative and positive cloud-to-ground (CG) stroke impact points occurring over land across three major subdivisions of the Italian territory. Specifically, the first subdivision, referred to as Northern Italy (N), extends from the Alps down to the latitude of 43.45°; the second, Central Italy (C), covers the belt between 41.20° and 43.45° latitude; while the third, Southern Italy (S), encompasses all regions situated at latitudes below 41.20°.
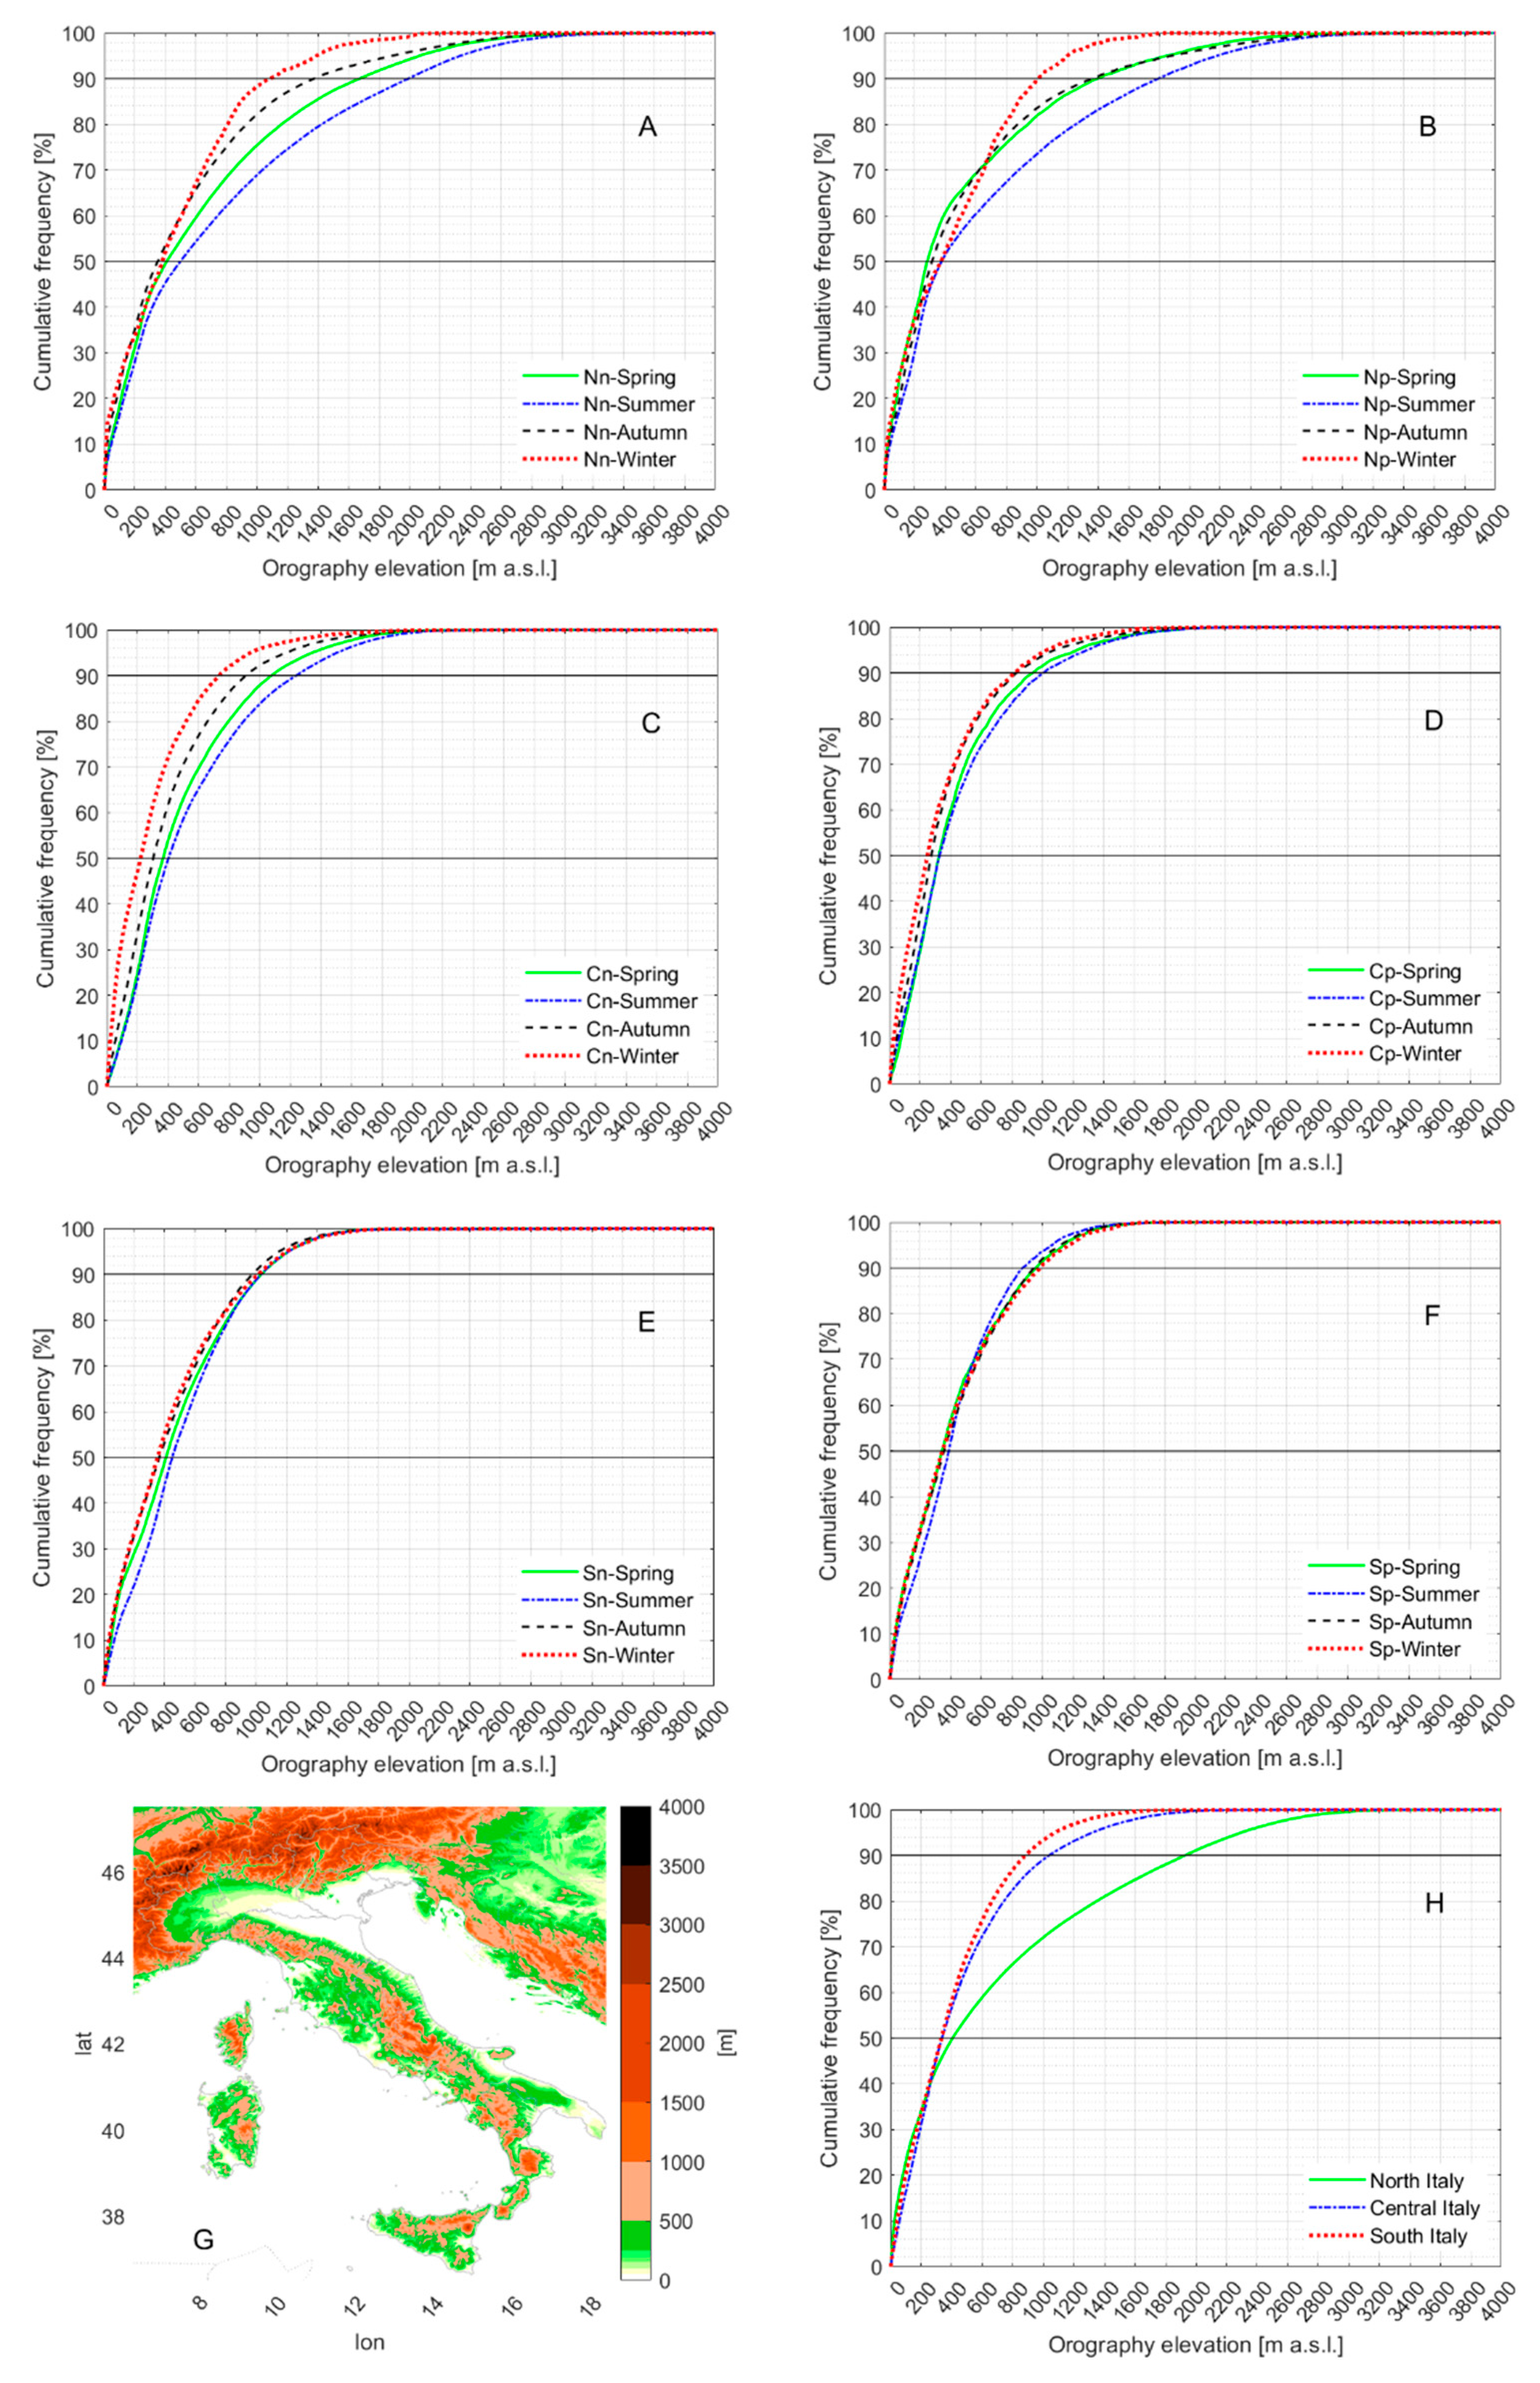
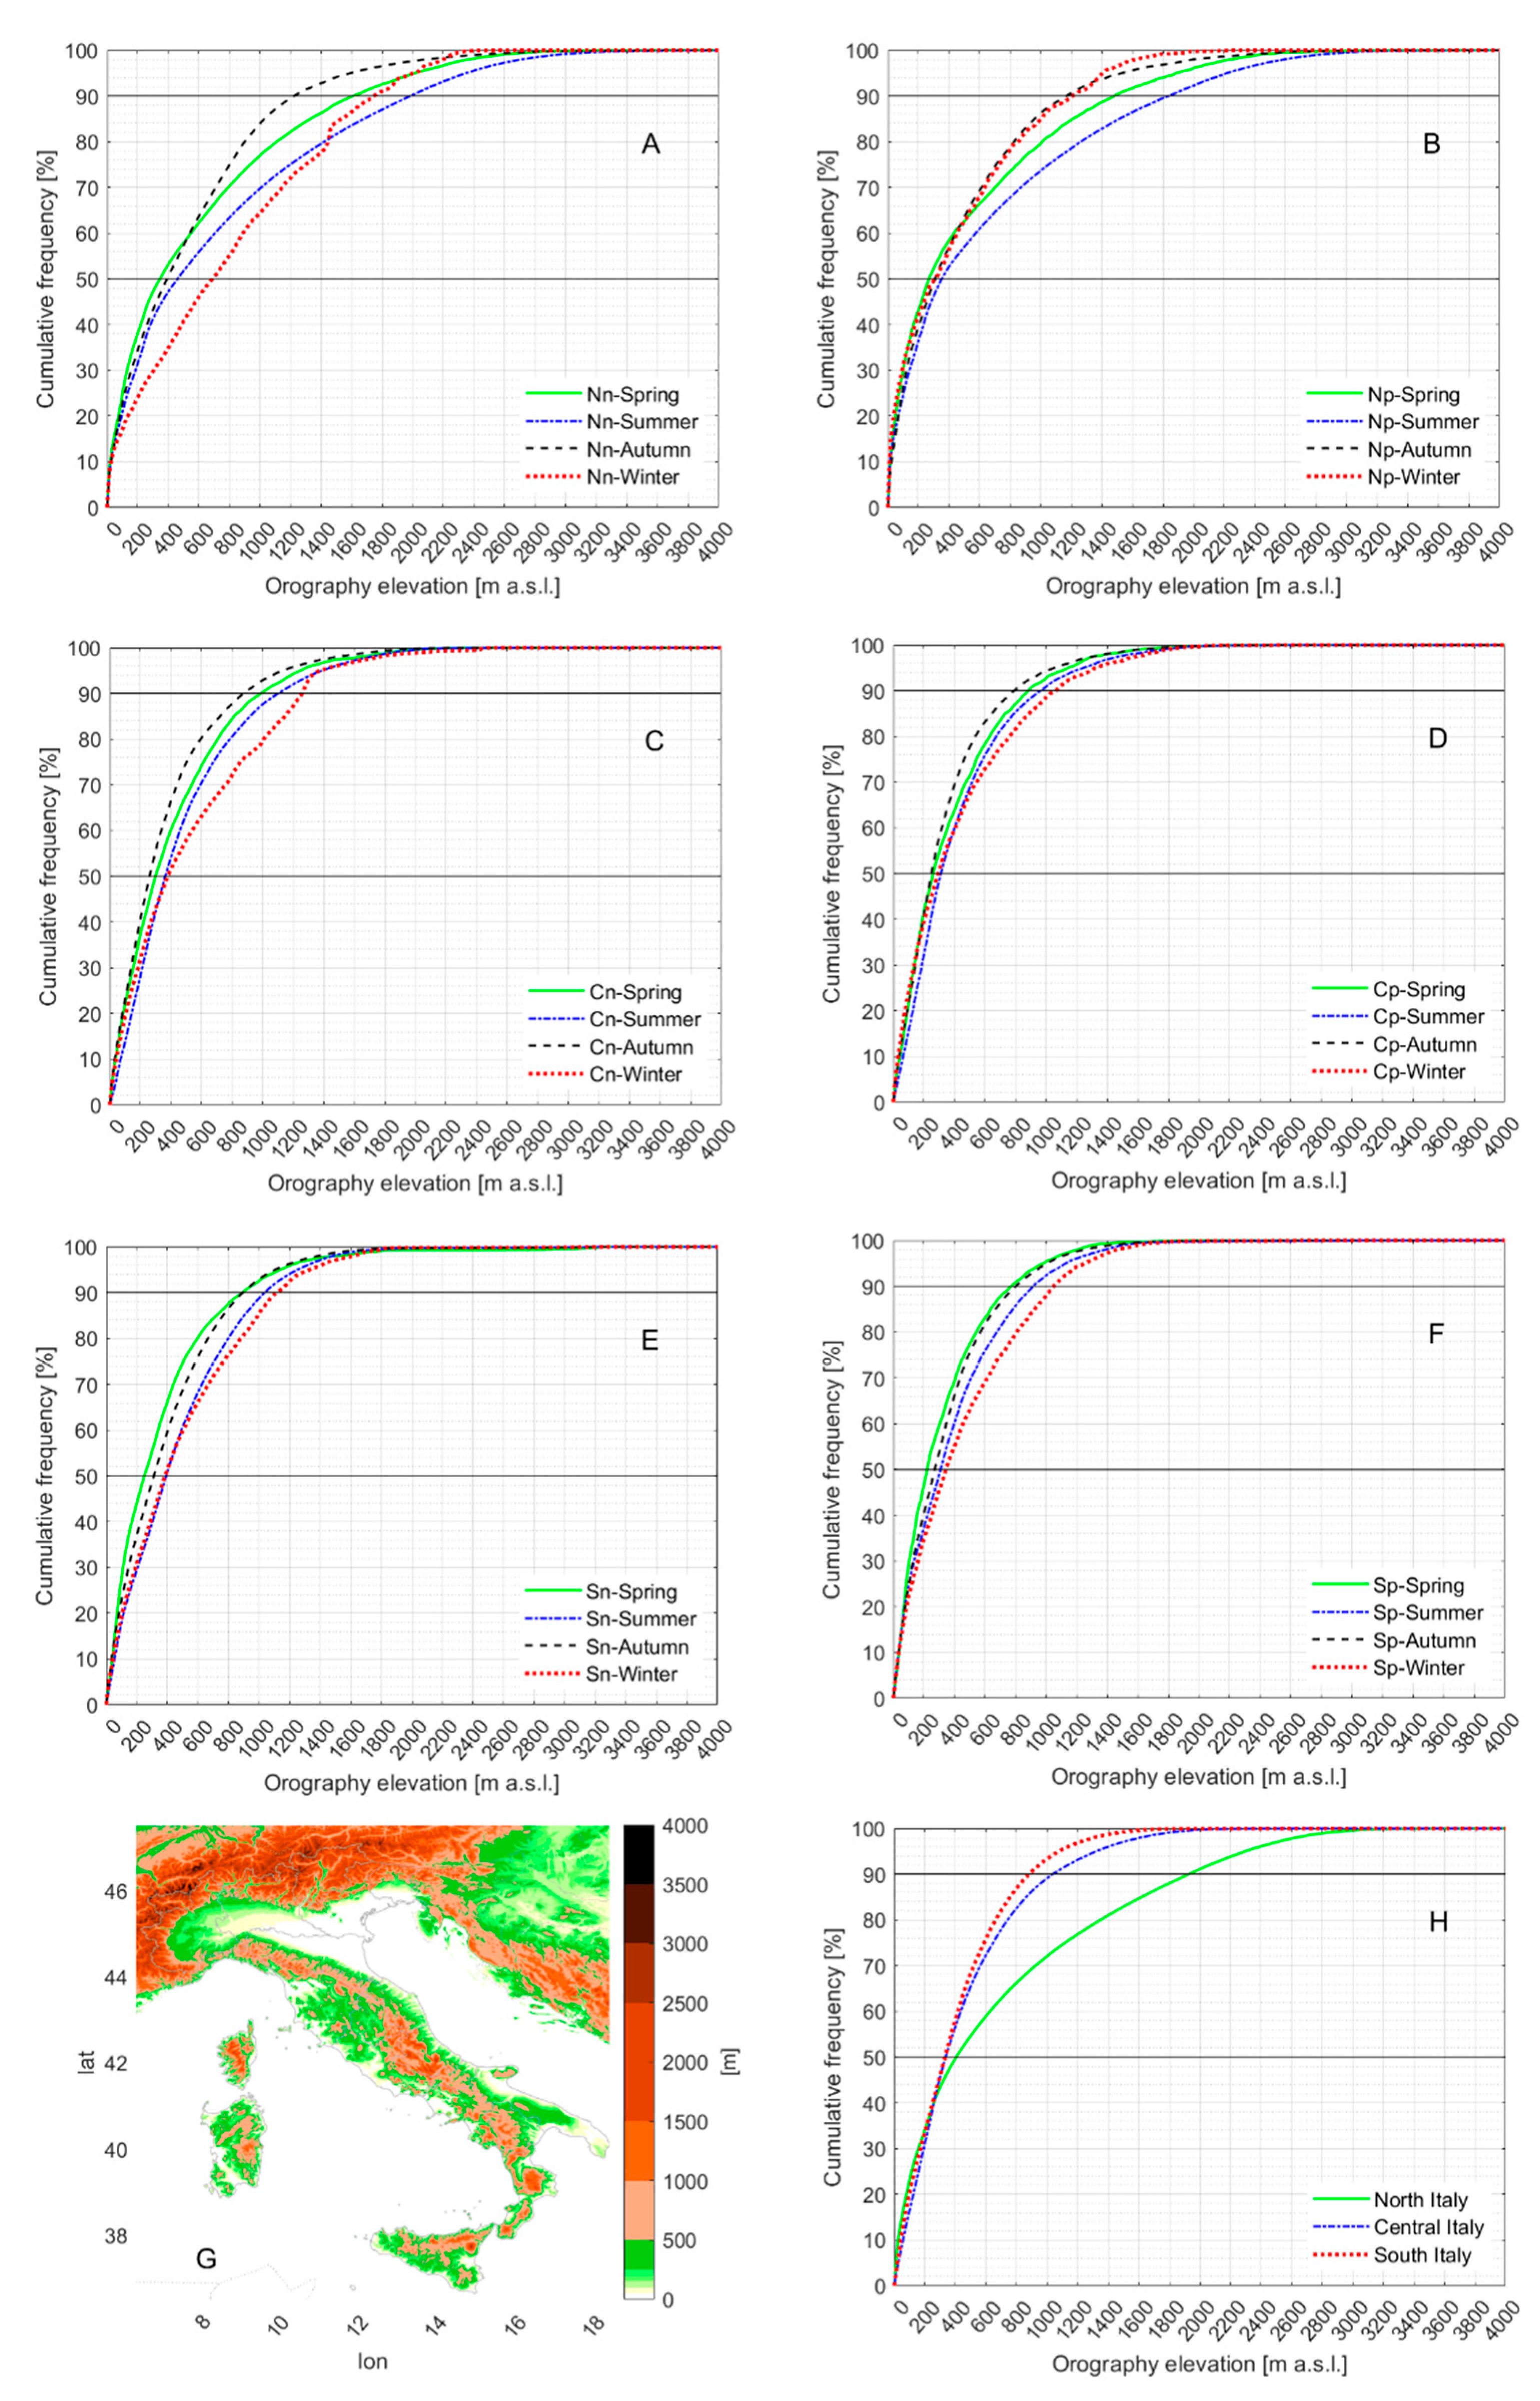
Figure 8 and Figure 9 show the cumulative frequency of occurrence [%] of the number of negative (N-left column) and positive (P-right column) CG strokes as a function of the orography elevation in the Northern (A, B), Central (C, D), and Southern (E, F) parts of Italy for each season. Moreover, a DEM of the Italian peninsula is shown in panel G, whereas the cumulative distributions of the orography elevation for the three sub-areas (N, C, S) are depicted in panel H.

Figure 8.
Cumulative frequency percentage of negative (A,C,E) and positive (B,D,F) CG strokes in 2010–2011 over land as a function of elevation classified by season and area of interest (N = North Italy, C = Central Italy and S = South of Italy). For example, Np means North positive and Nn means North negative and so on. Panels (G,H) show the distribution of orography along the Italian peninsula.

Figure 9.
Cumulative frequency percentage of negative (A,C,E) and positive (B,D,F) CG strokes in 2020–2021 over land as a function of elevation classified by season and area of interest (N = North Italy, C = Central Italy and S = South of Italy). For example, Np mean North positive and Nn means North negative and so on. Panels (G,H) show the distribution of orography along the Italian peninsula.
From a general overview of the first six panels of both figures, it can be noticed that the range of elevation variability at which lightning occurs is different among the three zones. In Northern Italy, where mountains typically range between ~2000 and 3000 m, and the highest peaks are between ~4000 and 5000 m, a much higher seasonal variability of the lightning height of impact is evident with respect to South and Central Italy.
The main difference between the two periods regards the distribution of the elevation of winter CG strokes: a significant increase in the 50% and 90% percentiles is detected in 2020–2021 and is appreciable in all panels of Figure 9, except for panel B (positive events in North Italy) in which the behavior is similar to that of 2010–2011. Another interesting observation can be made by comparing the South Italy distributions in the two periods: a remarkably higher seasonal variability appears during 2020–2021. The observed differences in CG lightning elevation may reflect natural interannual variability in convective activity.
3.6. Monthly Variation in the Peak Current
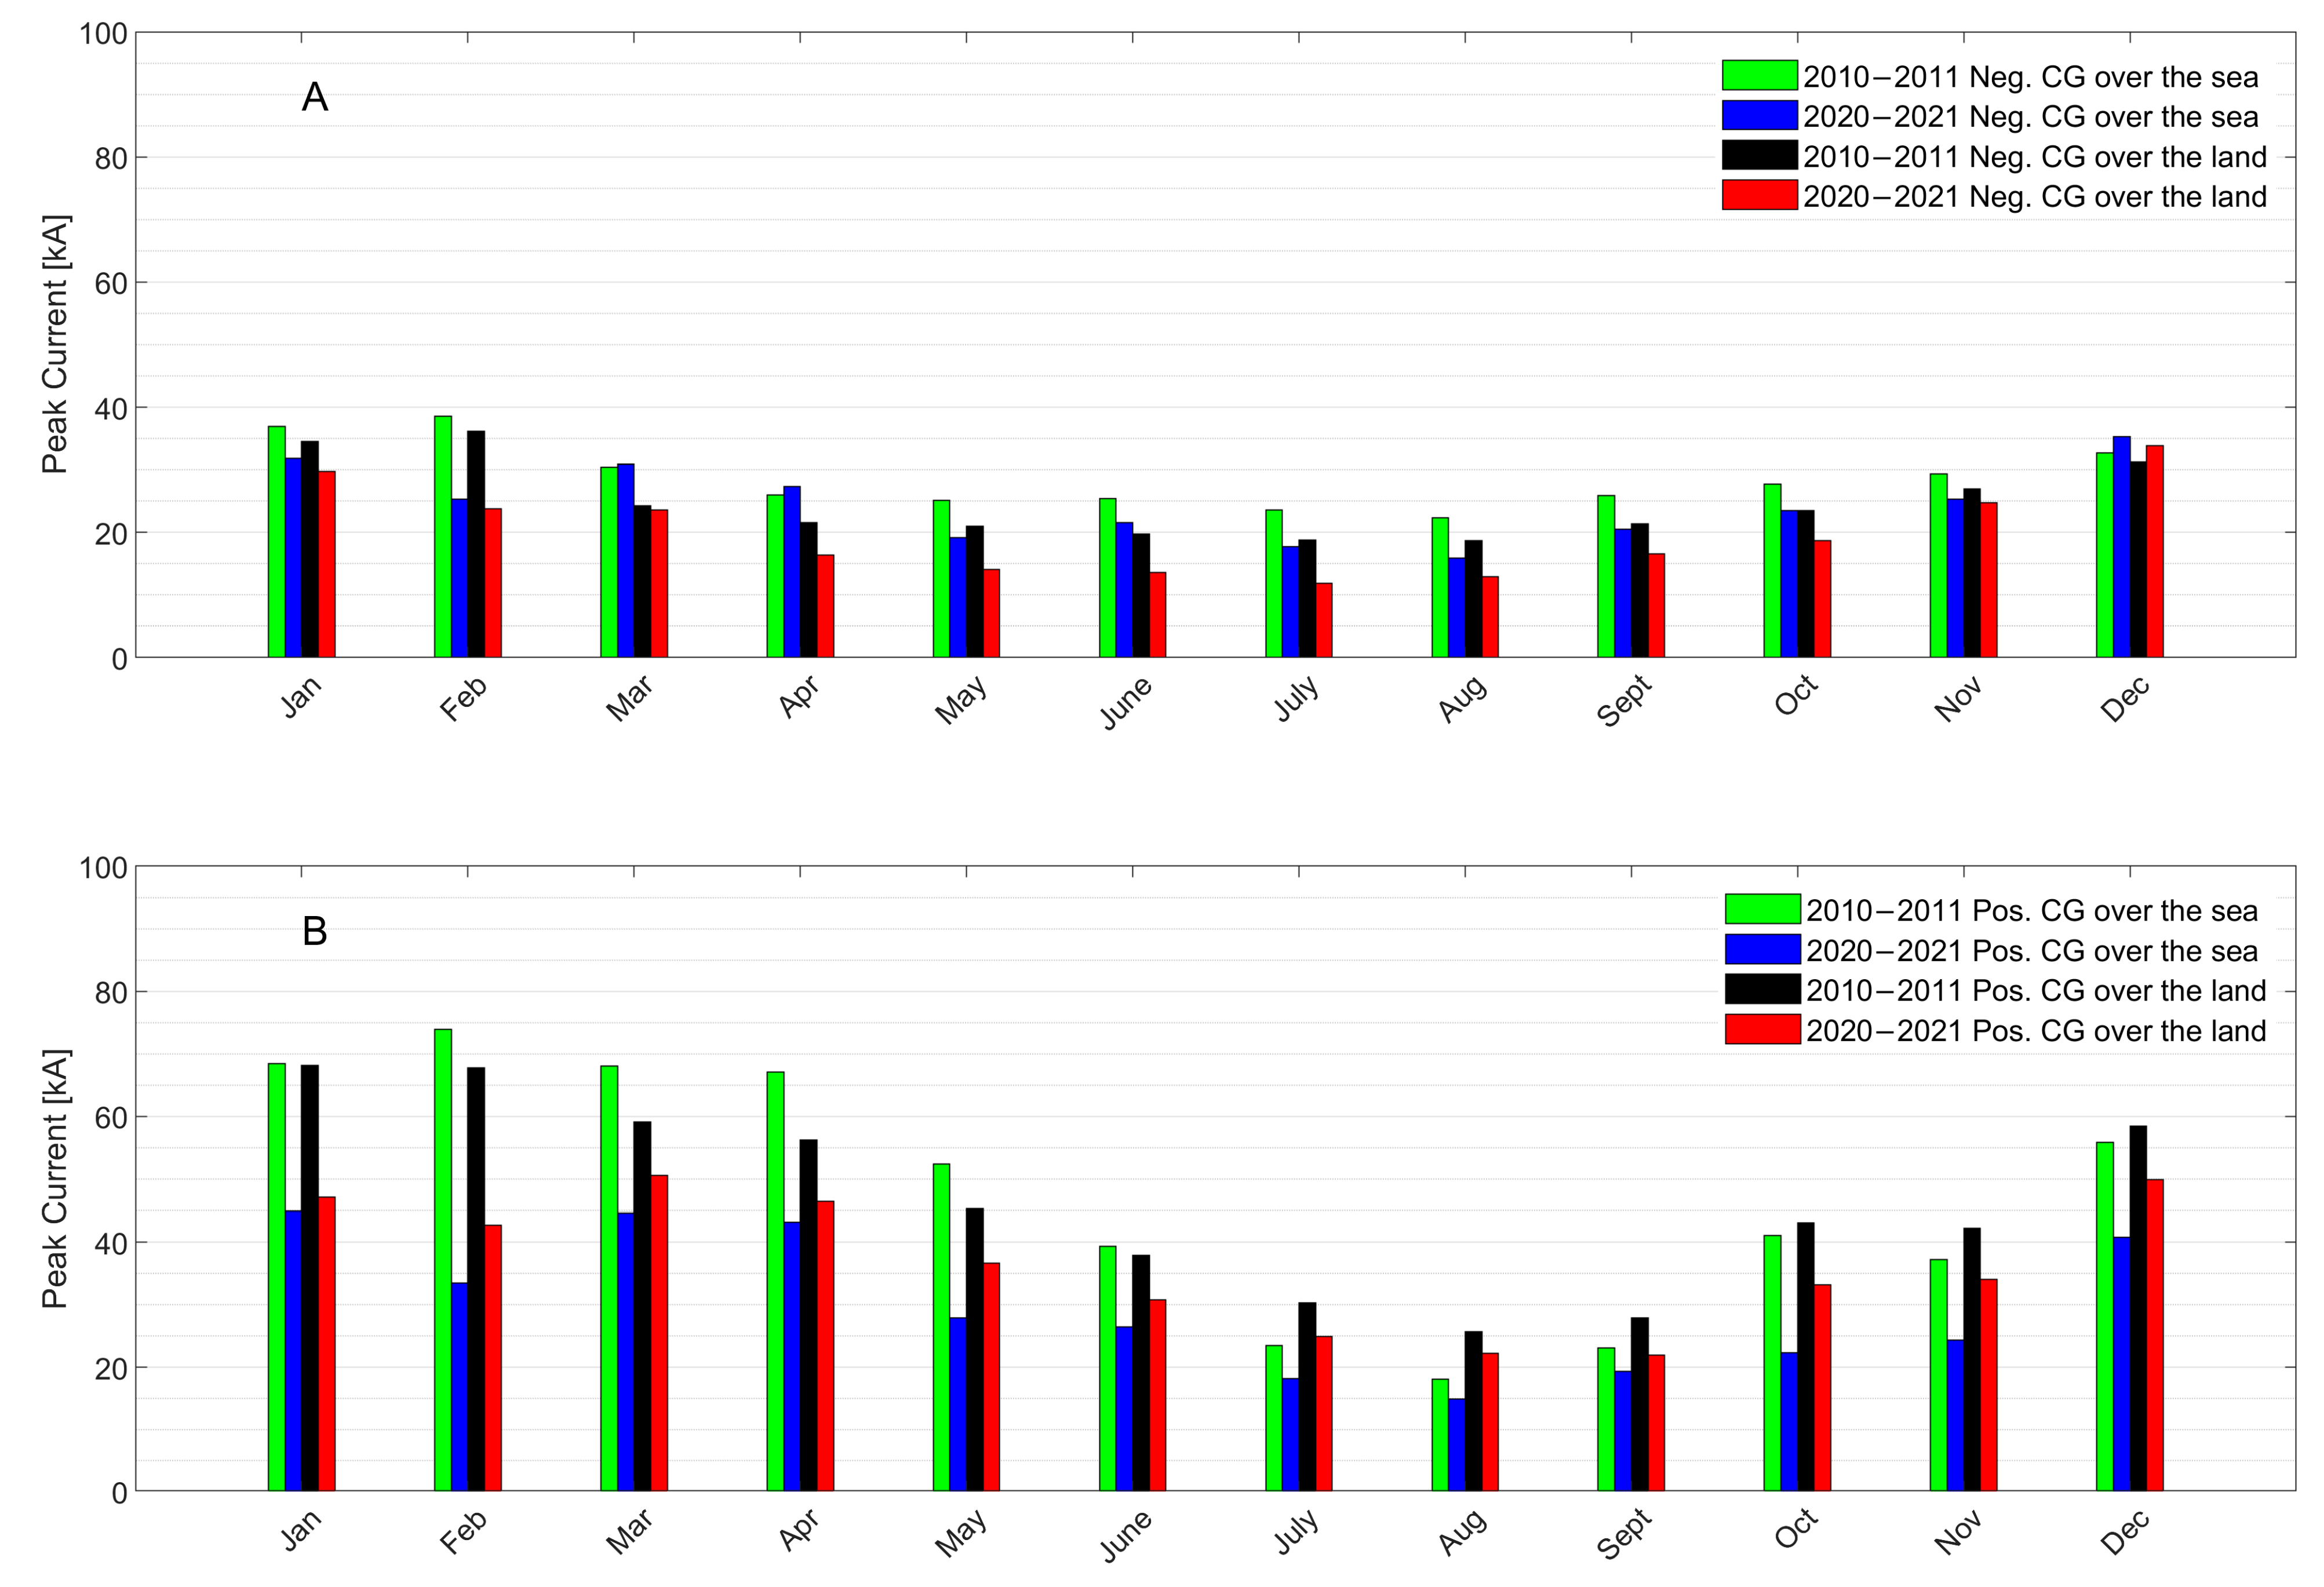
Figure 10 represents the monthly behavior of the peak current mean value in 2010–2011 and 2020–2021.

Figure 10.
Peak current monthly mean values for negative CG (panel A) and positive CG (panel B) strokes over the sea and the land over the 2010–2011 period. Comparison between the 2010–2011 and the 2020–2021 biennia.
It can be noticed that peak currents reached in 2020–2021 are quite similar to those of 2010–2011 in the case of negative strokes (panel A) and lower in the case of positive strokes (panel B). Nevertheless, the trend of the peak current is almost identical in the two periods. Indeed, the highest values are reached around February and March, i.e., between the end of winter and early spring, then a decrease until a minimum is reached in the middle of summer (July–August). Then the peak current mean value grows in the following months.
In both periods, the higher negative peak currents are always recorded over the sea. On the other hand, the positive ones are slightly different. In fact, in 2010–2011, values over the land are lower than those over the sea from January to June, and higher from July to December. In the biennium 2020–2021, the larger peak currents are always over the land.
A feature that needs to be highlighted is the inverse correlation of the peak current with the monthly GSD. It can be noticed that towards the end of spring and during the summer, the GSD tends to increase, whereas the peak current decreases, thus the highest current values are during periods of less lightning activity.
3.7. Distribution of Flash Multiplicity and of the Distance Between the Stroke Points of Impact Within a Flash
This subsection addresses the Probability Density Function (PDF) of flash multiplicity, defined as the number of strokes composing a single CG flash [], as well as the PDF describing the separation between the ground contact point of subsequent strokes and that of the first stroke within the same flash, as derived exclusively from the lightning location system (LLS).
Naturally, both parameters are influenced by the clustering criteria adopted in the LLS algorithms, specifically the selection of the spatial radius and the temporal window used to associate individual strokes into a single flash []. In the case of the SIRF network, one or more strokes are grouped into a flash when they occur within a 10 km radius and within 1 s from the first event, with a maximum interstroke interval of 500 ms. Additionally, until 2016, a limit of 15 strokes per flash was imposed.
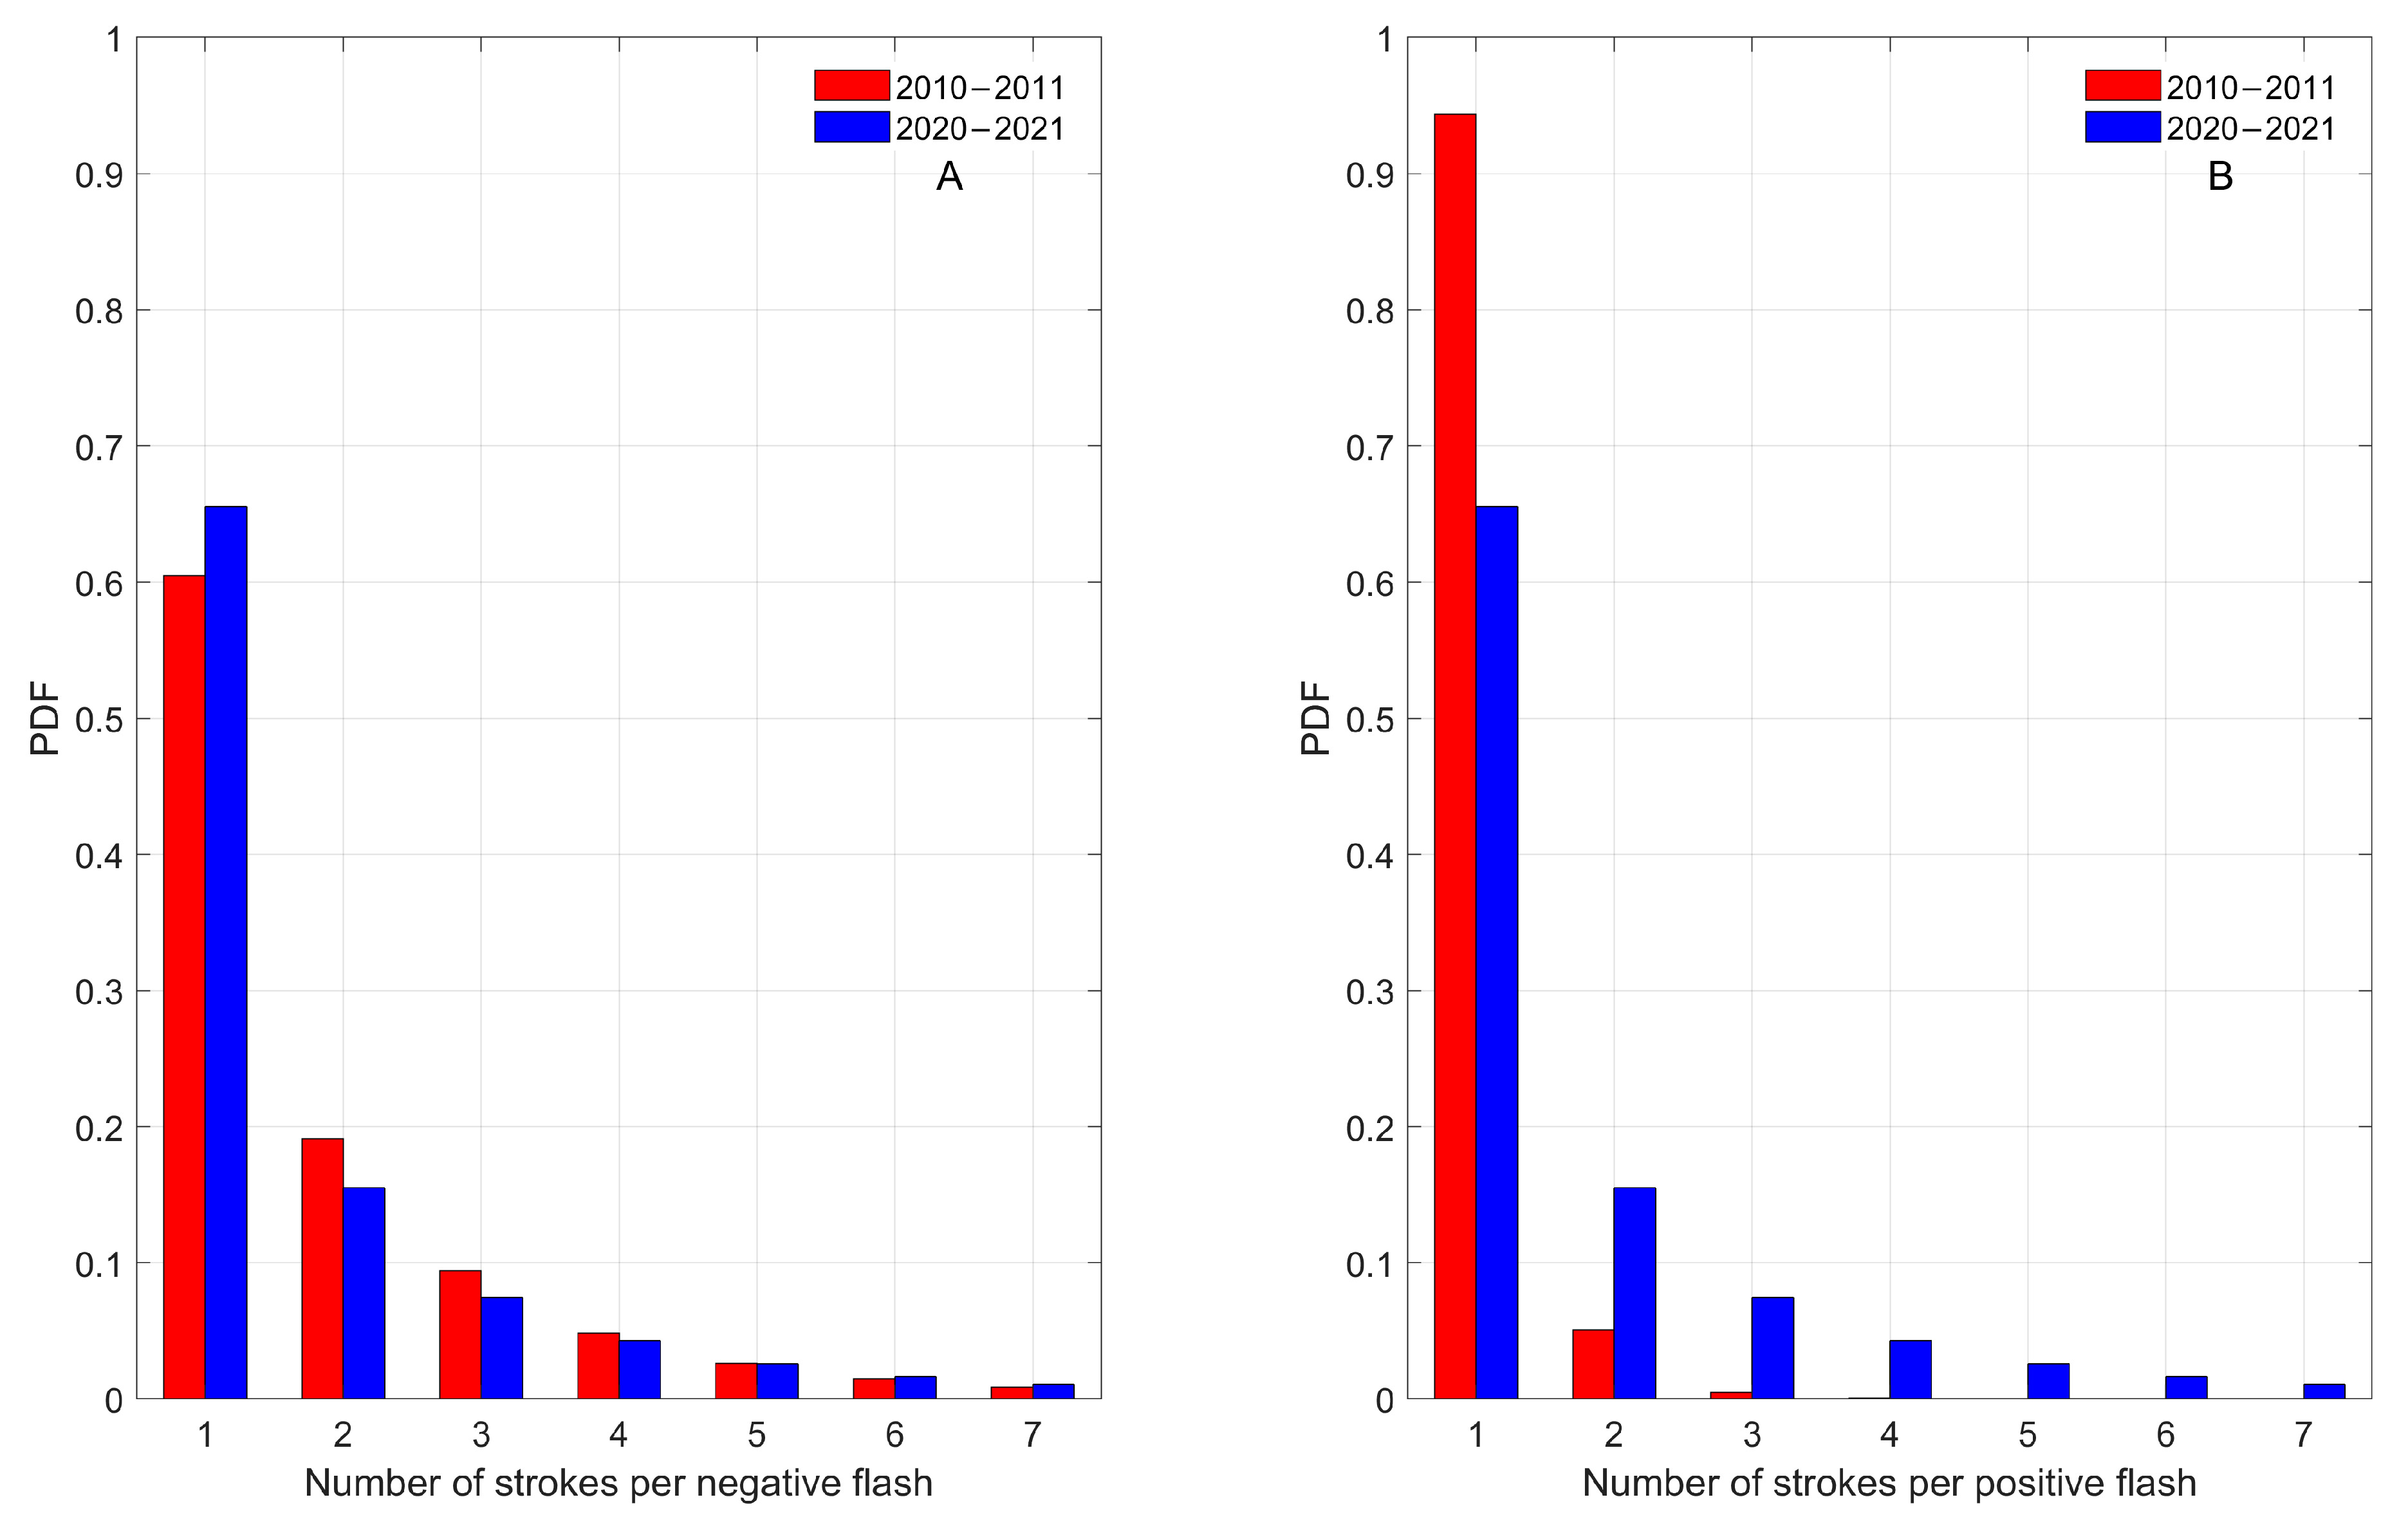
Figure 11 represents the distribution of flash multiplicity for negative (A) and positive (B) flashes in 2010–2011 and 2020–2021.

Figure 11.
Multiplicity PDF for negative (A) and positive (B) flashes. Comparison between the 2010–2011 and the 2020–2021 biennia.
In 2010–2011, the mean negative flash multiplicity is 1.85, while the positive one is 1.06. Thus, the value of the mean positive flash multiplicity is significantly lower than the corresponding negative one; this observation is consistent with the established literature, which indicates that the flash multiplicity of positive flashes is typically slightly higher than 1 []. The obtained results are in agreement with other authors (e.g., []), finding a mean multiplicity for negative CG flashes of 2.1 for the EUCLID network. However, the reported mean negative flash multiplicity is lower with respect to values found in ground truth data [,,,].
In the two-year 2020–2021, the mean negative flash multiplicity is 1.85 and the positive flash multiplicity is 1.07. Hence, it can be noticed that no significant differences in flash multiplicity have been detected with respect to the 2010–2011 period, for both negative and positive events.
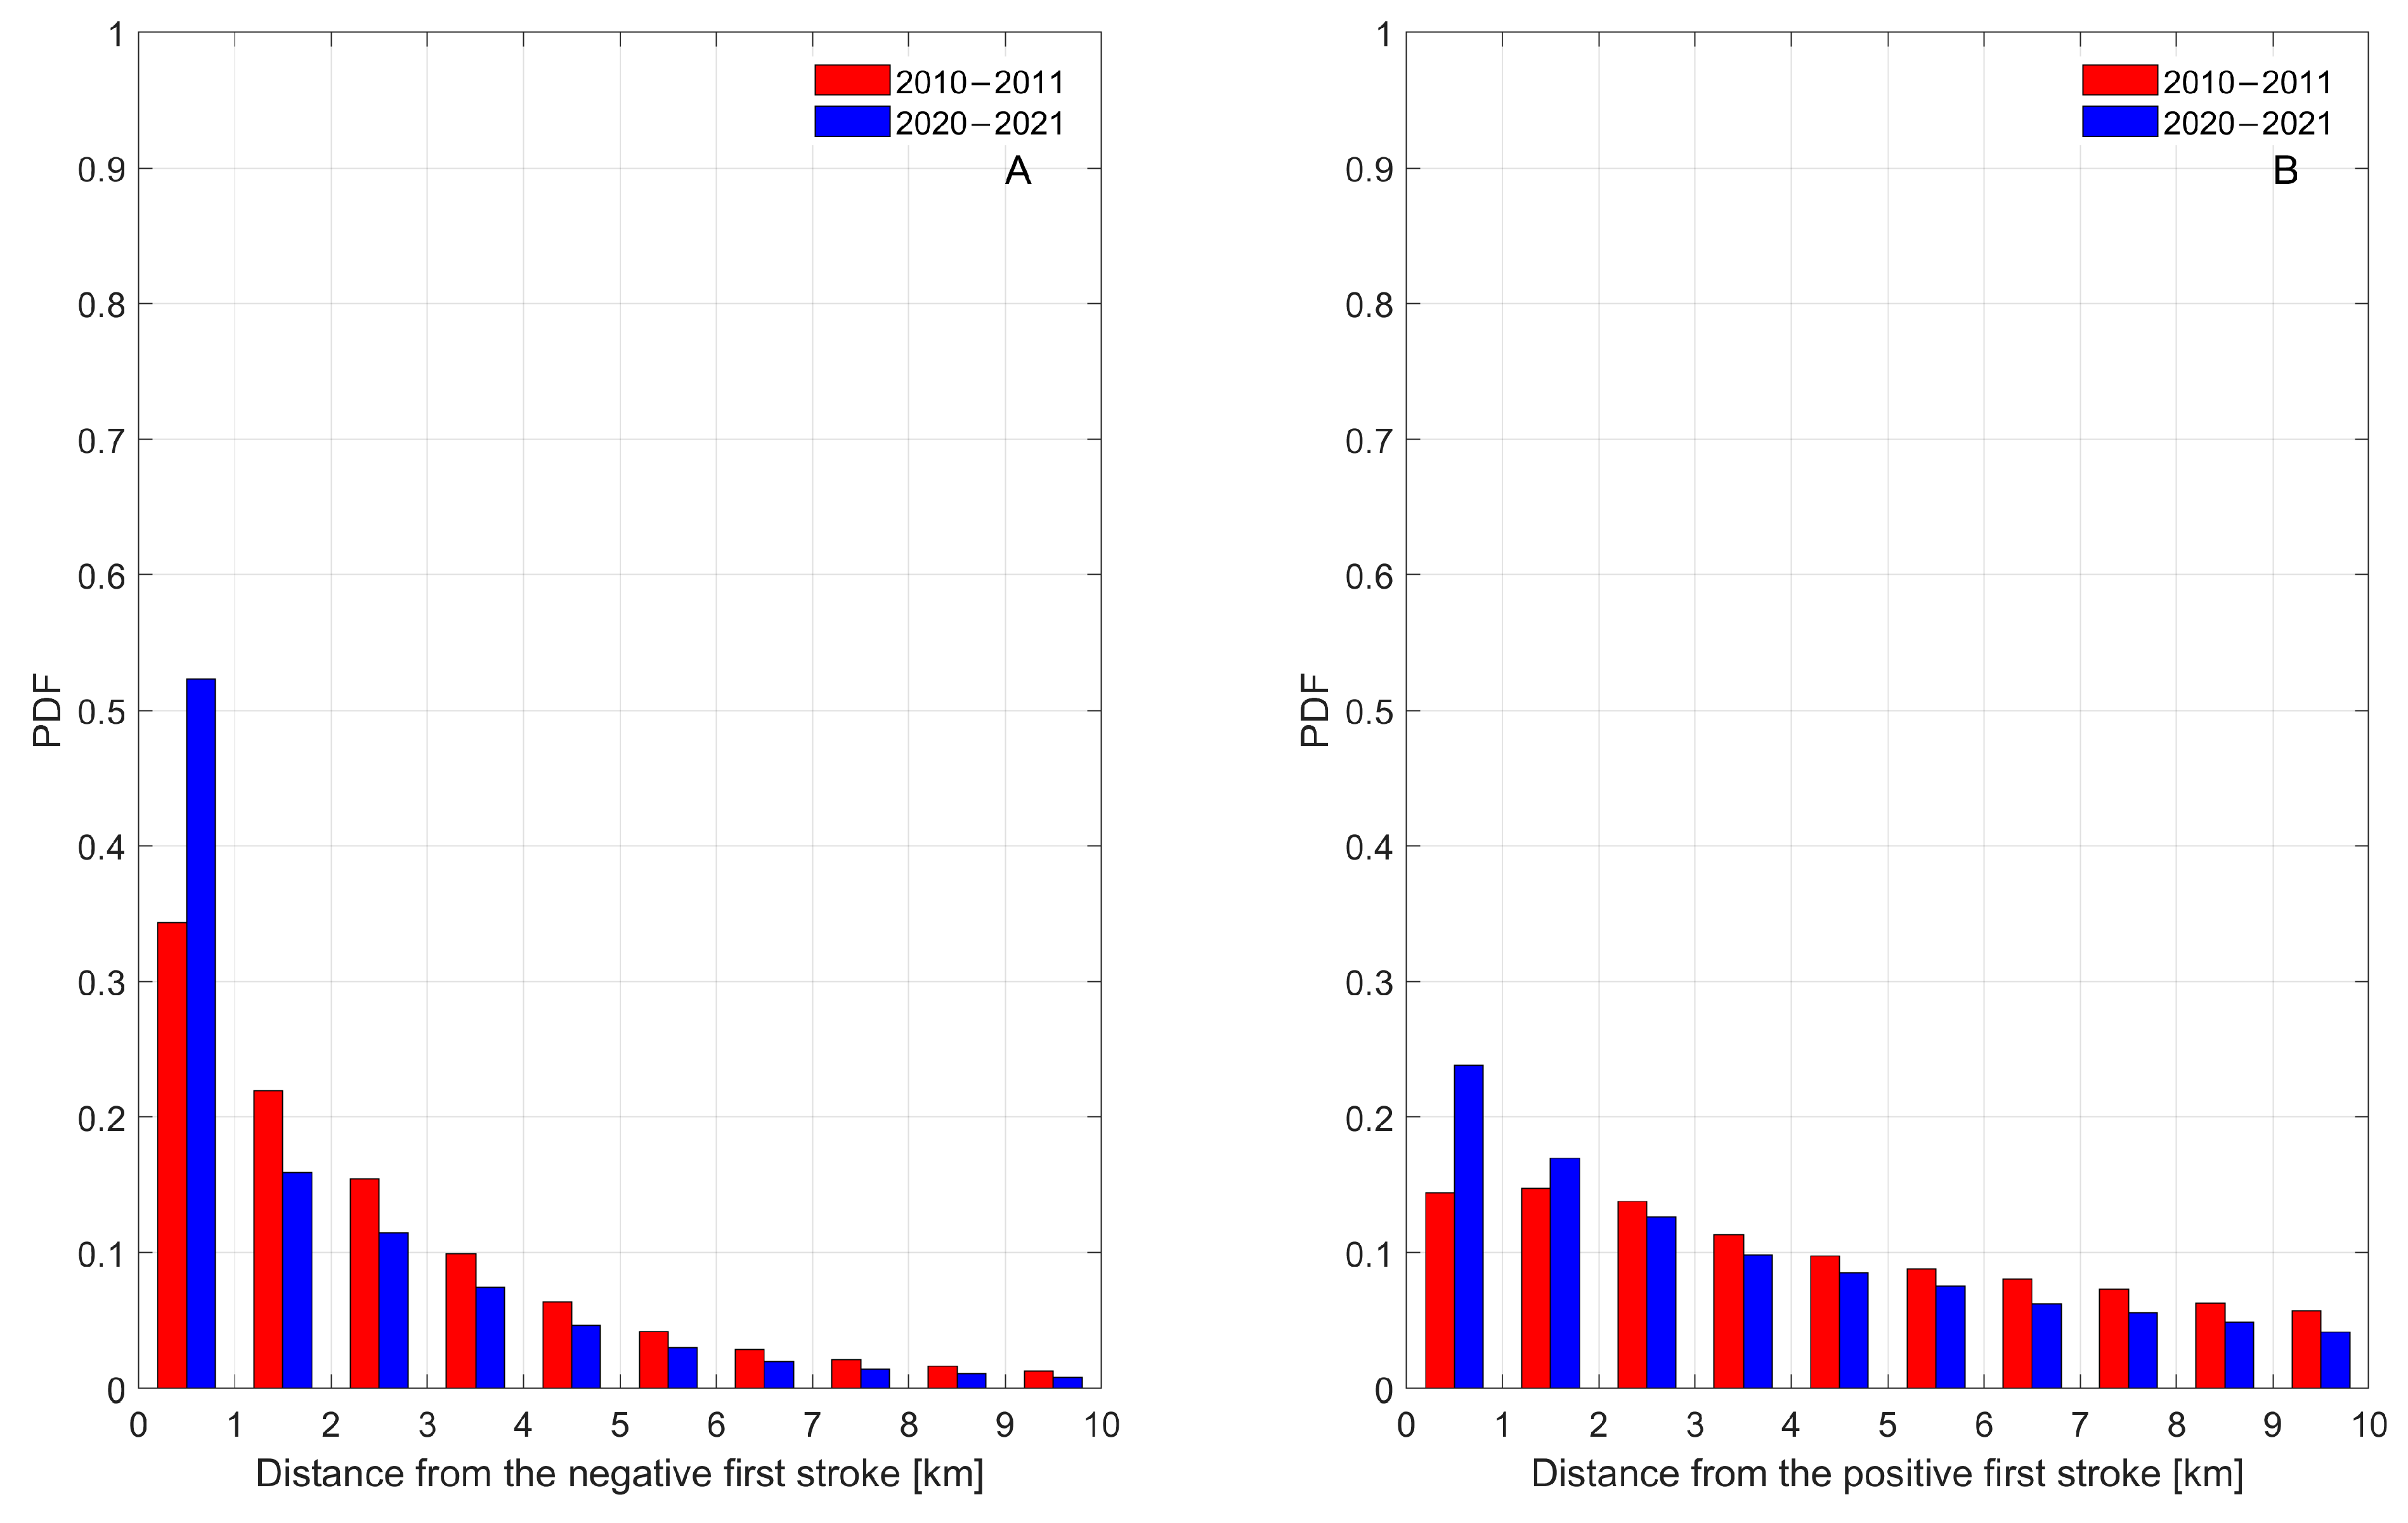
Figure 12 represents the PDF of the distance between the stroke points of impact within a negative (A) or positive (B) flash as calculated by LLS over 2010–2011 and the 2020–2021, respectively. Analyzing the case of subsequent negative strokes, it can be observed that the trend is quite similar in both periods, but those of 2020–2021 are more concentrated around the first stroke impact point than those of 2010–2011. On the other hand, the subsequent positive strokes show different trends in the two periods. In 2020–2021, they are mainly concentrated around the first stroke impact point (even though with lower extent with respect to negative strokes), whereas in 2010–2011, the distribution of their distance from the corresponding first stroke is more uniform. This effect could be due to a different approach in the grouping algorithm set by METEROAGE.

Figure 12.
PDF of the distance between the stroke points of impact within a negative (A) or positive (B) flash as calculated by LLS. Comparison between the 2010–2011 and the 2020–2021 biennia.
3.8. Distribution of the Peak Current for Positive First Strokes, Negative First Strokes, and Negative Subsequent Strokes
Understanding the distribution of lightning peak currents is essential for assessing the lightning performance of transmission and distribution lines, namely the expected yearly number of flashes that generate overvoltages exceeding a prescribed limit []. Classical reference values originate from the pioneering measurements conducted by Karl Berger and collaborators [,,,] at the summit of Monte San Salvatore in Lugano, Switzerland. This site is located at an altitude of 915 m a.s.l., rising approximately 640 m above Lake Lugano. Following measurements performed in various geographic regions [,,,], together with triggered-lightning experiments [], demonstrated substantial variability in peak current distributions, a variability largely attributable to the differing characteristics of the measurement environments. These observations highlight the necessity of acquiring reliable region-specific datasets.
The present analysis therefore examines the distributions of peak current separately for positive first strokes, negative first strokes, and negative subsequent strokes. It must be emphasized, however, that the values under consideration are inferred rather than directly measured. In typical LLSs, the peak current is estimated from the maximum amplitude of the electric field recorded by the sensors, after applying corrections for propagation attenuation and assuming the Transmission Line model for current propagation along the return-stroke channel [,], together with a prescribed return-stroke velocity.
A number of studies have investigated the accuracy of this inference method [,,,,], providing reasonable estimates of the associated uncertainties. In this subsection, the results obtained from the present analysis are compared both with other outputs derived from LLS data and with direct current measurements available in the literature.
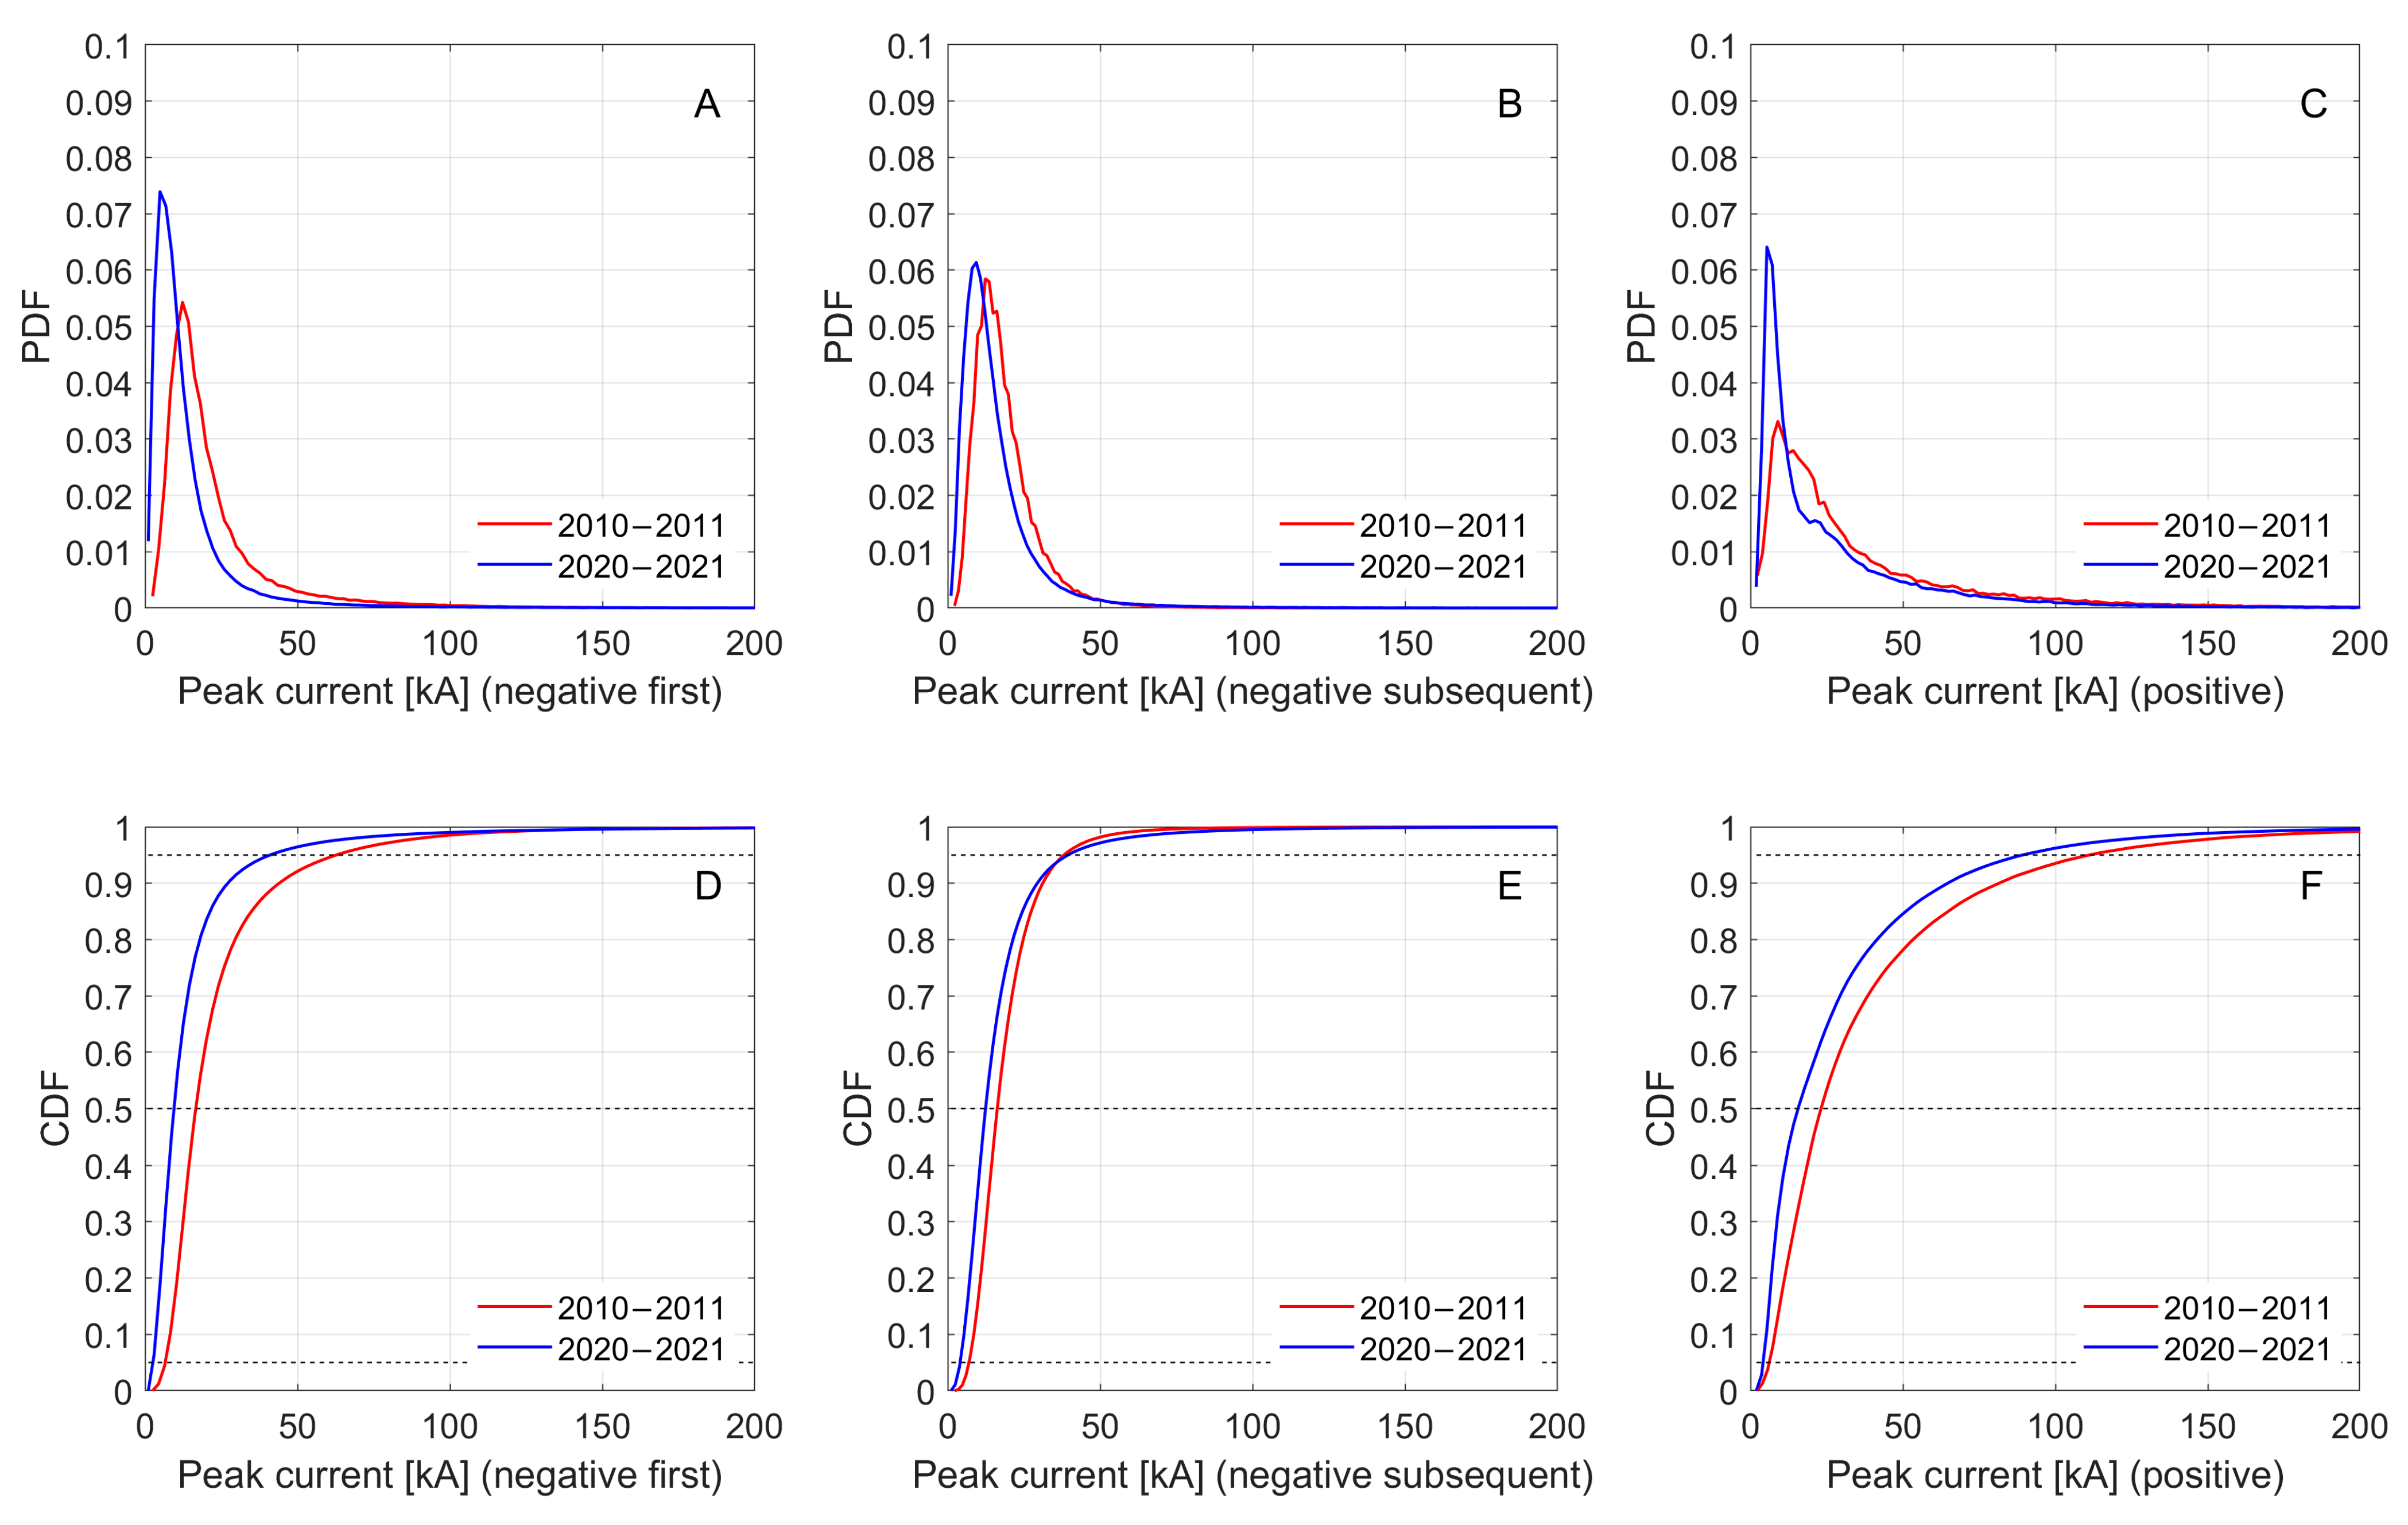
Figure 13 reports the Probability Density Function (PDF) of peak current for negative first strokes (A), negative subsequent strokes (B), and positive first strokes (C), and the Cumulative Distribution Function (CDF) of peak current for negative first strokes (D), negative subsequent strokes (E), and positive first strokes (F) over 2010–2011 and 2020–2021. The three lines appearing in the CDF plots indicate the values of current corresponding to the 5%, 50%, and 95% percentiles of the distribution, respectively.

Figure 13.
PDF of peak current for negative first strokes (A), negative subsequent strokes (B) and positive first strokes (C), and CDF of peak current for negative first strokes (D), negative subsequent strokes (E), and positive first strokes (F). Comparison between the 2010–2011 and the 2020–2021 biennia.
In the literature, the most widespread and acknowledged reference for lightning current data consists of the direct tower measurement campaign on Monte San Salvatore (Switzerland) [,,,]. From such measurements, the median peak current values for negative first strokes, negative subsequent strokes, and positive strokes are 30 kA, 12 kA, and 35 kA, respectively. Therefore, from Table 2 and Table 3, one can conclude that in both periods, the median values for negative and positive first strokes are lower with respect to the measurements obtained by Berger and his co-workers, even though the median current values in 2010–2011 are much closer to the ground truth data than those of 2020–2021. On the other hand, in both periods, the median value of negative subsequent stroke peak current is higher than that of Monte San Salvatore. It is worth noting that in both periods, the distributions of negative first and subsequent strokes are quite similar, and this is clearly different from what Berger recorded.

Table 2.
Peak current [kA] percentiles (5%, 50%, and 95%) in Italy over the 2010–2011 period.

Table 3.
Peak current [kA] percentiles (5%, 50%, and 95%) in Italy over the 2020–2021 period.
According to [], the EUCLID network estimates a median current of approximately 10 kA for negative first strokes in Austria. As extensively discussed in previous studies [,], measurements obtained from towers are subject to a systematic bias: they preferentially register discharges characterized by higher peak currents and tend to record predominantly upward lightning events. The authors of [] provided a comprehensive examination of the underlying causes for the discrepancies observed between current values inferred by tower-based measurements and those derived from LLS observations.
4. Correlation of Lightning Occurrence with Land and Sea Surface Temperatures
Lightning activity has been increasingly investigated as a potential marker of climate and global change, given its sensitivity to atmospheric thermodynamics and composition [,,,,]. Warmer temperatures enhance the availability of CAPE, leading to more frequent and intense thunderstorms, which in turn can increase lightning occurrence. Therefore, in this contribution, a correlation analysis between lightning occurrence and land and sea surface temperatures is proposed. Correlation is calculated by means of the Spearman rank correlation coefficient [], which is appropriate when the relationship between two variables is not necessarily linear but is monotonic, meaning one variable consistently increases or decreases as the other does, but not necessarily at a constant rate. Spearman’s rank correlation coefficient () between two variables and is calculated using the following formula:
where and are the ranks of the observations, and are their mean values, and is the number of data points. This coefficient measures the strength and direction of the monotonic relationship between two variables. The value of ranges from to , where indicates a perfect positive monotonic relationship, indicates a perfect negative monotonic relationship, and indicates no monotonic relationship.
The temperature data used in this study include surface temperatures over land and sea with a spatial resolution of 0.05° and a temporal resolution of 1 h. Land surface temperature (LST) was obtained from the MLST-AS dataset, which merges the MLST product—based on clear-sky infrared observations from the SEVIRI sensor aboard the Meteosat Second Generation (MSG) satellites—with LST estimates under cloud cover derived from an Energy Balance Model. The MSG series, operated by EUMETSAT, consists of geostationary satellites designed for continuous monitoring of atmospheric and surface conditions, providing high-frequency observations critical for weather forecasting and climate studies. Sea surface temperature (SST) data were provided by the Ocean and Sea Ice Satellite Application Facility (OSI SAF) of EUMETSAT, which develops and distributes operational and climatological datasets related to key ocean–atmosphere interface parameters, including sea surface temperature (SST).
The dependence of the lightning–temperature correlation on timescale, spatial aggregation, and data resolution (both in time and in space) is assessed on both the 2010–2011 biennium and the 2020–2021 biennium.
The Spearman correlation coefficient between CG lightning occurrence and LST/SST is calculated as follows. Hourly temperatures are aggregated into daily average values. Considering the spatial resolution of temperature data, the daily number of CG strokes for each cell of the considered domain (Figure 1) is calculated and labeled as . The length of is (), i.e., the number of days in the 2010–2011 (2020–2021) biennium. is correlated with , which is a temperature variable taking into account cumulated effects and different scales both in time and space. is reference value for the -cell calculated from the original LST/SST data samples as a function of the spatial window extension and the time delay as
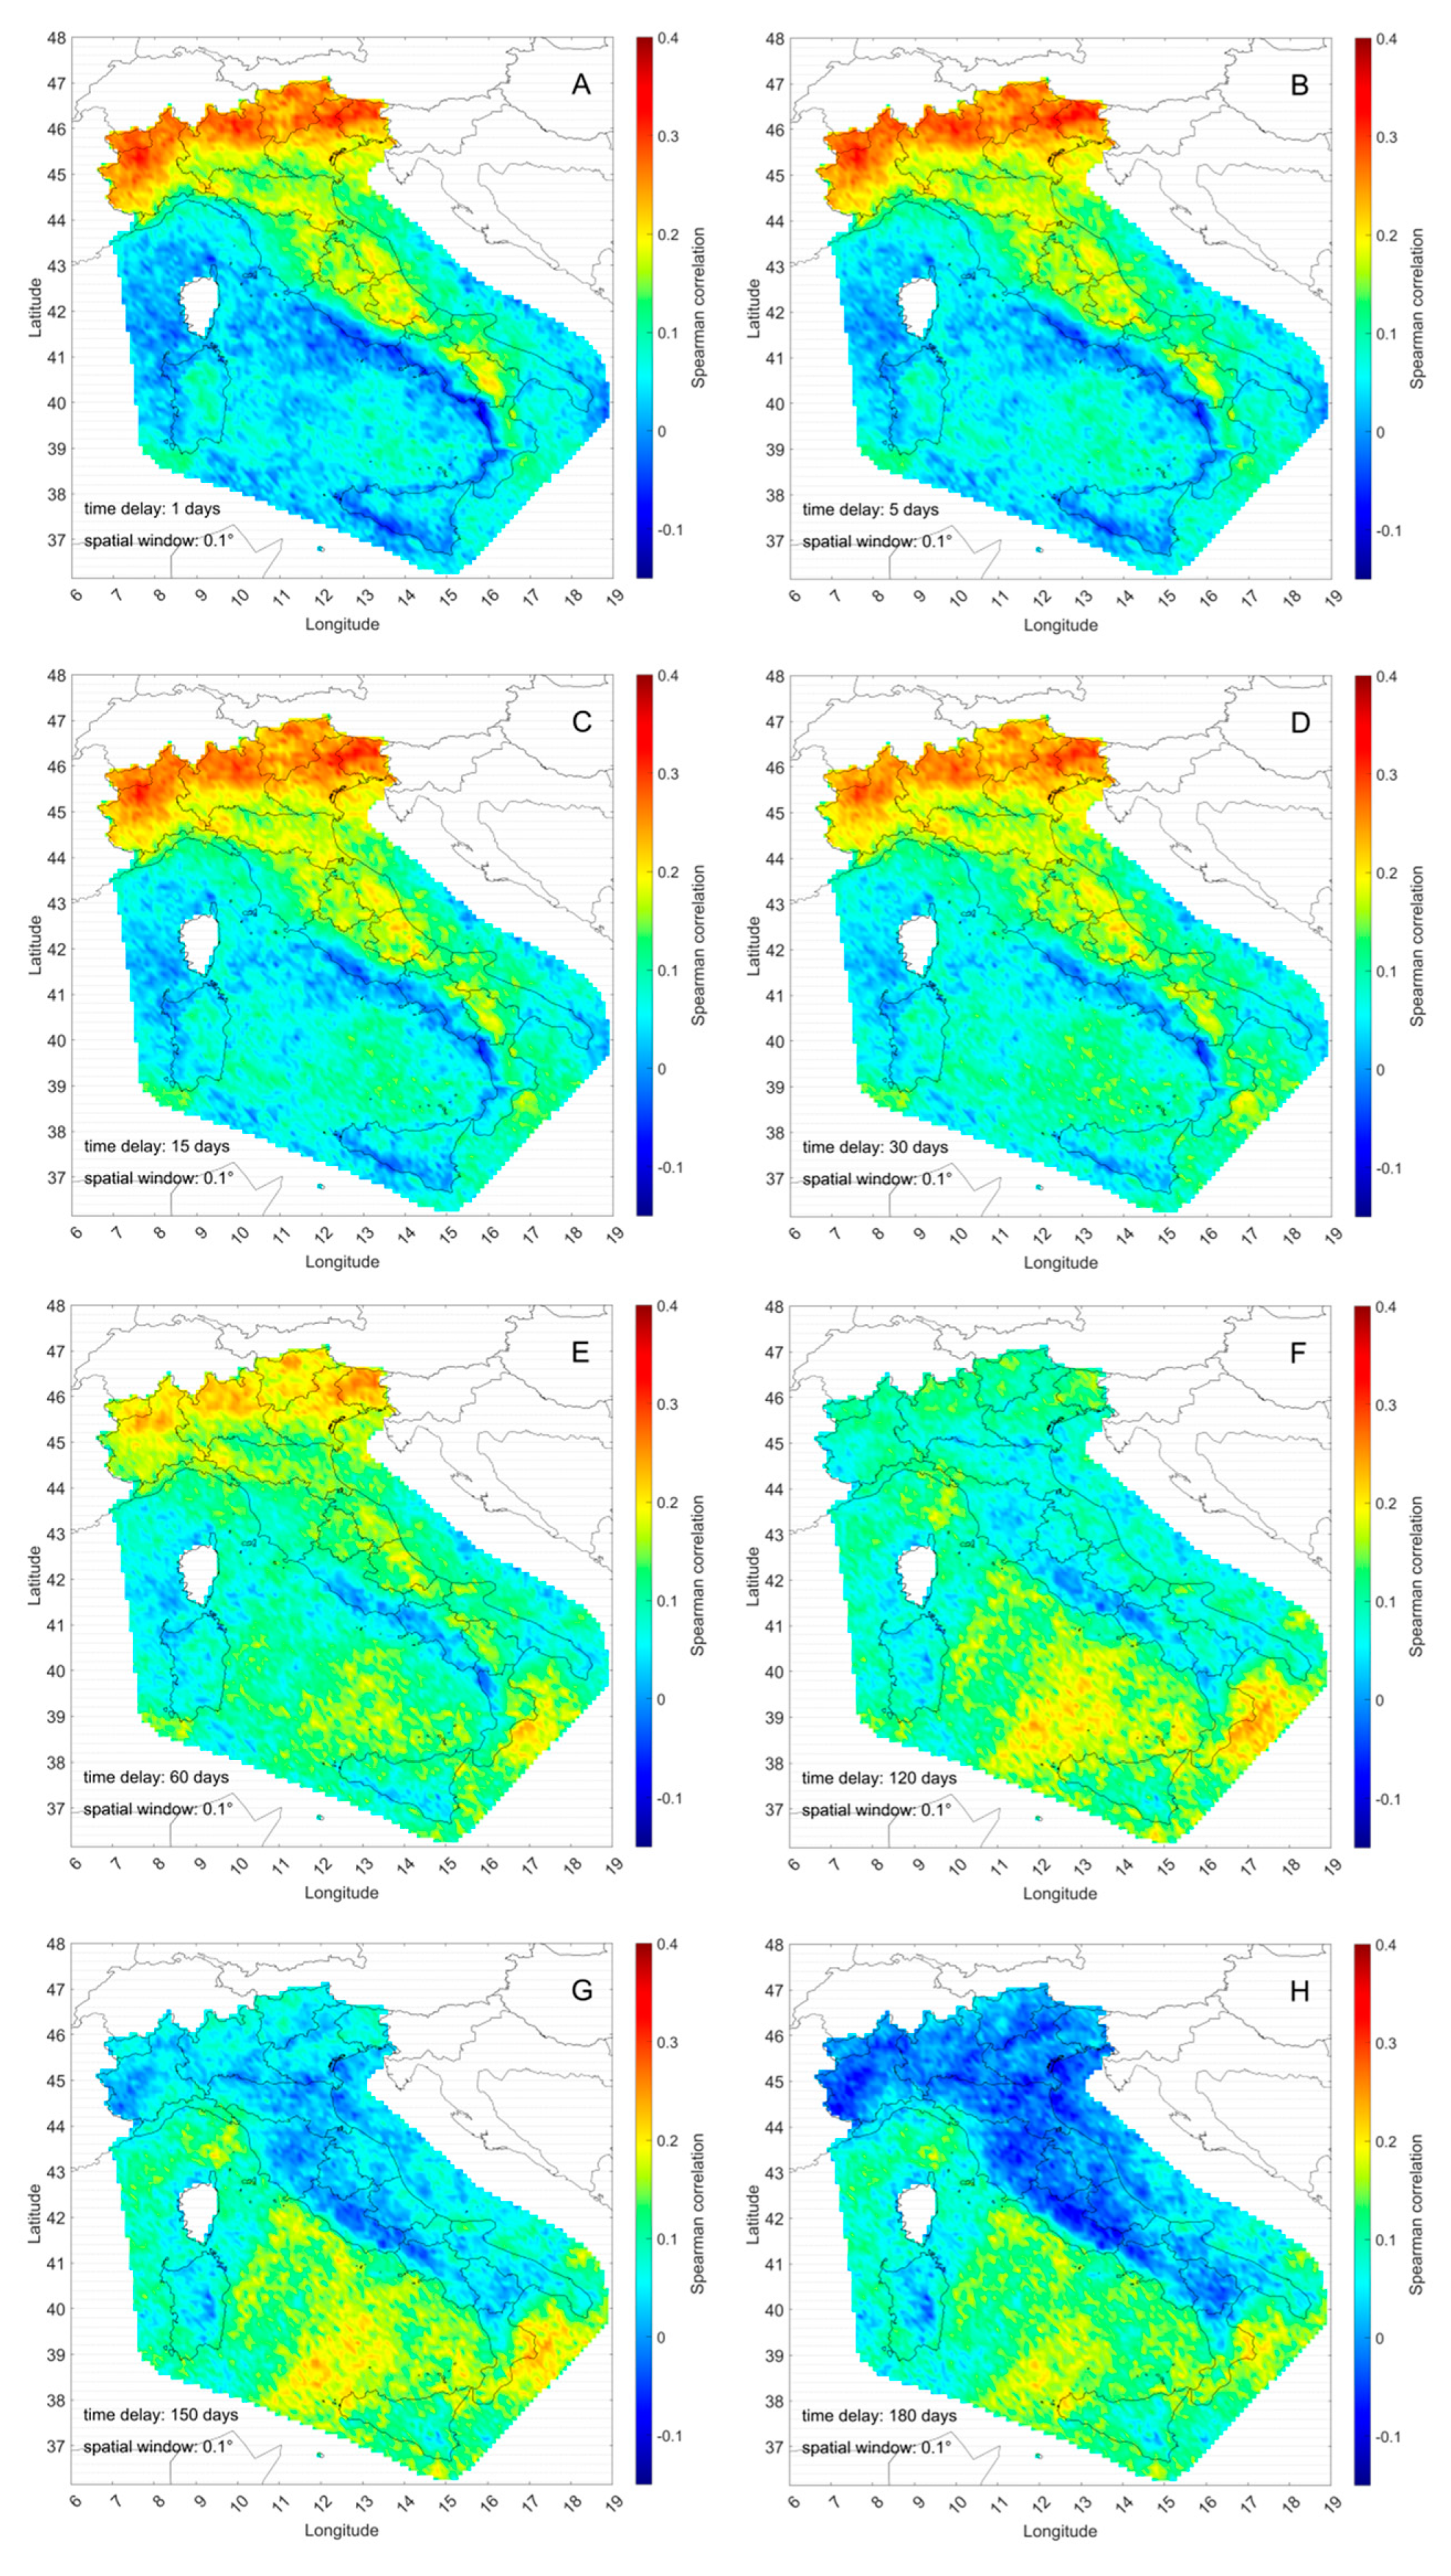
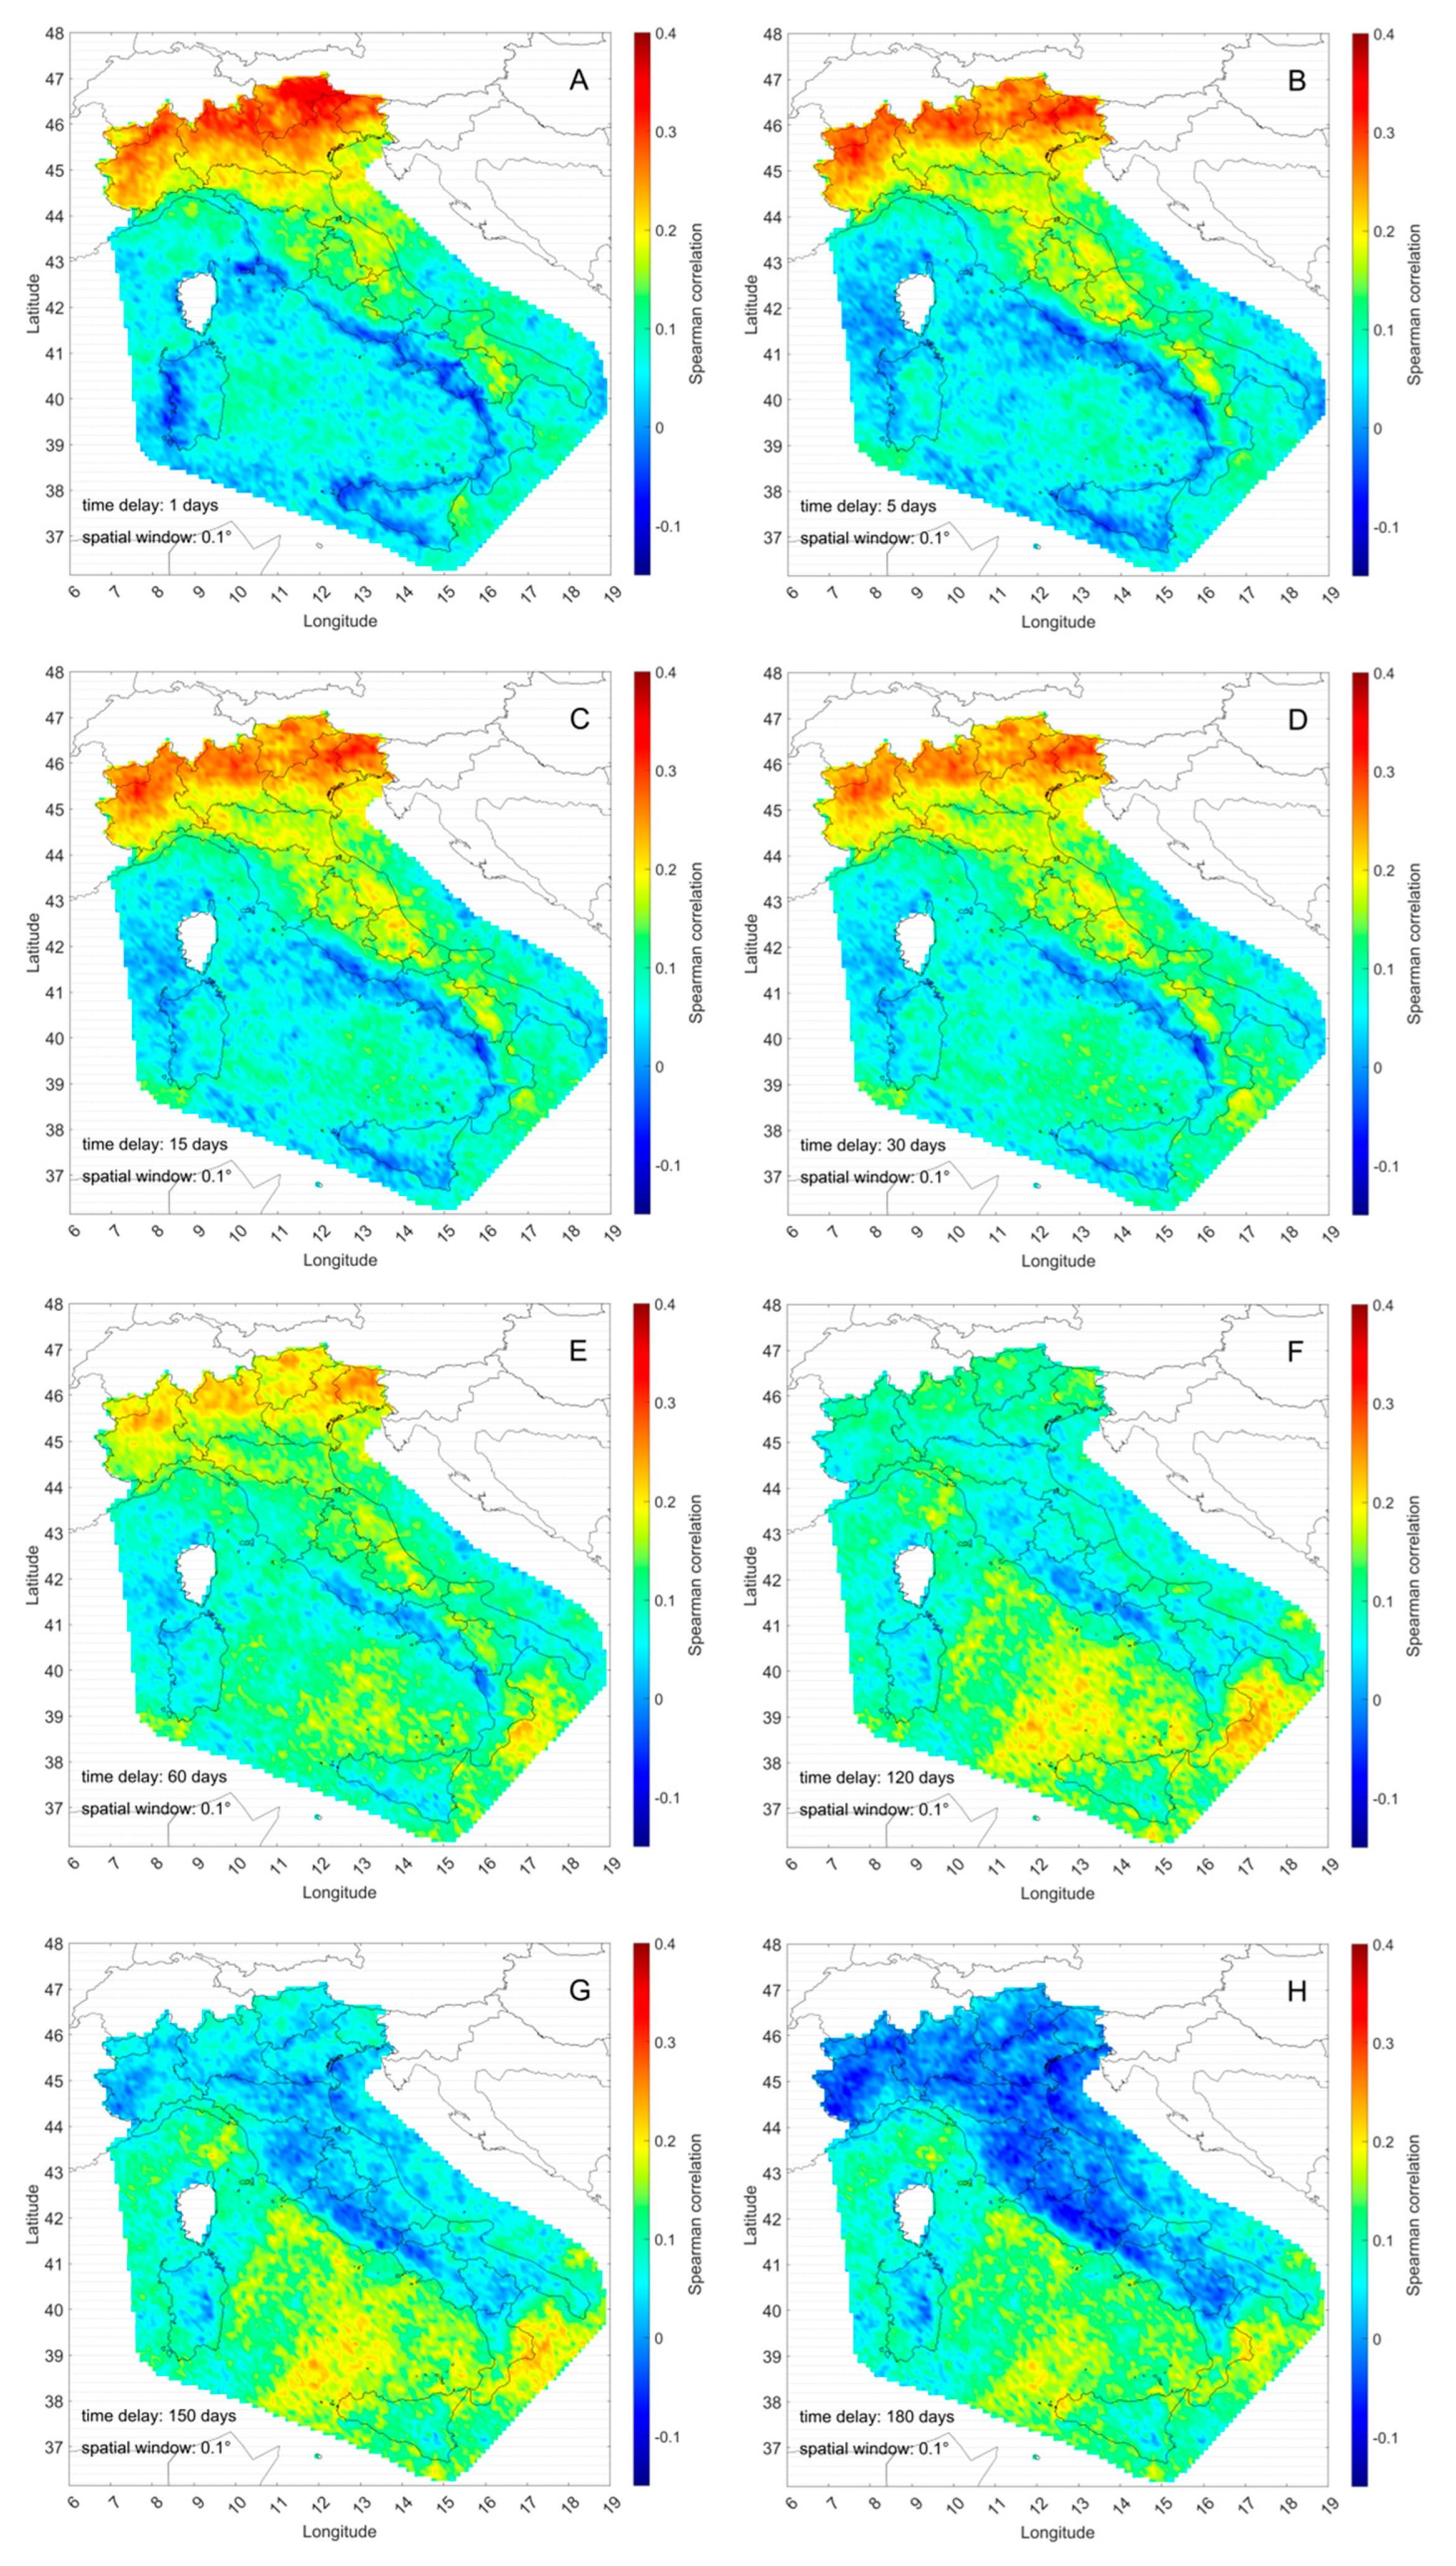
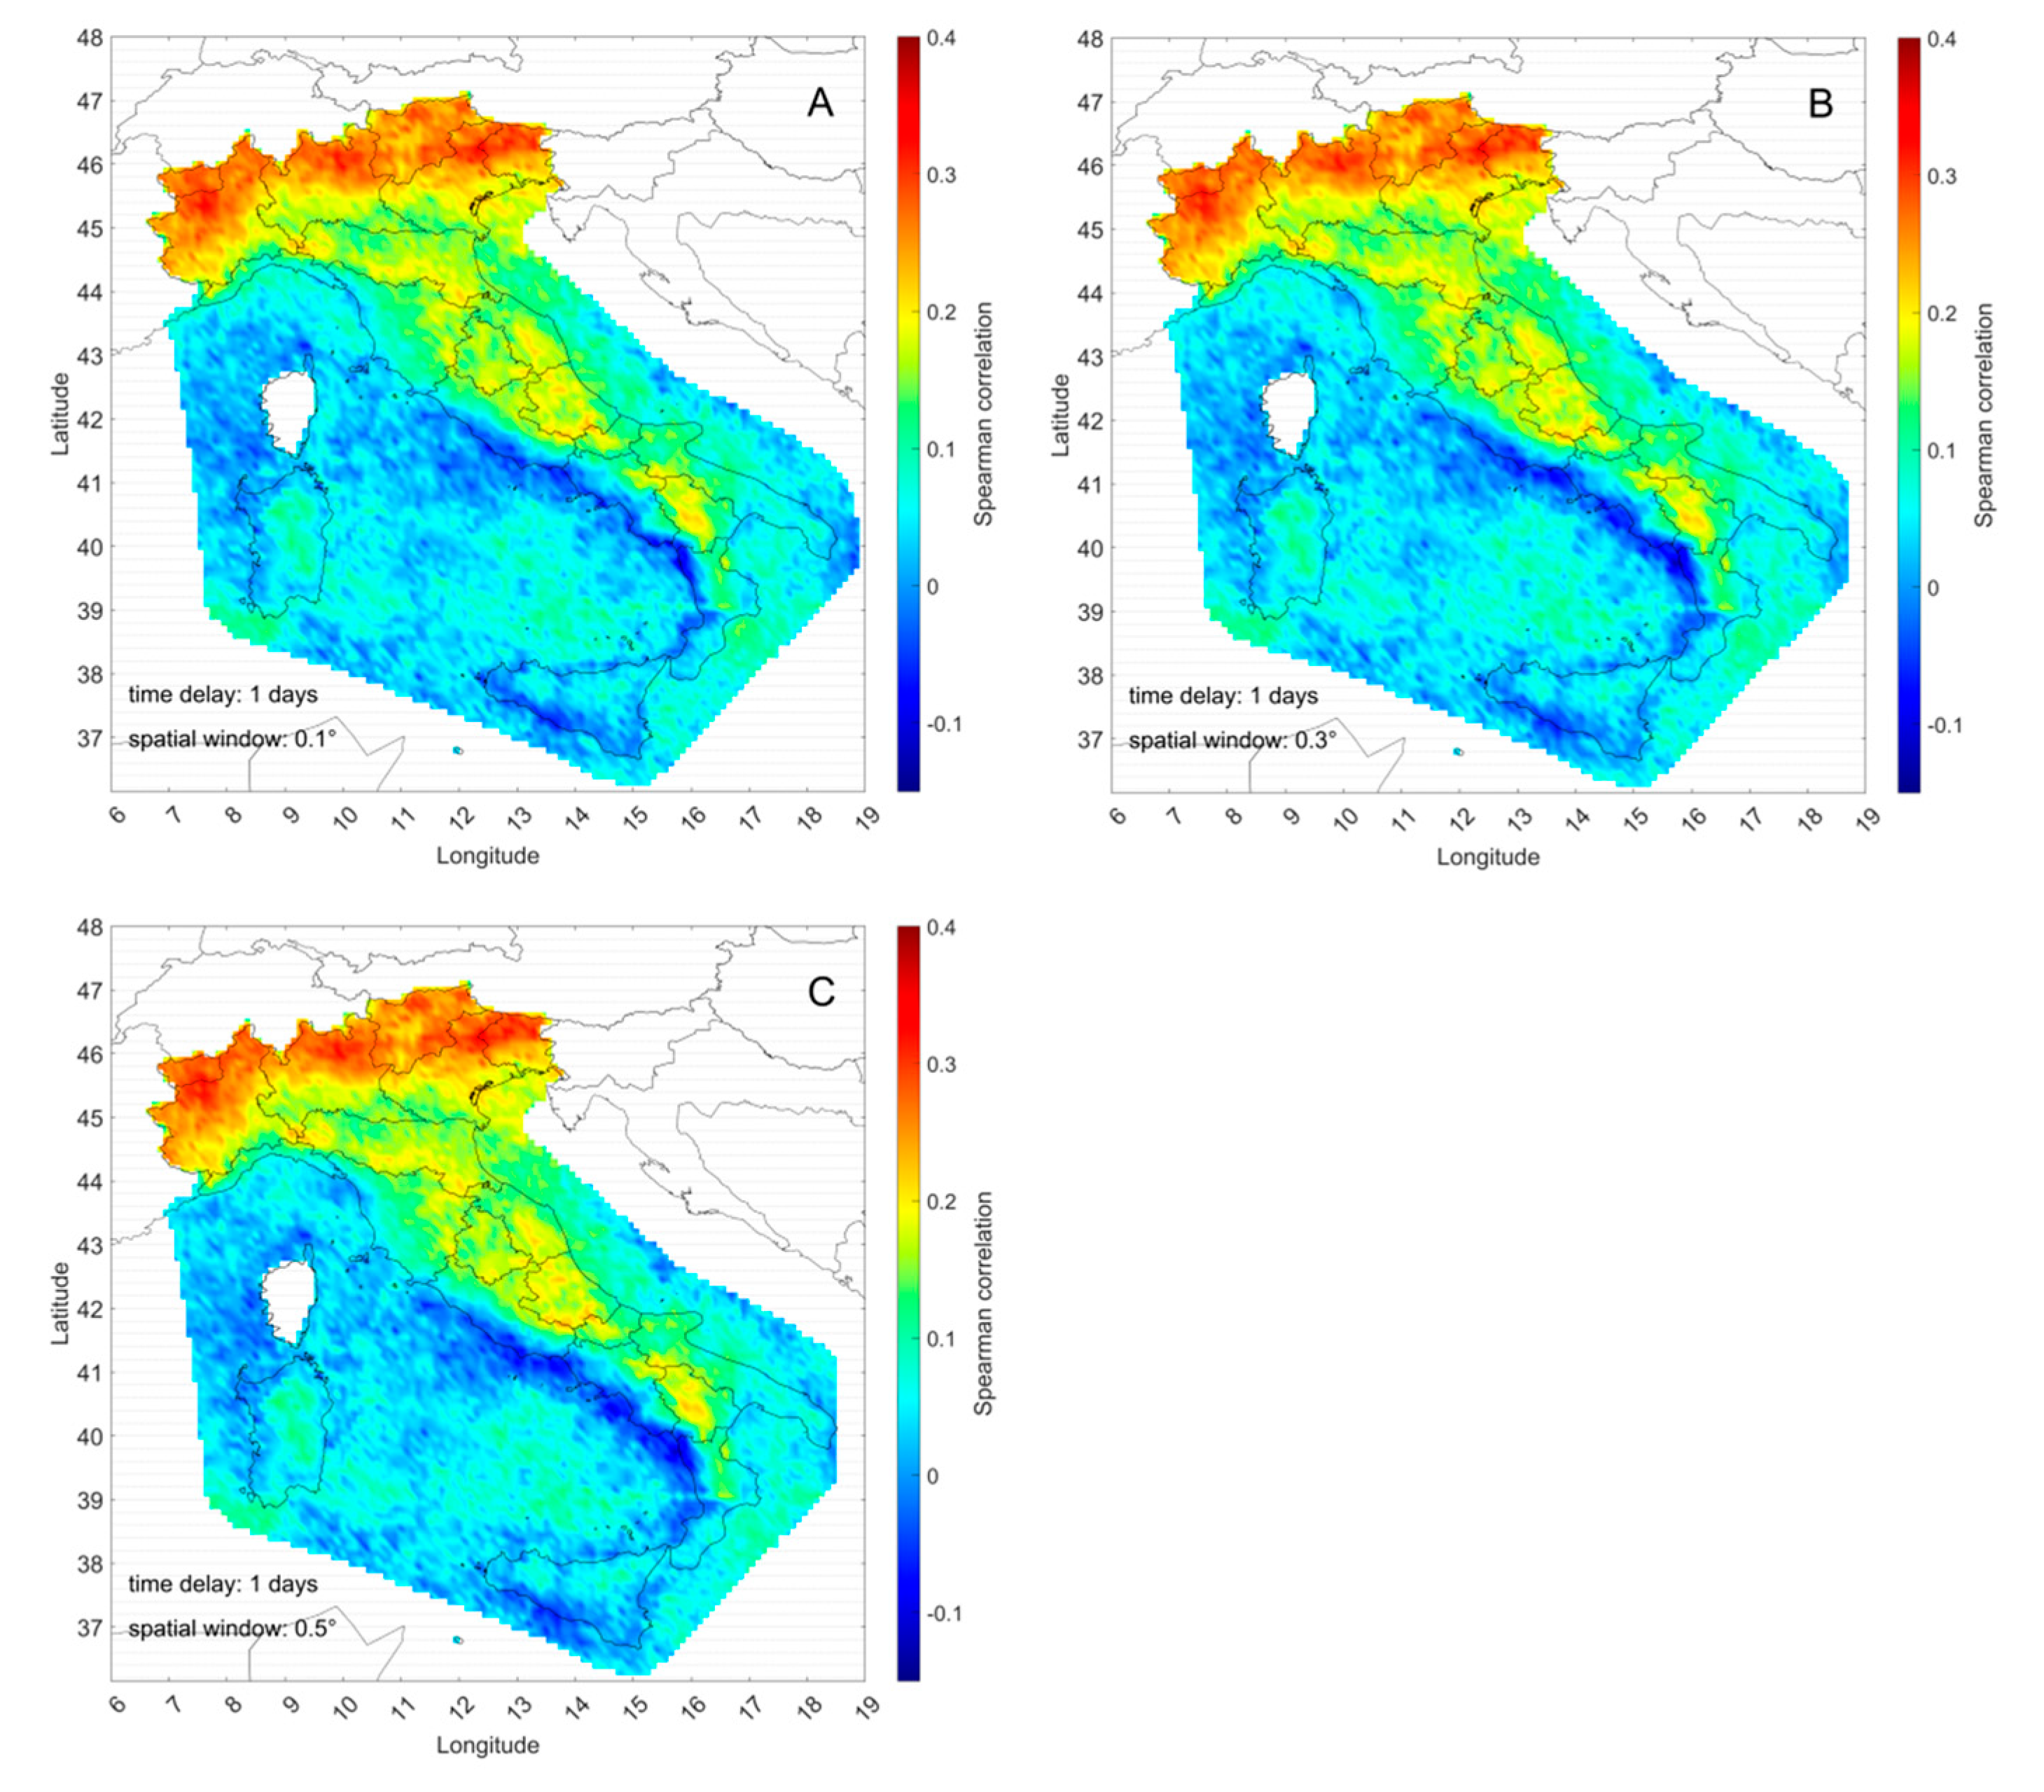
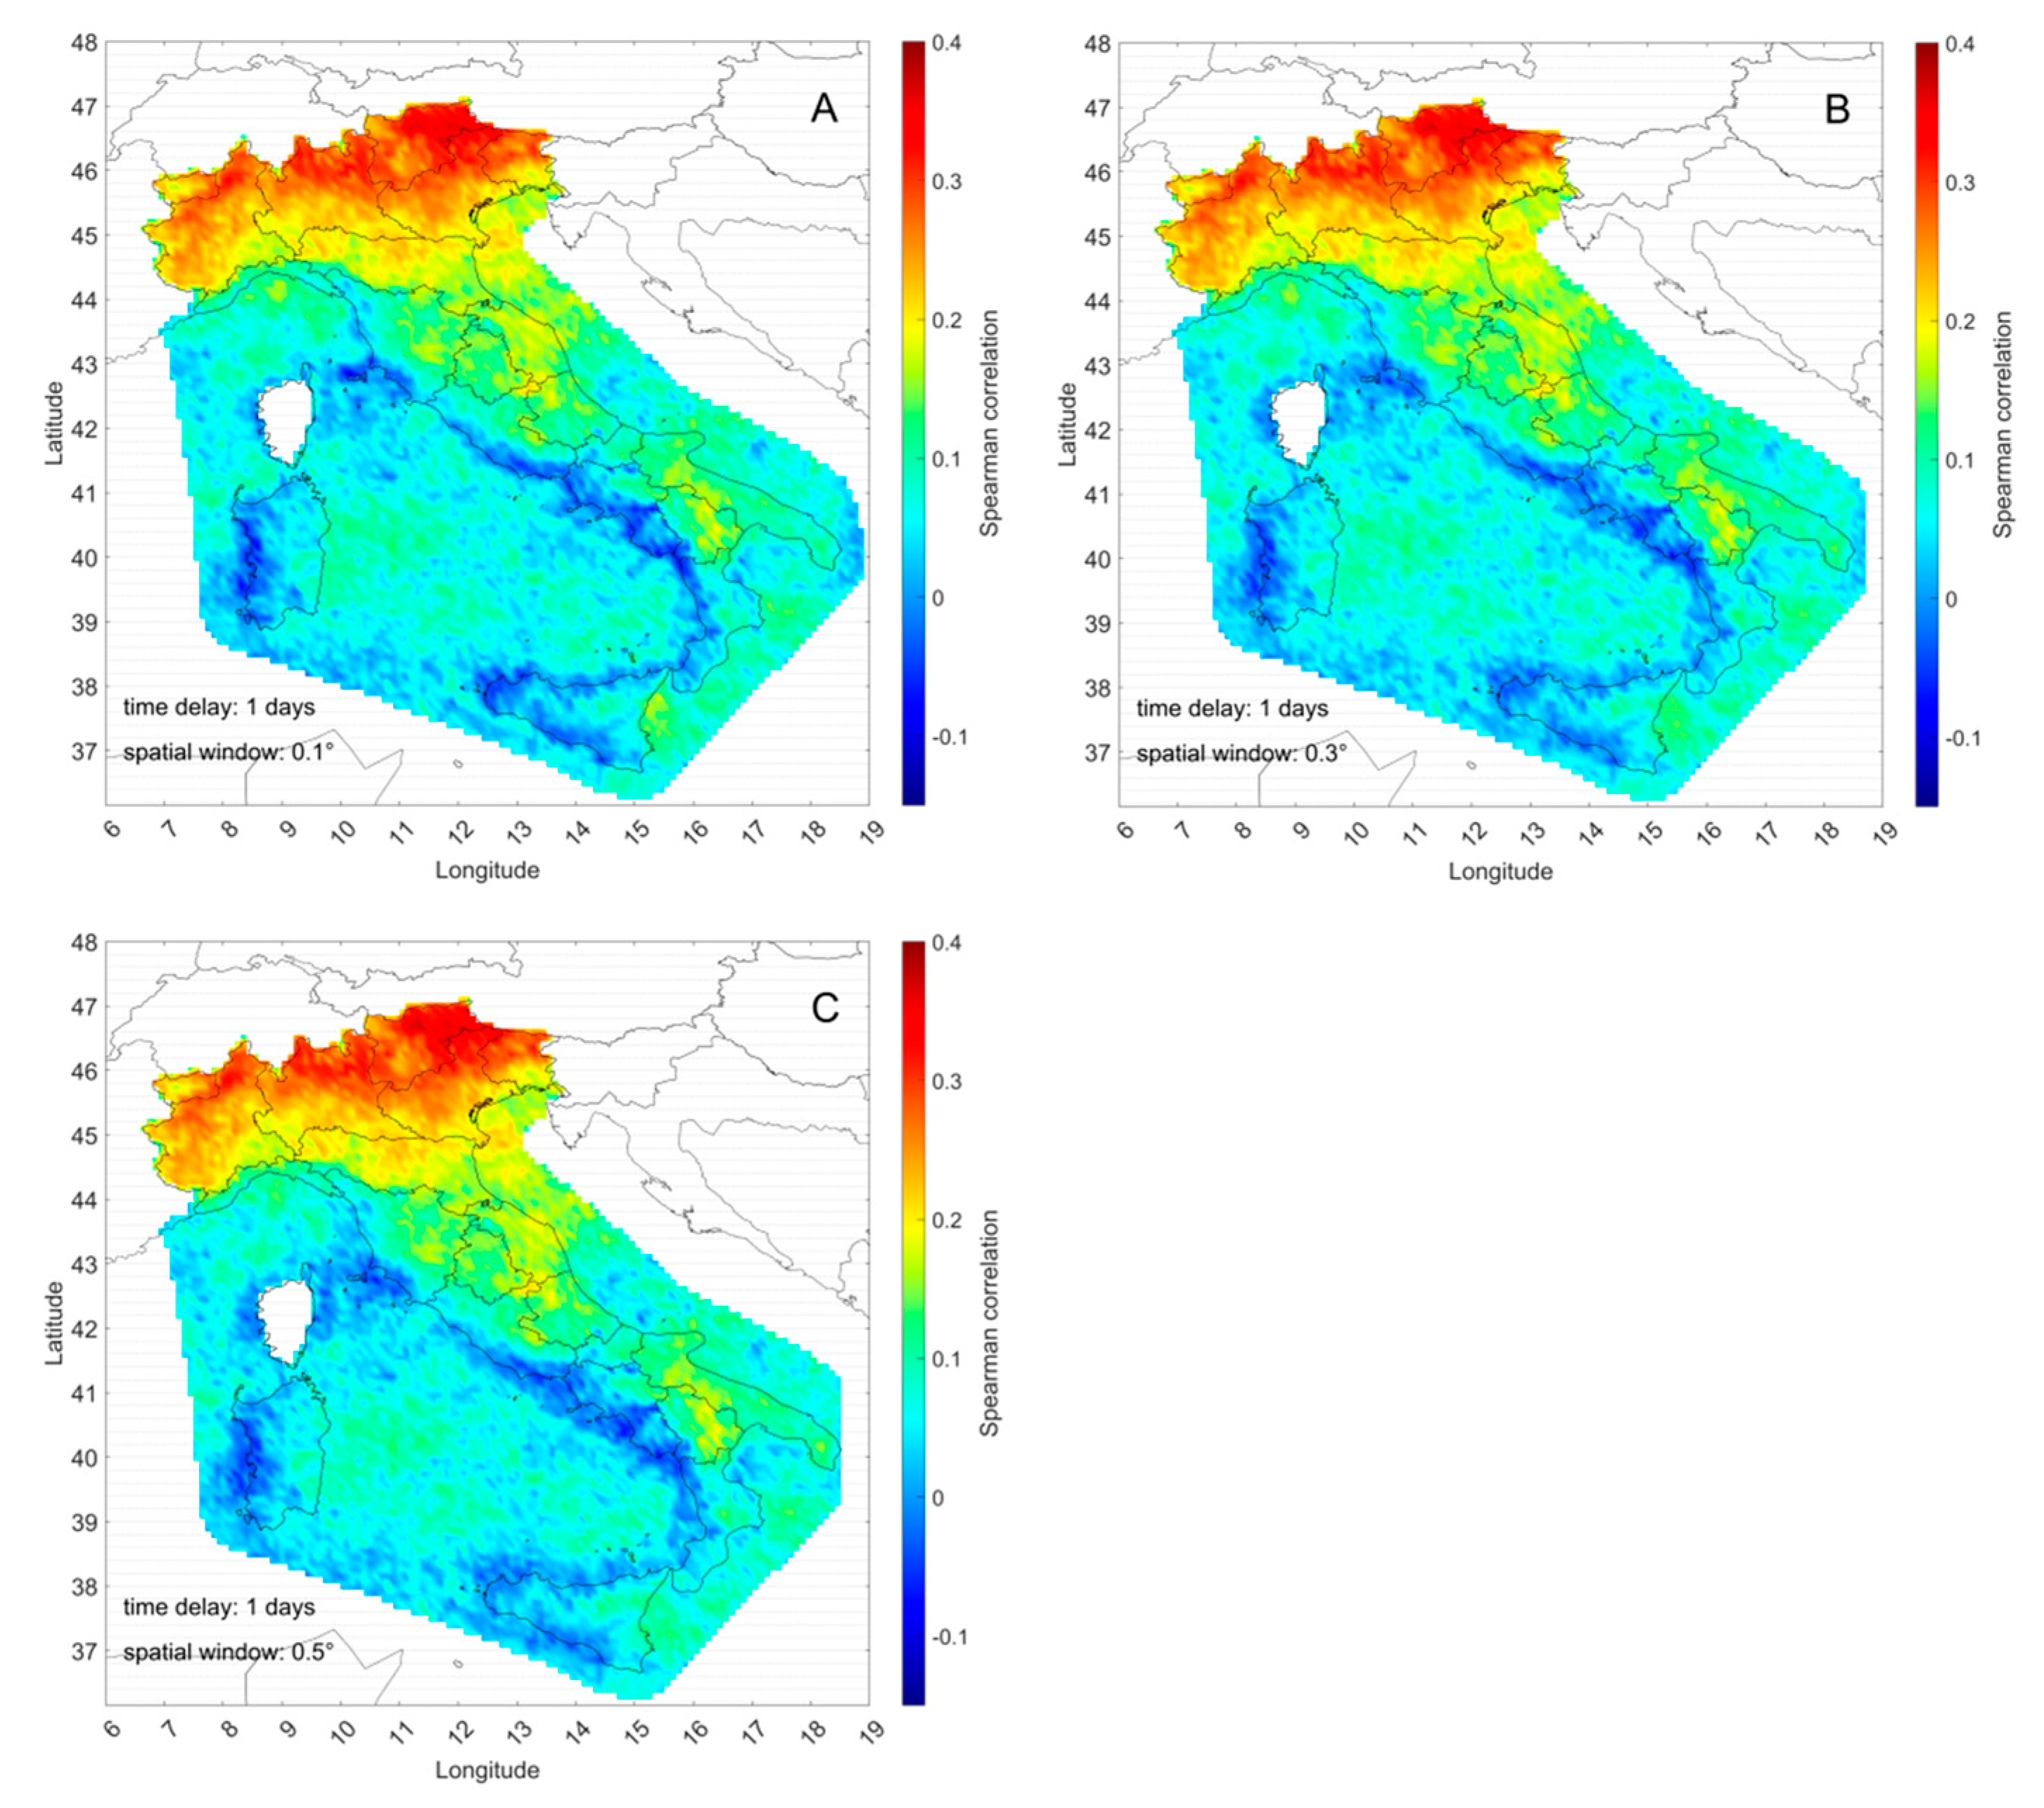
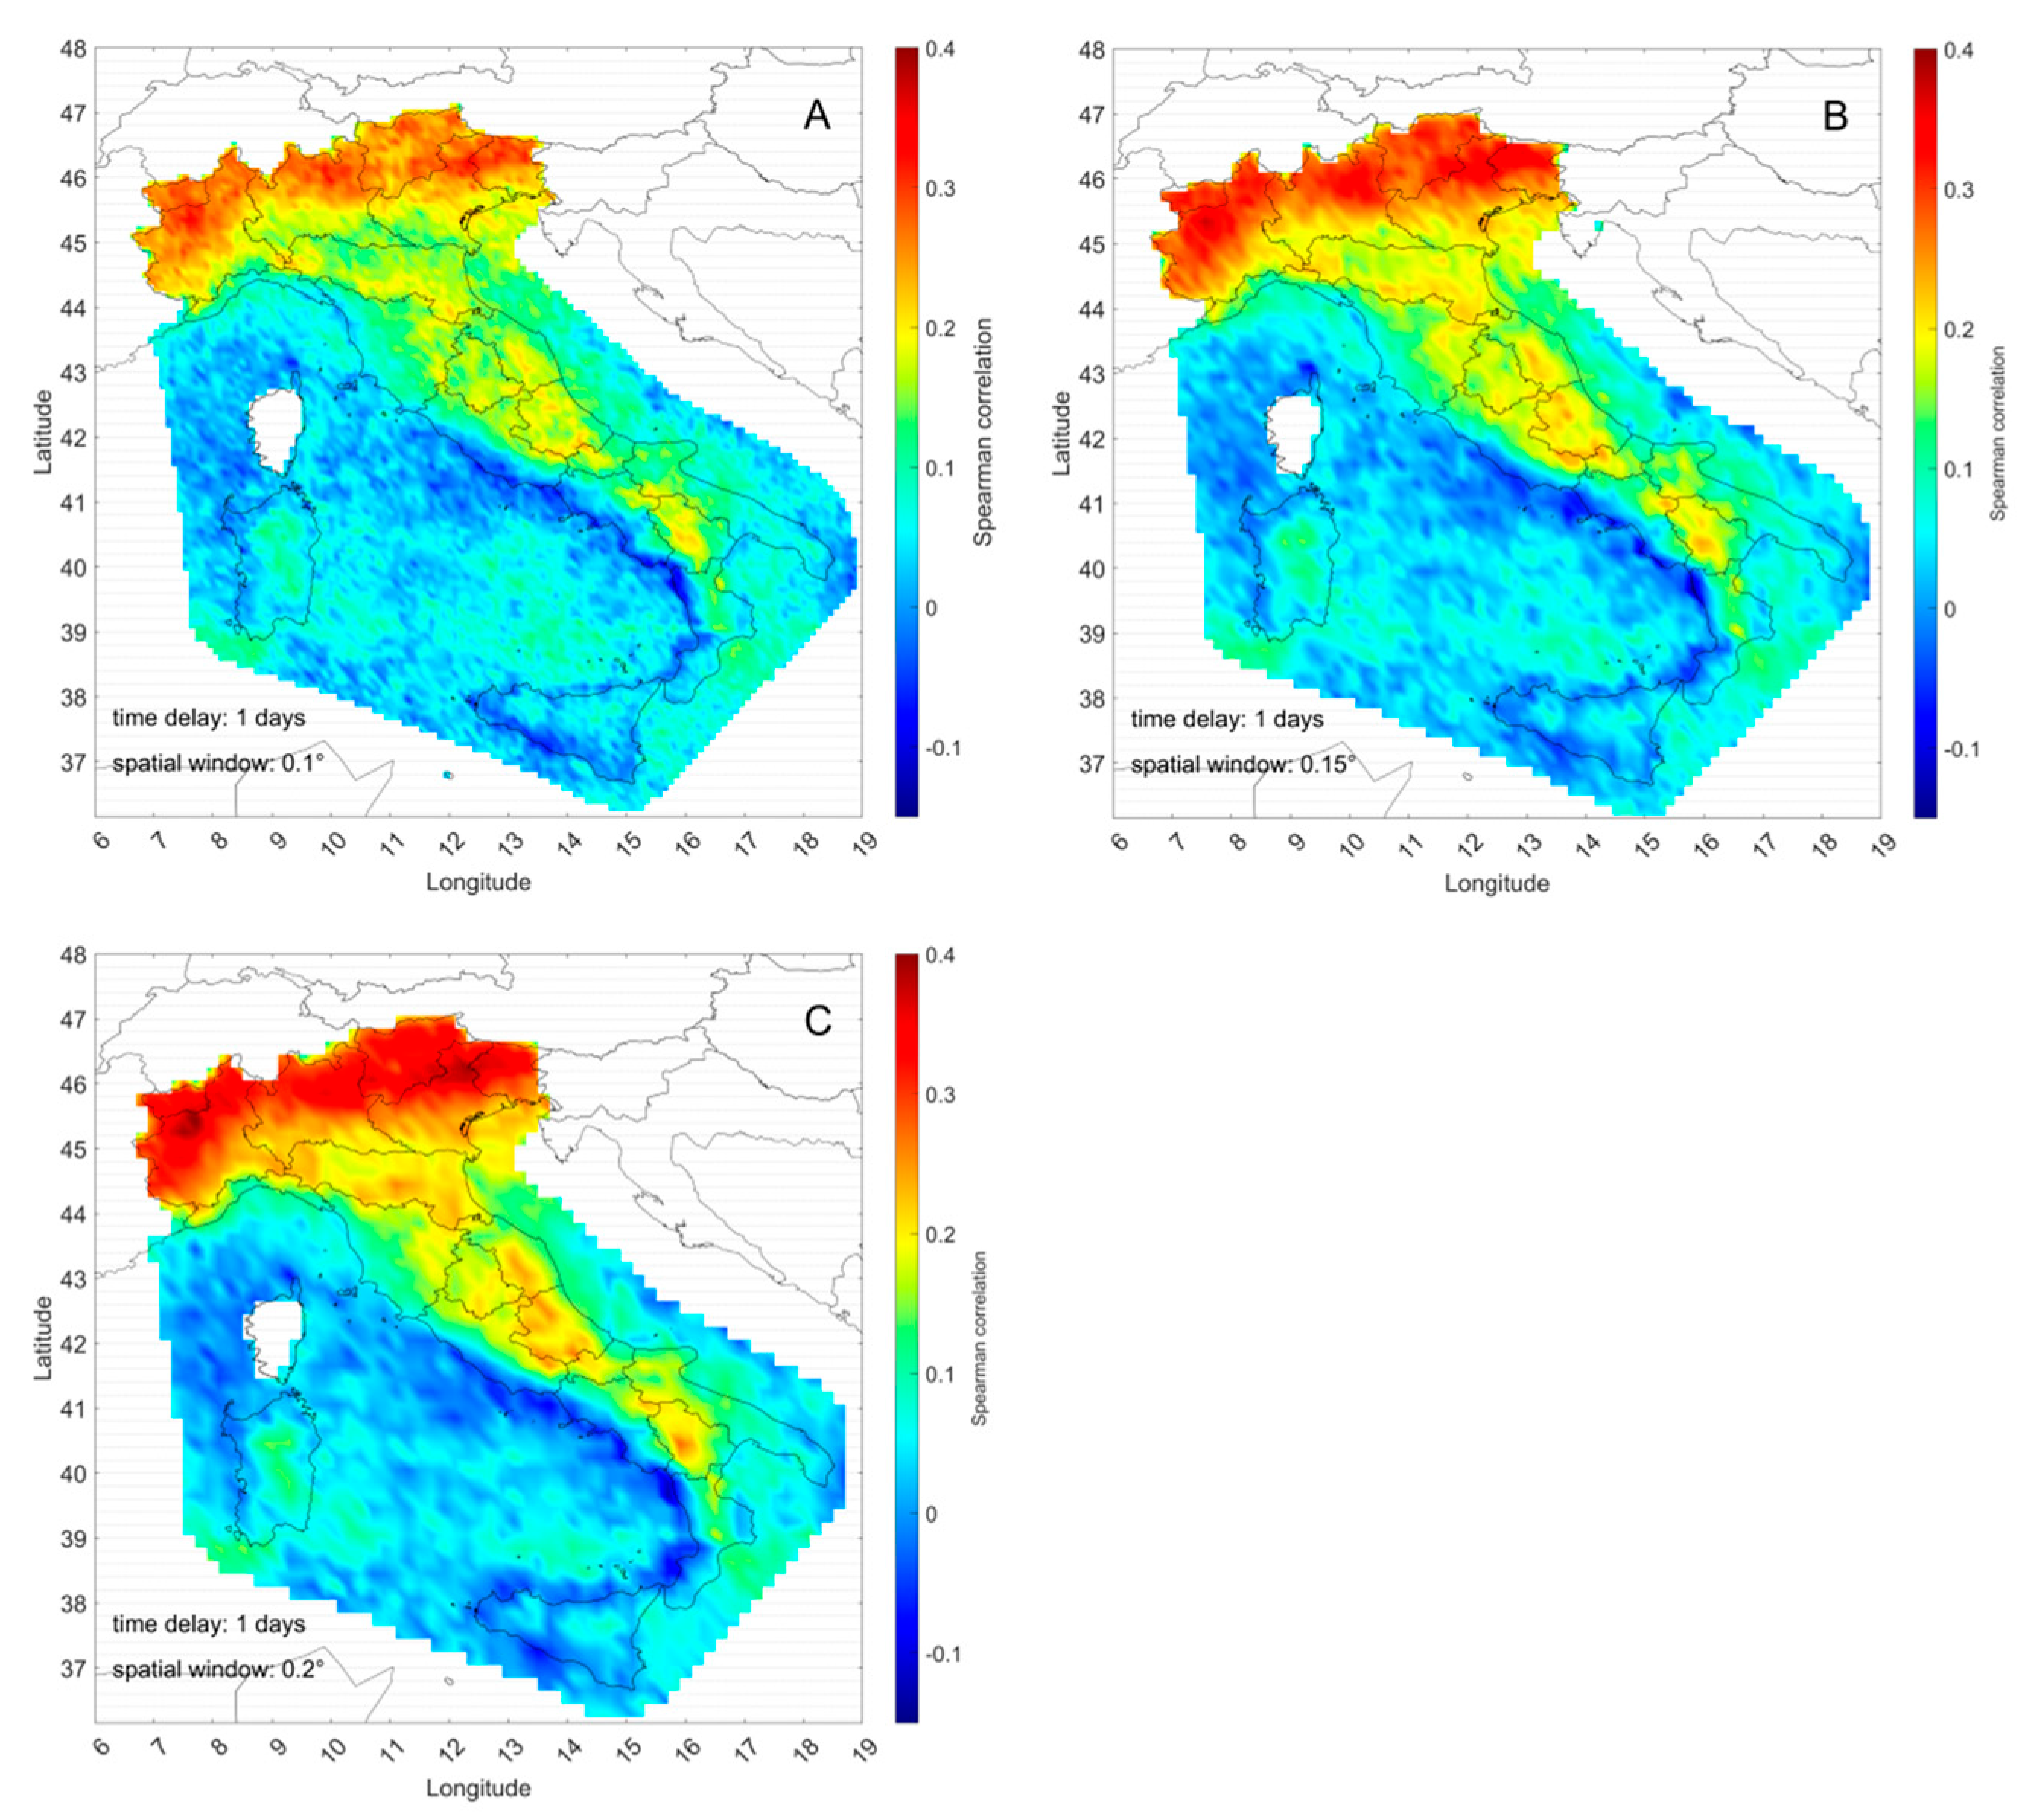
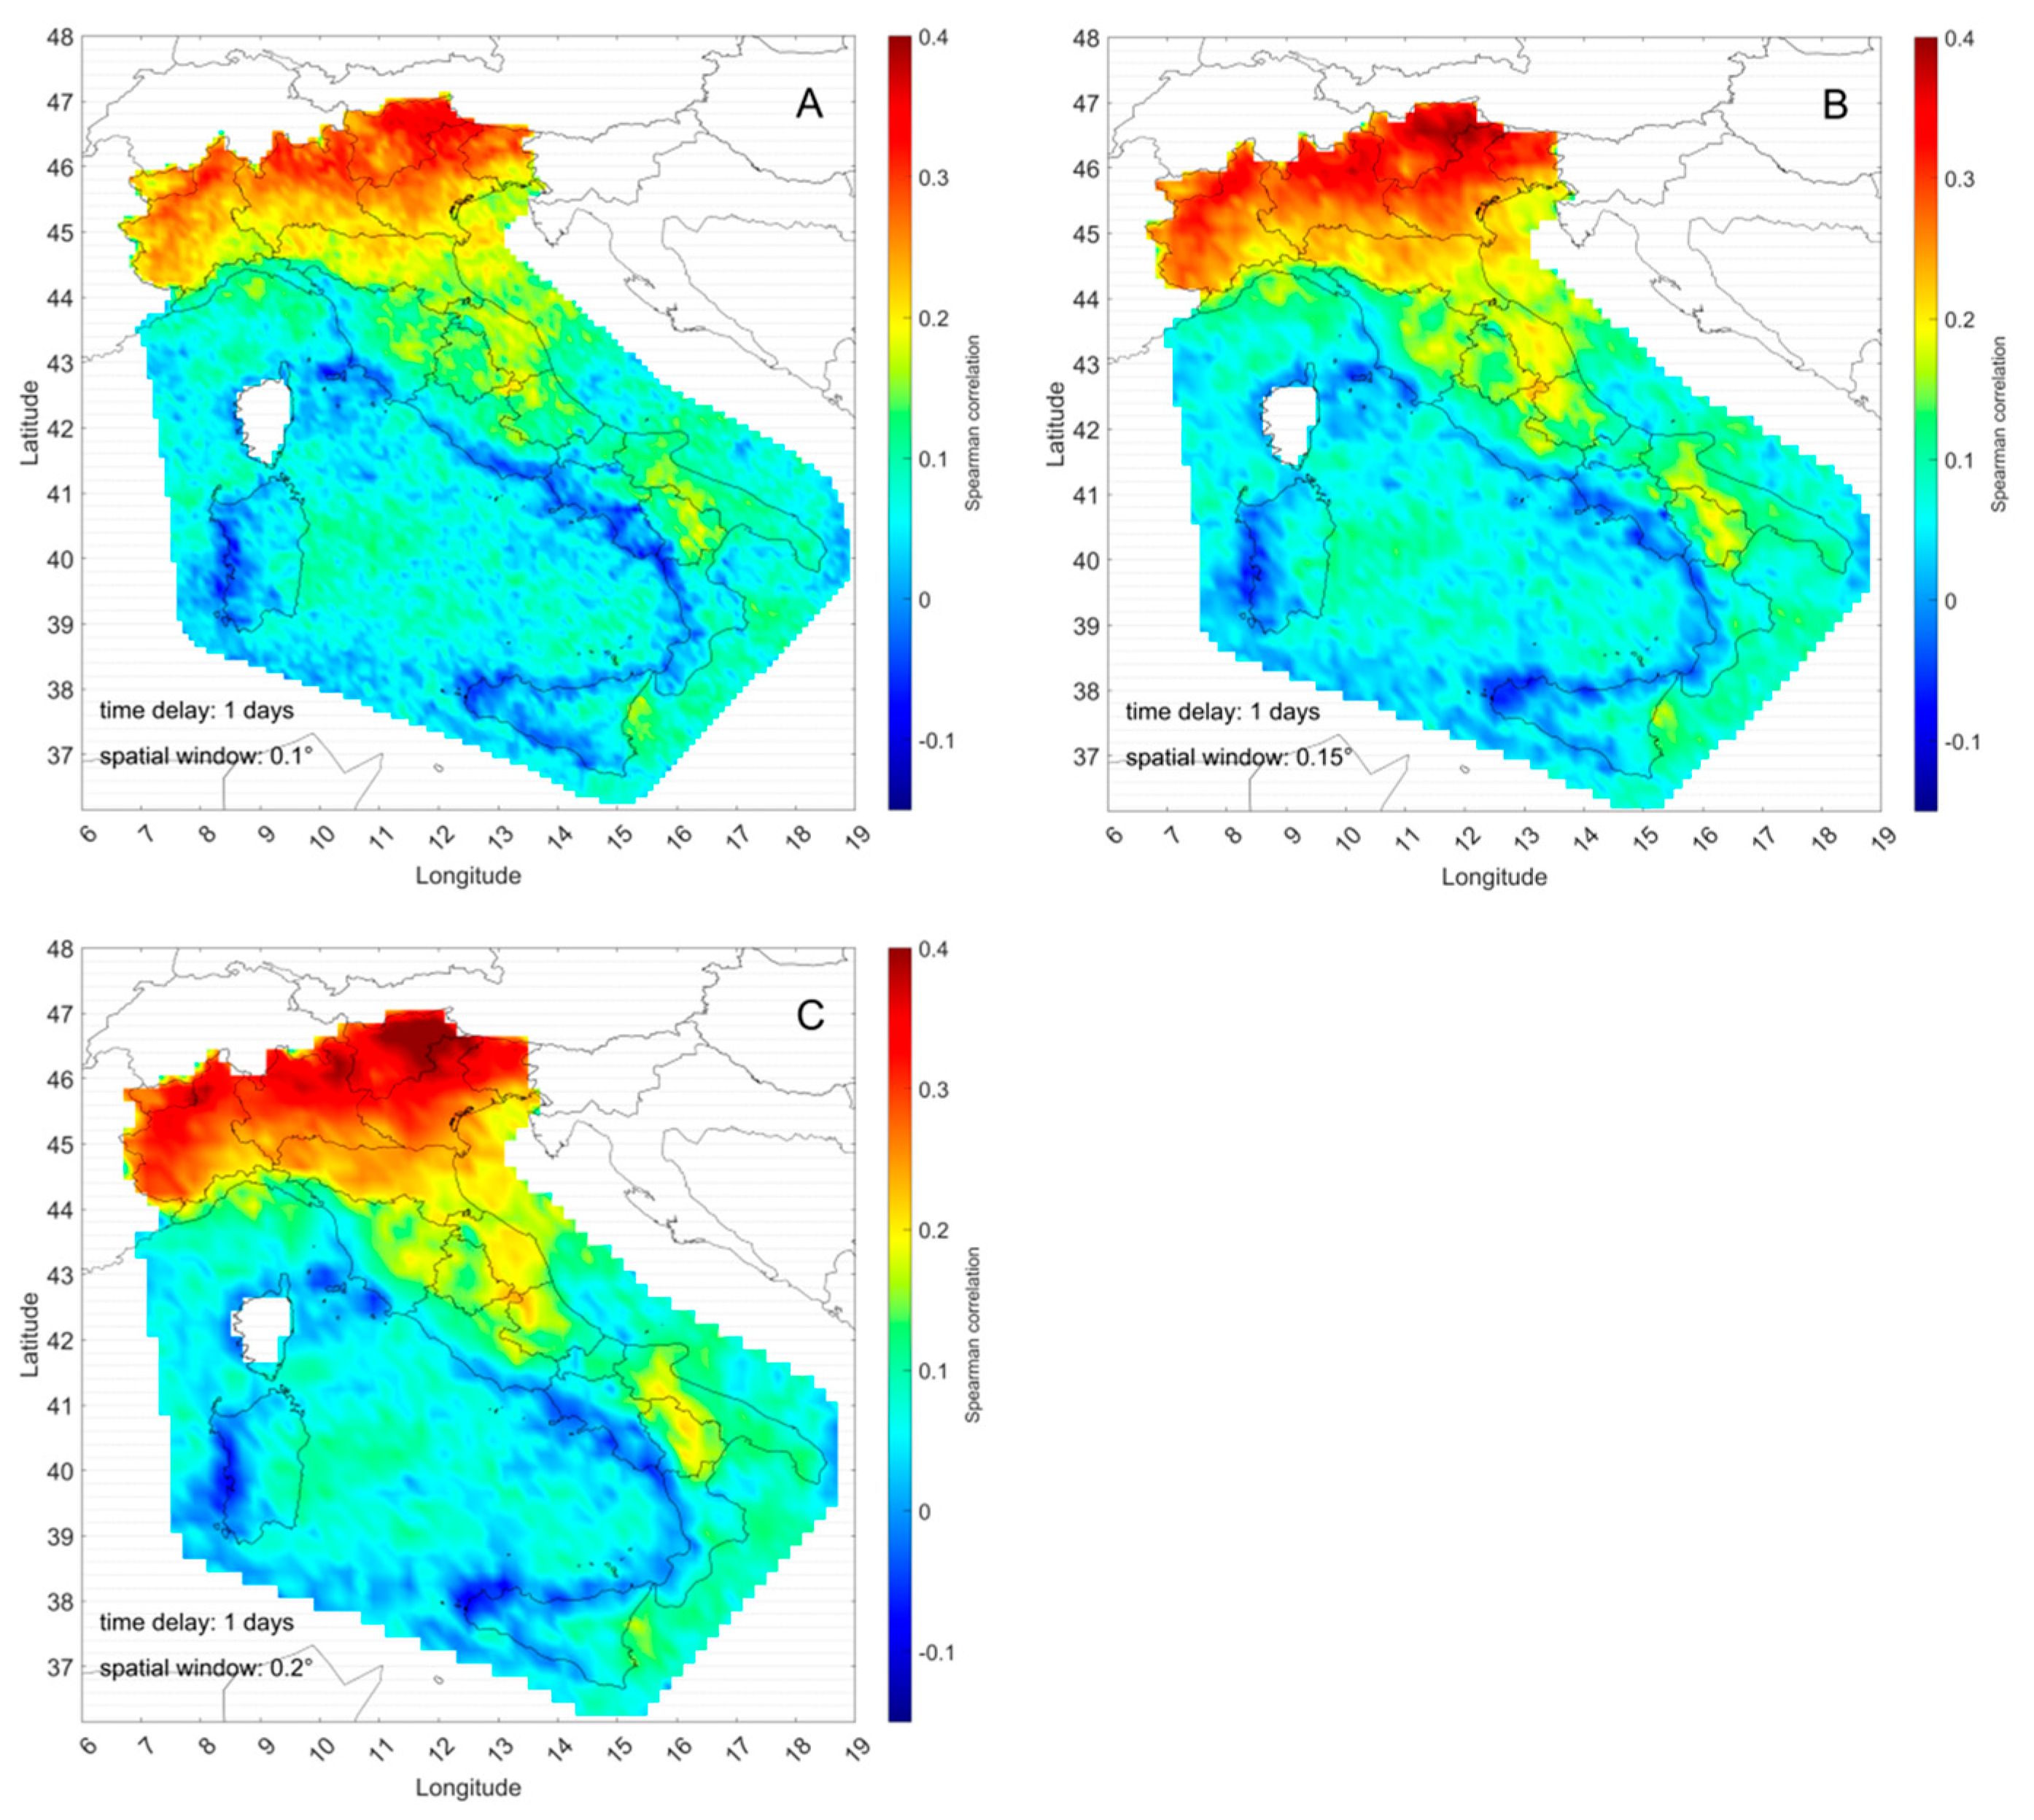
Results are reported in Figure 14, Figure 15, Figure 16, Figure 17, Figure 18 and Figure 19 in terms of heatmaps of the Spearman correlation coefficient . Figure 14 and Figure 15 study the dependence of on the timescale for the 2010–2011 and the 2020–2021 biennia, respectively. A 0.1° grid resolution is considered and is assumed, thus, for each time instant and for each -cell, only temperatures are used to calculate , i.e., samples between time instants and taken around the -cell:

Figure 14.
Heatmap of the Spearman correlation coefficient between CG strokes and surface temperature for the 2010–2011 biennium with different values: 1 day (A), 5 days (B), 15 days (C), 30 days (D), 60 days (E), 120 days (F), 150 days (G), and 180 days (H). Daily data, 0.1° grid resolution, cells.

Figure 15.
Heatmap of the Spearman correlation coefficient between CG strokes and surface temperature for the 2020–2021 biennium with different values: 1 day (A), 5 days (B), 15 days (C), 30 days (D), 60 days (E), 120 days (F), 150 days (G), and 180 days (H). Daily data, 0.1° grid resolution, cells.

Figure 16.
Heatmap of the Spearman correlation coefficient between CG strokes and surface temperature for the 2010–2011 biennium for different values: 0 cells–0.1° (A), 2 cells–0.3° (B), and 4 cells–0.5° (C) . Daily data, 0.1° grid resolution, day.

Figure 17.
Heatmap of the Spearman correlation coefficient between CG strokes and surface temperature for the 2020–2021 biennium for different values: 0 cells–0.1° (A), 2 cells–0.3° (B), and 4 cells–0.5° (C). Daily data, 0.1° grid resolution, day.

Figure 18.
Heatmap of the Spearman correlation coefficient between CG strokes and surface temperature for the 2010–2011 biennium for different grid resolutions: 0.1° (A), 0.15° (B), and 0.2° (C). Daily data, day, cells.

Figure 19.
Heatmap of the Spearman correlation coefficient between CG strokes and surface temperature for the 2020–2021 biennium for different grid resolutions: 0.1° (A), 0.15° (B), and 0.2° (C). Daily data, day, cells.
Eight different time delays are assessed, from day to days.
In both biennia a modest correlation can be observed (up to 0.4) at short timescales on the land (especially in North Italy, i.e., alpine and subalpine regions), with a decreasing trend (down to ) at longer timescales. The opposite trend, but with a reduced variability range, can be observed for the correlation on the sea cells and coastal areas, with the highest values reached on the Sicilian Sea and the lower Tyrrhenian Sea. No significant variations can be appreciated from day to days.
Figure 16 (2010–2011) and Figure 17 (2020–2021) show the dependence of the correlation on the spatial window extension, i.e., considering temperature values aggregated at different distances. In particular, cells, cells, and cells are considered, leading to spatial window extensions of 0.1° (i.e., the grid resolution), 0.3° and 0.5°, respectively. In all cases, day is assumed. However, no remarkable variations can be observed with different values.
Figure 18 and Figure 19 report the dependence of the correlation on the grid resolution for the two biennia. day and cells are assumed. Slight changes in correlations can be noticed, with an increase in high values over the land and a decrease in values over the sea when larger grid sizes are considered.
As far as the variability between the 2010–2011 biennium and the 2020–2021 biennium is concerned, no significant variation in the CG lightning–temperature correlation is observed.
The same analysis carried out on daily data is also performed with monthly aggregated data. Figures are not reported in this contribution, but results are similar to daily data from a qualitative point of view. However, higher values of the correlation coefficient are reached when monthly data are considered (up to 1 in some cells in the North Italy).
Comparisons between 2010–2011 and 2020–2021 daily average profiles (with a 3-day moving average filter) are shown in Figure 20 for SST and LST. Figure 21. reports the monthly average surface temperature over the sea and over the land for both periods. From 2010–2011 to 2020–2021, a slight temperature increase during summer and autumn and a slight temperature decrease during spring can be observed, which is consistent with the trend of CG lightning occurrence (Table 1) and the calculated correlation.

Figure 20.
Daily average SST and LST with a 3-day moving average filter. Comparison between the 2010–2011 and the 2020–2021 biennia.

Figure 21.
Monthly average SST and LST. Comparison between the 2010–2011 and the 2020–2021 biennia.
5. Conclusions
This contribution has attempted to investigate the variation in cloud-to-ground (CG) lightning activity in Italy between the 2010–2011 period and the 2020–2021 period as a function of different geographical and/or temporal parameters. Lightning data have been acquired from the SIRF network. The area of interest is Italy and the surrounding sea. To sum up, the analysis has shown the following results:
- A significant seasonal variability in lightning activity is highlighted in both periods and between them. In general, the highest number of total strokes is recorded in summer and in autumn, while the lowest ones are in winter and in spring. A remarkable increase in the lightning activity in Italy has occurred in 2020–2021 with respect to 2010–2011 (+24%, +83%, and +29% for negative, positive, and total strokes, respectively). Summer and winter total strokes are comparable, but strong differences appear in spring (−47%) and autumn (+58%).
- The monthly mean density has a similar trend in both 2010–2011 and 2020–2021 periods. Positive events are much less than negative ones. CG stroke density in 2010–2011 reaches greater values over the land in summer, whereas in 2020–2021 the highest densities are over the sea during autumn. Regardless of the polarity, CG lightning activity is more relevant over the sea than land from October to January in 2010–2011 and for September to January in 2020–2021.
- The monthly negative/positive CG stroke ratio reaches lower values in 2020–2021 than in 2010–2011. In 2020–2021, the ratio between negative CG and positive CG strokes is almost always higher over the land than over the sea, whereas for 2010–2011, the opposite holds true.
- In each season the lightning activity is almost constant along the day over the sea, regardless of the polarity. For what concerns both negative and positive CG strokes over the land, the highest concentration occurs between the late morning and the afternoon (10-18 UTC) in each season, except in winter.
- The range of elevation variability at which lightning occurs is different among the three zones in which the Italian territory has been divided. The main difference between the two periods regards the distribution of the elevation of winter CG strokes: a significant increase in the 50% and 90% percentiles is detected in 2020–2021, except for positive events in North Italy in which the behavior is like that of 2010–2011. By comparing the South Italy distributions in the two periods, a remarkably higher seasonal variability appears during 2020–2021.
- Monthly mean positive peak currents recorded in 2020–2021 are lower to those of 2010–2011. For monthly mean negative peak current, no significant variability has been observed between the two biennia. In both periods, the higher negative peak currents are always recorded over the sea, whereas the positive values over the land are higher than those over the sea from July to December in 2010–2011 and always higher in 2020–2021. The trend is similar in the two periods and inverse with respect to the Ground Stroke Density.
- Both in the 2010–2011 period and the 2020–2021 period, the value of the mean positive flash multiplicity is lower than the corresponding negative one. Values in the two periods are comparable.
- As regards the distribution of the distance between the stroke points of impact within a flash, negative subsequent strokes are more concentrated around the first stroke impact point in 2020–2021 than in 2010–2011. On the other hand, positive flashes in 2010–2011 contain strokes with more uniform distribution than in 2020–2021, where more than circa 25% of subsequent strokes impact within 1 km from the corresponding first stroke.
- In both periods, the peak current median values for negative and positive first strokes are lower with respect to the measurements obtained by Berger and his co-workers, even though the median current values in 2010–2011 are much closer to the ground truth data than those of 2020–2021.
Finally, a correlation analysis between CG lightning occurrence and land/sea surface temperature (EUMETSAT) has been performed. For daily data, a modest correlation has been observed on the land at short timescales (up to 30 days) for both biennia; on the other hand, the highest correlation on the sea was reached at larger timescales (more than 30 days) for both biennia. For monthly data, the same trends have been observed, but with higher values of the correlation coefficient (up to 1) in several cells of the considered area. This is in accordance with previous literature, suggesting that surface temperature increase may lead to higher lightning occurrence. Indeed, daily average and monthly average temperature profiles are consistent with the observed trend of CG stroke occurrence between the 2010–2011 and 2020–2021 periods and the computed correlation.
It should be noted that the analysis presented in this study is based on two biennia of data, selected according to data availability. While this timescale allows for a preliminary exploration of the relationship between CG lightning activity and sea/land surface temperature in Italy and the surrounding seas, it does not capture long-term variability. Robust assessments of lightning–climate interactions typically require datasets covering at least a decade. Therefore, the results discussed here should be interpreted with this limitation in mind, and future work will benefit from extending the analysis to longer time series.
Author Contributions
Conceptualization, M.N. and E.F.; Methodology, M.N. and E.F.; Software, M.N. Investigation, M.N.; Resources, M.B.; Data curation, M.N., M.B. and E.F.; Writing—original draft, M.N.; Writing—review & editing, R.A.R.M., M.B., D.M. and E.F.; Visualization, D.M.; Supervision, R.A.R.M. and M.B. All authors have read and agreed to the published version of the manuscript.
Funding
This research received no external funding.
Data Availability Statement
Lightning data presented in this study are available on request due non disclosure agreement. Original temperature data presented in the study are openly available in [https://datalsasaf.lsasvcs.ipma.pt/PRODUCTS/MSG/MLST-ASv2/NETCDF/] (accessed on 10 September 2025) (LST) and [https://osi-saf.ifremer.fr/sst/l3c/east_atlantic_west_indian/meteosat/] (accessed on 10 September 2025) (SST).
Acknowledgments
The authors gratefully acknowledge METEROAGE for granting access to their lightning detection dataset, which was essential for the analyses presented in this work.
Conflicts of Interest
The authors declare no conflict of interest.
References
- Rakov, V.A.; Uman, M.A. Lightning: Physics and Effects; Cambridge University Press: Cambridge, UK, 2003. [Google Scholar]
- Carter, A.E.; Kidder, R.E. Lightning in relation to precipitation. J. Atmos. Terr. Phys. 1977, 39, 139–148. [Google Scholar] [CrossRef]
- Orville, R.E.; Henderson, R. Global distribution of midnight lightning: September 1977 to August 1978. Mon. Weather Rev. 1986, 14, 2640–2653. [Google Scholar] [CrossRef]
- Tapia, A.; Smith, J.A.; Dixon, M. Estimation of Convective Rainfall from Lightning Observations. J. Appl. Meteorol. 1998, 37, 1497–1509. [Google Scholar] [CrossRef]
- Soula, S.; Chauzy, S. Some aspects of the correlation between lightning and rain activities in thunderstorms. Atmos. Res. 2001, 56, 355–373. [Google Scholar] [CrossRef]
- Adamo, C.; Goodman, S.; Mugnai, A.; Weinman, J.A. Lightning Measurements from Satellites, Significance for Storms in the Mediterranean. In Lightning: Principles, Instruments and Applications: Review of Modern Lightning Research; Betz, H.D., Schumann, U., Laroche, P., Eds.; Springer: Dordrecht, The Netherlands, 2009; pp. 309–329. [Google Scholar]
- Price, C. Lightning data assimilation enhances thunderstorm prediction capability. Sci. Bull. 2025, 70, 2394–2396. [Google Scholar] [CrossRef]
- Liu, D.; Yu, H.; Sun, Z.; Zhang, H.; Wang, D. Convective Properties and Lightning Activity in Different Categories of Thunderstorms over the Beijing Area during Five Warm Seasons. Remote Sens. 2024, 16, 447. [Google Scholar] [CrossRef]
- Zhang, H.; Deng, Y.; Wang, Y.; Lan, L.; Wen, X.; Fang, C.; Xu, J. Extraction of Factors Strongly Correlated with Lightning Activity Based on Remote Sensing Information. Remote Sens. 2024, 16, 1921. [Google Scholar] [CrossRef]
- Jiang, S.; Lyu, F.; Cummer, S.A.; Zheng, T.; Wang, M.; Liu, Y.; Lyu, W. A Case Study on the Vertical Distribution and Correlation Between Low-Frequency Lightning Sources and Hydrometeors During a Thunderstorm. Remote Sens. 2025, 17, 2676. [Google Scholar] [CrossRef]
- Gofa, F.; Boucouvala, D.; Samos, I.; Louka, P. Lightning potential forecast evaluation and its correlation with thermodynamic indices. Environ. Sci. Proc. 2023, 26, 109. [Google Scholar] [CrossRef]
- Ma, R.; Zheng, D.; Zhang, Y.; Yao, W.; Zhang, W.; Zhu, B. Thunderstorms with Extreme Lightning Activity in China: Climatology, Synoptic Patterns, and Convective Parameters. Remote Sens. 2024, 16, 4673. [Google Scholar] [CrossRef]
- Sun, J.; Chai, J.; Leng, L.; Xu, G. Analysis of Lightning and Precipitation Activities in Three Severe Convective Events Based on Doppler Radar and Microwave Radiometer over the Central China Region. Atmosphere 2019, 10, 298. [Google Scholar] [CrossRef]
- Kastman, J.S.; Market, P.S.; Fox, N.I.; Foscato, A.L.; Lupo, A.R. Lightning and Rainfall Characteristics in Elevated vs. Surface Based Convection in the Midwest that Produce Heavy Rainfall. Atmosphere 2017, 8, 36. [Google Scholar] [CrossRef]
- Hu, J.; Rosenfeld, D.; Zrnic, D.; Williams, E.; Zhang, P.; Snyder, J.C.; Ryzhkov, A.; Hashimshoni, E.; Zhang, R.; Weitz, R. Tracking and characterization of convective cells through their maturation into stratiform storm elements using polarimetric radar and lightning detection. Atmos. Res. 2019, 226, 192–207. [Google Scholar] [CrossRef]
- Price, C.G. Lightning Applications in Weather and Climate Research. Surv. Geophys. 2013, 34, 755–767. [Google Scholar] [CrossRef]
- Taszarek, M.; Allen, J.T.; Groenemeijer, P.; Edwards, R.; Brooks, H.E.; Chmielewski, V.; Enno, S.E. Severe convective storms across Europe and the United States. Part 1: Climatology of lightning, large hail, severe wind and tornadoes. J. Clim. 2020, 33, 10239–10261. [Google Scholar] [CrossRef]
- Taszarek, M.; Brooks, H.E.; Czernecki, B.; Szuster, P.; Fortuniak, K. Climatological Aspects of Convective Parameters over Europe: A Comparison of ERA-Interim and Sounding Data. J. Clim. 2018, 31, 4281–4308. [Google Scholar] [CrossRef]
- Yair, Y.; Lynn, B.; Price, C.; Kotroni, V.; Lagouvardos, K.; Morin, E.; Mugnai, A.; Llasat, M.d.C. Predicting the potential for lightning activity in Mediterranean storms based on the Weather Research and Forecasting (WRF) model dynamic and microphysical fields. J. Geophys. Res. Atmos. 2010, 115, D04205. [Google Scholar] [CrossRef]
- La Fata, A.; Moser, G.; Procopio, R.; Bernardi, M.; Fiori, E. A Gaussian process regression method to nowcast cloud-to-ground lightning from remote sensing and numerical weather modeling data. IEEE J. Sel. Top. Appl. Earth Obs. Remote Sens. 2025, 18, 1963–1981. [Google Scholar] [CrossRef]
- Kim, H.-A.; Ho, J.; Zhang, G.; Ha, K.-J.; Hong, S.-Y.; Ho, C.-H. Polarimetric radar signatures in various lightning activities during Seoul (Korea) flood on August 8, 2022. Asia-Pac. J. Atmos. Sci. 2024, 60, 401–415. [Google Scholar] [CrossRef]
- Bruning, E.C.; Brunner, K.N.; van Lier-Walqui, M.; Logan, T.; Matsui, T. Lightning and Radar Measures of Mixed-Phase Updraft Variability in Tracked Storms during the TRACER Field Campaign in Houston, Texas. Mon. Weather Rev. 2024, 152, 2753–2769. [Google Scholar] [CrossRef]
- Leinonen, J.; Hamann, U.; Germann, U. Seamless Lightning Nowcasting with Recurrent-Convolutional Deep Learning. Artif. Intell. Earth Syst. 2022, 1, e220043. [Google Scholar] [CrossRef]
- Alves, M.A.; Molina, R.A.; Oliveira, B.A.S.; Calvo, D.; Araujo Filho, M.C.A.; Ferreira, D.B.d.S.; Santos, A.P.P.; Saraiva, I.; Pinto, O., Jr.; Daher, E.L. Lightning Nowcasting Using Dual-Polarization Weather Radar and Machine Learning Approaches: Evaluation of Feature Engineering Strategies and Operational Integration. Climate 2025, 13, 168. [Google Scholar] [CrossRef]
- Fan, L.; Zhou, C. Cloud-to-Ground and Intra-Cloud Nowcasting Lightning Using a Semantic Segmentation Deep Learning Network. Remote Sens. 2023, 15, 4981. [Google Scholar] [CrossRef]
- Sekehravani, E.A.; Dodge, S.; Barmada, S.; Brignone, M.; Formisano, A.; Mestriner, D.; Nicora, M.; Procopio, R. Preliminary breakdown pulses: A review on available data and models. Electr. Power Syst. Res. 2025, 242, 111463. [Google Scholar] [CrossRef]
- Nucci, C.A.; Mazzetti, C.; Rachidi, F.; Ianoz, M. On lightning return stroke models for LEMP calculations. In Proceedings of the 19th International Conference on Lightning Protection, Graz, Austria, 25–29 April 1988; Available online: https://infoscience.epfl.ch/record/116466 (accessed on 10 October 2025).
- Rakov, V.A.; Uman, M.A. Review and evaluation of lightning return stroke models including some aspects of their application. IEEE Trans. Electromagn. Compat. 1998, 40, 403–426. [Google Scholar] [CrossRef]
- Uman, M.A.; McLain, K.; Krider, E. The electromagnetic radiation from a finite antenna. Am. J. Phys. 1975, 43, 33–38. [Google Scholar] [CrossRef]
- Koike, S.; Baba, Y.; Tsuboi, T.; Rakov, V.A. Lightning current waveforms inferred from far-field waveforms for the case of strikes to tall objects. IEEE Trans. Electromagn. Compat. 2023, 65, 1162–1169. [Google Scholar] [CrossRef]
- Koike, S.; Fukuyama, M.; Baba, Y.; Tsuboi, T.; Rakov, V.A. A procedure to infer lightning return-stroke current waveform from far-field waveform for the case of lossy ground. IEEE Trans. Electromagn. Compat. 2024, 66, 525–531. [Google Scholar] [CrossRef]
- Nishimura, S.; Baba, Y.; Tsuboi, T. Influences of the earth conductivity on electric fields radiated from lightning strikes to tall towers. In Proceedings of the 2025 13th Asia-Pacific International Conference on Lightning (APL), Bali, Indonesia, 17–20 June 2025; pp. 365–369. [Google Scholar] [CrossRef]
- Petrarca, C.; Balato, M.; Verolino, L.; Andreotti, A.; Assante, D. Computation of Electric and Magnetic Fields Generated by Cloud-to-Cloud Lightning Channels. Energies 2023, 16, 4524. [Google Scholar] [CrossRef]
- Brignone, M.; Nicora, M.; Mestriner, D.; Procopio, R.; Petrarca, C.; Formisano, A.; Barmada, S.; Delfino, F. An efficient method for the computation of electromagnetic fields associated with tortuous lightning channels. IEEE Trans. Electromagn. Compat. 2022, 64, 1431–1441. [Google Scholar] [CrossRef]
- Brignone, M.; Procopio, R.; Nicora, M.; Mestriner, D.; Rachidi, F.; Rubinstein, M. A Prony-based approach for accelerating the lightning electromagnetic fields computation: Effect of the soil finite conductivity. Electr. Power Syst. Res. 2022, 209, 108013. [Google Scholar] [CrossRef]
- Brignone, M.; Procopio, R.; Nicora, M.; Mestriner, D.; Rachidi, F.; Rubinstein, M. A Prony-based approach for accelerating the lightning electromagnetic fields computation above a perfectly conducting ground. Electr. Power Syst. Res. 2022, 210, 108125. [Google Scholar] [CrossRef]
- La Fata, A.; Nicora, M.; Mestriner, D.; Aramini, R.; Procopio, R.; Brignone, M.; Delfino, F. Lightning Electromagnetic Fields Computation: A Review of the Available Approaches. Energies 2023, 16, 2436. [Google Scholar] [CrossRef]
- La Fata, A.; Nicora, M.; Mestriner, D.; Aramini, R.; Procopio, R.; Brignone, M.; Delfino, F. Lightning Electromagnetic Fields above Perfectly Conducting Ground: A review. In Proceedings of the 2023 IEEE International Conference on Environment and Electrical Engineering and 2023 IEEE Industrial and Commercial Power Systems Europe (EEEIC/I&CPS Europe), Madrid, Spain, 6–9 June 2023. [Google Scholar] [CrossRef]
- Mestriner, D.; Aramini, R.; Brignone, M.; Nicora, M.; Procopio, R.; Randazzo, A. A method to include the effects of tortuosity in the electromagnetic field expressions produced by vertical lightning channels. IEEE Trans. Antennas Propag. 2025. Advance online publication. [Google Scholar] [CrossRef]
- Mestriner, D.; Nicora, M. On the Importance of Considering Realistic Orography Into the Evaluation of Lightning Electromagnetic Fields in Mixed Path. IEEE Trans. Electromagn. Compat. 2022, 64, 1442–1449. [Google Scholar] [CrossRef]
- Piantini, A. Lightning overvoltages on hybrid overhead lines (invited lecture). In Proceedings of the 2023 International Symposium on Lightning Protection (XVII SIPDA), Suzhou, China, 9–13 October 2023; pp. 1–5. [Google Scholar] [CrossRef]
- Andreotti, A.; Ravichandran, N.; D’Orazio, L.; Villacci, D.; Cerretti, A.; Araneo, R.; Stracqualursi, E. Assessment of the indirect lightning performance of a distribution line. In Proceedings of the 2023 IEEE International Conference on Environment and Electrical Engineering and 2023 IEEE Industrial and Commercial Power Systems Europe (EEEIC/I&CPS Europe), Madrid, Spain, 6–9 June 2023; pp. 1–6. [Google Scholar] [CrossRef]
- Mikropoulos, P.N.; Tsouris, P.P.; Miltiadous, K.E. Modelling of the negative lightning impulse flashover of medium voltage overhead line insulators using ATP-EMTP. In Proceedings of the 2023 International Symposium on Lightning Protection (XVII SIPDA), Suzhou, China, 9–13 October 2023; pp. 1–6. [Google Scholar] [CrossRef]
- Moura, R.A.R.; Mestriner, D.; Procopio, R.; Schroeder, M.A.O.; Assis, F.A.; Nicora, M.; Delfino, F. A simplified method for the evaluation of lightning-induced overvoltage peaks with frequency-dependent soil parameters. In Proceedings of the 2022 IEEE International Conference on Environment and Electrical Engineering and 2022 IEEE Industrial and Commercial Power Systems Europe (EEEIC/I&CPS Europe), Prague, Czech Republic, 28 June–1 July 2022. [Google Scholar] [CrossRef]
- Nicora, M.; Mestriner, D.; Brignone, M.; Bernardi, M.; Procopio, R.; Fiori, E.; Piantini, A.; Rachidi, F. Assessment of the Lightning Performance of overhead distribution lines based on Lightning Location Systems data. Int. J. Electr. Power Energy Syst. 2022, 142, 108230. [Google Scholar] [CrossRef]
- Nicora, M.; Mestriner, D.; Brignone, M.; Procopio, R.; Bernardi, M.; Fiori, E.; Piantini, A. On the Use of Lightning Location System Data to Evaluate the Lightning Performance of Overhead Distribution Lines. In Proceedings of the ICLP 2024; 37th International Conference on Lightning Protection, Dresden, Germany, 1–7 September 2024; pp. 626–632. Available online: https://ieeexplore.ieee.org/document/10832700 (accessed on 10 September 2025).
- Nicora, M.; Mestriner, D.; Brignone, M.; Procopio, R.; Fiori, E.; Piantini, A.; Rachidi, F. Estimation of the lightning performance of overhead lines accounting for different types of strokes and multiple strike points. IEEE Trans. Electromagn. Compat. 2021, 63, 2015–2023. [Google Scholar] [CrossRef]
- Mestriner, D.; Brignone, M.; Procopio, R.; Nicora, M.; Fiori, E.; Piantini, A.; Rachidi, F. An efficient methodology for the evaluation of the lightning performance of overhead lines. IEEE Trans. Electromagn. Compat. 2021, 63, 1137–1145. [Google Scholar] [CrossRef]
- Mestriner, D.; Nicora, M.; Procopio, R.; Brignone, M.; Rossi, M.; Delfino, F.; Fiori, E. Lightning current parameters effects on the induced overvoltages in transmission lines. In Proceedings of the 2019 IEEE International Conference on Environment and Electrical Engineering and 2019 IEEE Industrial and Commercial Power Systems Europe (EEEIC/I&CPS Europe), Genova, Italy, 11–14 June 2019. [Google Scholar] [CrossRef]
- Lin, S.; Fu, J.; Wang, R.; Zhao, J. Simulation analysis of lightning current damage in lightning protection system of carbon fiber wind turbine blades. In Proceedings of the 2025 4th International Conference on Energy, Power and Electrical Technology (ICEPET), Chengdu, China, 25–27 April 2025; pp. 774–777. [Google Scholar] [CrossRef]
- Wang, S.; Xiang, N.; Pan, Y.; Li, K.; Wang, C.; Liu, Y.; Chen, Z.; Cheng, Y.; Lyu, Z. A novel inversion method for lightning transient current in wind turbine tower based on biaxial magnetic field sensor array. IEEE Trans. Instrum. Meas. 2025, 74, 1–9. [Google Scholar] [CrossRef]
- Torchio, R.; Nicora, M.; Mestriner, D.; Brignone, M.; Procopio, R.; Alotto, P.; Rubinstein, M. Do Wind Turbines Amplify the Effects of Lightning Strikes? A Full-Maxwell Modelling Approach. IEEE Trans. Power Deliv. 2022, 37, 3996–4006. [Google Scholar] [CrossRef]
- Bian, X.; Wu, Y.; Zhou, Q.; Jiang, R.; Zhang, Y.; Chen, L.; Qi, Q.; Lyu, W. Simulation of Cloud-to-Ground Lightning Strikes to Wind Turbines Considering Polarity Effect Based on an Improved Stochastic Lightning Model. Atmosphere 2023, 14, 108. [Google Scholar] [CrossRef]
- Karami, H.; Mostajabi, A.; Azadifar, M.; Rubinstein, M.; Zhuang, C.; Rachidi, F. Machine learning-based lightning localization algorithm using lightning-induced voltages on transmission lines. IEEE Trans. Electromagn. Compat. 2020, 62, 2512–2519. [Google Scholar] [CrossRef]
- Asadi, M.; Karami, H.; Rajabi, S.; Rubinstein, M.; Rachidi, F. An Efficient Machine Learning Model for Lightning Localization via Lightning-Induced Voltages on Transmission Lines. In Proceedings of the 2024 4th URSI Atlantic Radio Science Meeting (AT-RASC), Meloneras, Spain, 19–24 May 2024; pp. 1–4. [Google Scholar] [CrossRef]
- Barmada, S.; Tucci, M.; Brignone, M.; Nicora, M.; Procopio, R. Neural Network Based Procedure for Lightning Localization. In Proceedings of the ICLP 2024; 37th International Conference on Lightning Protection, Dresden, Germany, 1–7 September 2024; pp. 938–942. Available online: https://ieeexplore.ieee.org/document/10832584 (accessed on 10 September 2025).
- Dodge, S.; Nicora, M.; Barmada, S.; Brignone, M.; Procopio, R.; Tucci, M. A deep learning based lightning location system. Electr. Power Syst. Res. 2025, 242, 111437. [Google Scholar] [CrossRef]
- Nicora, M.; Tucci, M.; Barmada, S.; Brignone, M.; Procopio, R. Lightning Location and Peak Current Estimation From Lightning-Induced Voltages on Transmission Lines With a Machine Learning Approach. IEEE Trans. Electromagn. Compat. 2024, 66, 890–899. [Google Scholar] [CrossRef]
- Diendorfer, G.; Bernardi, M.; Cummins, K.; De La Rosa, F.; Hermoso, B.; Hussein, A.; Kawamura, T.; Rachidi, F.; Rakov, V.; Schulz, W.; et al. Cloud-to-Ground Lightning Parameters Derived from Lightning Location Systems—The Effects of System Performance; WG-C4.404. Electra; CIGRE: Paris, France, 2009. [Google Scholar]
- Orville, R.E.; Weisman, R.A.; Pyle, R.B.; Henderson, R.W.; Orville, R.E., Jr. Cloud-to-ground lightning flash characteristics from June 1984 through May 1985. J. Geophys. Res. Atmos. 1987, 92, 5640–5644. [Google Scholar] [CrossRef]
- Orville, R.; Songster, H. The East Coast Lightning Detection Network. IEEE Trans. Power Deliv. 1987, 2, 899–907. [Google Scholar] [CrossRef]
- Orville, R.E.; Huffines, G.R. Cloud-to-Ground Lightning in the United States: NLDN Results in the First Decade, 1989–98. Mon. Weather Rev. 2001, 129, 1179–1193. [Google Scholar] [CrossRef]
- Nastos, P.T.; Matsangouras, I.T.; Chronis, T.G. Spatio-temporal analysis of lightning activity over Greece — Preliminary results derived from the recent state precision lightning network. Atmos. Res. 2014, 144, 207–217. [Google Scholar] [CrossRef]
- Pierce, E.T. Latitudinal Variation of Lightning Parameters. J. Appl. Meteorol. 1970, 9, 194–195. [Google Scholar] [CrossRef]
- Takeuti, T.; Nagatani, M.; Nakada, H. Thunderstorm activities and related meteorological conditions in the northwest subtropical Pacific. In Proceedings of the Research Institute of Atmospherics; Nagoya University: Nagoya, Japan, 1975. [Google Scholar]
- Harris, D.J.; Salman, Y.E. The measurement of lightning characteristics in northern Nigeria. J. Atmos. Terr. Phys. 1972, 34, 775–786. [Google Scholar] [CrossRef]
- Schulz, W.; Diendorfer, G. Lightning Characteristics as a Function of Altitude Evaluated from Lightning Location Network Data. In Proceedings of the International Conference on Lightning and Static Electricity (ICOLSE), Toulouse, France, 9–12 September 1999. [Google Scholar]
- Peng, C.; Liu, F.; Zhu, B.; Ma, M.; Zhou, H.; Qin, Z.; Lu, G.; Wang, W.; Wang, Y. Observations of single-stroke flashes from five isolated small thunderstorms in East China. J. Atmos. Sol.-Terr. Phys. 2020, 211, 105441. [Google Scholar] [CrossRef]
- Peng, C.; Liu, F.; Zhu, B.; Wang, W. A convolutional neural network for classification of lightning LF/VLF waveform. In Proceedings of the 2019 11th Asia-Pacific International Conference on Lightning (APL), Hong Kong, China, 12–14 June 2019; pp. 1–4. [Google Scholar] [CrossRef]
- Holt, M.A.; Hardaker, P.J.; McLelland, G.P. A lightning climatology for Europe and the UK, 1990–1999. Weather 2001, 56, 290–296. [Google Scholar] [CrossRef]
- Anderson, G.; Klugmann, D. A European lightning density analysis using 5 years of ATDnet data. Nat. Hazards Earth Syst. Sci. 2013, 1, 6877–6922. [Google Scholar] [CrossRef]
- Poelman, D.R.; Schulz, W.; Diendorfer, G.; Bernardi, M. The European lightning location system EUCLID—Part 2: Observations. Nat. Hazards Earth Syst. Sci. 2016, 16, 607–616. [Google Scholar] [CrossRef]
- Kotroni, V.; Lagouvardos, K. Lightning occurrence in relation with elevation, terrain slope, and vegetation cover in the Mediterranean. J. Geophys. Res. Atmos. 2008, 113, D21118. [Google Scholar] [CrossRef]
- Paliaga, G.; Donadio, C.; Bernardi, M.; Faccini, F. High-Resolution Lightning Detection and Possible Relationship with Rainfall Events over the Central Mediterranean Area. Remote Sens. 2019, 11, 1601. [Google Scholar] [CrossRef]
- Petrova, S.; Mitzeva, R.; Kotroni, V.; Peneva, E. Seasonal–Diurnal Distribution of Lightning over Bulgaria and the Black Sea and Its Relationship with Sea Surface Temperature. Atmosphere 2024, 15, 1233. [Google Scholar] [CrossRef]
- Schulz, W.; Cummins, K.; Diendorfer, G.; Dorninger, M. Cloud-to-ground lightning in Austria: A 10-year study using data from a lightning location system. J. Geophys. Res 2005, 110, D09101. [Google Scholar] [CrossRef]
- Poelman, D.R. A 10-Year Study on the Characteristics of Thunderstorms in Belgium Based on Cloud-to-Ground Lightning Data. Mon. Weather Rev. 2014, 142, 4839–4849. [Google Scholar] [CrossRef]
- Bernardi, M.; Ferrari, D. Evaluation of the LLS efficiency effects on the ground flash density, using the Italian lightning detection system SIRF. J. Electrost. 2004, 60, 131–140. [Google Scholar] [CrossRef]
- Biron, D. LAMPINET—Lightning Detection in Italy. In Lightning: Principles, Instruments and Applications: Review of Modern Lightning Research; Betz, H.D., Schumann, U., Laroche, P., Eds.; Springer: Dordrecht, The Netherlands, 2009; pp. 141–159. [Google Scholar]
- IEEE Std. 1410-2010; IEEE Guide for Improving the Lightning Performance of Electric Power Overhead Distribution Lines. IEEE: New York, NY, USA, 2011; pp. 1–73.
- Visacro, S.; Santos, D.C.S.; Silveira, F.H. Assessing the impact of using an elaborate attractiveness model on the calculated lightning performance of transmission lines. In Proceedings of the ICLP 2024; 37th International Conference on Lightning Protection, Dresden, Germany, 1–7 September 2024; pp. 744–749. Available online: https://ieeexplore.ieee.org/document/10832599 (accessed on 10 October 2025).
- Borghetti, A.; Nucci, C.A.; Paolone, M. An improved procedure for the assessment of overhead line indirect lightning performance and its comparison with the IEEE Std. 1410 method. IEEE Trans. Power Deliv. 2007, 22, 684–692. [Google Scholar] [CrossRef]
- Borghetti, A.; Napolitano, F.; Nucci, C.A.; Tossani, F. Influence of the return stroke current waveform on the lightning performance of distribution lines. IEEE Trans. Power Deliv. 2017, 32, 1800–1808. [Google Scholar] [CrossRef]
- Andreotti, A.; Araneo, R.; Mahmood, F.; Piantini, A.; Rubinstein, M. An analytical approach to assess the influence of shield wires in improving the lightning performance due to indirect strokes. IEEE Trans. Power Deliv. 2021, 36, 1491–1498. [Google Scholar] [CrossRef]
- Napolitano, F.; Tossani, F.; Borghetti, A.; Nucci, C.A. Lightning Performance Assessment of Power Distribution Lines by Means of Stratified Sampling Monte Carlo Method. IEEE Trans. Power Deliv. 2018, 33, 2571–2577. [Google Scholar] [CrossRef]
- Napolitano, F.; Tossani, F.; Borghetti, A.; Nucci, C.A.; Rachidi, F. Lightning performance of distribution lines due to positive and negative indirect lightning flashes. In Proceedings of the 2017 IEEE International Conference on Environment and Electrical Engineering and 2017 IEEE Industrial and Commercial Power Systems Europe (EEEIC/I&CPS Europe), Milan, Italy, 6–9 June 2017; pp. 1–5. [Google Scholar]
- Paulino, J.O.S.; Barbosa, C.F.; Lopes, I.J.S.; Boaventura, W.C. Assessment and analysis of indirect lightning performance of overhead lines. Electr. Power Syst. Res. 2015, 118, 55–61. [Google Scholar] [CrossRef]
- Brignone, M.; Delfino, F.; Procopio, R.; Rossi, M.; Rachidi, F. Evaluation of Power System Lightning Performance Part II: Application to an Overhead Distribution Network. IEEE Trans. Electromagn. Compat. 2017, 59, 146–153. [Google Scholar] [CrossRef]
- Nicora, M.; Mestriner, D.; Brignone, M.; Bernardi, M.; Procopio, R.; Fiori, E. A 10-year study on the lightning activity in Italy using data from the SIRF network. Atmos. Res. 2021, 256, 105552. [Google Scholar] [CrossRef]
- Schulz, W.; Diendorfer, G.; Pedeboy, S.; Poelman, D.R. The European lightning location system EUCLID—Part 1: Performance analysis and validation. Nat. Hazards Earth Syst. Sci. 2016, 16, 595–605. [Google Scholar] [CrossRef]
- Collins, M.; Knutti, R.; Arblaster, J.; Dufresne, J.-L.; Fichefet, T.; Friedlingstein, P.; Gao, X.; Gutowski, W.J.; Johns, T.; Krinner, G.; et al. Long-term Climate Change: Projections, Commitments and Irreversibility. In Climate Change 2013—The Physical Science Basis: Working Group I Contribution to the Fifth Assessment Report of the Intergovernmental Panel on Climate Change; Cambridge University Press: Cambridge, UK, 2014; pp. 1029–1136. [Google Scholar]
- Latham, J.; Petersen, W.A.; Deierling, W.; Christian, H.J. Field identification of a unique globally dominant mechanism of thunderstorm electrification. Q. J. R. Meteorol. Soc. 2007, 133, 1453–1457. [Google Scholar] [CrossRef]
- Romps, D.M.; Seeley, J.T.; Vollaro, D.; Molinari, J. Climate change: Projected increase in lightning strikes in the United States due to global warming. Science 2014, 346, 851–854. [Google Scholar] [CrossRef]
- Krause, A.; Kloster, S.; Wilkenskjeld, S.; Paeth, H. The sensitivity of global wildfires to simulated past, present, and future lightning frequency. J. Geophys. Res. Biogeosci. 2014, 119, 312–322. [Google Scholar] [CrossRef]
- Price, C.; Rind, D. Possible implications of global climate change on global lightning distributions and frequencies. J. Geophys. Res. 1994, 99, 10823–10831. [Google Scholar] [CrossRef]
- Price, C.G. Global surface temperatures and the atmospheric electrical circuit. Geophys. Res. Lett. 1993, 20, 1363–1366. [Google Scholar] [CrossRef]
- Clark, S.K.; Ward, D.S.; Mahowald, N.M. Parameterization-based uncertainty in future lightning flash density. Geophys. Res. Lett. 2017, 44, 2893–2901. [Google Scholar] [CrossRef]
- Williams, E.R. Lightning and climate: A review. Atmos. Res. 2005, 76, 272–287. [Google Scholar] [CrossRef]
- Allen, D.J.; Pickering, K.E. Evaluation of lightning flash rate parameterizations for use in a global chemical transport model. J. Geophys. Res. Atmos. 2002, 107, 15–21. [Google Scholar] [CrossRef]
- Finney, D.L.; Doherty, R.M.; Wild, O.; Young, P.J.; Butler, A. Response of lightning NOx emissions and ozone production to climate change: Insights from the Atmospheric Chemistry and Climate Model Intercomparison Project (ACCMIP). Geophys. Res. Lett. 2016, 43, 5492–5500. [Google Scholar] [CrossRef]
- Cummins, K.L.; Krider, E.P.; Malone, M.D. The U.S. National Lightning Detection Network and Applications of Cloud-to-Ground Lightning by Electric Power Utilities. IEEE Trans. Electromagn. Compat. 1998, 40, 465–480. [Google Scholar] [CrossRef]
- Cummins, K.; Cramer, J.A.; Biagi, C.; Krider, E.; Jerauld, J.; Uman, M.A.; Rakov, V. The U.S. national lightning detection network: Post-upgrade status. In Proceedings of the 86th AMS Annual Meeting, Atlanta, GA, USA, 29 January–2 February 2006. [Google Scholar]
- Kirshbaum, D.J.; Wang, C. Boundary Layer Updrafts Driven by Airflow over Heated Terrain. J. Atmos. Sci. 2014, 71, 1425–1442. [Google Scholar] [CrossRef]
- Rakov, V.A. A Review of Positive and Bipolar Lightning Discharges. Bull. Am. Meteorol. Soc. 2003, 84, 767–776. [Google Scholar] [CrossRef]
- Rakov, V.; Huffines, G. Return-Stroke Multiplicity of Negative Cloud-to-Ground Lightning Flashes. J. Appl. Meteorol. 2003, 42, 1455–1462. [Google Scholar] [CrossRef]
- Biagi, C.; Cummins, K.; Kehoe, K.; Krider, E. National Lightning Detection Network (NLDN) performance in southern Arizona, Texas, and Oklahoma in 2003–2004. J. Geophys. Res. 2007, 112, D05208. [Google Scholar] [CrossRef]
- Saraiva, A.; Saba, M.; Pinto, O.; Cummins, K.L.; Krider, E.; Campos, L. A comparative study of negative cloud-to-ground lightning characteristics in São Paulo (Brazil) and Arizona (United States) based on high-speed video observations. J. Geophys. Res. 2010, 115, D11102. [Google Scholar] [CrossRef]
- Poelman, D.R.; Schulz, W.; Vergeiner, C. Performance Characteristics of Distinct Lightning Detection Networks Covering Belgium. J. Atmos. Ocean. Technol. 2013, 30, 942–951. [Google Scholar] [CrossRef]
- Berger, K. Novel observations on lightning discharges: Results of research on Mount San Salvatore. J. Frankl. Inst. 1967, 283, 478–525. [Google Scholar] [CrossRef]
- Berger, K. Blitzstrom-Parameter von Aufwartsblitzen. Bull. Schweiz. Elektrotech. 1978, 69, 353–360. [Google Scholar]
- Berger, K.; Anderson, R.B.; Kroninger, H. Parameters of lightning flashes. Electra 1975, 41, 23–37. [Google Scholar]
- Berger, K.; Vogelsanger, E. Photographische Blitzuntersuchungen der Jahre 1955–1965 auf dem Monte San Salvatore. Bull. Schweiz. Elektrotech. Ver 1966, 57, 599–620. [Google Scholar]
- Anderson, R.B.; Eriksson, A.J. Lightning Parameters for Engineering Application. Electra 1980, 69, 65–102. [Google Scholar]
- Geldenhuys, H.; Eriksson, A.J.; Bourn, G.W. Fifteen years’ data of lightning current measurements on a 60 m mast. Trans. S. Afr. Inst. Electr. Eng. 1989, 80, 98–103. [Google Scholar]
- Narita, T.; Yamada, T.; Mochizuki, A.; Zaima, E.; Ishii, M. Observation of current waveshapes of lightning strokes on transmission towers. IEEE Trans. Power Deliv. 2000, 15, 429–435. [Google Scholar] [CrossRef]
- Visacro, S.; Soares Jr, A.; Schroeder, M.A.O.; Cherchiglia, L.C.L.; de Sousa, V.J. Statistical analysis of lightning current parameters: Measurements at Morro do Cachimbo Station. J. Geophys. Res. Atmos. 2004, 109, D01105. [Google Scholar] [CrossRef]
- Rakov, V.A.; Uman, M.A.; Rambo, K.J.; Fernandez, M.I.; Fisher, R.J.; Schnetzer, G.H.; Thottappillil, R.; Eybert-Berard, A.; Berlandis, J.P.; Lalande, P.; et al. New insights into lightning processes gained from triggered-lightning experiments in Florida and Alabama. J. Geophys. Res. Atmos. 1998, 103, 14117–14130. [Google Scholar] [CrossRef]
- Uman, M.A.; McLain, D.K. Magnetic field of lightning return stroke. J. Geophys. Res. 1969, 74, 6899–6910. [Google Scholar] [CrossRef]
- Rachidi, F.; Bermudez, J.L.; Rubinstein, M.; Rakov, V.A. On the estimation of lightning peak currents from measured fields using lightning location systems. J. Electrost. 2004, 60, 121–129. [Google Scholar] [CrossRef]
- Li, Q.; Wang, J.; Cai, L.; Zhou, M.; Fan, Y. On the return-stroke current estimation of Foshan Total Lightning Location System (FTLLS). Atmos. Res. 2021, 248, 105194. [Google Scholar] [CrossRef]
- Mallick, S.; Rakov, V.; Hill, J.; Ngin, T.; Gamerota, W.R.; Pilkey, J.; Jordan, D.M.; Uman, M.A.; Heckman, S.; Sloop, C.; et al. Performance Characteristics of the ENTLN Evaluated Using Rocket-Triggered Lightning Data. Electr. Power Syst. Res. 2014, 118, 15–18. [Google Scholar] [CrossRef]
- Schulz, W.; Poelman, D.; P’edeboy, S.; Vergeiner, C.; Meteorage, O.-A.; Pichler, H.; Diendorfer, G. Performance validation of the European Lightning Location System EUCLID. In Proceedings of the International Colloquium on Lightning and Power Systems (CIGRE), Lyon, France, 12–14 May 2014. [Google Scholar]
- Zhu, Y.; Rakov, V.A.; Tran, M.D.; Stock, M.G.; Heckman, S.; Liu, C.; Sloop, C.D.; Jordan, D.M.; Uman, M.A.; Caicedo, J.A.; et al. Evaluation of ENTLN Performance Characteristics Based on the Ground Truth Natural and Rocket-Triggered Lightning Data Acquired in Florida. J. Geophys. Res. Atmos. 2017, 122, 9858–9866. [Google Scholar] [CrossRef]
- Sargent, M.A. The Frequency Distribution of Current Magnitudes of Lightning Strokes to Tall Structures. IEEE Trans. Power Appar. Syst. 1972, PAS-91, 2224–2229. [Google Scholar] [CrossRef]
- Borghetti, A.; Nucci, C.A.; Paolone, M. Estimation of the statistical distributions of lightning current parameters at ground level from the data recorded by instrumented towers. IEEE Trans. Power Deliv. 2004, 19, 1400–1409. [Google Scholar] [CrossRef]
- Banerjee, A.; Archibald, A.T.; Maycock, A.C.; Telford, P.; Abraham, N.L.; Yang, X.; Braesicke, P.; Pyle, J.A. Lightning NOx, a key chemistry–climate interaction: Impacts of future climate change and consequences for tropospheric oxidising capacity. Atmos. Chem. Phys. 2014, 14, 9871–9881. [Google Scholar] [CrossRef]
- Tost, H.; Jöckel, P.; Lelieveld, J. Lightning and convection parameterisations—Uncertainties in global modelling. Atmos. Chem. Phys. 2007, 7, 4553–4568. [Google Scholar] [CrossRef]
- Jacobson, M.Z.; Streets, D.G. Influence of future anthropogenic emissions on climate, natural emissions, and air quality. J. Geophys. Res. 2009, 114, D08118. [Google Scholar] [CrossRef]
- Reeve, N.; Toumi, R. Lightning activity as an indicator of climate change. Q. J. R. Meteorol. Soc. 1999, 125, 893–903. [Google Scholar] [CrossRef]
- Liu, Y.; Williams, E.; Guha, A.; Sátori, G.; Neto, O.P.; Said, R.; Holzworth, R.; Virts, K.; Lang, T.; Zhu, Y.; et al. Reduction in global lightning activity during the COVID pandemic. J. Geophys. Res. Atmos. 2025, 130, e2024JD042319. [Google Scholar] [CrossRef]
- Spearman, C. The proof and measurement of association between two things. Am. J. Psychol. 1904, 15, 72–101. [Google Scholar] [CrossRef]
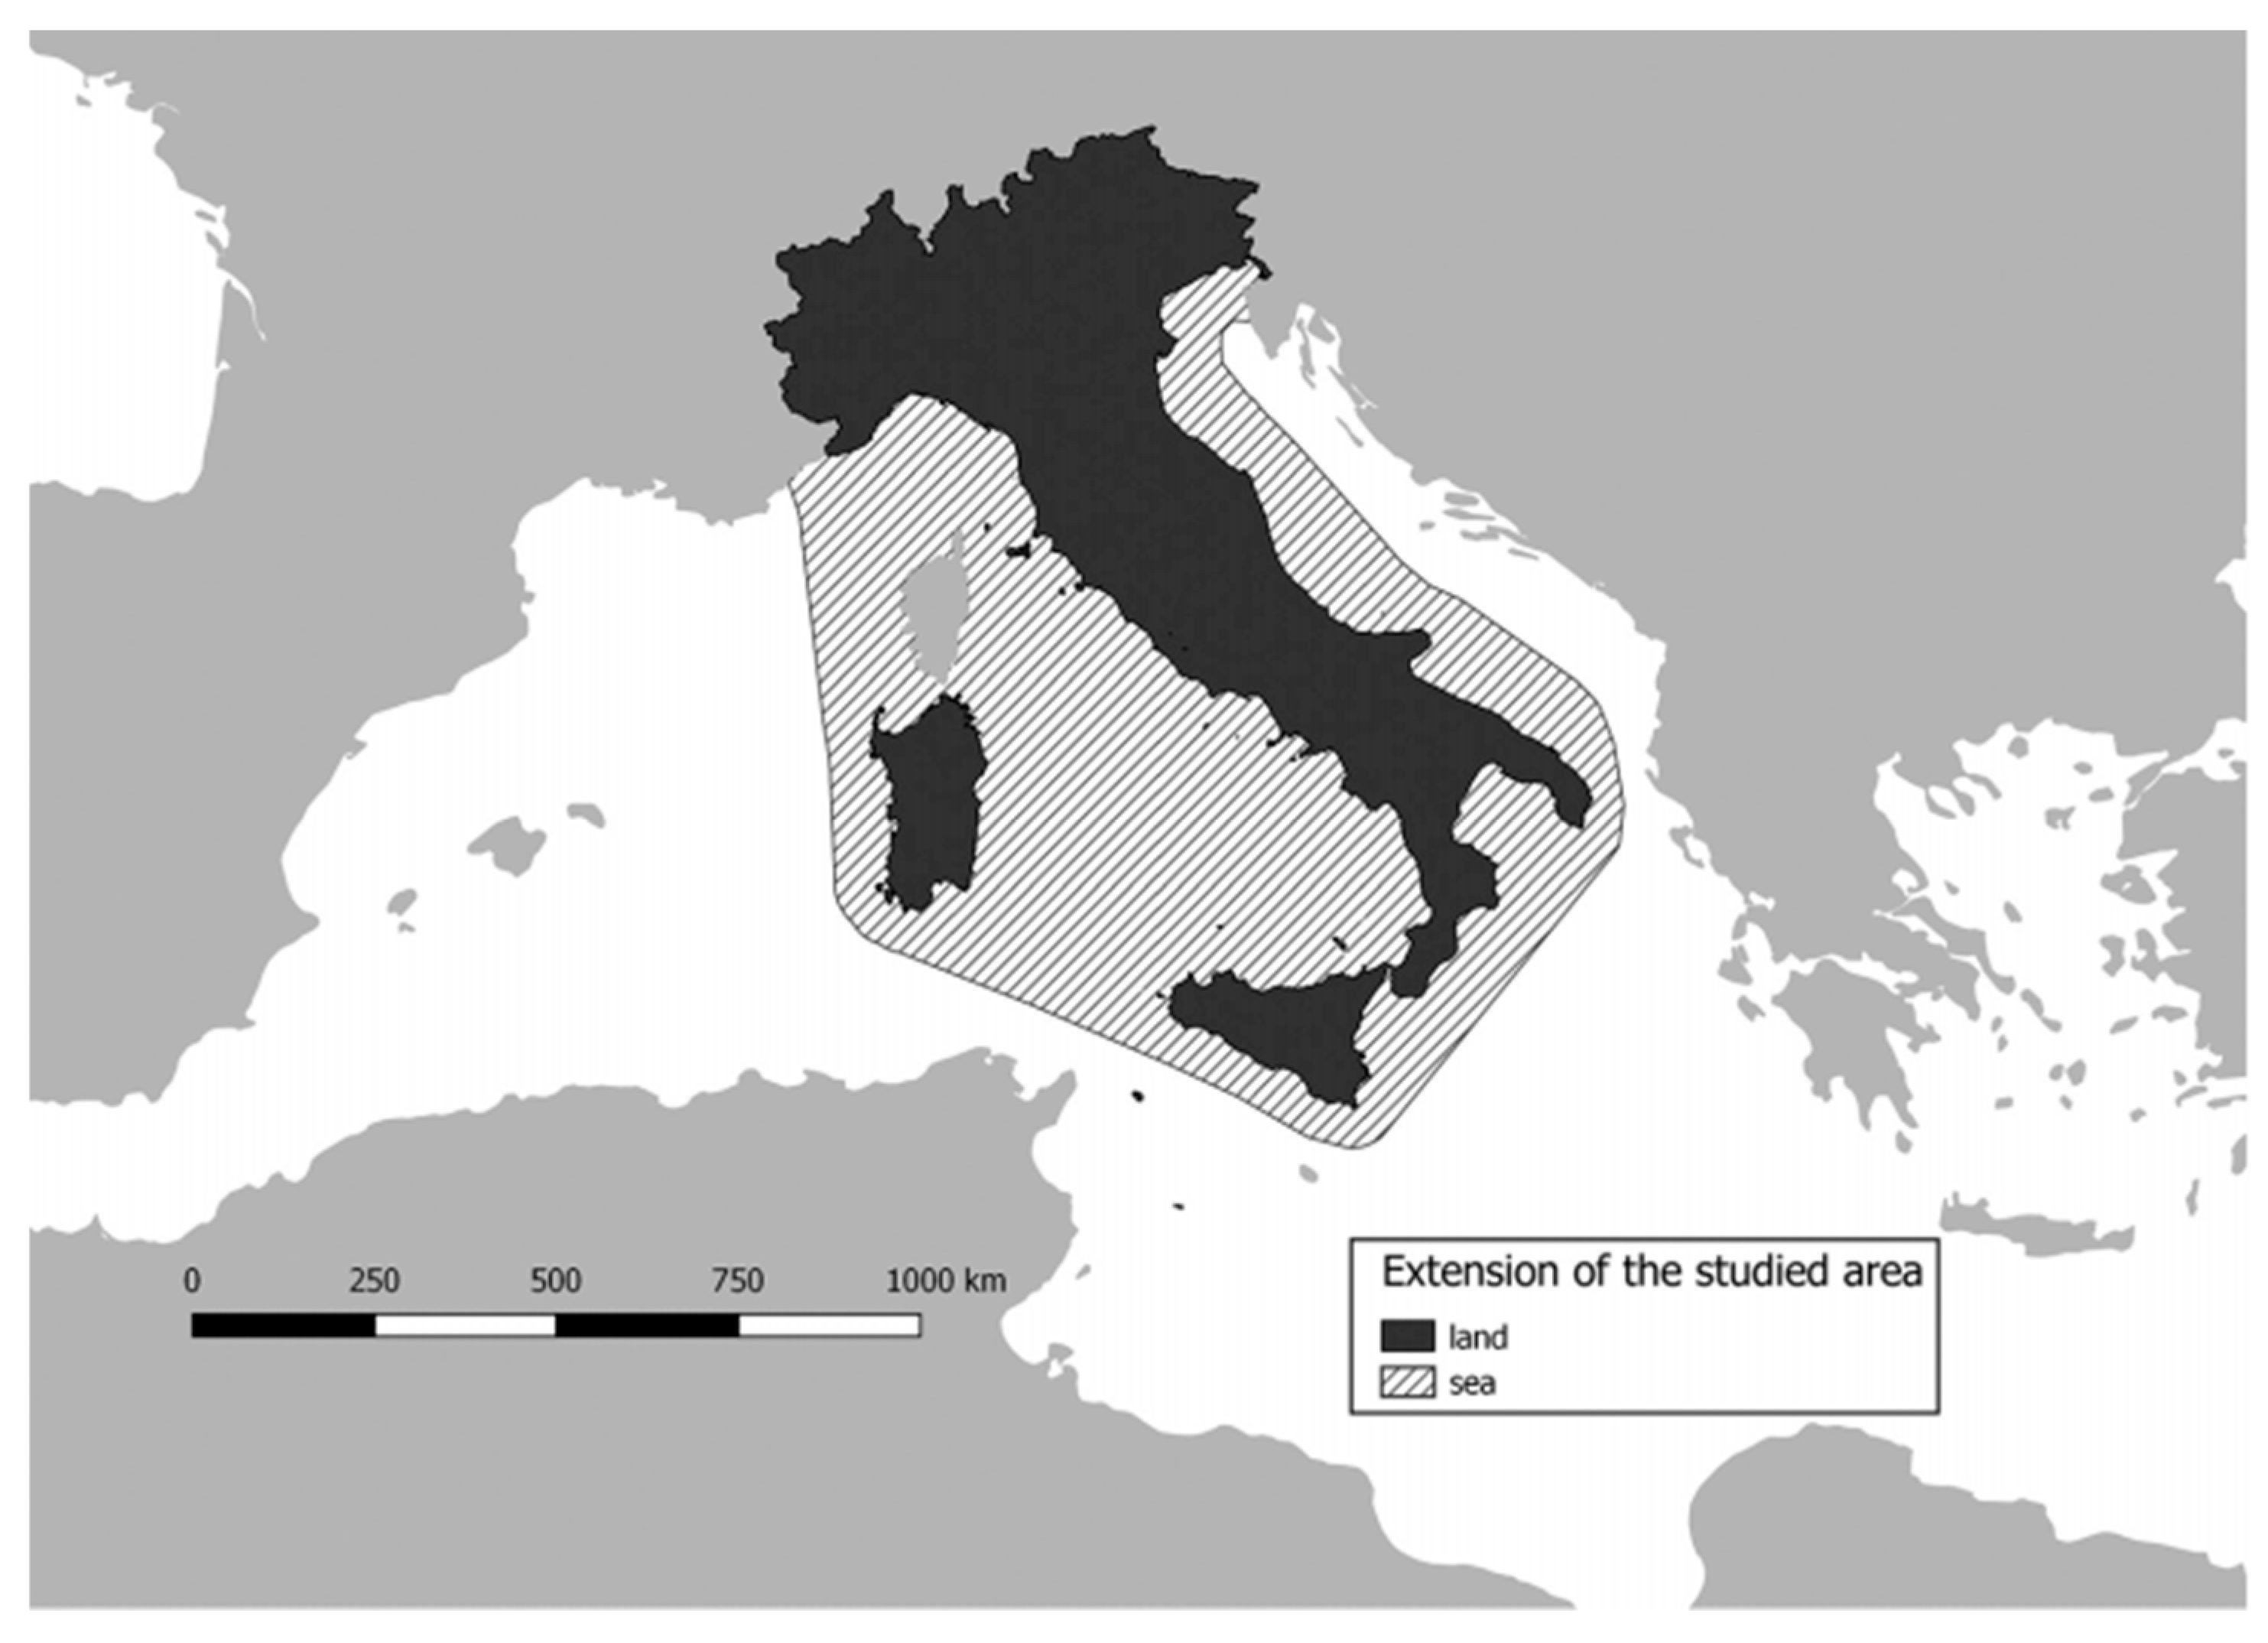
Disclaimer/Publisher’s Note: The statements, opinions and data contained in all publications are solely those of the individual author(s) and contributor(s) and not of MDPI and/or the editor(s). MDPI and/or the editor(s) disclaim responsibility for any injury to people or property resulting from any ideas, methods, instructions or products referred to in the content. |
© 2025 by the authors. Licensee MDPI, Basel, Switzerland. This article is an open access article distributed under the terms and conditions of the Creative Commons Attribution (CC BY) license (https://creativecommons.org/licenses/by/4.0/).