Article

Stress Distribution Around Roadway of Kunyang No. 2 Phosphate Mine: Analytical Study and Field Verification

1
Faculty of Land Resources Engineering, Kunming University of Science and Technology, Kunming 650093, China
2
Yunnan Yuntianhua Co., Ltd., Kunming 650228, China
3
National Engineering and Technology Research Center for Development and Utilization of Phosphorus Resources, Kunming 650600, China
*
Authors to whom correspondence should be addressed.
Appl. Sci. 2025, 15(20), 11002; https://doi.org/10.3390/app152011002
Submission received: 28 August 2025 / Revised: 3 October 2025 / Accepted: 6 October 2025 / Published: 14 October 2025

Abstract

When excavating roadways in underground mines, stress redistribution within the surrounding rock mass leads to stress concentration and release. Should the concentrated stresses exceed the rock mass’s tensile or shear strength, rock deformation and failure occur. Thus, a knowledge of stress distribution around the roadway is of great significance for revealing the roadway instability mechanism and design support methods. In this work, the powerful complex variable function theory was used to solve the surrounding rock stress around the triple-arched roadway and the analytical results were verified with the on-site stress state. The results show that the tensile stress occurs on the roadway roof and floor under low lateral stress coefficients, while concentrated compressive stress emerges on the two sidewalls. However, the surrounding stress distribution exhibits an opposite characteristic under high stress levels. Beyond five times the roadway radius, the stress in the surrounding rock is unaffected by the roadway and approaches the in-situ stress. For the +1890 m level trackless transport roadway in Kunyang No. 2 phosphate mine, it is further calculated that the minimum stress concentration factor in the rib area of the roadway within the stress relief zone is 0.34, while the maximum stress concentration factor in the concentrated stress zone of the roof, floor, and sidewalls of the roadway is 5.87. The measured stress values of two monitoring points in the surrounding rock of this roadway are fairly consistent with the analytical values, suggesting the complex variable method for solving excavation-induced stresses are effective and reliable.

1. Introduction

Phosphate rock, as a highly distinctive and scarce strategic mineral resource, is commonly used to produce phosphate fertilizers, yellow phosphorus, phosphoric acid, phosphides, and other phosphates. It finds extensive applications in agriculture, industry, food, medicine, and other fields. According to the statistics from the United States Geological Survey [1], the global basic reserve of phosphate rock reaches 74 billion tons. Among the countries or regions, Morocco alone accounts for 50 billion tons. By contrast, China ranks second globally, with reserves of 3.7 billion tons, concentrated primarily in four provinces: Hubei (30.1%), Sichuan (20.3%), Guizhou (18.2%), and Yunnan (18.1%). The average P2O5 grade is 16.9%, predominantly occurring as thin to medium-thick ore bodies with gentle to steep inclines. In 2024, the total production of phosphate rock in China reached 114 million tons, accounting for 48.31% of the global total, with 65% sourced from underground mining.
Over the years, extensive over-exploitation has led to the gradual depletion of shallow phosphate resources. Phosphate mining has gradually shifted from open-pit to underground operations, moving from shallow to deeper levels, and exhibiting a trend toward concentrated and large-scale development. Consequently, underground mining has become the main method of phosphate mining in China today. This approach typically requires the excavation of extensive shaft and tunnel systems to access the ore body, followed by the development of the ore deposit and the preparation, cutting, and extraction of the ore blocks. Currently, China has identified 173 types of minerals and constructed over 30,000 underground mines, with annual excavation of various types of roadways reaching 15,000 km in length. Clearly, roadway construction and maintenance play an extremely important role in underground mining. When excavating roadways within rock masses, the original in situ stress equilibrium is disrupted, causing stress redistribution and resulting in stress concentration or transient stress release. When the stability of the surrounding rock is unable to support itself, failure to provide timely and effective support can easily lead to roof collapses, sidewall spalling, large deformations, rock bursts, and water inrushes. Taking the Kunyang No. 2 phosphate mine of Yunnan Phosphate Chemical Group Co., Ltd. in Kunming, China as an example, frequent roof collapse occurs in the roadways during the construction process, as shown in Figure 1. From a mechanical perspective, the deformation and failure of rock masses are the result of stress driving, and rock mass instability occurs when rock stress exceeds its tensile or shear strength. Therefore, a knowledge of the stress distribution characteristics in surrounding rock is of great significance, as it not only helps to reveal the mechanism of roadway instability but also provides valuable references for roadway layout and support design.
A substantial effort has been made to investigate the stress distribution around openings using various research methods. To explore the connection between stresses near mine excavations and causing failures, Van Poollen [2] first performed photoelastic experiments on Columbia Resin plates containing one rectangular, one circular, or one triangular opening under uniaxial compression, and claimed that the stress patterns around the openings can be obtained. Based on this, the extent of failure and the critical stresses at which the failure occurs were calculated. Afterwards, Hoek [3] conducted photoelastic analysis on granite specimens with a circular hole under biaxial loading and found that three types of cracks are formed near the hole, namely primary tensile cracks on the roof and floor, spalling cracks on the sidewalls, and remote cracks on the corners. As a scientific research method with advantages such as intuitiveness, controllability, and safety, similar simulation tests are widely applied in mining engineering to reproduce the mechanical response caused by roadway excavation. Thus, Tian et al. [4] carried out a physical model experiment and successfully examined the surrounding stress of deviatoric pressure roadway with rectangular cross-section by embedding numerous miniature boxes in the model. It is found that high deviatoric pressure stress is concentrated on both sides of the roadway, while the stress value in the middle of the roadway roof is small. Based on the physical model tests, Qiu et al. [5] further argued that the peak radial stresses perpendicular to the inner walls of the horseshoe roadway and their corresponding times are different due to the different blasting locations. Since numerical simulation methods are economical and convenient, they provide a means of understanding the excavation-induced stress distribution law. For instance, Meng et al. [6] employed the Flac3d program to establish a three-dimensional model of the horseshoe-shaped tunnel at the Zhujixi mine and believed that the maximum stress value in the surrounding rock increases and reduces as the burial depth and lateral pressure coefficient grow, respectively. By means of a self-invented UDEC Trigon approach, Gao et al. [7] obtained the major principal stress distribution around the rectangular squeezing roadway at Zhangcun mine, with a maximum stress value of 14 MPa on the roadway ribs. Sun et al. [8] hold that the maximum and minimum principal stresses on the ribs of the circular cavity decrease and increase, respectively, by 3DEC modeling, and the numerical results were found to be consistent with the experimental results. Through ANSYS finite element analysis software, Sakhno et al. [9,10] concluded that a zone of reduced maximum principal stresses is formed in the floor of the roadway, and the stress is 2–3 times less than outside the area of the roadway influence. Tao et al. [11] used the LS-DYNA program to display the dynamic stress concentration factors around a circular cavity under coupled static pre-stress and impact loading. Moreover, other programs, such as PFC and Rocscience, have also been adopted to simulate the stress distribution around horseshoe and trapezoidal roadways, which provides new approaches to studying the deformation and failure mechanisms of roadways. Additionally, field measurement methods are also utilized for the research of stress distribution in roadways, given the reliability of the results obtained by this method. To understand the mining-induced stress distribution rules of laneway at the Beiminghe iron mine, Ouyang et al. [12] measured that the maximum stress concentration coefficient is 1.85 by using MC type bore-hole stress gauges. By monitoring the electromagnetic radiation from the rock mass, Qiu et al. [13] proposed a novel measurement method for determining the surrounding stress field of coal mine roadways. Liu et al. [14] held that a micro-seismic monitoring technique is effective in evaluating stress regime, which can be used for measuring the excavation-induced stress around the roadway. Based on the principle of charge induction, Wang et al. [15] further put forward a rapid and accurate method for detecting the stress distribution around the roadway. In summary, the above-mentioned methods for determining the surrounding stress of tunnels, both in the laboratory and in the field, provide some beneficial insights into the deformation and failure mechanisms of roadways in mines and tunnels in hydraulic or transportation engineering.
Generally, numerical modelling methods are not very reliable due to the influence of modelling parameter values, while field measurement methods are costly as plenty of measuring points are essential. In contrast, the analytical method for determining the stress around holes is believed to be the most economical and relatively accurate, and it is of great reference value for determining the stress distribution around roadways. As early as 1898, the expressions of the shear, radial, and tangential stresses at any point around a circular hole in an elastic plate were derived by Kirsch, namely through the Kirsch equation [16]. With respect to these stress components around an elliptical hole, Inglis [17] then obtained the strict analytical solution on the basis of elastic mechanics theory. However, the literature on the study of stress analytical solutions for complex-shaped holes is limited. This is because it is difficult to solve their stress solutions using traditional elasticity theory. In our previous work [18,19,20], the radial stress and tangential stress of any point on the periphery of circular, inverted U-shaped, trapezoid, rectangular, and square openings have been successfully analyzed by the complex variable approach, and the theoretical results have been proven to be scientifically reliable. In metal and non-metal mines, the cross-sectional shape of roadways is mostly a three-center arch shape, but relative attempts for the stress analysis solution are rarely reported and further theoretical investigations are needed. In this study, the stress distribution of a three-centered arch roadway at Kunyang No. 2 phosphate mine in China was analytically derived with the aid of complex variable theory, and then the research findings were validated through on-site measurement. This study is of great significance and provides a scientific basis for research into the deformation and failure mechanisms of the roadways in mines, as well as for roadway engineering layout and support design.

2. Calculation Principles for Analytical Solutions of Excavation-Induced Stress

Considering that the underground deep-buried roadway is infinitely long along its cross-sectional axis and that all stress components, strain components, and displacement components remain unchanged accordingly, the calculation of stress around a rock roadway can be simplified as a plane strain problem. That is, it is equivalent to solving the stress in the vicinity of an opening in an infinite plate in accordance with elasticity theory. In the field of mechanics, underground rock masses are usually assumed to be isotropic, homogeneous, and continuous elastic media. The solution of stress problems involving hole conditions requires the prior assumption of the expressions of the Airy stress function or stress component functions, followed by the determination of the unknown coefficients based on the boundary conditions. Clearly, when the boundary conditions, e.g., non-circular hole shapes, are complex, it is difficult to assume the expressions of the Airy function or stress component functions. This makes it impossible to solve the stress solution. In contrast, the complex function method does not require such assumptions. This is because the complex function form of a biharmonic function can be directly expressed by using two analytic functions, and then boundary conditions are utilized to perform calculations according to a complete set of solutions, effectively solving the stress problems of complex-shaped openings.

2.1. Complex Variable Function Theory

In accordance with the principles of elasticity mechanics, the stress solution of plane strain problems comes down to solving a fourth-order partial differential equation for Airy stress functions combined with stress boundary conditions, i.e., compatibility equations:
4 U x , y x 4 + 2 4 U x , y x 2 y 2 + 4 U x , y y 4 = 0
where U(x,y) is the Airy stress function, which is a double harmonic function of x and y.
From Equation (1), the expressions of the three stress components can be written as
σ x = 2 U x , y y 2 - f x x ,   σ y = 2 U x , y x 2 - f y y ,   τ x y = - 2 U x , y x y
where σx and σy denote the normal stress components in the x-axis and y-axis directions, respectively, while τxy represents the shear stress component tangential to the x-y plane. fx and fy mean the volume force components acting on the object along the x-axis and y-axis, respectively.
Generally, the volume force of elastic bodies can be ignored since the stress gradient caused by gravity has little effect on the stress distribution around the opening in mining engineering. Therefore, the stress components can be easily solved provided that the U(x,y) is known. The inverse method is typically used to solve the U(x,y), i.e., by first assuming the expression form of the U(x,y), and then solving for the unknowns in the expression based on the boundary conditions. However, when the boundary conditions are complex, such as the shape of the opening is non-circular or the external load is unconventional, it is difficult to assume the expression form of the U(x,y). This makes it difficult to solve the stress components using conventional methods. The literature indicates that the complex variable function theory is promising for solving the plain problem under the condition of complex opening shape or external load [21]. In Muskhelishvili’s theory, the Airy stress function U(x,y) for a plane problem is expressed in the form (well-known Goursat formulism) as follows [22]:
U z = Re θ z + z ¯ φ z
where z (z = x + iy, i is the imaginary unit and satisfies i2 = −1) and z ¯ ( z ¯ = xiy) are the complex number and its conjugates, respectively. θ(z) and φ(z) denote two analytical functions about z. Re[f(z)] represents the real part of the complex function f(z).
Substituting Equation (3) into Equation (2), the three stress components can be expressed by
σ x + σ y = 4 Re φ z σ y σ x + 2 i τ x y = 2 z ¯ φ z + ψ z
where φ′(z) and φ″(z) denote the first derivative and second derivative of the analytical function φ(z), whilst ψ′(z) means the first derivative of function ψ′(z) that ψ(z) is defined as the first derivative of the analytical function θ(z); that is, ψ(z) = θ′(z), ψ′(z) = θ″(z).
For stress solutions in single (multiple) connected domains, considering the single-valued nature of stress and displacement, φ(z) and ψ(z) can be derived as follows:
φ z = 1 2 π 1 + κ X + i Y ln z + B + i C z + φ 0 z ψ z = κ 2 π 1 + κ X i Y ln z + B + i C z + ψ 0 z
In Equation (5), κ means a real constant that κ = 3 − 4μ in the case of a plain strain problem, where μ is the Poisson’s ratio of the plate. X and Y are the physical force components along the x-axis and y-axis directions at the edge of the hole. If there is no external load at the hole edge, such as when the surrounding medium around the opening is not supported, the values of X and Y are zero. In addition, B, B′, C, and C′ are all real constants, with the following formulas: B = (σx + σy)/4, B′ = (σyσx)/2, C′ = τxy, where σx, σy, and τxy are the uniformly distributed stresses at infinity. According to the substitution principle of analytical functions, C can be taken as zero. φ0(z) and ψ0(z) are both single-valued analytic functions in the region of infinity, and can be determined by the following Laurent expansions:
φ 0 z = n = 1 a n z n ;   ψ 0 z = n = 1 b n z n
where n means the positive integer. an and bn denote constants. If there is no external load at the hole boundary, they are real constants; otherwise, they are complex constants.
Additionally, the stress boundary condition can also be expressed in the form of complex functions yields:
φ z + z φ z ¯ + ψ z ¯ = i M N X n + i Y n d s
With respect to Equation (7), the upper and lower limits of integration M and N are the starting and ending points of the integration taken on the hole boundary, respectively. Xn and Yn are the physical force components given along the x-axis and y-axis on the boundary, respectively. Xn = σxl + τxym, Yn = τxyl + σym, where l and m are the cosines of the direction of the unit normal vector n at the boundary point under consideration, l = cos(n, x) = dy/ds, m = cos(n, y) =dx/ds. If there is no support acting on the hole boundary, i.e., the hole edge is not subjected to external forces, then Xn and Yn are both zero.

2.2. Conformal Transformation for Complex-Shaped Hole

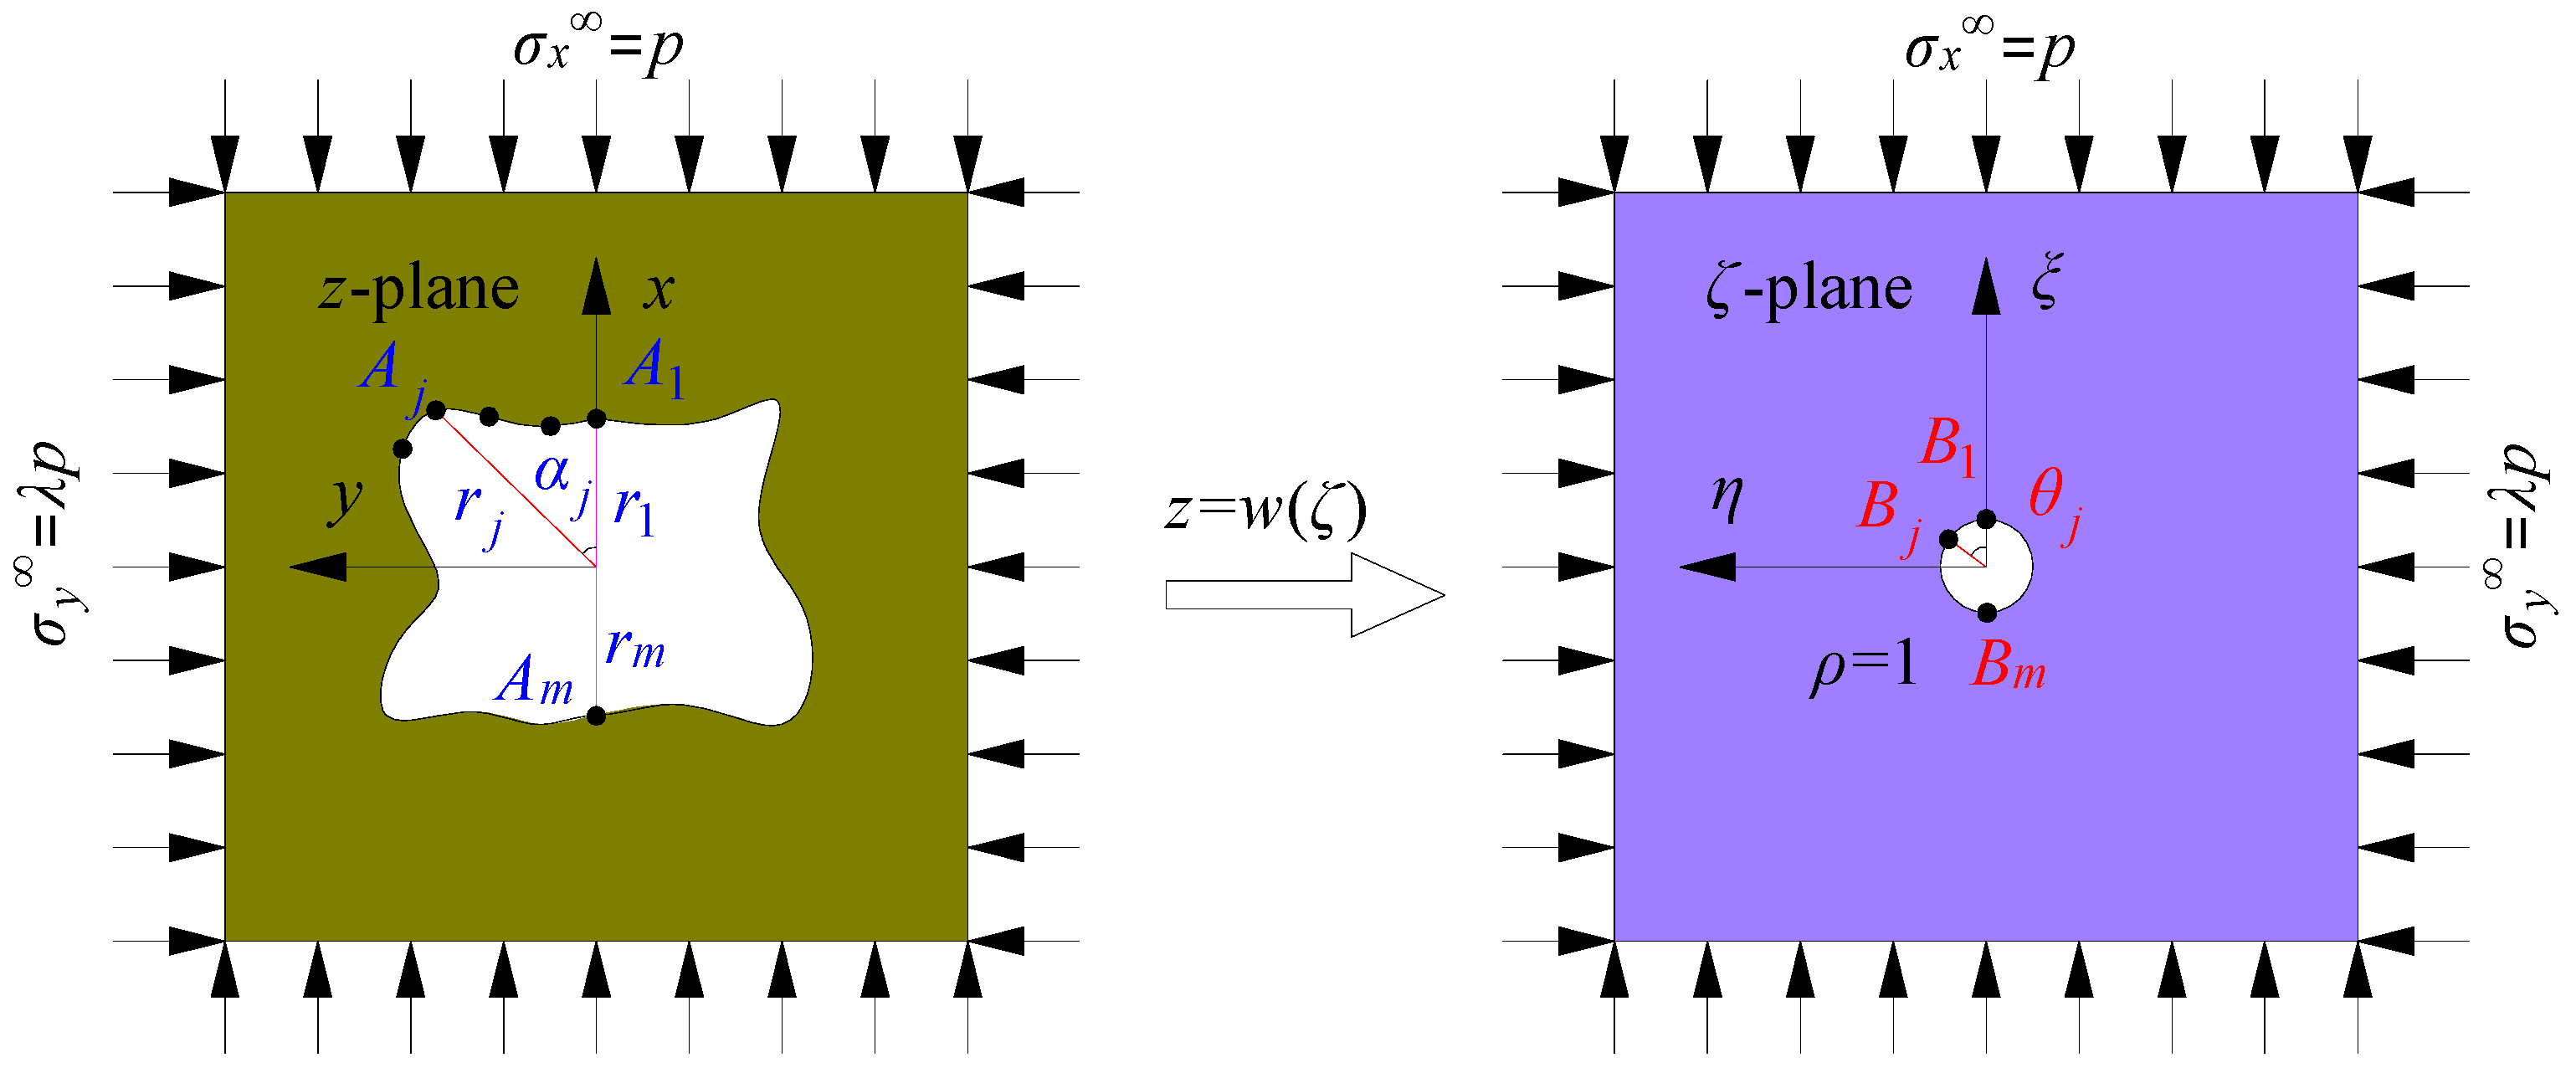
From Equation (4), it can be seen that the key to solving the surrounding stress solutions of openings with complex boundary conditions is to determinate the two analytical functions φ(z) and ψ(z). For this purpose, conformal transformation is effectively applied to solve this issue. The essence of conformal transformation is to convert complex geometric problems into simpler forms that are easier to handle through mathematical transformations that preserve local angles. Typically, a mapping function z = w(ζ) (ζ = ξ + ) is used to map the complex irregular boundaries of holes and the surrounding area in the physical plane z to the unit circle and the area outside or inside the circle in the image plane ζ, as shown in Figure 2. According to Riemann’s theorem, any point or line on the physical plane has a corresponding point or line on the image plane through conformal transformation. For instance, point Bj(j = 1, 2, 3, …, m) in ζ-plane is the only mapping point of point Aj in z-plane. In other words, a point on a complex hole boundary has a unique mapping point on the unit circle, but the polar angles of the two may be different. The far-field stress conditions for a plate with a hole are as follows: vertical stress p, horizontal stress λp, where λ is the lateral stress coefficient.
By introducing z = w(ζ), the expression of Equation (4) can be rewritten with regard to the variable ζ; that is,
σ ρ + σ θ = 4 Re Φ ζ σ θ - σ ρ + 2 i τ ρ θ = 2 ζ 2 ρ 2 w ζ w ζ ¯ Φ ζ + w ζ Ψ ζ
In Equation (8), σρ, σθ, and τρθ denote the radial stress, tangential stress, and shear stress, respectively, of a point with polar coordinates z = (r, a) in z-plane. ρ and θ represent the polar radius and polar angle of its mapped point in ζ-plane w′(ζ) and w ζ ¯ mean the first derivative and the conjugate of the mapping function w(ζ). Ψ(ζ) and Φ(ζ) are two complex potential functions, and are defined as
Φ ζ = φ ζ w ζ , Ψ ζ = = ψ ζ w ζ
Combining Equations (5) and (6), the aforementioned complex potential functions can be calculated by substituting z with ζ. Moreover, Equation (7), concerning the stress boundary condition, can be further simplified as
φ 0 σ + w σ w σ ¯ φ 0 σ ¯ + ψ 0 σ ¯ = f σ - 2 B w σ - B - i C w σ ¯
where σ represents the points on the unit circle in ζ-plane, namely ζ = σ. In this study, the influence of roadway support on stress distribution around the opening is ignored; therefore, Xn and Yn are both zero, i.e., f(σ) = ∫(Xn + iYn)ds = 0.
To summarize, the process of solving stress solutions for the opening can be summarized as follows. First, the conformal transformation method was employed to map the surrounding region of the opening in z-plane to the area outside the unit circle in ζ-plane; then, the mapping function z = w(ζ) needs to be solved and its mapping accuracy should be further verified. Second, by substituting the mapping function into Equation (10) and incorporating Equation (6), the unknown constants an and bn in Equation (6) can be determined using power series method. Next, the two complex potential functions Ψ(ζ) and Φ(ζ) can be derived based on Equations (6) and (9). Finally, the stress components σρ, σθ, and τρθ of any point in the surrounding rock can be achieved by solving the system of Equation (4).

2.3. Determination of Mapping Function

From Riemann’s theorem, it is known that the mapping function of any hole exists, and w(ζ) is definitely an analytic function. Regarding the solution of mapping functions, scholars have conducted extensive research and proposed various calculation methods, such as the Melin–Chierov graphing method, polygon method, odd-even interpolation iterative method, Schwarz–Christoffel mixed penalty function method, three absolutely convergent series multiplication method, inversion iterative method, boundary point search method, and equivalent radius method. Considering that the aforementioned methods require a solid mathematical foundation and involve cumbersome computational processes, an effective and reliable approach combining complex methods was adopted to deal with it.
According to elasticity theory, the mapping function can be expanded in the form of a Taylor series or a Laurent series; therefore, the expression of the mapping function can be formulated as
z = ω ( ζ ) = R ( ζ + k = 0 C k ζ k ) ,   ζ 1
where R is a positive real number that reflects the size of the hole. The larger R is, the more irregular and smooth the hole boundary is. Ck (k is natural number) is a complex constant that reflects the hole shape. If the hole has an axis of symmetry, Ck is a real constant. Nevertheless, studies indicate that the mapping accuracy is high enough when the finite term Ck is taken for Equation (11) [16].
As can be seen in Figure 2, point Bj = (1, θj) is the mapping point of point Aj = (rj, αj), and thus we have
z = r j e i α j , ζ = e i θ j
Introducing Equation (12) into Equation (11) and decomposing both sides of the equation according to Euler’s principle leads to
r j cos α j + i sin α j = R cos θ j + i sin θ j + K = 0 C K cos k θ j i sin k θ j
Simplifying both sides of Equation (13) into real and imaginary parts, we obtain
sin ( α j θ j ) + k = 0 C k sin ( α j + k θ j ) = 0 r j = R cos ( α j θ j ) + k = 0 C k cos ( α j + k θ j )
As shown in Figure 2, if the left part of the hole boundary with an axis of symmetry in z-plane was divided evenly into (m − 1) parts, m points would be formed, namely A1, A2, …, Am. Correspondingly, there are also m mapping points formed on the boundary of the left half of the unit circle in ζ-plane. Obviously, points A1 = (r1, 0) and Am = (rm, π) and mapping points B1 = (1, 0) and Bm = (1, π) correspond to each other, and the polar angle remains unchanged. Consequently, the relationship between R and Ck can be obtained by substituting the coordinate values of points A1 and B1 into the second sub-equation in Equation (14), namely
R = r 1 / 1 + k = 0 C k
In Equation (14), when the number of Ck terms is limited to h, i.e., k = 0, 1, 2, …, h − 1, solving for the unknowns Ck and θj in Equation (4) is equivalent to solving for the solution of the following objective function tending towards zero.
min f C k , θ j = j = 1 m r j r 1 cos ( α j θ j ) + k = 0 h 1 C k cos ( α j + k θ j ) / 1 + k = 0 h 1 C k 2 s . t .   sin ( α j θ j ) + k = 0 h 1 C k sin ( α j + k θ j ) = 0   k = 0 h - 1 k C k < 1  
In this study, a complex optimization method was applied to handle this optimization problem. The principle and detailed description of the calculation process can be found in the previous work [17]. A self-written Matlab code was used to perform the minimization work of the above objective function.

3. Stress Distribution Around Roadway in Kunyang No. 2 Phosphate Mine

3.1. Project Overview

The Kunyang No. 2 phosphate mine is the first underground mining operation of Yunnan Phosphate Group. The mine is located within the jurisdiction of Erjie Town, Jinning District, Kunming city of China, with a mining area of 7.66 km2. The mining level ranges from +2350 m to +1620 m. The designed recoverable resource quantity is 42.0914 million tons, with a designed production capacity of 2 million tons per year. The ore body exhibits a double-layer mineral structure, with average thicknesses of 6.70 m and 5.67 m for the upper and lower ore layers, respectively. The average P2O5 content is 22.48% and 26.90%, respectively, with an average dip angle of 15°. A clay-rich shale interlayer with an average thickness of 1.01 m is present between the ore layers. The geological strata primarily consist of dolomite, sandstone, shale, and mudstone, while the ore layers are composed of phosphorite, as shown in Table 1. In addition, the basic physical and mechanical parameters of the rocks were also measured in the lab (see Table 1). Note that due to the extremely fragmented nature of the clay interlayer, it is difficult to prepare standard specimens for rock mechanics testing, resulting in the inability to measure some parameters. The mine design employs a combined development method using inclined shafts, inclined ramps, and vertical shafts, with pseudo-inclined strip drilling and blasting for mining, followed by cemented tailings filling.
Due to the complex geological conditions of the mine, including hidden caverns, faults, folds, fracture zones, abundant karst water, variable rock properties, and poor rock quality, roof falls occur frequently at the roadway, seriously affecting construction safety and progress. From a mechanical perspective, ground stress is an important source of force for rock deformation, destruction, and instability. After the tunnel is excavated, the stress distribution of the surrounding rock undergoes redistribution, resulting in varying degrees of stress concentration or stress relief at different locations. When the concentrated stress reaches the tensile strength or shear strength of the rock mass, the surrounding rock of the tunnel may fracture and become unstable. It is evident that understanding the stress distribution patterns of the surrounding rock is crucial for ensuring the stability control of the roadway’s surrounding rock. For this purpose, the complex function theory described above is used to analyze the surrounding rock stress of the roadway.
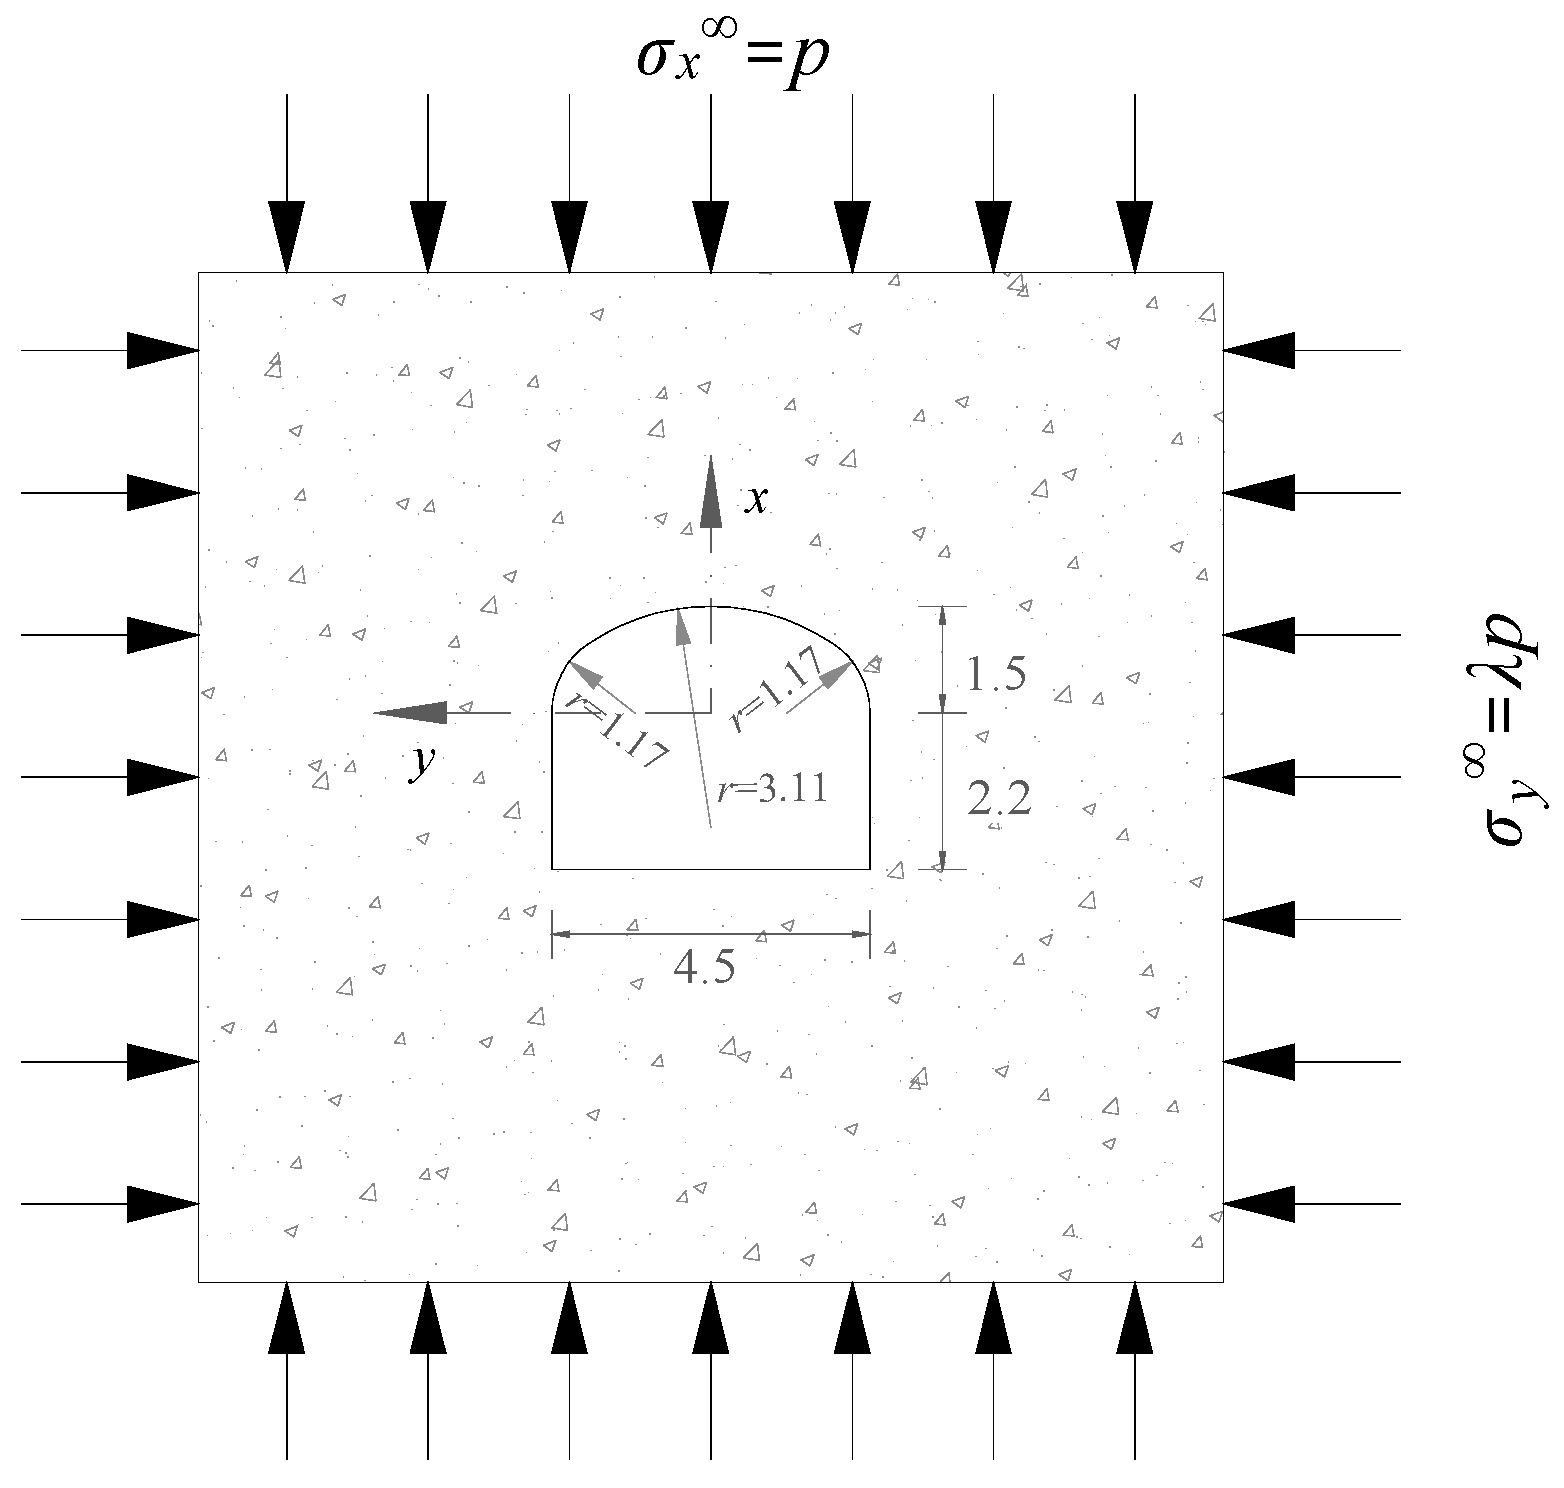
In the Kunyang No. 2 phosphate mine, the cross-sectional shape of the excavated roadways is a triple-center arch. The clear width of all roadways is 4.5 m, with an arch height of 1.5 m. The wall heights vary, with three different cross-sectional dimensions: wall height of 2.0 m (e.g., inclined shafts, level belt conveyor roadways); 2.2 m (e.g., inclined ramps, level trackless conveyor roadways, central intake shaft cross-adit roadways); and 2.5 m (e.g., level backfill return air roadways). In this research, the roadways with a wall height of 2.0 m were selected for analysis, owing to the large proportion of this type of roadways, as presented in Figure 3.

3.2. Mapping Function and Mapping Accuracy

The left half of the roadway boundary is evenly divided into 30 sections, resulting in 31 points. If the two additional turning points on the boundary are included, the total number of points is 33, namely m = 33. Afterwards, the coordinate data values of these points are substituted into Equation (16) and the optimization work is executed using the Matlab program considering different number of Ck terms. It is calculated that R is 2.2371, 2.2580, 2.2672, 2.2618, 2.2659, and 2.2669, respectively. Table 1 lists the optimization results, including the objective function value, the number of iterations, and the value of Ck for different numbers of terms.
As can be seen in Table 2, when the number of Ck terms is seven, the objective function value (0.0067) is the smallest among several cases, which is very close to zero. This indicates that when the number of Ck terms is 7 (h = 7), the solution of the mapping function is sufficiently satisfactory. To verify the mapping accuracy of the mapping function under the conditions of different Ck items counts, the mapping roadway boundaries were plotted based on the polar coordinate data of the mapping points and the corresponding mapping functions, and a comparison was made with the actual tunnel boundaries, as shown in Figure 4.
As illustrated in Figure 4, when h is 7, the roadway mapping boundary and the actual boundary basically coincide, with a slight deviation in the left and right bottom corners. In addition, it is seen that the mapping accuracy basically increases with the increase in the number of Ck terms. When taking a finite number of Ck terms, the mapping effect can meet the requirements. Consequently, the mapping function can be expressed as
z = w ζ = 2 . 2659 ζ - 0 . 5570 0 . 2352 ζ + 0.1643 ζ 2 0 . 2184 ζ 3 + 0.0655 ζ 4 + 0.0383 ζ 5 0.0233 ζ 6

3.3. Stress Distribution Around the Roadway

According to Equation (17), the following transformation forms of the mapping function can be obtained for a point on the unit circle (ζ = σ): w(σ) = 2.2659σ − 0.5570 − 0.2352σ−1 + 0.1643σ−2 − 0.2184σ−3 + 0.0655σ−4 + 0.0383σ−5 − 0.0233σ−6; w′(σ) = 2.2659 + 0.2352σ−2 − 0.3286σ−3 + 0.6553σ−4 − 0.2619σ−5 − 0.1915σ−6 + 0.1400σ−7; ω ( σ ) ¯ = 2.2659σ−1 − 0.5570 − 0.2352σ + 0.1643σ2 − 0.2184σ3 + 0.0655σ4 + 0.0383σ5 − 0.0233σ6; ω ( σ ) ¯ = 2.2659 + 0.2352σ2 − 0.3286σ3 + 0.6553σ4 − 0.2619σ5 − 0.1915σ6 + 0.1400σ7. Combining Equation (6) and Equation (10), the unknown constants an and bn in Equation (6) can be solved with the aid of the power series method, i.e., a1= 1.1419p − 0.9244; a2 = −0.0537p − 0.1168; a3 = 0.1296p + 0.0960; a4 = −0.0445p − 0.0232; a5 = −0.0191p(1 + λ); a6 = 0.0117p(1 + λ); b1 = −1.4137p − 0.9786, …, b100 = 1.7408 × 10⁻⁶p + 4.7237 × 10⁻⁶. It can be concluded that an terms are finite (n = 6), and the values can be directly solved, while bn terms are infinite. However, when taking a finite number of terms from bn, the resulting analytical function is already highly accurate. This is because bn approaches zero when n becomes very large. In this study, n was set to 100 and the computational results achieve very high precision. Thus, we obtain φ0(ζ) = a1ζ−1 + a2ζ−2 + a3ζ−3+ a4ζ−4 + a5ζ−5 + a6ζ−6, ψ0(ζ) = b1ζ−1 + b2ζ−2 + b3ζ−3 + … +b99ζ−99 + b100ζ−100. Substituting the two analytical functions into Equation (5) yields
φ ζ = p 2 - 0.1392 λ + 1 + 0.5665 λ + 1 ζ + 1.0831 0 . 9832 λ ζ 0.0127 + 0.0757 λ ζ 2 + 0.0750 + 0.0413 λ ζ 3 0.0281 + 0.0068 λ ζ 4 0.0096 λ + 1 ζ 5 + 0.0058 λ + 1 ζ 6 ψ ζ = = p 2 0.2785 1 λ + 1.1329 λ 1 ζ 1.2961 + 1.0962 λ ζ 0.2593 0.3061 λ ζ 2 + 1.1957 0.9337 λ ζ 3 + .... +   ( - 1 . 8396 × 10 - 6 + 9 . 0632 × 10 - 7 λ ) ζ 99 +   ( 1 . 7408 × 10 - 6 + 4 . 7237 × 10 - 7 λ ) ζ 100
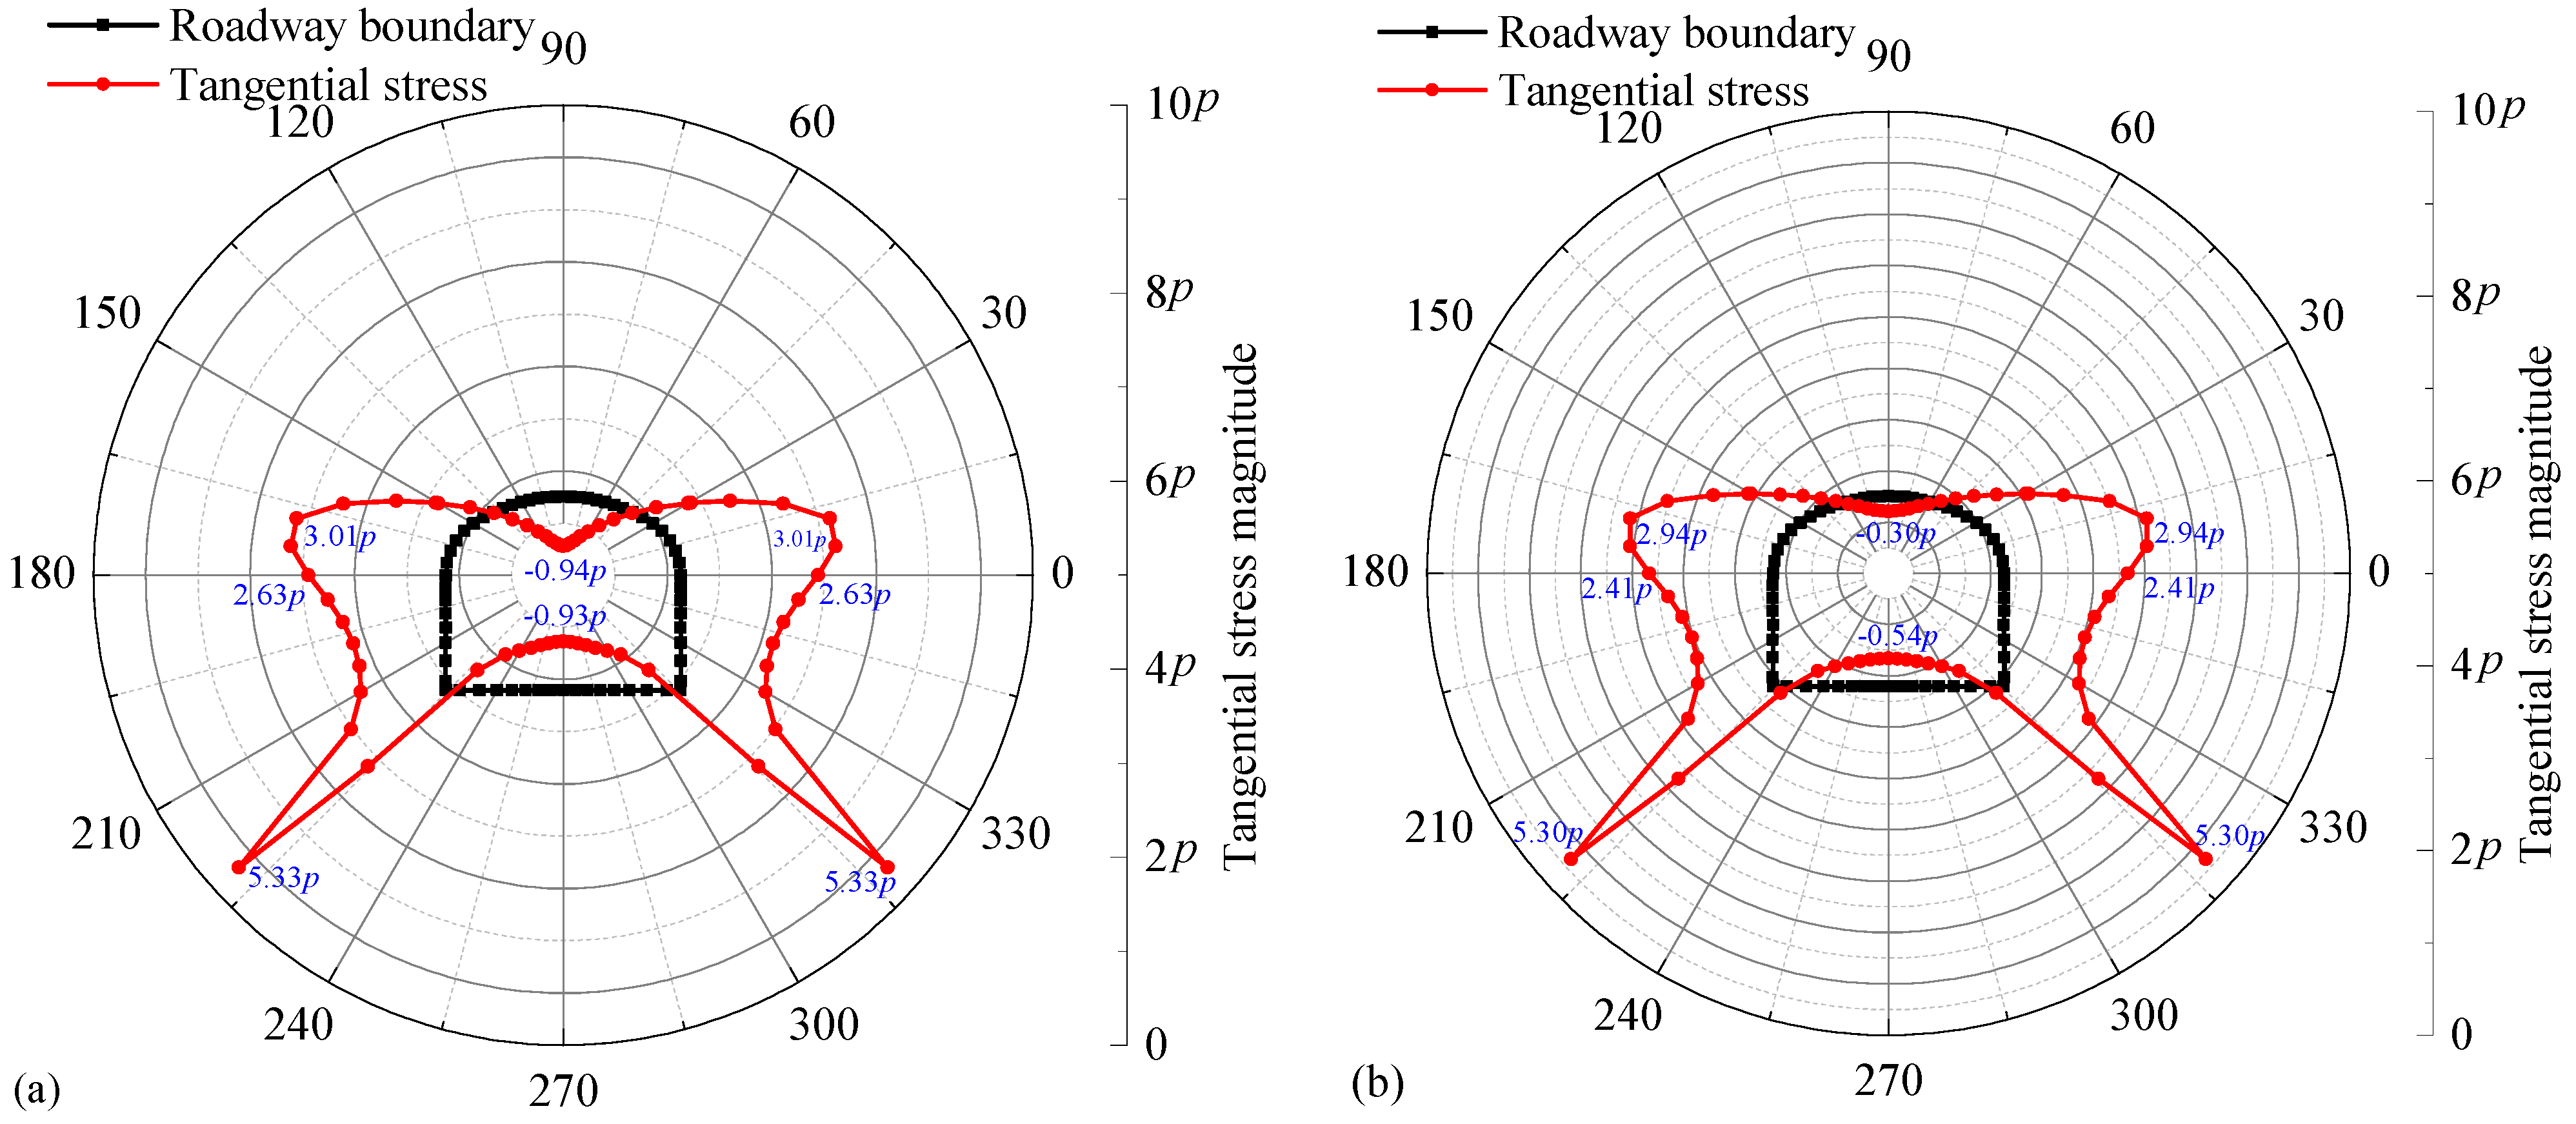
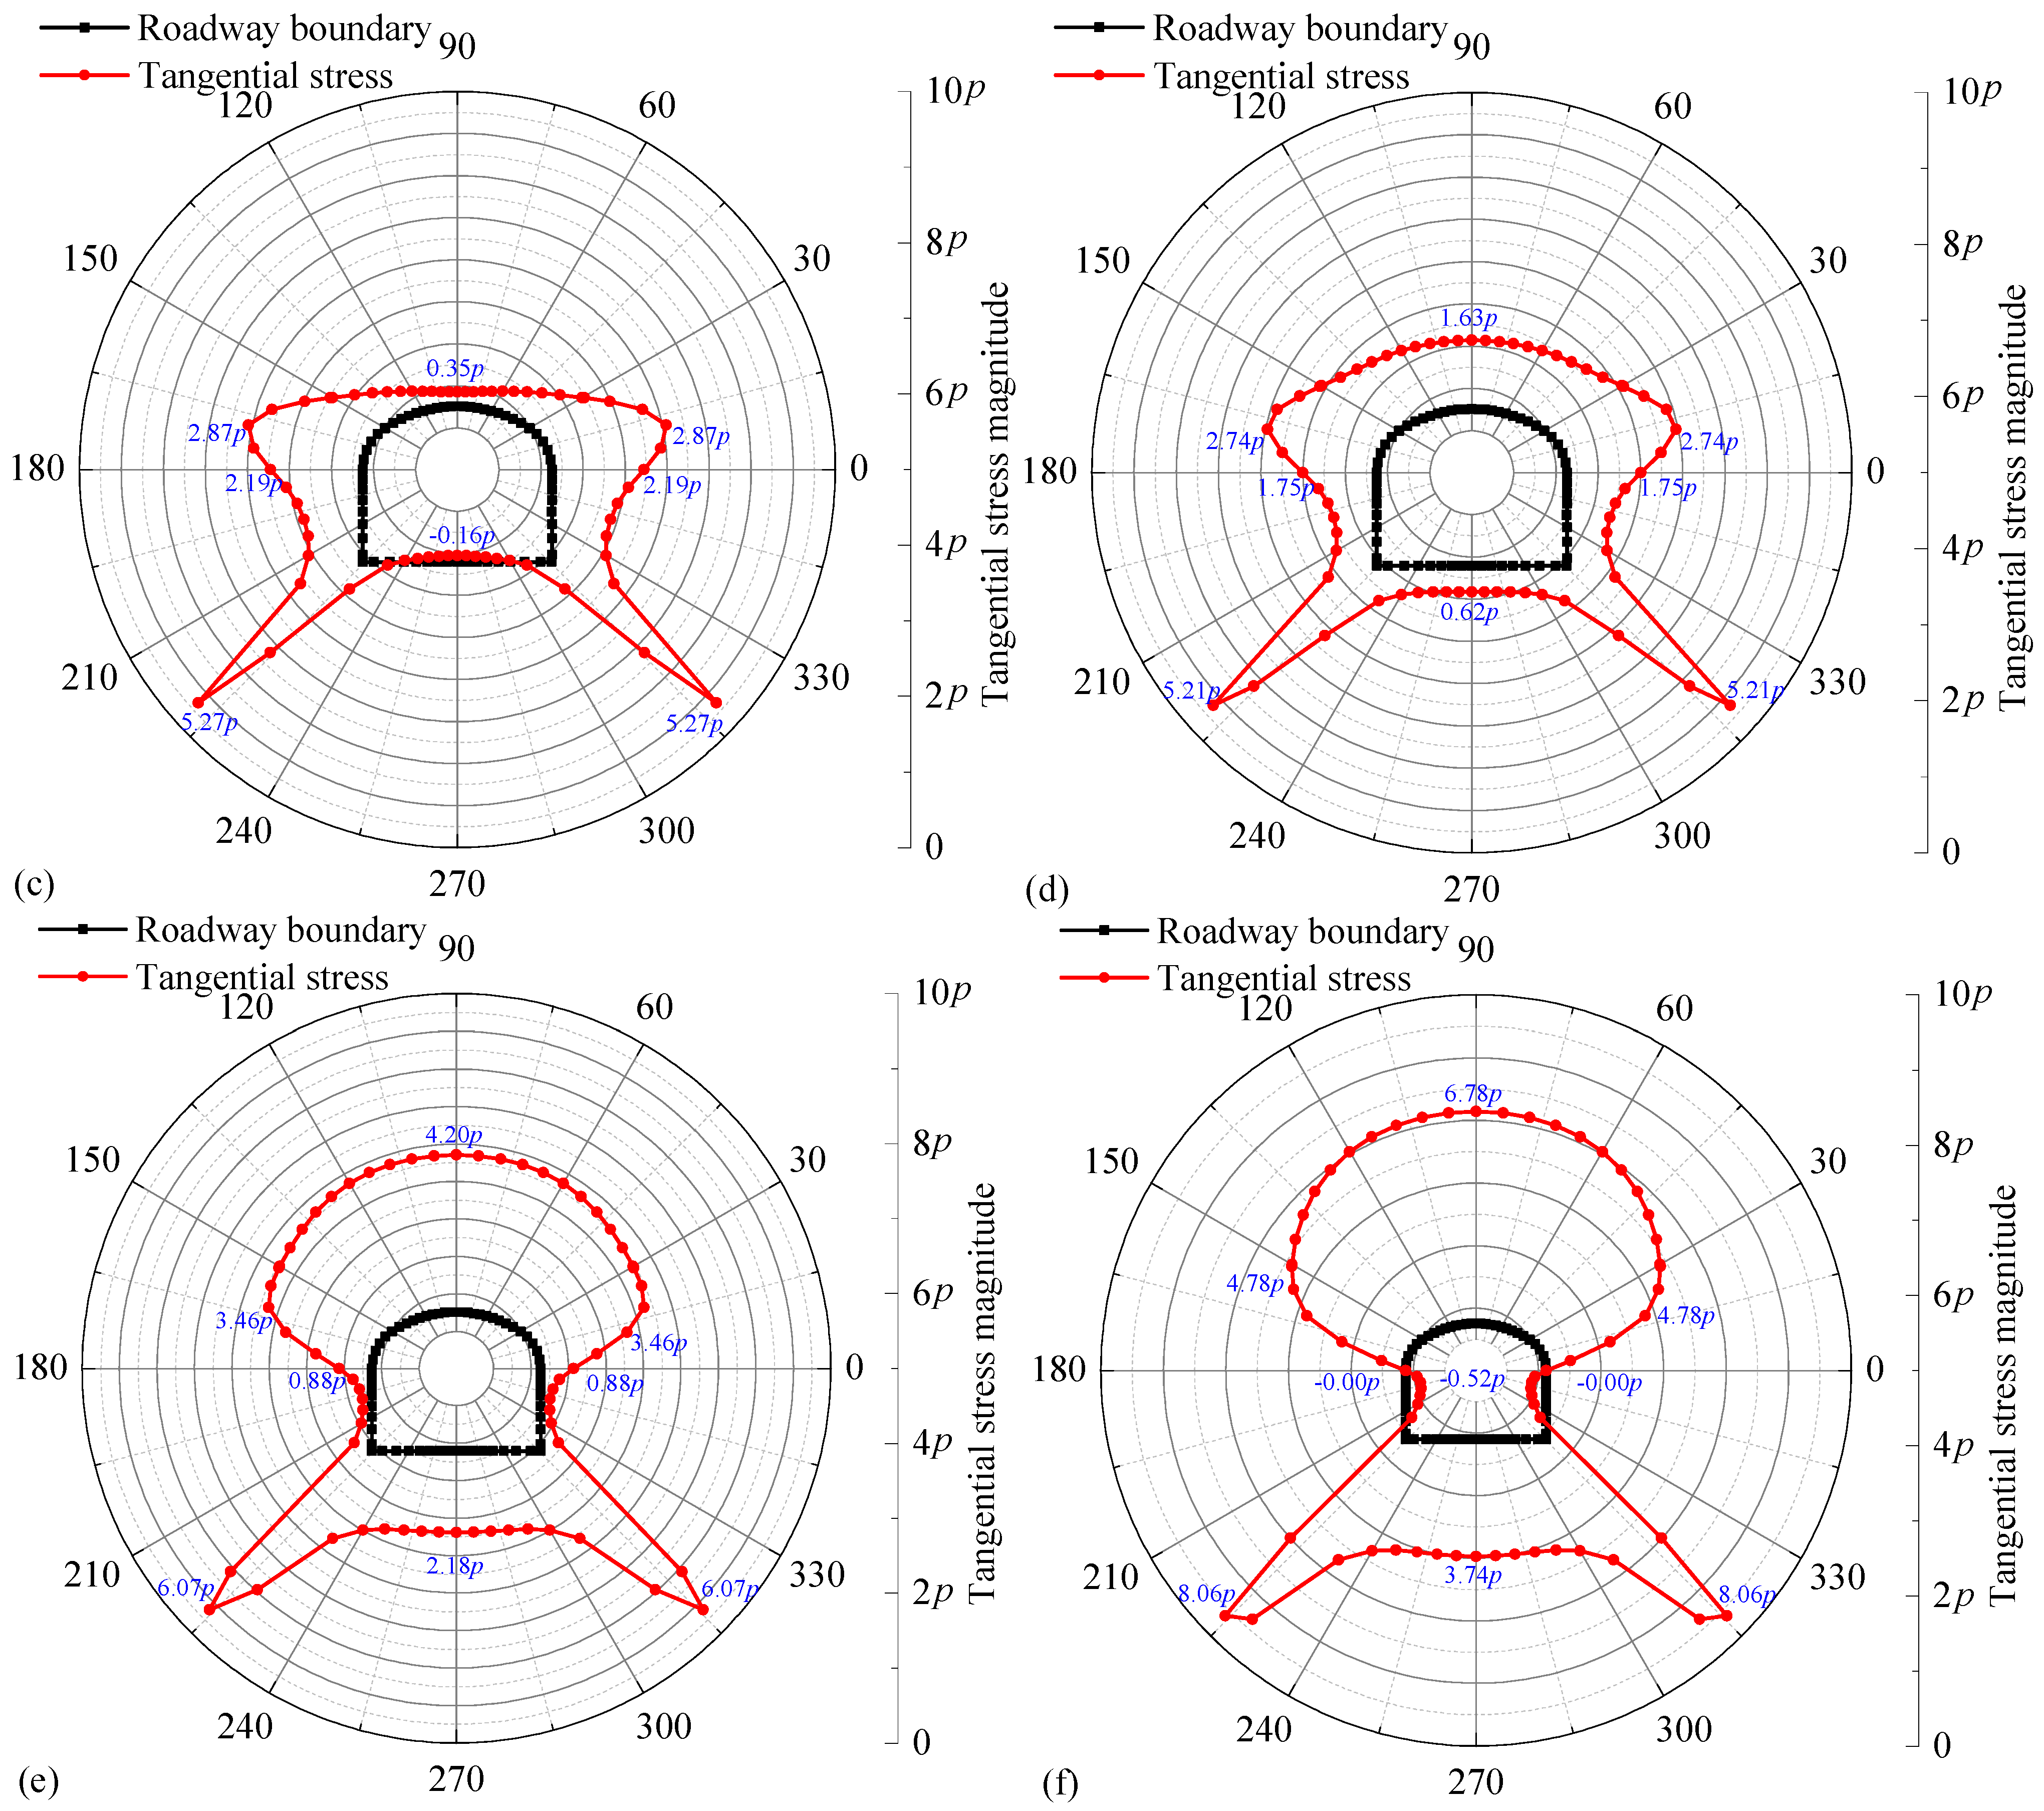
By introducing Equation (18) into Equation (9), the two complex potential functions Ψ(ζ) and Φ(ζ) can be solved. Afterwards, the three stress components σρ, σθ, and τρθ of any point around the opening can be worked out by solving the equation system of Equation (8). Figure 5 presents the tangential stresses of the sample points on the left half of the roadway boundary in the case of different lateral stress coefficients. Clearly, the stress distribution on the right half of the roadway boundary is equal to that on the left half due to symmetry.
As there are no external loads acting on the hole boundary, the radial stresses on the roadway boundary are all zero. With respect to the tangential stress, the magnitude varies with the location on the roadway boundary and the lateral stress coefficient, as illustrated in Figure 5. For λ = 0, it can be found that the tangential stresses on the roadway roof and floor are both tensile stresses, with maximum magnitudes of −0.94p and −0.93p, respectively, indicating that the top and bottom areas are unloaded. In contrast, the concentrated compressive stress occurs on the sidewalls and corners of the tunnel, with maximum compressive stresses of 3.01p, 2.63p, and 5.33p in the upper corner, sidewall, and lower corner, respectively. As the lateral stress coefficient λ increases, the tensile stress at the top and bottom of the tunnel gradually decreases and changes to compressive stress, while the compressive stress concentration coefficients in the corners and sidewalls also gradually decrease. When λ reaches 1.0, the stresses at the center of the tunnel roof and floor become compressive stresses, namely 1.63p and 0.62p, respectively. The maximum compressive stresses in the upper corners, horizontal sidewalls, and lower corners decrease to 2.74p, 1.75p, and 5.21p, respectively. As the lateral stress coefficient continues to increase, the compresive stress on the roadway sidewalls turns into tensile stress, while the compressive stress on the roadway corners begins to gradually increase. With the increase in λ to 3, the maximum tensile stress on the sidewall is −0.52p, while that on the roof, floor, and corners of the roadway are 6.78p, 3.74p, and 8.06p, respectively. From the above, it is concluded that stress relief occurs in the roof and floor of the roadway under low stress coefficients, while stress concentration of varying degrees occurs in the corners and side walls. In such a case, the roof and floor are highly prone to roof collapse accidents. For high lateral stress coefficients, the stress distribution pattern around the tunnel is the opposite of that under low lateral stress. As a result, it is easy for sidewall spalling to appear. In comparison, the roof and floor are very vulnerable to buckling failure or shear failure. Thus, under low lateral stress conditions, the roof and floor of the roadway should be reinforced to prevent roof falls and floor heaving. Conversely, the rock mass on both sides of the roadway should be supported with increased density or strength to prevent rock bursts.
In previous work, on-site measurements were taken of the in situ stress in the mining area of the Kunyang No. 2 phosphate mine and the stress distribution law was obtained, namely
σ hmax = 0.0434 h + 5.1285 σ hmin = 0.0177 h + 2.4248 σ z = 0.0280 h + 1.4283
where h is the burial depth, whilst σhmax, σhmin, and σz denote the maximum horizontal principal stress, minimum horizontal principal stress, and vertical stress, MPa. Note that the directions of the maximum and minimum horizontal principal stresses are perpendicular and parallel to the strike of the ore body, respectively, while the vertical stress is in the vertical direction.
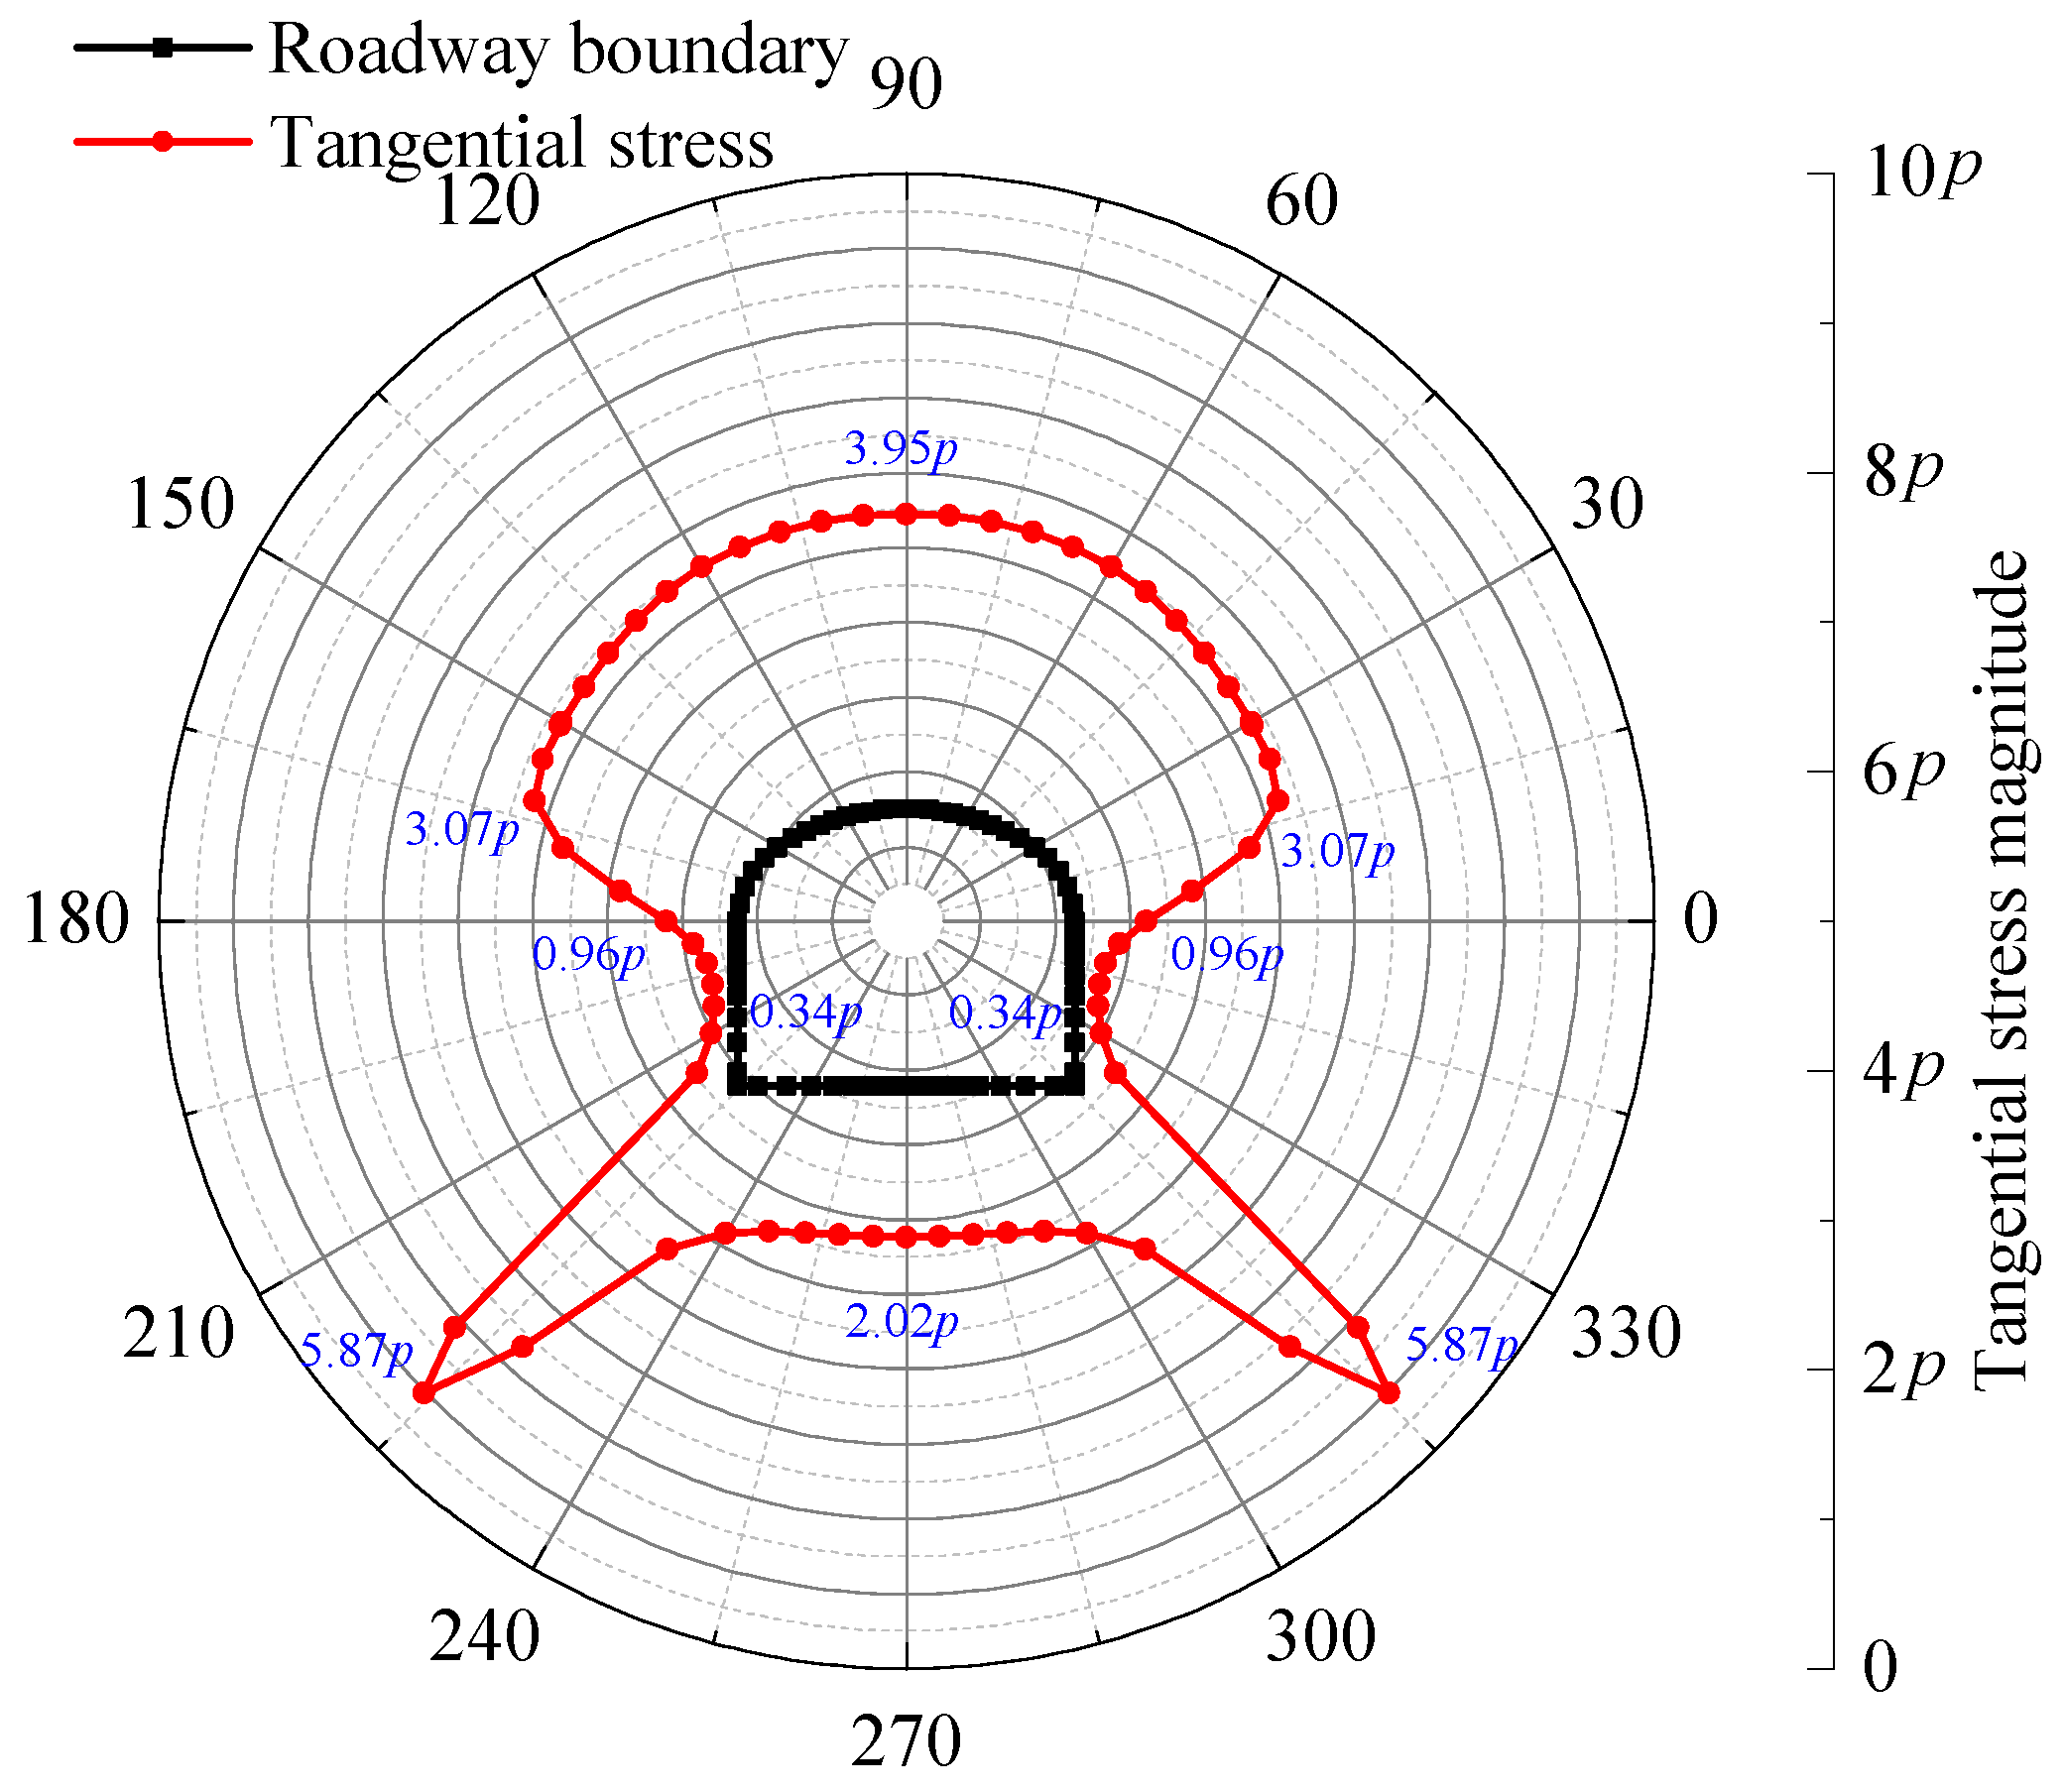
In this study, the +1890 m level is the first mining section of the mine, and thus the +1890 m level trackless transport roadway, which is located in the upper phosphate rock stratum and serves as a passageway for pedestrians and equipment as well as for exploration, was selected as the subject of this study. The cross-sectional dimensions of this roadway are shown Figure 3, with a maximum burial depth reaching approximately 250 m, and the roadway is excavated using the drill and blast method along the strike of the ore body. According to Equation (19), it can be calculated that the vertical stress is 8.47 MPa, while the maximum horizontal stress is 16.05 MPa. Therefore, the lateral stress coefficient is about 1.9. Based on the sample point data from the roadway boundary, by substituting λ = 1.9 into Equation (8), the tangential stress on the boundary can be solved. As shown in Figure 6, it is found that the compressive stress concentrates on the roadway roof and floor, with maximum stress concentration factors of 3.95 and 2.02, respectively. As the roof approaches the sidewall of the tunnel, the concentrated compressive stress gradually decreases. The maximum compressive stress at the corner is 3.07p. In contrast, stress relief occurs on both sides of the roadway, with the stress decreasing from 0.96p at the top of the side to 0.34p in the middle of the side. Apparently, the compressive stress in the roadway sidewall has decreased compared to the initial geostress, so the rock mass on the roadway’s sides is stable and does not require support. The roof and corner areas of the roadway are subjected to high compressive stress and are prone to compressive-shear failure, so timely support measures should be taken and the support strength should be increased.
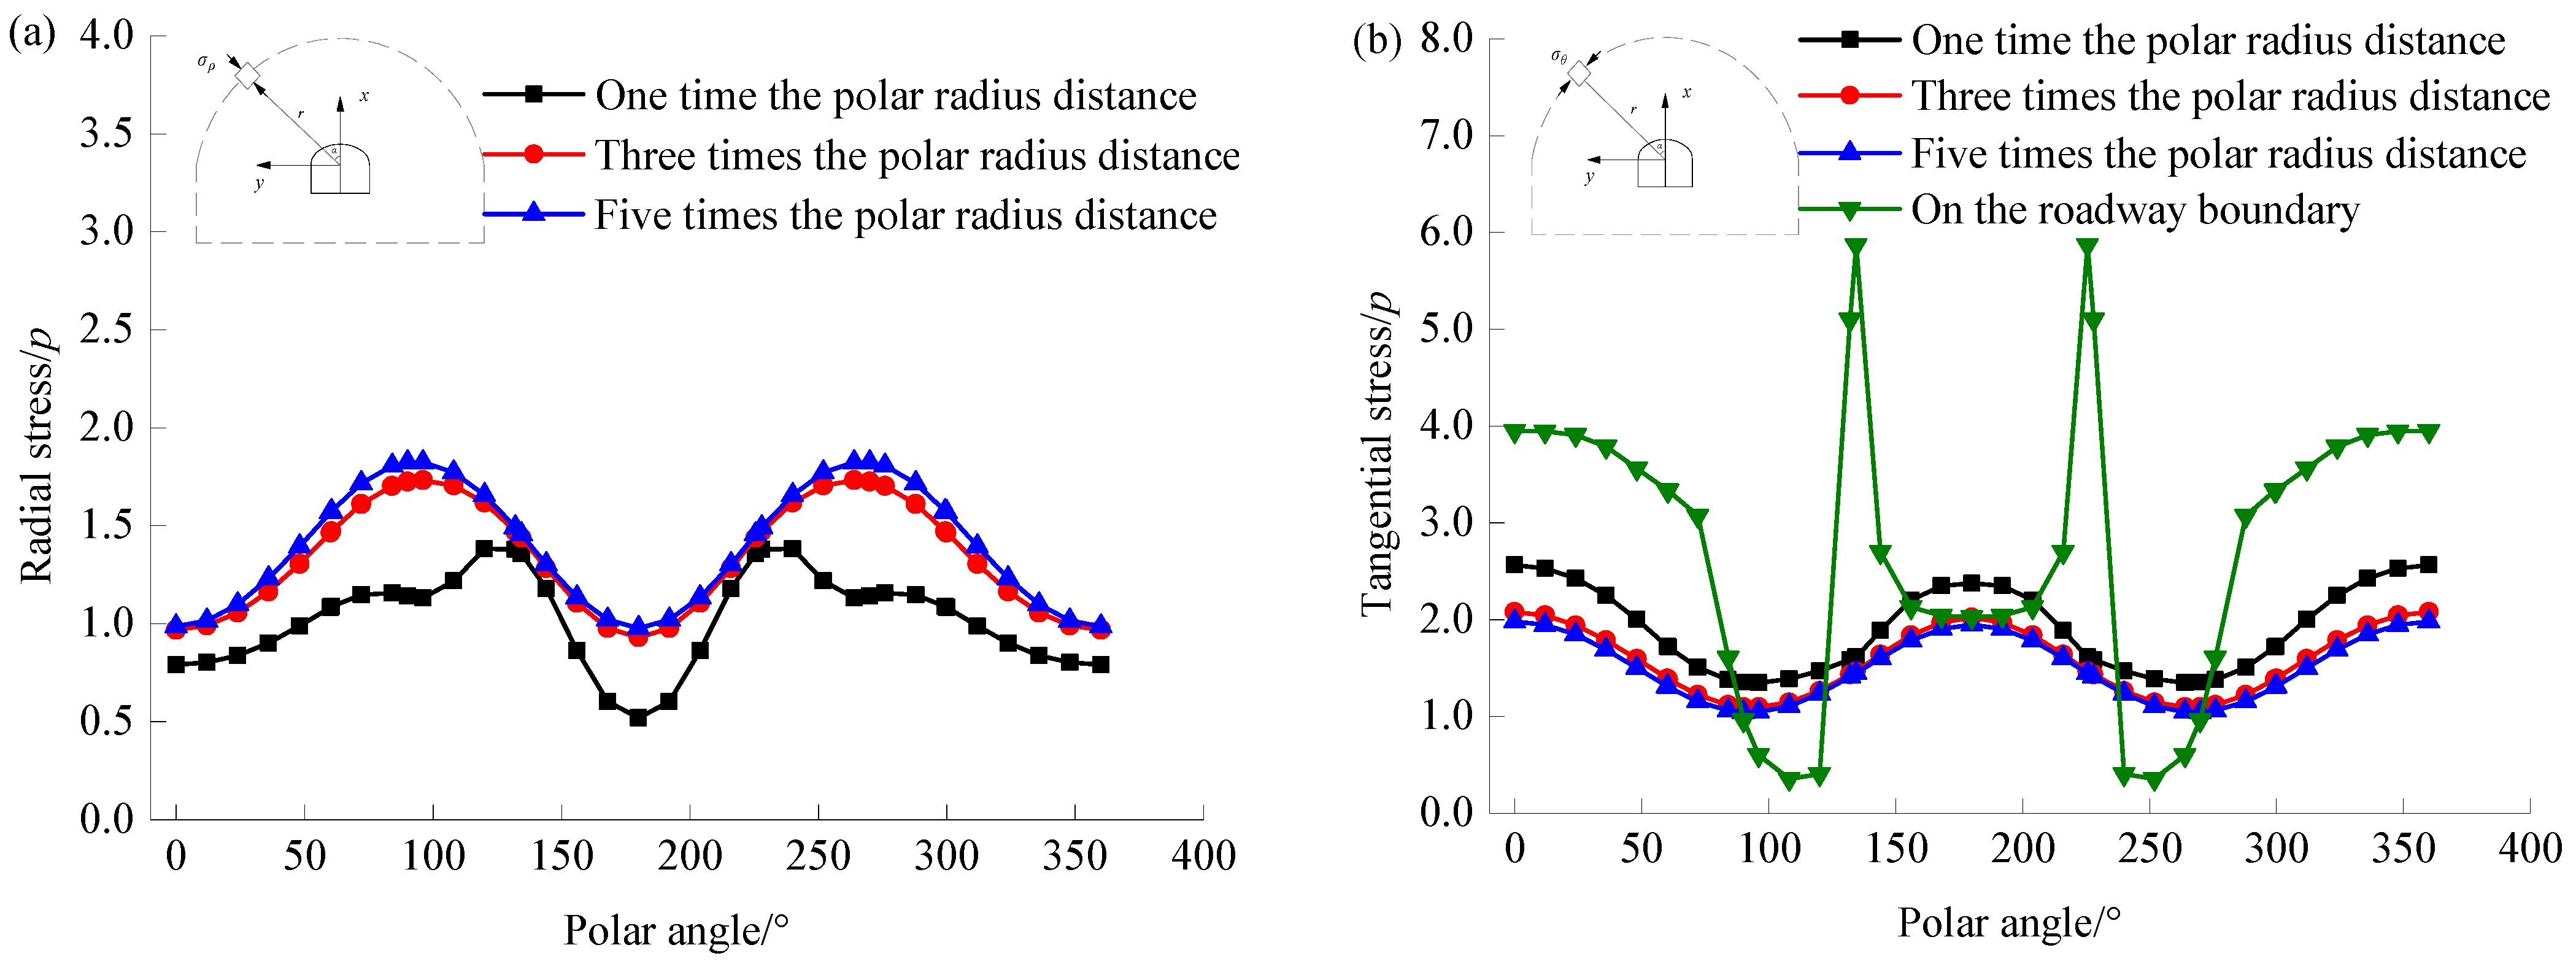
Additionally, the stress distribution outside the roadway boundary is further plotted in Figure 7. Here, three cases were considered, namely the radial and tangential stresses at distances of one, three, and five times the polar radius from the tunnel boundary were calculated. It is observed that the maximum radial stress at a distance of one time the polar radius from the roadway roof is 0.79p, while those at distances of three times and five times the polar radius are 0.97p and 0.99p, respectively. As the distance from the roadway boundary increases further, the maximum radial stress approaches p, which is also the vertical stress in the far field. For the radial stress on the two roadway sides, the values in the top of the roadway sides at distances of one, three, and five times the polar radius from the tunnel boundary are 1.14p, 1.72p, and 1.82p, respectively. From the roof of the tunnel to the two sides, the radial stress concentration factor gradually increases, while from the two sides to the floor of the tunnel, the radial stress concentration factor gradually decreases. With respect to the distribution of tangential stress, the maximum tangential stresses in the roadway roof at distances of one, three, and five times the polar radius from the roadway boundary are 2.56p, 2.08p, and 1.98p, respectively. The maximum tangential stresses in the roadway floor at distances of one, three, and five times the polar radius from roadway boundary are 2.38p, 2.01p, and 1.95p, respectively. As the distance from the roadway boundary increases, the tangential stress in the roof and floor eventually tends towards the far-field horizontal stress 1.9p. From the roof of the roadway to the two roadway sides, the tangential stress gradually decreases, while from the two roadway sides to the roadway floor, the tangential stress gradually increases. The minimum tangential stresses in the roadway sides at distances of one, three, and five times the polar radius from roadway boundary are 1.35p, 1.09p, and 1.04p, respectively. With the increasing distance from the roadway boundary, the tangential stress on the roadway sides gradually approaches the far-field vertical stress p. From the above, it is concluded that the stress concentration and stress relief are most pronounced at the roadway boundaries. As the distance from the roadway boundaries increases, the radial and tangential stresses gradually approach the stress components of the geostress in the far field. The impact of roadway excavation activities on ground stress is five times the polar radius. Outside this range, the surrounding rock stress is approximately equal to the original geostress.

4. On-Site Measurement of Surrounding Rock Stress Around Roadway

4.1. Measurement Principle of Surrounding Rock Stress

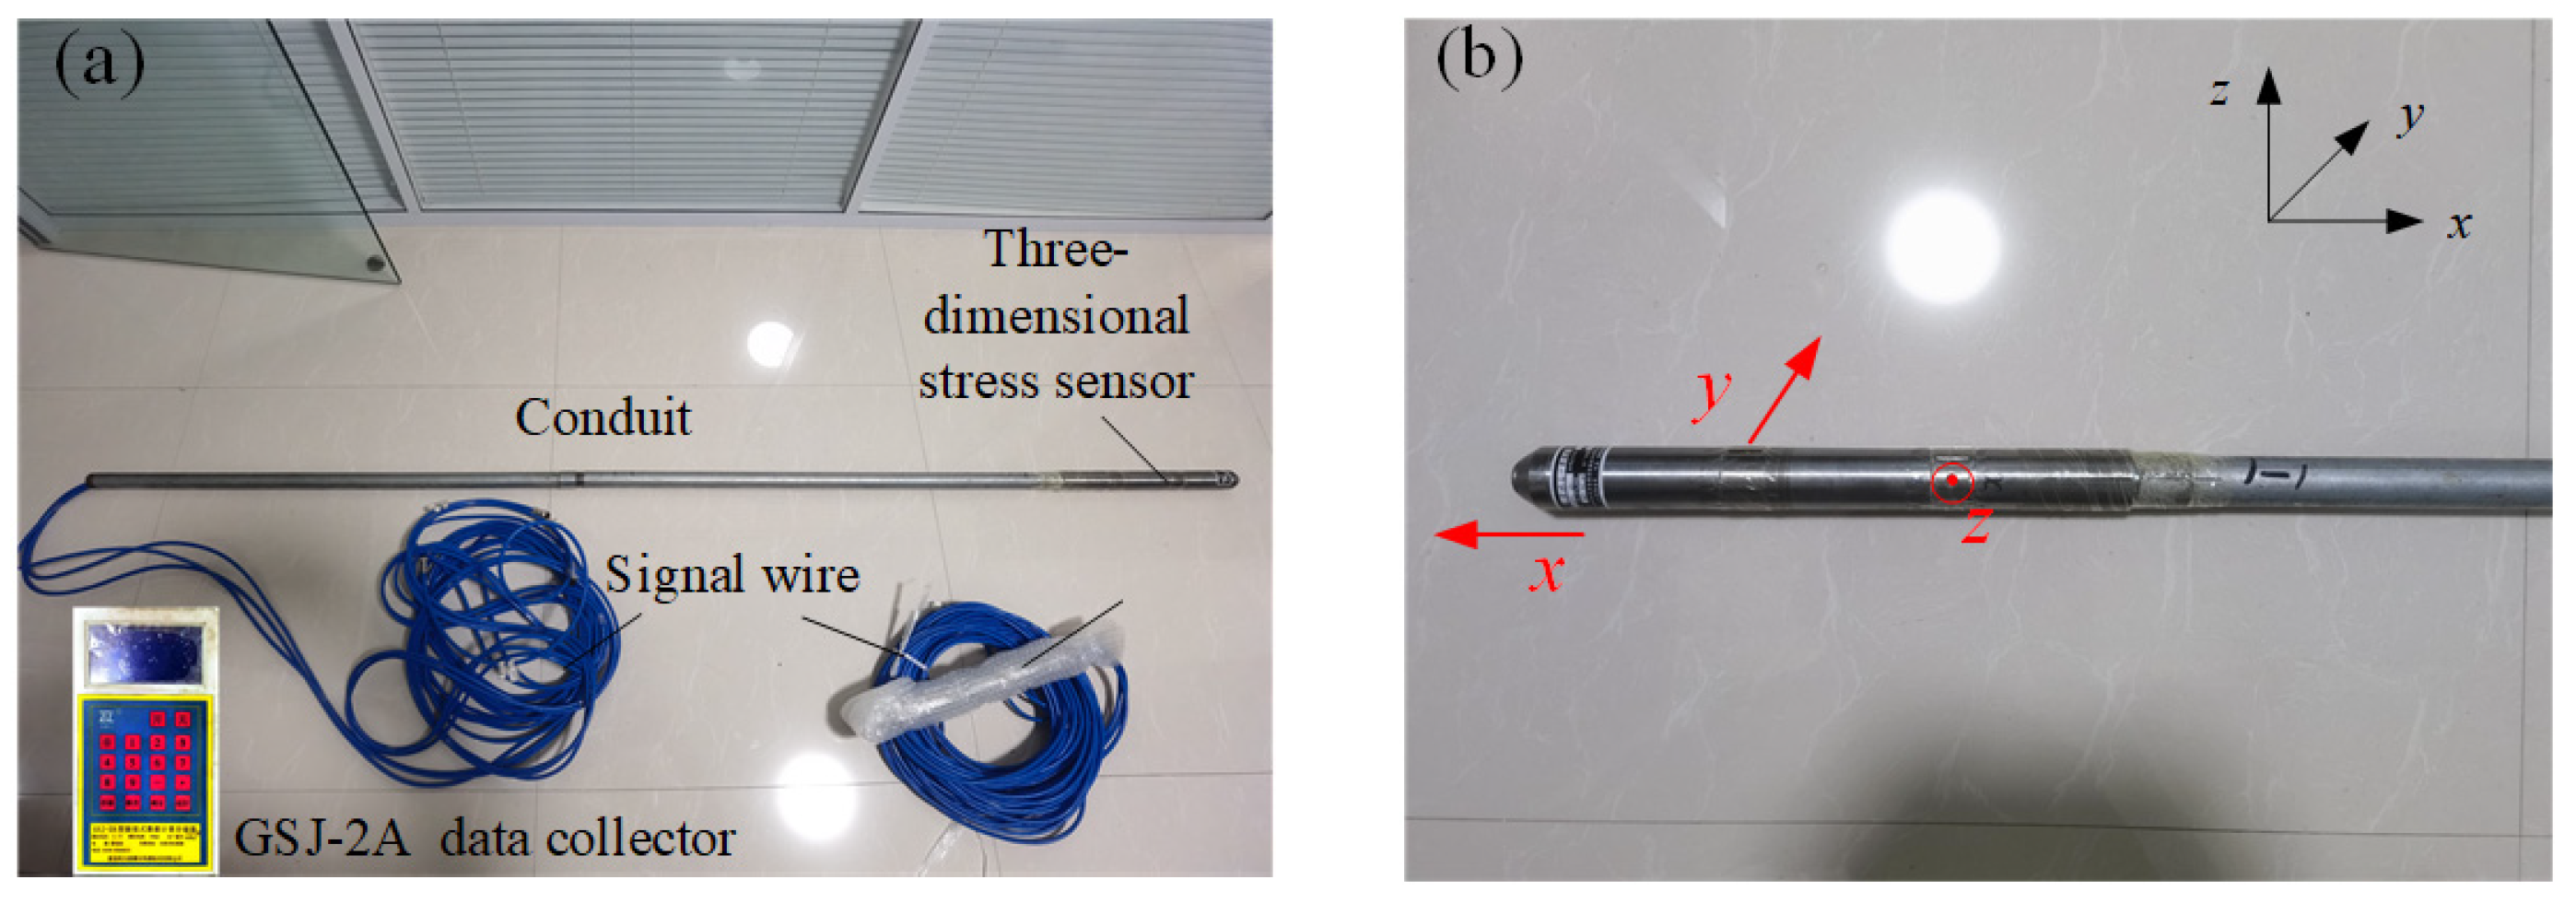
To verify the reliability of the analytical results of surrounding stress, the actual surrounding rock stress of the +1890 m level trackless transport roadway in the Kunyang No. 2 phosphate mine were measured on site by a measurement system. This system consists of a three-dimensional stress sensor that can measure the stress components in the x, y, and z directions of the three-dimensional coordinate system at the monitoring point; as well as steel conduits; a four-core signal wire; and a GSJ-2A data collector, as shown in Figure 8. The stress sensor is designed as a long cylindrical shape (diameter 45 mm, length 400 mm) and incorporates three vibrating wire transducers oriented in the x, y, and z directions to monitor the three-dimensional stress components at the measurement point. It has a range of 40 MPa, an accuracy of 1% FS, high sensitivity, and good waterproof performance (3 MPa). The stress signal monitored by the sensor can be connected to the data collector through signal wires distributed inside the conduit. The stress sensor and the conduit are connected via threaded connections. For the conduit, the outer diameter is 32 mm, with a wall thickness of 3 mm. Each section is 1.0 m in length, and sections are connected via threaded joints to achieve the desired length. During installation, the sensor orientations (x, y, z) should be marked on the conduit surface to facilitate precise control of sensor positioning.
Therefore, if a near-horizontal borehole is drilled perpendicular to the side wall in the roadway to a monitoring point in the surrounding rock, and then the measuring system is installed at a predetermined position, followed by grouting and sealing, the stress components in three directions at the monitoring point can be monitored and obtained after the sensor is coupled with the surrounding rock of the borehole.

4.2. Measurement Scheme of Surrounding Rock Stress

A total of two monitoring points (1# and 2#) were arranged at the +1890 m level trackless transport roadway in the Kunyang No. 2 phosphate mine, as shown in Figure 9. The measurement point 1# is situated on the left side of the roadway, near No. 2 substation chamber, while the measurement point 2# is located on the right side of the roadway, adjacent to No.4 connecting roadway. The steps for measuring the excavation-induced stress around the roadway are as follows. ① A YT28 rock drill is applied to drill a near-horizontal borehole with a diameter of 50 mm and a depth of 3 m perpendicular to the side wall of the roadway to the monitoring point in the surrounding rock. The drilling holes are approximately 1.2 m above the roadway floor. Upon completion of drilling, the boreholes are promptly cleaned using a compressed air system. ② The stress sensor and one end of the conduit (comprising three interconnected sections) are joined via a threaded connection, with each threaded joint secured by welding. The surface of the conduit’s opposite end is marked with a marker pen to indicate the x, y, and z orientations of the stress sensor. The stress sensor’s signal wire is routed from within the conduit to its exterior, where it connects to the data collector. ③ The measuring system is installed in the designated position, followed by grouting to seal the borehole. The long-term strength of the hardened grout is 70 MPa. Note that the actual depth of the stress sensor within the borehole is approximately 2.5 m. ④ After installing the stress sensor (see Figure 10), the initial reading (initial frequency f0) is recorded. Subsequently, a data collector is employed to periodically acquire monitoring data from the stress sensor. When the grout has sufficiently bonded with the surrounding rock and solidified to achieve long-term strength, the data will stabilize, at which point data acquisition should cease. The formula for calculating the stress components of measurement point is
σ = M f 2 f 0 2 N f f 0
where σ denotes the stress value in the x, y, or z direction of the stress sensor. M and N are the factory calibration constants for each stress sensor, as listed in Table 3. f means the vibrating wire frequency monitored by the stress sensor in the x, y, and z directions, whilst f0 represents the initial frequency after the stress sensor is installed.

4.3. Measurement Results and Analysis

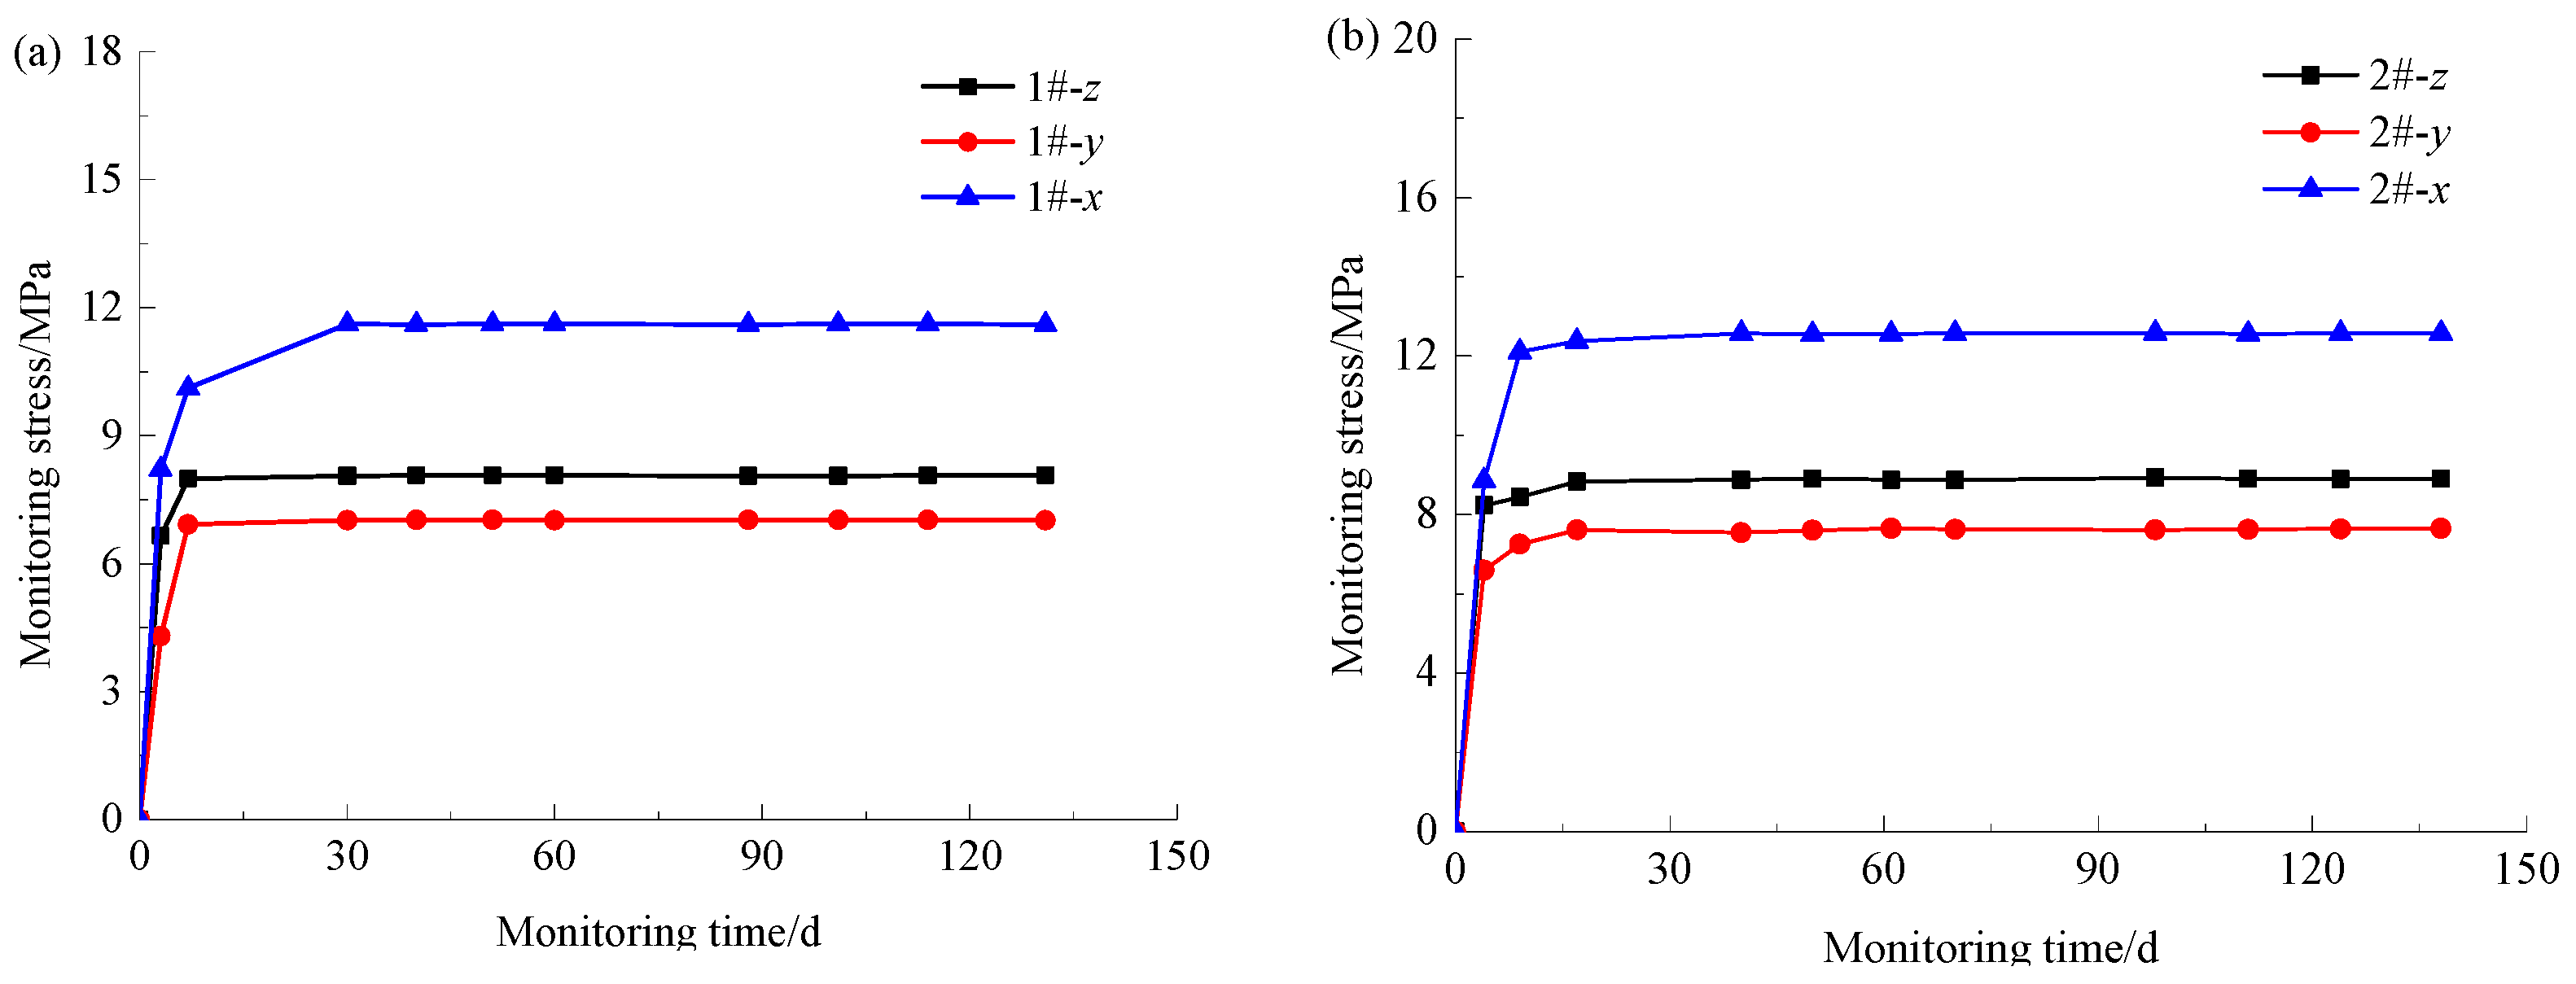
Through approximately four months of irregular monitoring, the monitoring frequency of the stress sensors tends to stabilize in all directions, as listed in Table 4. By substituting the monitored frequency values of stress sensors into Equation (20), the values of the three stress components of the measurement points can be obtained, as presented in Figure 11.
As shown in Figure 11, all stress components at the monitoring points increased sharply during the first two weeks, after which the stresses remained largely stable. The stress components at the monitoring point 1# in the x, y, and z directions were ultimately 11.61 MPa, 7.02 MPa, and 8.06 MPa, respectively, while those of the monitoring point 2# were 12.57 MPa, 7.62 MPa, and 8.89 MPa, repsectively. Apparently, the stress component at the monitoring point is greatest in the x-direction, followed by the z-direction, and finally the y-direction. The reason for the difference in stress at the two measurement points lies in the slight difference in surface elevation, which leads to different burial depths of the measurement points. If the burial depth of the tunnel is taken as 250 m, then the radial stress and tangential stress at the measurement point using above complex variable method are 10.41 MPa and 11.22 MPa, respectively. Thus, the analytical horizontal and vertical stresses at the monitoring point with a polar angle of 101.89° can be calculated using trigonometric functions, yielding values of 12.50 MPa (x-direction) and 8.83 MPa (z-direction). In contrast, the average measured values of the stress components in x-direction and z-direction of the two measurement points are 12.09 MPa and 8.48 MPa. Obviously, the measured stress values agree well with the analytical values, suggesting that the complex variable method for solving the excavation-induced stress of the roadway is reliable, and the relative error of the calculation is less than 5%.

5. Conclusions

In this work, the complex variable function method was proposed to solve the surrounding rock stress distribution around the roadway in Kunyang No. 2 phosphate mine, and then the reliability of the analytical results was verified by comparing them with the results of on-site measurements. The conclusions are drawn as follows:
(1) The complex variable function theory proves highly effective for determining stresses around a non-circular hole, with the key to this lying in the solution of the mapping function. For the commonly designed roadway with a three-centered arch cross-section in the Kunyang No. 2 phosphate mine, the mapping function can be solved by the complex optimization method, and the mapping accuracy is exceptionally high when the number of Ck terms is seven.
(2) The analytical stress results show that the tensile stress occurs on the roadway roof and floor of the triple-arched roadway under low lateral stress coefficients, and the sidewall is subjected to concentrated compressive stress. As the lateral stress coefficient grows, the tensile stress on the top and bottom locations of the roadway changes to increasing compressive stress, while the concentrated compressive stress on the roadway sidewalls turns to rising tensile stress. For the stress distribution around the +1890 m level trackless transport roadway under actual geostress, the roof, floor, and corners of the roadway are concentrated by compressive stress, while the compressive stress appearring on the two sidewalls has been relieved. In addition, the influence of roadway excavation on geostress extends to three to five times the roadway radius.
(3) A three-dimensional stress testing system is used to measure the actual surrounding stress of the +1890 m level trackless transport roadway, and the three stress components at two measurement points in the roadway sides were indentified following a period of monitoring. The on-site measurement results are in good agreement with the analytical results, indicating that the complex variable function for finding the stress distribution around the roadway is effective.

Author Contributions

Conceptualization, Z.W. and K.H.; methodology, Z.W., M.W. and H.W.; investigation, Z.W., K.H. and M.W.; resources, K.H.; writing—original draft preparation, Z.W.; writing—review and editing, K.H., M.W. and H.W.; supervision, K.H.; funding acquisition, M.W. and H.W. All authors have read and agreed to the published version of the manuscript.

Funding

This work study was financially supported by the Yunnan Provincial Phosphorus Resources Technology Innovation Centre Project (202305AK340002) and the National Natural Science Foundation of China (52204160, 52274145).

Data Availability Statement

The author claims that all the data presented in this study are available within the paper.

Conflicts of Interest

Authors Zongyong Wang, Menglai Wang and Hao Wu were employed by the Yunnan Yuntianhua Co., Ltd. The remaining authors declare that the research was conducted in the absence of any commercial or financial relationships that could be construed as a potential conflict of interest.

References

  1. U. S. Geological Survey. Mineral Commodity Summaries 2025; Version 1.2; U. S. Geological Survey: Reston, VA, USA, 2025; pp. 134–135.
  2. Van Poolen, H.K. A Photoelastic Investigation of the Relationship Between Stresses Around Mine Openings and Resulting Failures. Ph.D. Thesis, Colorado School of Mines, Golden, CO, USA, 1955. [Google Scholar]
  3. Hoek, E. Rock Fracture Under Static Stress Conditions. Ph.D. Thesis, University of Cape Town, Cape Town, South Africa, 1965. [Google Scholar]
  4. Tian, M.; Han, L.; Meng, Q.; Ma, C.; Zong, Y.; Mao, P. Physical model experiment of surrounding rock failure mechanism for the roadway under deviatoric pressure form mining disturbance. KSCE J. Civ. Eng. 2020, 24, 1103–1115. [Google Scholar] [CrossRef]
  5. Qiu, J.; Li, X.; Li, X.; Li, D.; Zhao, Y.; Hu, C.; Liang, L. Physical model test on the deformation behavior of an underground tunnel under blasting disturbance. Rock Mech. Rock Eng. 2021, 54, 91–108. [Google Scholar] [CrossRef]
  6. Meng, Q.; Han, L.; Xiao, Y.; Li, H.; Wen, S.; Zhang, J. Numerical simulation study of the failure evolution process and failure mode of surrounding rock in deep soft rock roadways. Int. J. Min. Sci. Eng. 2016, 26, 209–222. [Google Scholar] [CrossRef]
  7. Gao, F.; Stead, D.; Kang, H. Numerical simulation of squeezing failure in a coal mine roadway due to mining-induced stresses. Rock Mech. Rock Eng. 2015, 48, 1635–1645. [Google Scholar] [CrossRef]
  8. Sun, X.; Zhao, C.; Zhang, Y.; Chen, F.; Zhang, S.; Zhang, K. Physical model test and numerical simulation on the failure mechanism of the roadway in layered soft rocks. Int. J. Min. Sci. Eng. 2021, 31, 291–302. [Google Scholar] [CrossRef]
  9. Sakhno, I.; Sakhno, S.; Skyrda, A.; Popova, O. Numerical modeling of controlling a floor heave of coal mine roadways with a method of reinforcing in wet soft rock. Geofluids 2022, 2022, 3855799. [Google Scholar] [CrossRef]
  10. Sakhno, I.; Sakhno, S. Numerical studies of floor heave control in deep mining roadways with soft rocks by the rock bolts reinforcement technology. Adv. Civ. Eng. 2023, 2023, 2756105. [Google Scholar] [CrossRef]
  11. Tao, M.; Zhao, H.; Li, X.; Li, X.; Du, K. Failure characteristics and stress distribution of pre-stressed rock specimen with circular cavity subjected to dynamic loading. Tunn. Undergr. Sp. Tech. 2018, 81, 1–15. [Google Scholar] [CrossRef]
  12. Ouyang, Z.; Li, C.; Xu, W.; Li, H. Measurements of in situ stress and mining-induced stress in Beiminghe iron mine of China. J. Cent. South Univ. 2009, 16, 85–90. [Google Scholar] [CrossRef]
  13. Qiu, L.; Wang, E.; Song, D.; Liu, Z.; Shen, R.; Lv, G.; Xu, Z. Measurement of the stress field of a tunnel through its rock EMR. J. Geophys. Eng. 2017, 14, 949–959. [Google Scholar] [CrossRef]
  14. Liu, F.; Wang, Y.; Kou, M.; Liang, C. Applications of microseismic monitoring technique in coal mines: A state-of-the-art review. Appl. Sci. 2024, 14, 1509. [Google Scholar] [CrossRef]
  15. Wang, G.; Du, L.; Fan, D.; Wang, A.; Shi, T.; Dai, L. Detection of stress distribution in surrounding rock of coal seam roadway based on charge induction principle. Electronics 2024, 13, 3075. [Google Scholar] [CrossRef]
  16. Kirsch, E. Die Theorie der elastizität und die bedürfnisse der festigkeitslehre. Zeit. Ver. Deut. Ing. 1898, 42, 797–807. [Google Scholar]
  17. Inglis, C. Stresses in a plate due to the presence of cracks and sharp corners. Proc. Inst. Nav. Arch. 1913, 55, 219–230. [Google Scholar]
  18. Wu, H.; Zhao, G.; Liang, W. Mechanical properties and fracture characteristics of pre-holed rocks subjected to uniaxial loading: A comparative analysis of five hole shapes. Theor. Appl. Fract. Mec. 2020, 105, 102433. [Google Scholar] [CrossRef]
  19. Wu, H.; Zhao, G.; Ma, S. Failure behavior of horseshoe-shaped tunnel in hard rock under high stress: Phenomenon and mechanisms. T. Nonferr. Metal Soc. 2022, 32, 639–656. [Google Scholar] [CrossRef]
  20. Wu, H.; Fan, A.; Ma, D.; Spearing, A.; Zheng, Z. Fracturing process and initiation mechanism of hard rock tunnels with different shapes: Particle flow modeling and analytical study. Comp. Part. Mech. 2023, 10, 1859–1875. [Google Scholar] [CrossRef]
  21. Greene, R.; Krantz, S. Function Theory of One Complex Variable, 3rd ed.; American Mathematical Society: Providence, RI, USA, 2006. [Google Scholar]
  22. Muskhelishvili, N. Some Basic Problems of the Mathematical Theory of Elasticity; Noordhoff International Publishing: Groningen, The Netherlands, 1953. [Google Scholar]
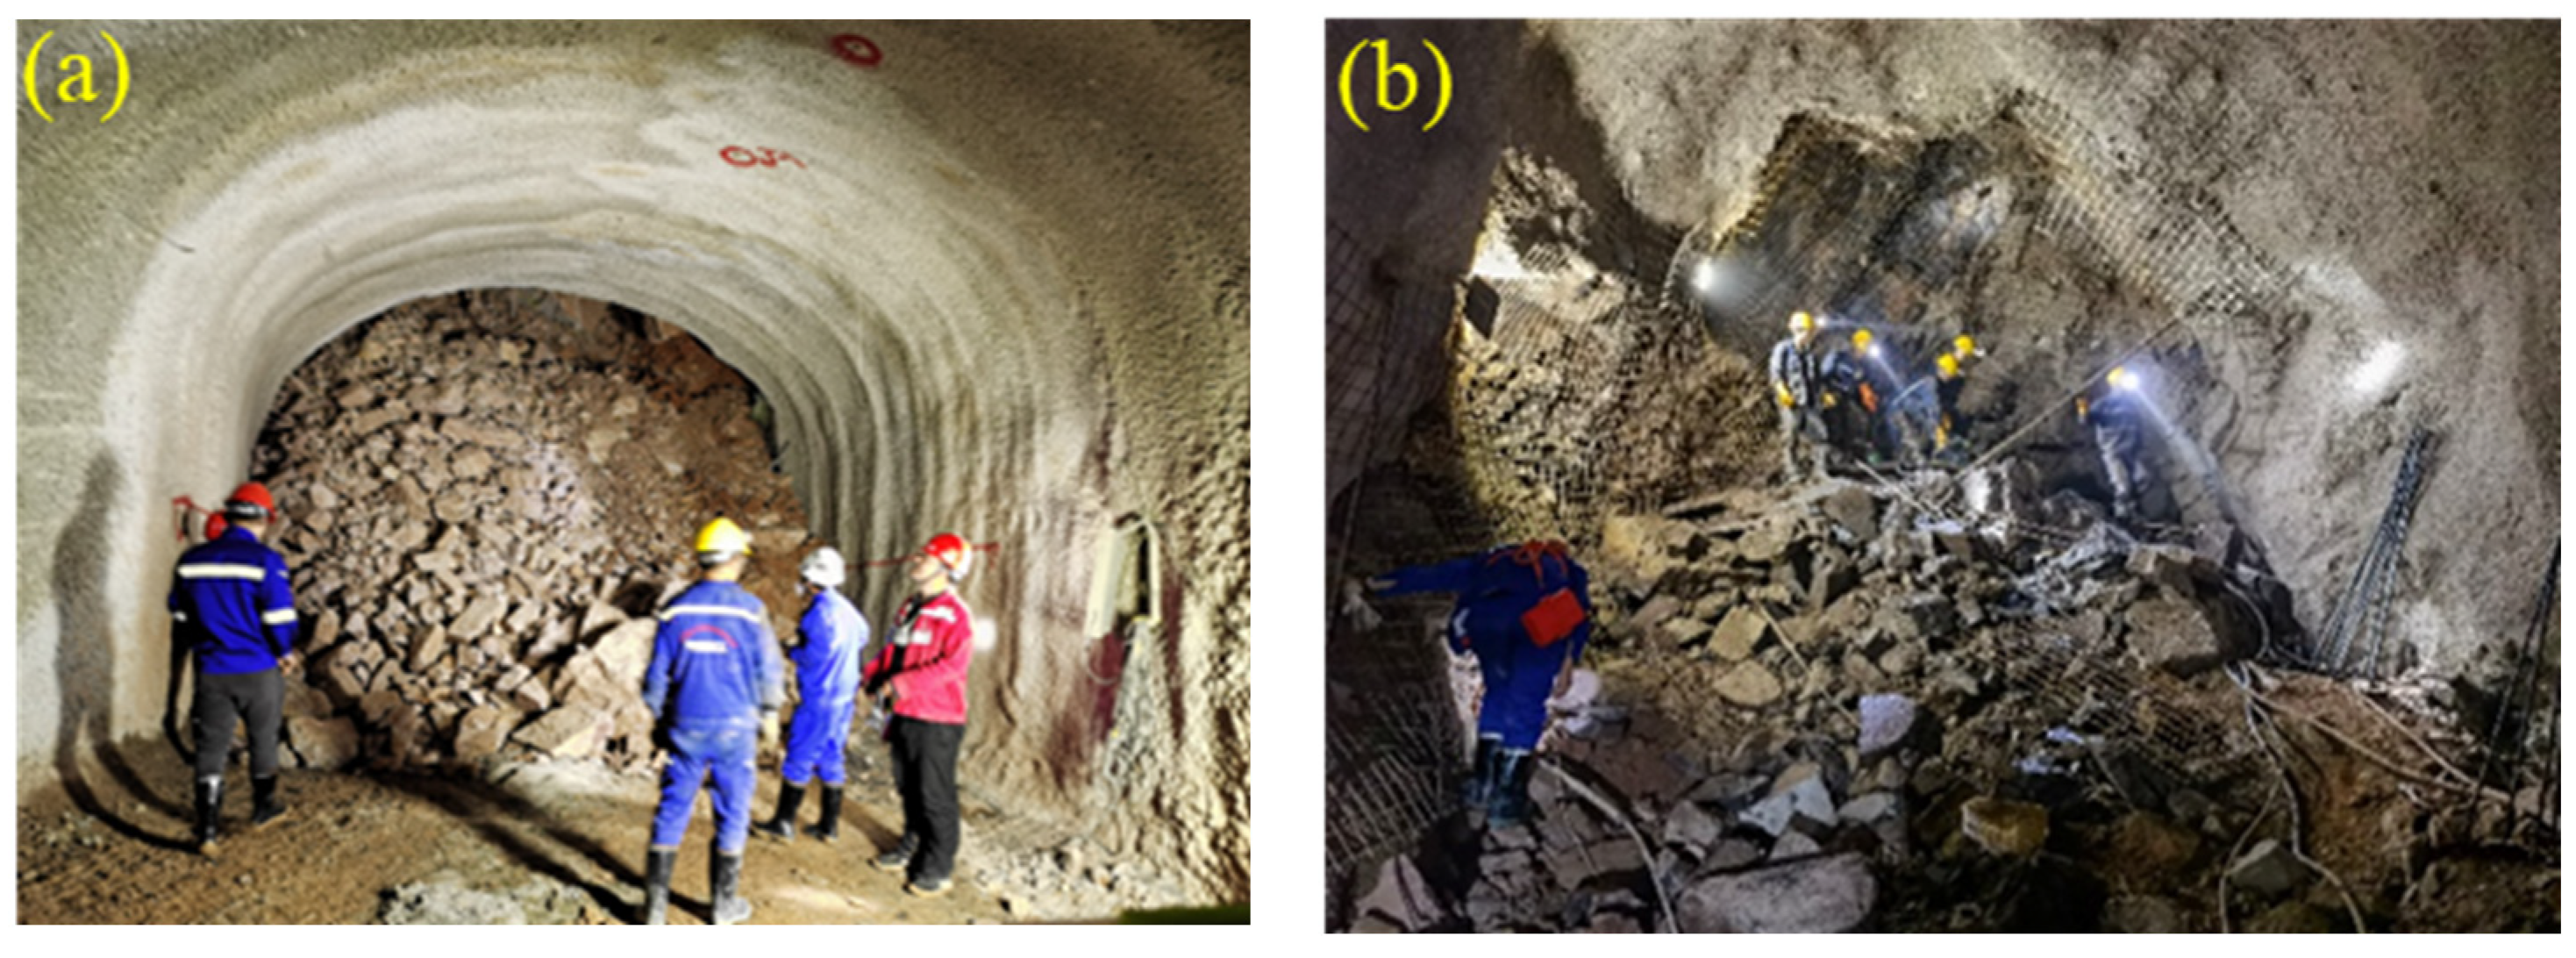
Figure 1. Roof fall: (a) in auxiliary ramp and (b) in 1980 m level fill return airway.
Applsci 15 11002 g001
Figure 2. Conformal transformation for complex-shaped hole.
Applsci 15 11002 g002
Figure 3. Schematic diagram of roadway cross-sectional dimensions.
Applsci 15 11002 g003
Figure 4. Mapping effect of roadway boundaries under different numbers of items Ck: (a) h = 3, (b) h = 4, (c) h = 5, (d) h = 6, (e) h = 7, and (f) h = 8.
Applsci 15 11002 g004
Figure 5. Tangential stress distribution on the roadway boundary under different lateral stress coefficients: (a) λ = 0; (b) λ = 0.25; (c) λ = 0.5; (d) λ = 1.0; (e) λ = 2.0; and (f) λ = 3.0.
Applsci 15 11002 g005aApplsci 15 11002 g005b
Figure 6. Tangential stress distribution around the +1890 m level trackless transport roadway under actual geostress.
Applsci 15 11002 g006
Figure 7. Excavation-induced stress at different locations around the roadway: (a) Radial stress and (b) Tangential stress.
Applsci 15 11002 g007
Figure 8. Equipment for measuring excavation-induced stress around roadway: (a) measurement system components and (b) three-dimensional stress sensor.
Applsci 15 11002 g008
Figure 9. Location of stress monitoring points in Kunyang No. 2 phosphate mine.
Applsci 15 11002 g009
Figure 10. Installation of stress sensors in Kunyang No. 2 phosphate mine: (a) measurement point 1# and (b) measurement point 2#.
Applsci 15 11002 g010
Figure 11. Stress magnitude of monitoring points at different times: (a) measurement point 1# and (b) measurement point 2#.
Applsci 15 11002 g011
Table 1. Drill log and property parameters of main strata in Kunyang No. 2 phosphate mine.
ColumnLithologyThickness/mGeological DescriptionBasic Physical and Mechanical Property Parameters of Main Rocks
Applsci 15 11002 i001Silty shale27.70~46.33Gray black–black, arenaceous texture and thin, sheet-like structures. The core is intact, columnar in shape, and locally fragmented into fragments.ρ = 2718.80 kg/m3, v = 3716.70 m/s, σc = 113.09 MPa, σt = 6.27 MPa, E = 12.52 GPa, C = 18.29 MPa, φ = 42.52°, μ = 0.25
Roof dolomite0~2.80Light gray-gray, fine crystalline texture, medium layered structure. The core is relatively fragmented and appears as blocks or fragments.ρ = 2768.79 kg/m3, v = 5018.50 m/s, σc = 120.10 MPa, σt = 6.94 MPa, E = 20.66 GPa, C = 25.20 MPa, φ = 41.70°, μ = 0.24
Upper phosphate rock2.54~13.37Light gray and blue gray in color, clastic texture, and thin layer strip structure. The core is relatively fragmented and blocky, with upper areas being relatively intact and columnar.ρ = 2776.96 kg/m3, v = 5532.80 m/s, σc = 123.33 MPa, σt = 6.55 MPa, E = 18.61 GPa, C = 19.25 MPa, φ = 45.11, μ = 0.24
Clay interlayer0~3.80Gray and dark gray mudstone interlayer, with broken rock cores in fragmented form.ρ = 2444.62 kg/m3, σc = 11.25 MPa, C = 1.82 MPa, φ = 36.50°
Lower phosphate rock0.32~10.51Light gray and blue gray in color, clastic texture, and thin layer strip structure. The core is relatively fragmented and blocky, with some areas being relatively intact and columnar.ρ = 2790.50 kg/m3, v = 5527.80 m/s, σc = 99.58 MPa, σt = 9.23 MPa, E = 14.21 GPa, C = 20.35 MPa, φ = 46.81, μ = 0.33
Floor dolomiteAbout 150Light gray to gray in color, fine-grained texture, and medium-bedded structure. The core is relatively intact and short columnar in shape, with some areas broken and in the form of fragments.ρ = 2778.96 kg/m3, v = 5271.10 m/s, σc = 123.91 MPa, σt = 8.06 MPa, E = 17.93 GPa, C = 25.24 MPa, φ = 44.90, μ = 0.27
Notes: ρ, v, σc, σt, E, C, φ, and μ denote the density, longitudinal wave velocity, uniaxial compressive strength, tensile strength, Young’s modulus, cohesion, internal friction angle, and Poisson’s ratio of the rock specimens, respectively.
Table 2. Optimization results of mapping function for roadways in Kunyang No. 2 phosphate mine.
Number of Ck TermsNumber of Iterations Objective Function ValueC0C1C2C3C4C5C6C7
3850.9561−0.2476−0.13140.0495
41560.1552−0.2367−0.09940.0792−0.0788
52330.0686−0.2471−0.10770.0753−0.08240.0235
62780.0209−0.2456−0.10340.068−0.09620.02650.0139
75840.0067−0.2458−0.10380.0725−0.09640.02890.0169−0.0103
84790.0606−0.24−0.1090.0523−0.10040.03660.02570.0014−0.0049
Table 3. Values of calibration constants for each stress sensor unit.
Item1#-z1#-y1#-x2#-z2#-y2#-x
M value1.73639 × 10−51.26855 × 10−55.21616 × 10−55.03488 × 10⁻⁶−1.5931 × 10⁻⁶−2.11127 × 10⁻⁵
N value0.00258890.0151946−0.1068070.06895480.06720410.0046013
Table 4. Vibration frequency of stress sensors at different times.
Time/d1#-z1#-y1#-xTime/d2#-z2#-y2#-x
02016.072012.552055.5102063.372072.132062.65
31922.491946.911976.1241971.241982.631963.77
71902.871905.931956.8491968.861973.601926.32
301901.951904.461941.29171964.341968.701923.25
401901.851904.421941.32401963.821969.671920.88
511901.901904.271941.25501963.581968.911921.25
601901.871904.551941.29611963.841968.321921.13
881901.951904.311941.31701964.031968.571920.87
1011901.961904.411941.26981963.271968.691920.79
1141901.831904.431941.291111963.621968.541921.05
1311901.821904.461941.321241963.661968.491920.88
1381963.561968.331920.89
Note: unit, Hz.
Disclaimer/Publisher’s Note: The statements, opinions and data contained in all publications are solely those of the individual author(s) and contributor(s) and not of MDPI and/or the editor(s). MDPI and/or the editor(s) disclaim responsibility for any injury to people or property resulting from any ideas, methods, instructions or products referred to in the content.