Article

Deep Learning Application of Fruit Planting Classification Based on Multi-Source Remote Sensing Images

1
Institute of Resources and Information, Xinjiang Academy of Forestry Sciences, Urumqi 830063, China
2
College of Computer and Information Engineering, Xinjiang Agricultural University, Urumqi 830052, China
3
Institute of Afforestation and Desertification Research, Xinjiang Academy of Forestry Sciences, Urumqi 830063, China
*
Author to whom correspondence should be addressed.
Appl. Sci. 2025, 15(20), 10995; https://doi.org/10.3390/app152010995 (registering DOI)
Submission received: 21 July 2025 / Revised: 30 September 2025 / Accepted: 30 September 2025 / Published: 13 October 2025

Abstract

With global climate change, urbanization, and agricultural resource limitations, precision agriculture and crop monitoring are crucial worldwide. Integrating multi-source remote sensing data with deep learning enables accurate crop mapping, but selecting optimal network architectures remains challenging. To improve remote sensing-based fruit planting classification and support orchard management and rural revitalization, this study explored feature selection and network optimization. We proposed an improved CF-EfficientNet model (incorporating FGMF and CGAR modules) for fruit planting classification. Multi-source remote sensing data (Sentinel-1, Sentinel-2, and SRTM) were used to extract spectral, vegetation, polarization, terrain, and texture features, thereby constructing a high-dimensional feature space. Feature selection identified 13 highly discriminative bands, forming an optimal dataset, namely the preferred bands (PBs). At the same time, two classification datasets—multi-spectral bands (MS) and preferred bands (PBs)—were constructed, and five typical deep learning models were introduced to compare performance: (1) EfficientNetB0, (2) AlexNet, (3) VGG16, (4) ResNet18, (5) RepVGG. The experimental results showed that the EfficientNetB0 model based on the preferred band performed best in terms of overall accuracy (87.1%) and Kappa coefficient (0.677). Furthermore, a Fine-Grained Multi-scale Fusion (FGMF) and a Condition-Guided Attention Refinement (CGAR) were incorporated into EfficientNetB0, and the traditional SGD optimizer was replaced with Adam to construct the CF-EfficientNet architecture. The results indicated that the improved CF-EfficientNet model achieved high performance in crop classification, with an overall accuracy of 92.6% and a Kappa coefficient of 0.830. These represent improvements of 5.5 percentage points and 0.153, compared with the baseline model, demonstrating superiority in both classification accuracy and stability.

1. Introduction

With the continuous development and application of remote sensing technology, crop classification based on remote sensing images has attracted more and more attention in the fields of agricultural resource management, precision agriculture, and environmental monitoring [1]. As one of the important types of agricultural crops, forest and fruit crops often bring challenges to remote sensing image classification due to the complexity of planting environments, species diversity, and differences in growing seasons [2,3]. Especially in complex backgrounds, there is often a lack of obvious distinguishing features between the categories of forest and fruit crops, which makes it difficult for traditional image classification methods to achieve ideal accuracy [4,5,6]. Therefore, improving the classification accuracy of forest and fruit crops, especially in changing environments and complex backgrounds, has become an important research direction in remote sensing image classification [3].
In recent years, deep learning, especially convolutional neural network (CNN), has made significant progress in the field of remote sensing image classification. Traditional deep learning models, such as AlexNet and VGGNet, have been widely used in crop classification tasks [7]. For example, Liu et al. [8] introduced the VGG16 model for crop classification, which significantly improved classification accuracy. However, these conventional networks have some limitations in dealing with complex background information, especially in feature extraction [9,10]. In order to solve these problems, increasing research has turned to feature extraction networks using deep layers, such as the ResNet series and Inception series.
For example, Dong and Chen proposed a multi-level feature fusion network (MFNet) based on a ResNet50 backbone, which horizontally integrates features from different depth levels. This approach effectively enhances crop classification accuracy, particularly in remote sensing images characterized by complex backgrounds and diverse species distributions [11]. Although these deep learning models have achieved good results in classification tasks, there are still problems such as high computational resource consumption, long training time, and insufficient generalization ability of the model [12,13,14].
In order to overcome the above problems, the EfficientNet series, as an efficient deep learning architecture, has gradually become a new research hotspot in remote sensing image classification [15,16,17,18]. The EfficientNetB0 model, as the basic model of this series, adopts a composite scaling strategy. By simultaneously optimizing the width, depth, and resolution of the network, the efficiency of the model is significantly improved and the computational cost is reduced [19]. For example, Wu et al. proposed an MLP model based on multi-branch feature fusion and dilated convolutions, which enhances crop classification accuracy in hyper-spectral images through a multi-level feature fusion strategy [20].
In addition, the introduction of attention mechanisms in recent years has further enhanced the feature extraction ability of deep learning models. In the field of remote sensing-based crop classification, Li et al. proposed a model named MSAA-Net, which integrates multi-scale convolutional structures with self-attention mechanisms [21]. This approach significantly improves the ability to capture spatial features at various scales in remote sensing imagery. In another line of work, Xue et al. proposed a hybrid framework named CAE-ADN, which combines a convolutional autoencoder (CAE) with a DenseNet-based architecture integrated with the Convolutional Block Attention Module (CBAM). This framework was developed for fruit or orchard image classification tasks, such as distinguishing among different fruit categories [22]. Furthermore, several studies have introduced context-aware or condition-guided attention mechanisms, which enable models to better focus on fine-grained features under complex background conditions [23,24]. Although these methods have achieved notable progress in classification accuracy, designing effective training strategies—such as data augmentation, transfer learning, and multi-task learning—remains a key challenge for improving model generalization in remote sensing crop classification [25,26].
This study aims to improve the classification accuracy of fruit planting under complex backgrounds and diverse environmental conditions, and to optimize deep learning models to enhance their ability to recognize fine-grained features. Simultaneously, an efficient, low-dimensional, and information-rich input feature set was constructed to provide reliable data support for remote sensing-based crop classification. To achieve these objectives, the following key tasks were undertaken: first, a comprehensive high-dimensional feature space was constructed; second, the RF_RFE method was applied to select 13 highly discriminative key bands, forming the preferred bands (PBs) dataset; third, the classification performance of five deep learning models was compared using both the multi-spectral bands and the PB dataset to evaluate their effectiveness in forest and fruit crop classification; finally, based on the experimental results, the CF-EfficientNet architecture was designed to improve classification accuracy and model robustness under complex conditions. Through these tasks, a systematic approach for forest and fruit crop classification was proposed, providing an effective technical foundation for remote sensing image analysis and precision agriculture applications.

2. Materials and Methods

2.1. Study Area

The Hotan region is situated in the southern part of the Xinjiang Uygur Autonomous Region (Figure 1). It is bordered by the Taklimakan Desert to the west, the Kunlun Mountains to the east, and the Pamir Plateau to the south, forming a distinctive geographical setting. The terrain is characterized by a complex mosaic of mountains, basins, and deserts, resulting in highly diverse landforms. The region experiences a typical temperate continental climate, with hot and arid summers, cold and dry winters, distinct seasonal variations, abundant sunshine, and large diurnal temperature differences. These climatic and environmental conditions create a favorable habitat for the cultivation of fruit trees, cereals, and other economically important crops.

2.2. Satellite Data and Preprocessing

All remote sensing data used in this study were accessed, processed, and downloaded online via the Google Earth Engine (GEE) platform. Specifically, the data includes multi-spectral imagery from Sentinel-2, backscatter coefficients from Sentinel-1, and digital elevation data from the SRTM (Table 1). Cloud-free images from April 2024 to October 2024 were selected to cover the entire growing season of fruit planting. The RF_RFE feature selection algorithm was employed to identify 13 key spectral bands, which were then used as the optimal feature combination for the main input data in the experiments.

2.2.1. Sentinel-1 Data

The Sentinel-1 mission consists of two satellites, Sentinel-1A and Sentinel-1B, with a 6-day revisit cycle, equipped with C-band synthetic aperture radar (SAR) [1]. This study utilized data from the VV and VH polarization modes. All data underwent orbit correction, thermal noise removal, radiometric calibration, and terrain correction.

2.2.2. Sentinel-2 Data

The Sentinel-2 mission consists of two high-resolution satellites, Sentinel-2A and Sentinel-2B, which complement each other with a revisit cycle reduced from 10 days for a single satellite to 5 days. The data used in this study are from Sentinel-2A and include specially processed surface reflectance data, aimed at enhancing the consistency between different satellite datasets [27]. To ensure spectral diversity and completeness, coastal, water vapor, and cirrus bands were excluded during the image preprocessing. A QA60 band was used for cloud masking, and the final image was generated using median compositing (Table 2).
In addition to the original spectral bands, a broader suite of candidate vegetation indices (VIs) was initially calculated from the Sentinel-2 surface reflectance data. These indices are designed to highlight specific vegetation properties, such as photosynthetic activity, canopy structure, and water content. The nine VIs listed in this study—NDVI, EVI, RVI, DVI, GCVI, REP, LSWI, SAVI, and CVI—were included as key candidates for the subsequent feature selection process, and their corresponding calculation expressions are provided in Table 3.

2.2.3. SRTM Data

The digital elevation model and its derivative variables are related to the altitude of the land type distribution, indicating the importance of terrain data as supplementary data in land cover classification. SRTM data plays a key role in the production of surface elevation model (DEM), which is very important for remote sensing research and terrain analysis [28,29].

2.3. Sample Data

The reference samples were derived from the 2024 vector dataset of the forest and fruit resource survey conducted by the Xinjiang Academy of Forestry Sciences (internal data, unpublished), which focused on the characteristic forest and fruit industry in the Hotan region. Based on this dataset, fruit planting samples were delineated and categorized into five classes: walnut, jujube, grape, apricot, and “other.” While the first four classes do not encompass all forest and fruit crop types present in the region, they represent the most widely distributed categories. The “other” class comprises all remaining fruit planting types not included in the four main categories.

2.4. Methods

2.4.1. Methodological Overview

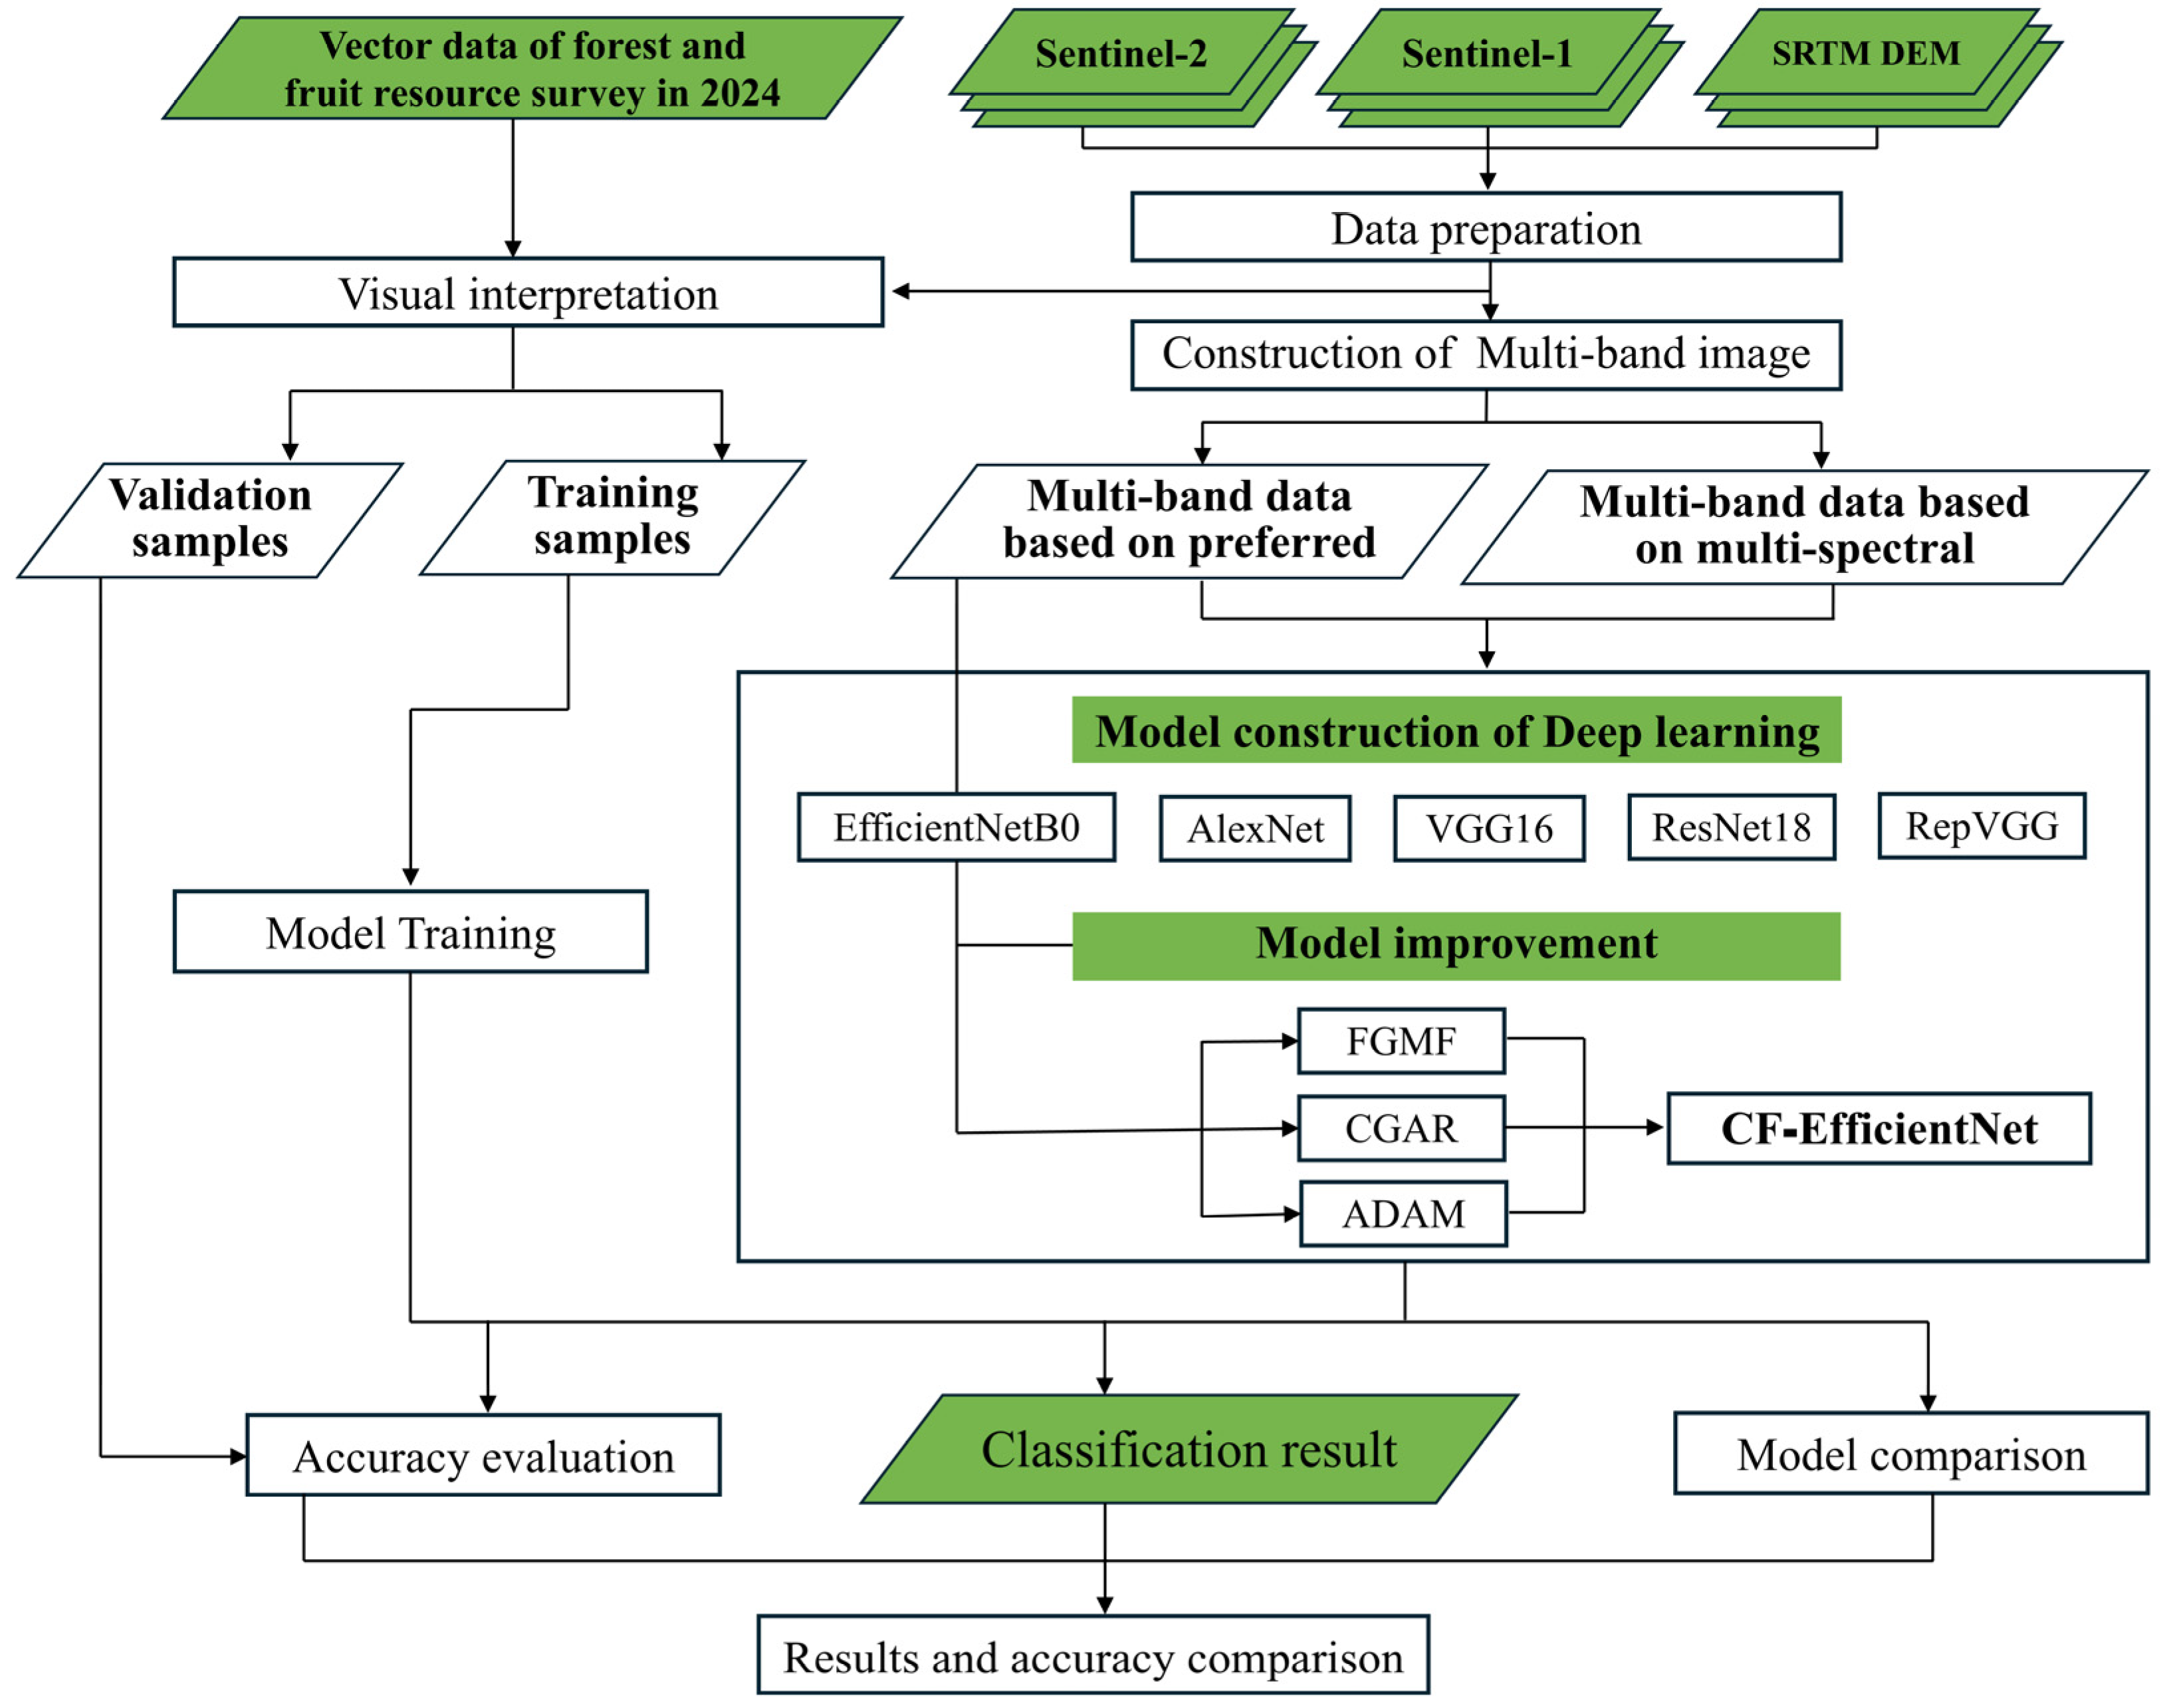
The overall workflow is illustrated (Figure 2). Multi-source remote sensing data were used, and a feature selection strategy identified key spectral bands with high discriminative power to construct an optimized band dataset. To evaluate the effectiveness of feature selection, two classification datasets were developed: one using original multi-spectral bands and the other using selected optimal bands. These were used in comparative experiments involving multiple deep learning models to assess their performance in fruit planting classification. Based on the results, an enhanced CF-EfficientNet model was proposed, with EfficientNetB0 as the base architecture, to improve classification accuracy and robustness.

2.4.2. Feature Selection

To provide an efficient, low-dimensional, and information-rich feature set for subsequent deep learning model training and to improve the accuracy of fruit planting classification, this study compared the feature subsets generated by four feature selection methods—out-of-bag (OOB), Correlation-based Feature Selection (CFS), Mutual Information (MI), and random forest–recursive feature elimination (RF_RFE)—in the context of fruit planting classification. Each method was independently applied to the dataset to produce its own ranked feature list, without directly integrating the rankings across methods. This approach allowed the characteristics and advantages of each method to be fully demonstrated, and based on this, the optimal feature subset was selected to serve as high-quality input for the deep learning models. The specific descriptions of each method are provided below:
The OOB method is derived from the internal validation mechanism of the random forest algorithm. It evaluates the importance of each feature by computing the Gini index and the out-of-bag classification error [30]. Specifically, during model training, a portion of the samples (i.e., out-of-bag samples) are excluded from the construction of each decision tree. These samples are then used to assess the model’s predictive performance. Feature importance is determined by measuring the change in OOB error after permuting each feature. This approach not only avoids the need for an additional validation set, thereby saving computational resources, but also provides robust and unbiased estimates of feature relevance. In remote sensing applications with high-dimensional spectral data, the OOB method effectively highlights features that significantly contribute to model performance.
The CFS method selects an optimal feature subset by jointly considering the relevance between each feature and the target variable, as well as the redundancy among features [31]. It follows the principle that a good feature subset should contain features that are highly correlated with the target class but uncorrelated with each other. The method uses a heuristic evaluation function to balance these two criteria, promoting the selection of features that offer complementary and non-overlapping information. This is particularly beneficial for multi-spectral remote sensing data, where strong correlations often exist among spectral bands. By removing redundant features, the CFS method helps to reduce overfitting, improve model stability, and accelerate training convergence.
The Mutual Information (MI) method quantifies how much a feature reduces uncertainty about the target, capturing both linear and nonlinear relationships. It is well-suited for complex remote sensing tasks involving spectral, texture, and vegetation features, supporting better class separability and generalization. The selected features contribute to enhanced model generalization and finer class separability [32].
The RF_RFE approach integrates the strengths of random forest and recursive feature elimination, making it well-suited for complex feature selection in high-dimensional settings [33,34]. Random forest naturally models nonlinear interactions and is robust to outliers and multicollinearity [35]. By iteratively removing the least important features and retraining the model, RF_RFE effectively eliminates redundant or irrelevant inputs while preserving classification performance, thereby improving the model’s generalization capability and computational efficiency.
To ensure fairness and consistency across experiments, all four feature selection methods were implemented using fixed parameters without any hyperparameter tuning. Specifically, both the OOB and RF_RFE methods employed random forest comprising 100 decision trees (n_estimators = 100), the MI method was configured with a fixed random seed (random_state = 42), and the CFS method relied on its standard scoring mechanism without any tunable parameters.
During the feature selection process, a stepwise elimination strategy was adopted, iteratively removing low-contribution features to minimize bias introduced by manual thresholding. Each method was executed independently without integration. At each step, a random forest classifier was used to compute the Cohen’s Kappa coefficient, and features were incrementally added according to their ranking with a step size of one (step = 1). The feature subset achieving the highest Kappa value was ultimately selected as the input for the deep learning models, thereby establishing a reliable and information-rich, low-dimensional feature foundation.

2.4.3. Deep Learning Architectures

Several classical convolutional neural networks were employed in this study to evaluate crop classification performance based on remote sensing imagery [36]. AlexNet, as an early deep learning architecture, utilizes multiple convolutional and pooling layers to extract hierarchical features and has demonstrated solid performance in various image classification tasks [37]. VGG16 extends this framework by employing a deeper architecture with small convolutional kernels and pooling operations, enabling enhanced feature extraction in complex classification scenarios. ResNet18 addresses the degradation problem in deeper networks by introducing residual connections, which facilitate the learning of complex patterns and improve training stability [38]. RepVGG simplifies the network architecture while maintaining competitive accuracy by stacking convolutional layers in a plain topology, thereby achieving a favorable trade-off between speed and performance [39]. These models, with their distinct architectural characteristics, contribute to understanding the effectiveness of different network designs for crop classification.
In this study, EfficientNetB0 was selected as the baseline model due to its balance of accuracy and computational efficiency. Originally proposed by Google Research in 2019, EfficientNet introduces a compound scaling strategy, which uniformly scales the network’s depth, width, and input resolution. This approach allows for effective performance optimization under constrained computational resources, making it highly suitable for large-scale remote sensing classification tasks.

2.4.4. Deep Learning Training Strategy

Deep learning models were evaluated for their classification performance on multi-source remote sensing orchard data, including AlexNet, VGG16, ResNet18, RepVGG, and EfficientNetB0 along with its modified version. To ensure a fair comparison among the models, identical training configurations were applied, including the number of epochs, batch size, initial learning rate, and optimizer. Specifically, the number of epochs was set to 50, the batch size was 128 during training and 32 during validation, the Adam optimizer was used consistently, and the initial learning rate was set to 1 × 10⁻³, with a gradual reduction to 1 × 10⁻⁴ during training to improve convergence.
The difference in batch sizes between training and validation was implemented to balance training efficiency and memory usage. A larger batch size of 128 was used during training to improve gradient estimation stability and overall efficiency, whereas a smaller batch size of 32 was employed during validation to reduce memory consumption and ensure smooth evaluation of the entire validation set. This approach is widely adopted in deep learning practice and has been shown to be both reasonable and effective.
Regarding the choice of optimizer, Adam was selected over the conventional SGD. Preliminary experiments indicated that models trained with SGD achieved slightly lower validation accuracy under the same number of epochs, whereas the adoption of Adam led to a notable improvement in validation performance (as indicated in Section 3.3.1, Ablation Study Analysis, Table 4, where No. a refers to SGD and No. b to Adam). The adaptive learning rate mechanism of Adam enables faster convergence and improved stability under small-batch conditions, while exhibiting reduced sensitivity to the initial learning rate. Consequently, Adam was adopted as the optimizer for all models.
All models were trained from scratch without using any pre-trained weights. This approach was necessary because the dataset contains specialized multi-spectral channels that are incompatible with standard RGB channels, rendering conventional pre-trained weights, such as those from ImageNet, inapplicable. Specifically, for CF-EfficientNet, no channel adaptation was performed; training from scratch ensured consistency between input data and network architecture and maintained fairness across all model comparisons. This strategy aligns with standard practices in transfer learning for remote sensing image classification.
In summary, the adoption of a unified training strategy combined with from-scratch training ensured fair comparison among models while maintaining training stability and convergence efficiency.

2.4.5. CF-EfficientNet Model

Based on the EfficientNetB0 backbone, an improved CF-EfficientNet architecture is developed to enhance the representation of fine details and inter-class differences in remote sensing image classification.
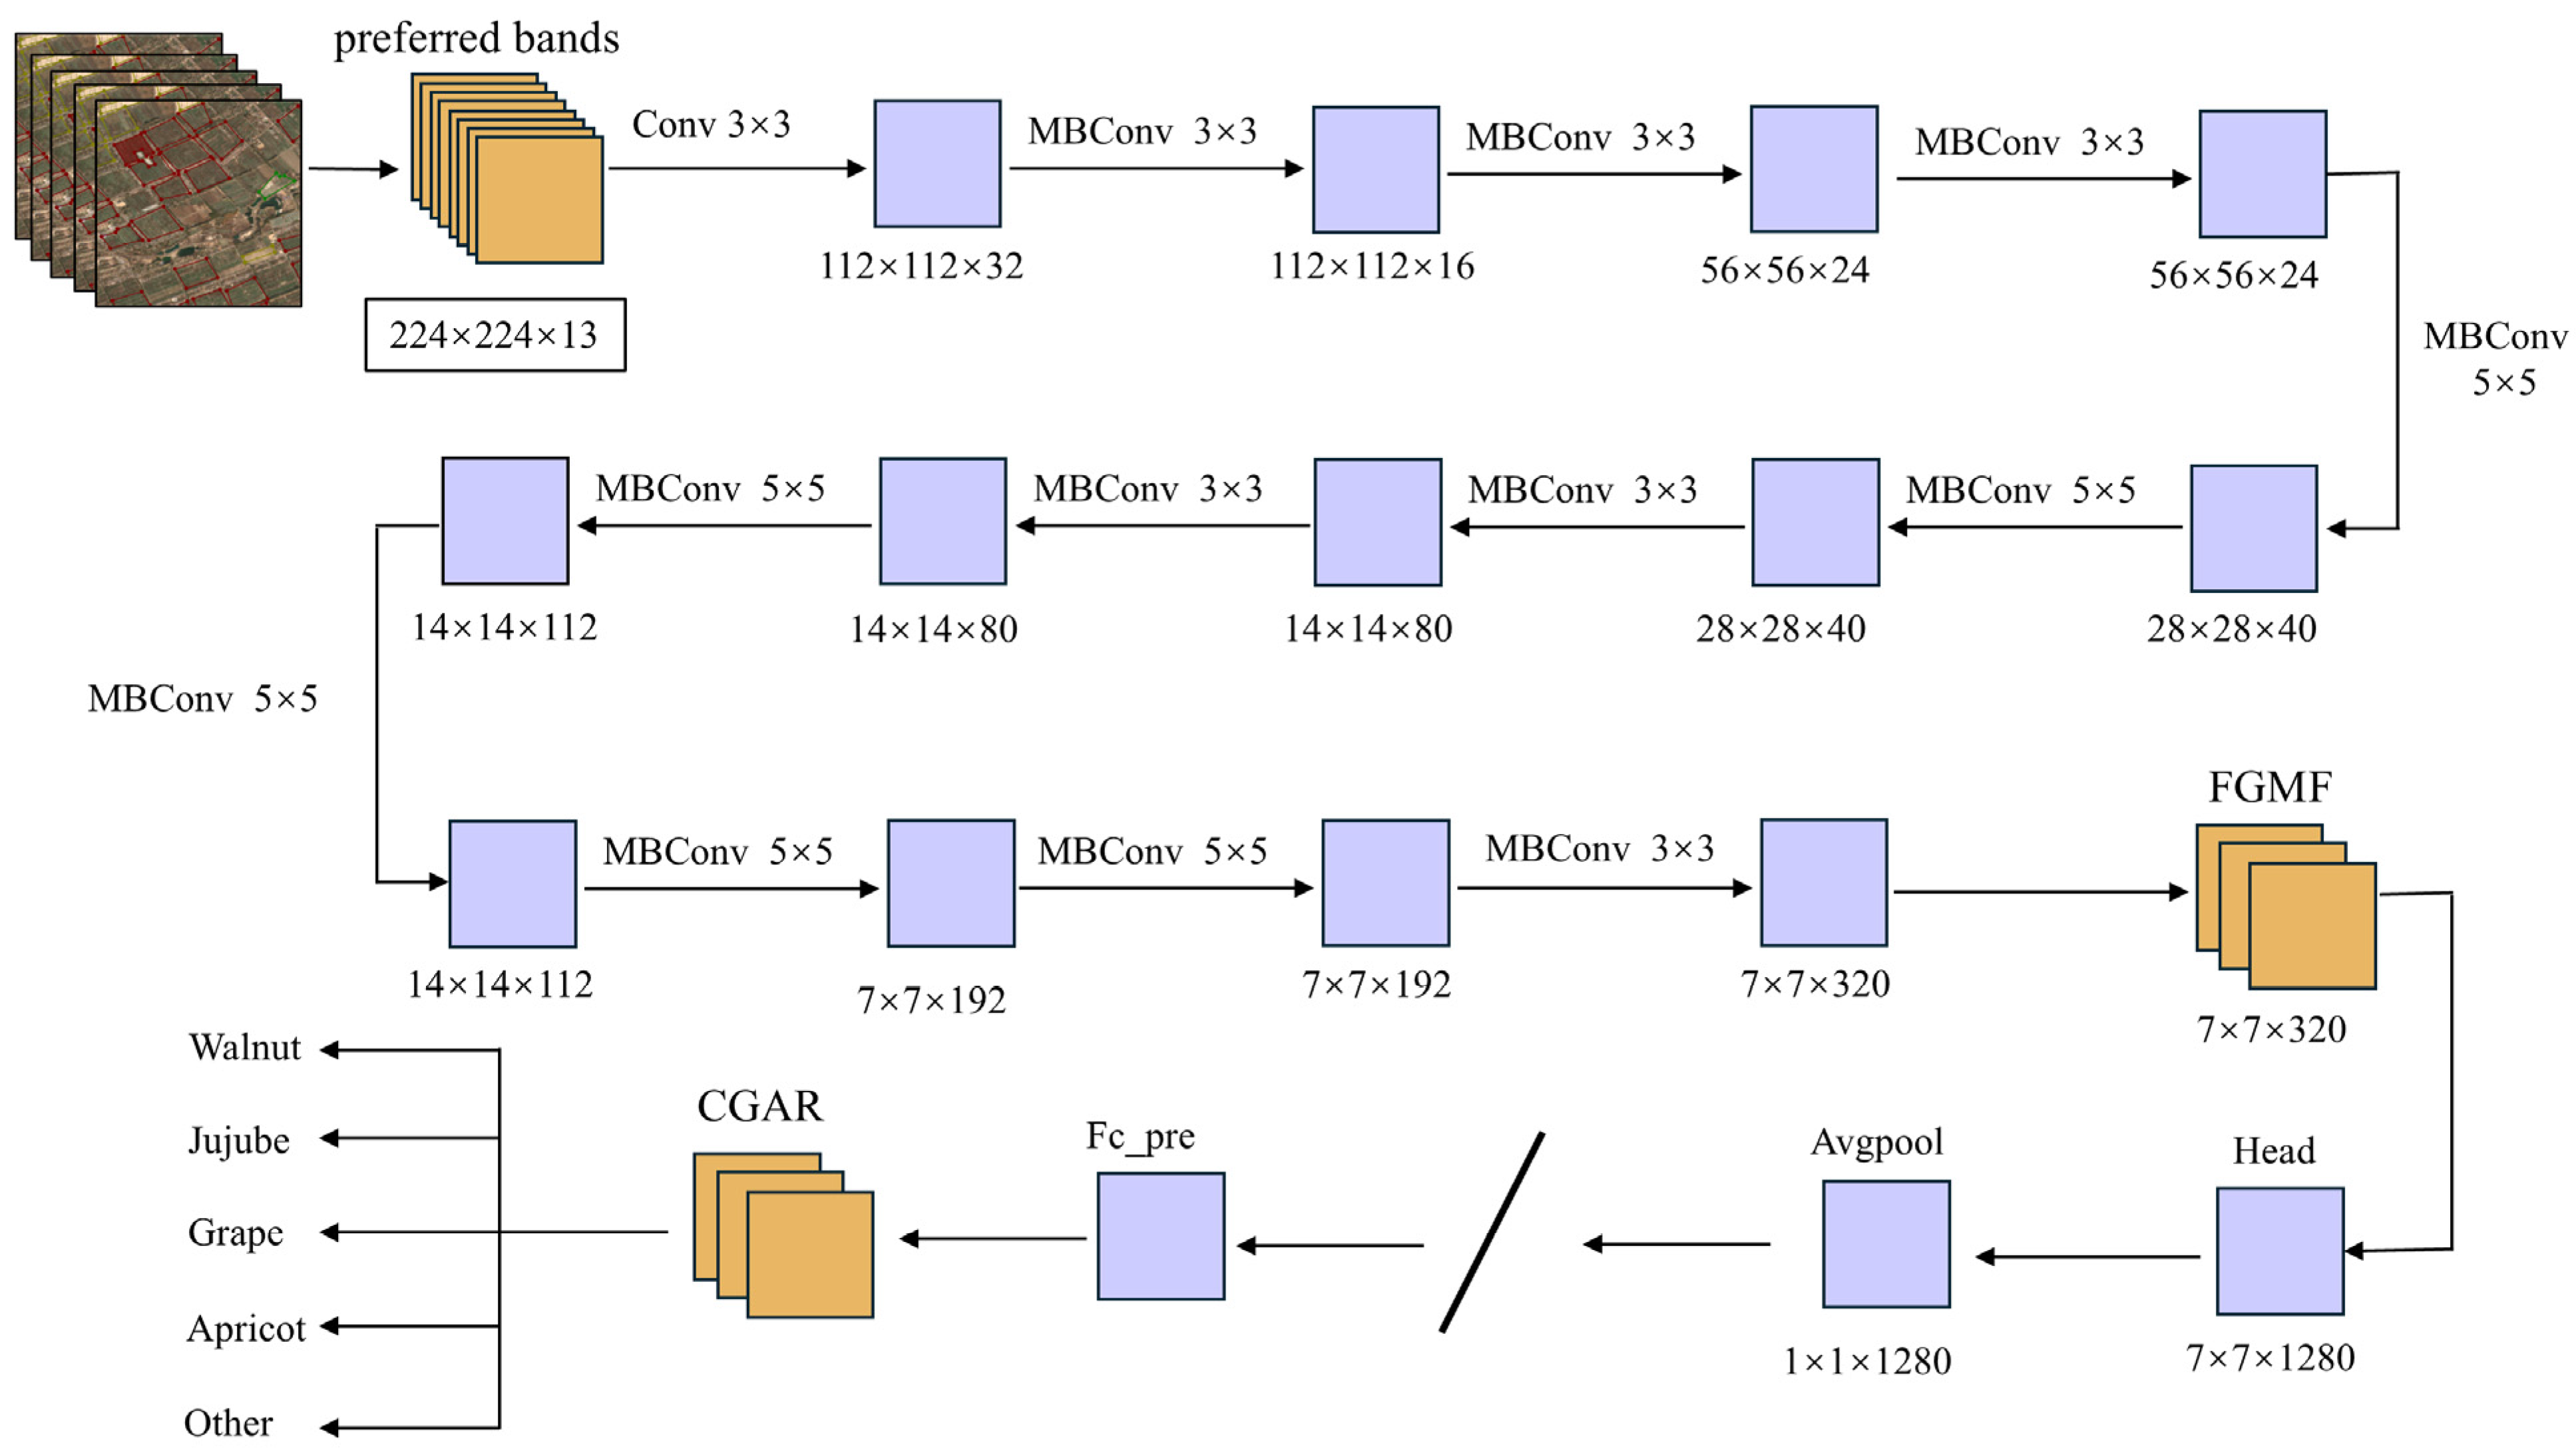
The overall architecture of the proposed CF-EfficientNet is depicted in Figure 3. To address the limitations of traditional convolutional networks in capturing detailed information in high-resolution imagery, a Fine-Grained Multi-scale Fusion (FGMF) module is introduced [40]. This module extracts multi-scale features in parallel and applies a weighted fusion mechanism to integrate shallow spatial details with deep semantic information, thereby strengthening the model’s sensitivity to edges, textures, and other discriminative cues. Here, the name “CF” is derived from the first letters of the two key modules, CGAR and FGMF, highlighting that the model’s design leverages these modules to capture Condition-guided and Fine-grained discriminative features for fruit planting classification. This explanation clarifies the rationale behind the model naming and emphasizes its specialized function in capturing crop-relevant information.
In addition, a Condition-Guided Attention Refinement (CGAR) module is incorporated to dynamically reweight spatial features using prior information or preliminary classification outputs [41]. This enables the network to focus on class-relevant regions while suppressing irrelevant background noise, thereby improving the specificity and discriminative capacity of the learned features, particularly in complex or heterogeneous landscapes [24].
For optimization, the standard SGD optimizer is replaced with Adam, which adaptively adjusts the learning rate to accelerate convergence and improve training stability. Furthermore, multiple data augmentation strategies are employed to increase sample diversity and enhance the model’s generalization ability.
Overall, CF-EfficientNet integrates structural enhancements and training improvements to achieve superior classification accuracy and robustness, outperforming the original EfficientNetB0 in crop classification tasks based on multi-source remote sensing data [42].

2.4.6. Experiment Design

According to the feature selection strategy described in Section 3.2, two input datasets were constructed for deep learning classification experiments (Table 4). The first dataset consists of the original spectral band combination, covering 10 representative remote sensing spectral bands. The second dataset includes 13 key features selected using the random forest recursive feature elimination (RF_RFE) method from multi-source remote sensing data, encompassing spectral, vegetation index, texture, and topographic information. These two feature combinations were used as experimental variables and were separately input into several mainstream deep learning models for training and classification, in order to systematically evaluate the effectiveness of feature selection in improving classification accuracy and model stability.
Based on the model comparison results, EfficientNetB0 was identified as the most effective backbone architecture. An improved model, CF-EfficientNet, was further proposed to enhance feature extraction capability and overall performance in remote sensing image classification tasks.

3. Results

3.1. Preferred Bands

To construct an efficient, low-dimensional, and information-rich feature set for subsequent deep learning model training, the feature subsets generated by four feature selection methods—OOB, CFS, MI, RF_RFE—were compared in this study, with Cohen’s Kappa coefficient used as the primary evaluation metric. The variation in classification accuracy across different feature subset sizes is shown in Figure 4.
To reduce the influence of subjective factors inherent in traditional threshold-based methods, the approach proposed in previous studies was adopted [43]. Initially, the 66 original features were ranked according to their importance scores, and the top 35 most significant features were selected to construct the initial feature set. Subsequently, a stepwise decrement strategy was employed, in which the least important feature was removed in each iteration. The remaining feature subsets were then used for crop classification modeling and accuracy evaluation. To ensure consistency and comparability of results, the random forest (RF) classifier was uniformly applied during the feature subset classification process. Iterative feature removal and accuracy validation were conducted to analyze the relationship between feature subset size and classification performance, which was quantified using the Kappa coefficient.
During incremental training, the Kappa coefficient of each feature subset was independently evaluated. The results indicated that the subset composed of 13 key features selected by RF_RFE exhibited the best performance, with 53 features removed, achieving a Kappa coefficient of 0.8941 and forming a feature set that balances accuracy and dimensionality, effectively considering both feature quantity and classification performance. The Kappa coefficients for OOB and MI were 0.8927 and 0.8788, corresponding to feature counts of 15 and 14, respectively, demonstrating the complementarity of the features selected by different methods. Although the CFS subset was the smallest, containing only 12 features, it achieved a Kappa coefficient of 0.8788, highlighting the advantage of redundancy reduction in constructing a compact feature representation.
Based on this analysis, the preferred bands (PBs) selected by RF_RFE were used as input for the subsequent deep learning experiments, ensuring efficient and stable model training. The comparison results indicate that, although multiple feature selection methods can improve model performance, the choice of method significantly affects the composition, quantity, and interpretability of the feature subset. Reducing feature dimensionality not only accelerates training but also enhances model stability and generalization, providing an efficient and reliable feature input for fruit planting classification tasks.

3.2. Classification Based on Multi-Spectral Bands and Preferred Bands

To evaluate the impact of input feature selection on crop classification performance, five deep learning models (AlexNet, VGG16, ResNet18, RepVGG, and EfficientNetB0) were employed in this study. All models were trained under the same training settings. Comparative experiments were conducted based on multi-spectral bands (MS) and preferred bands (PBs), with a comprehensive analysis of each model’s overall accuracy (OA) and Kappa coefficient under the two feature conditions (Figure 5).
The radar chart visualizes the classification performance of the models across four metrics: OA_MS, OA_PB, Kappa_MS, and Kappa_PB. In this visualization, a larger enclosed area indicates superior performance across the evaluated metrics (Figure 5a). As shown, EfficientNetB0 encloses the largest area, highlighting its consistently outstanding performance across all indicators, whereas VGG16 and AlexNet display significantly smaller profiles, reflecting their relatively weaker classification capabilities.
A detailed quantitative comparison further confirms the superiority of EfficientNetB0, which achieved overall accuracy (OA) values of 85.8% and 87.1% under the multi-spectral bands (MS) and preferred bands (PBs) conditions, respectively, outperforming all other models. ResNet18 ranked second, with OA values of 82.6% and 85.0% for MS and PB, respectively. In contrast, AlexNet and VGG16 exhibited lower classification accuracies, with OA values of 79.6% and 72.8% (MS) and 80.9% and 76.6% (PB) (Figure 5b). Regarding the Kappa coefficient, EfficientNetB0 also demonstrated excellent classification consistency, with values of 0.598 and 0.677 under the MS and PB conditions, significantly surpassing the other models. ResNet18 followed with Kappa coefficients of 0.578 and 0.642, while AlexNet and VGG16 showed relatively lower values of 0.253 and 0.217 (MS) and 0.336 and 0.440 (PB), respectively (Figure 5b).
In summary, the EfficientNetB0 model based on preferred bands exhibited superior performance in the crop classification task. Particularly under the preferred bands condition, EfficientNetB0 attained an OA of 87.1% and a Kappa coefficient of 0.677, outperforming its counterparts. These results indicate that EfficientNetB0 possesses strong feature extraction and generalization capabilities, enabling robust classification of diverse crop types across different geographic regions. Building upon these advantages, Section 3.3 will focus on the structural optimization of the EfficientNetB0 model to improve its computational efficiency and classification precision, thereby enhancing its potential for application in large-scale and high-accuracy crop classification.

3.3. Structural Optimization and Classification Performance Evaluation of CF-EfficientNet

3.3.1. Ablation Study Analysis

To evaluate the effectiveness of the FGMF and CGAR modules introduced into the CF-EfficientNet architecture, an ablation study was conducted, in which these key components were progressively removed or added under identical conditions, with the model retrained. First, a comparison of optimizers was performed: the baseline model (No.a) was trained using the SGD optimizer, whereas replacing SGD with the Adam optimizer (No.b) under the same conditions resulted in higher validation accuracy for an equivalent number of training epochs. Therefore, Adam was consistently employed in the subsequent ablation experiments (No.c–No.e) to ensure fair comparisons.
Building upon this foundation, the incremental integration of key modules further enhanced model performance. As shown in Table 5, No.c, which incorporated the FGMF module into No.b, resulted in a substantial improvement, with overall accuracy increasing to 89.5% and the Kappa coefficient reaching 0.744. The independent introduction of the CGAR module (No.d) further enhanced performance, achieving an accuracy of 91.8% and a Kappa coefficient of 0.782, thereby validating its role in improving discriminative capability and classification consistency under complex backgrounds. Finally, the complete CF-EfficientNet model (No.e), which integrated both FGMF and CGAR modules, achieved the highest performance, with an accuracy of 92.6% and a Kappa coefficient of 0.830. These results demonstrate the complementary nature of the FGMF and CGAR modules in feature extraction and representation and confirm their critical role in enhancing classification accuracy and consistency.
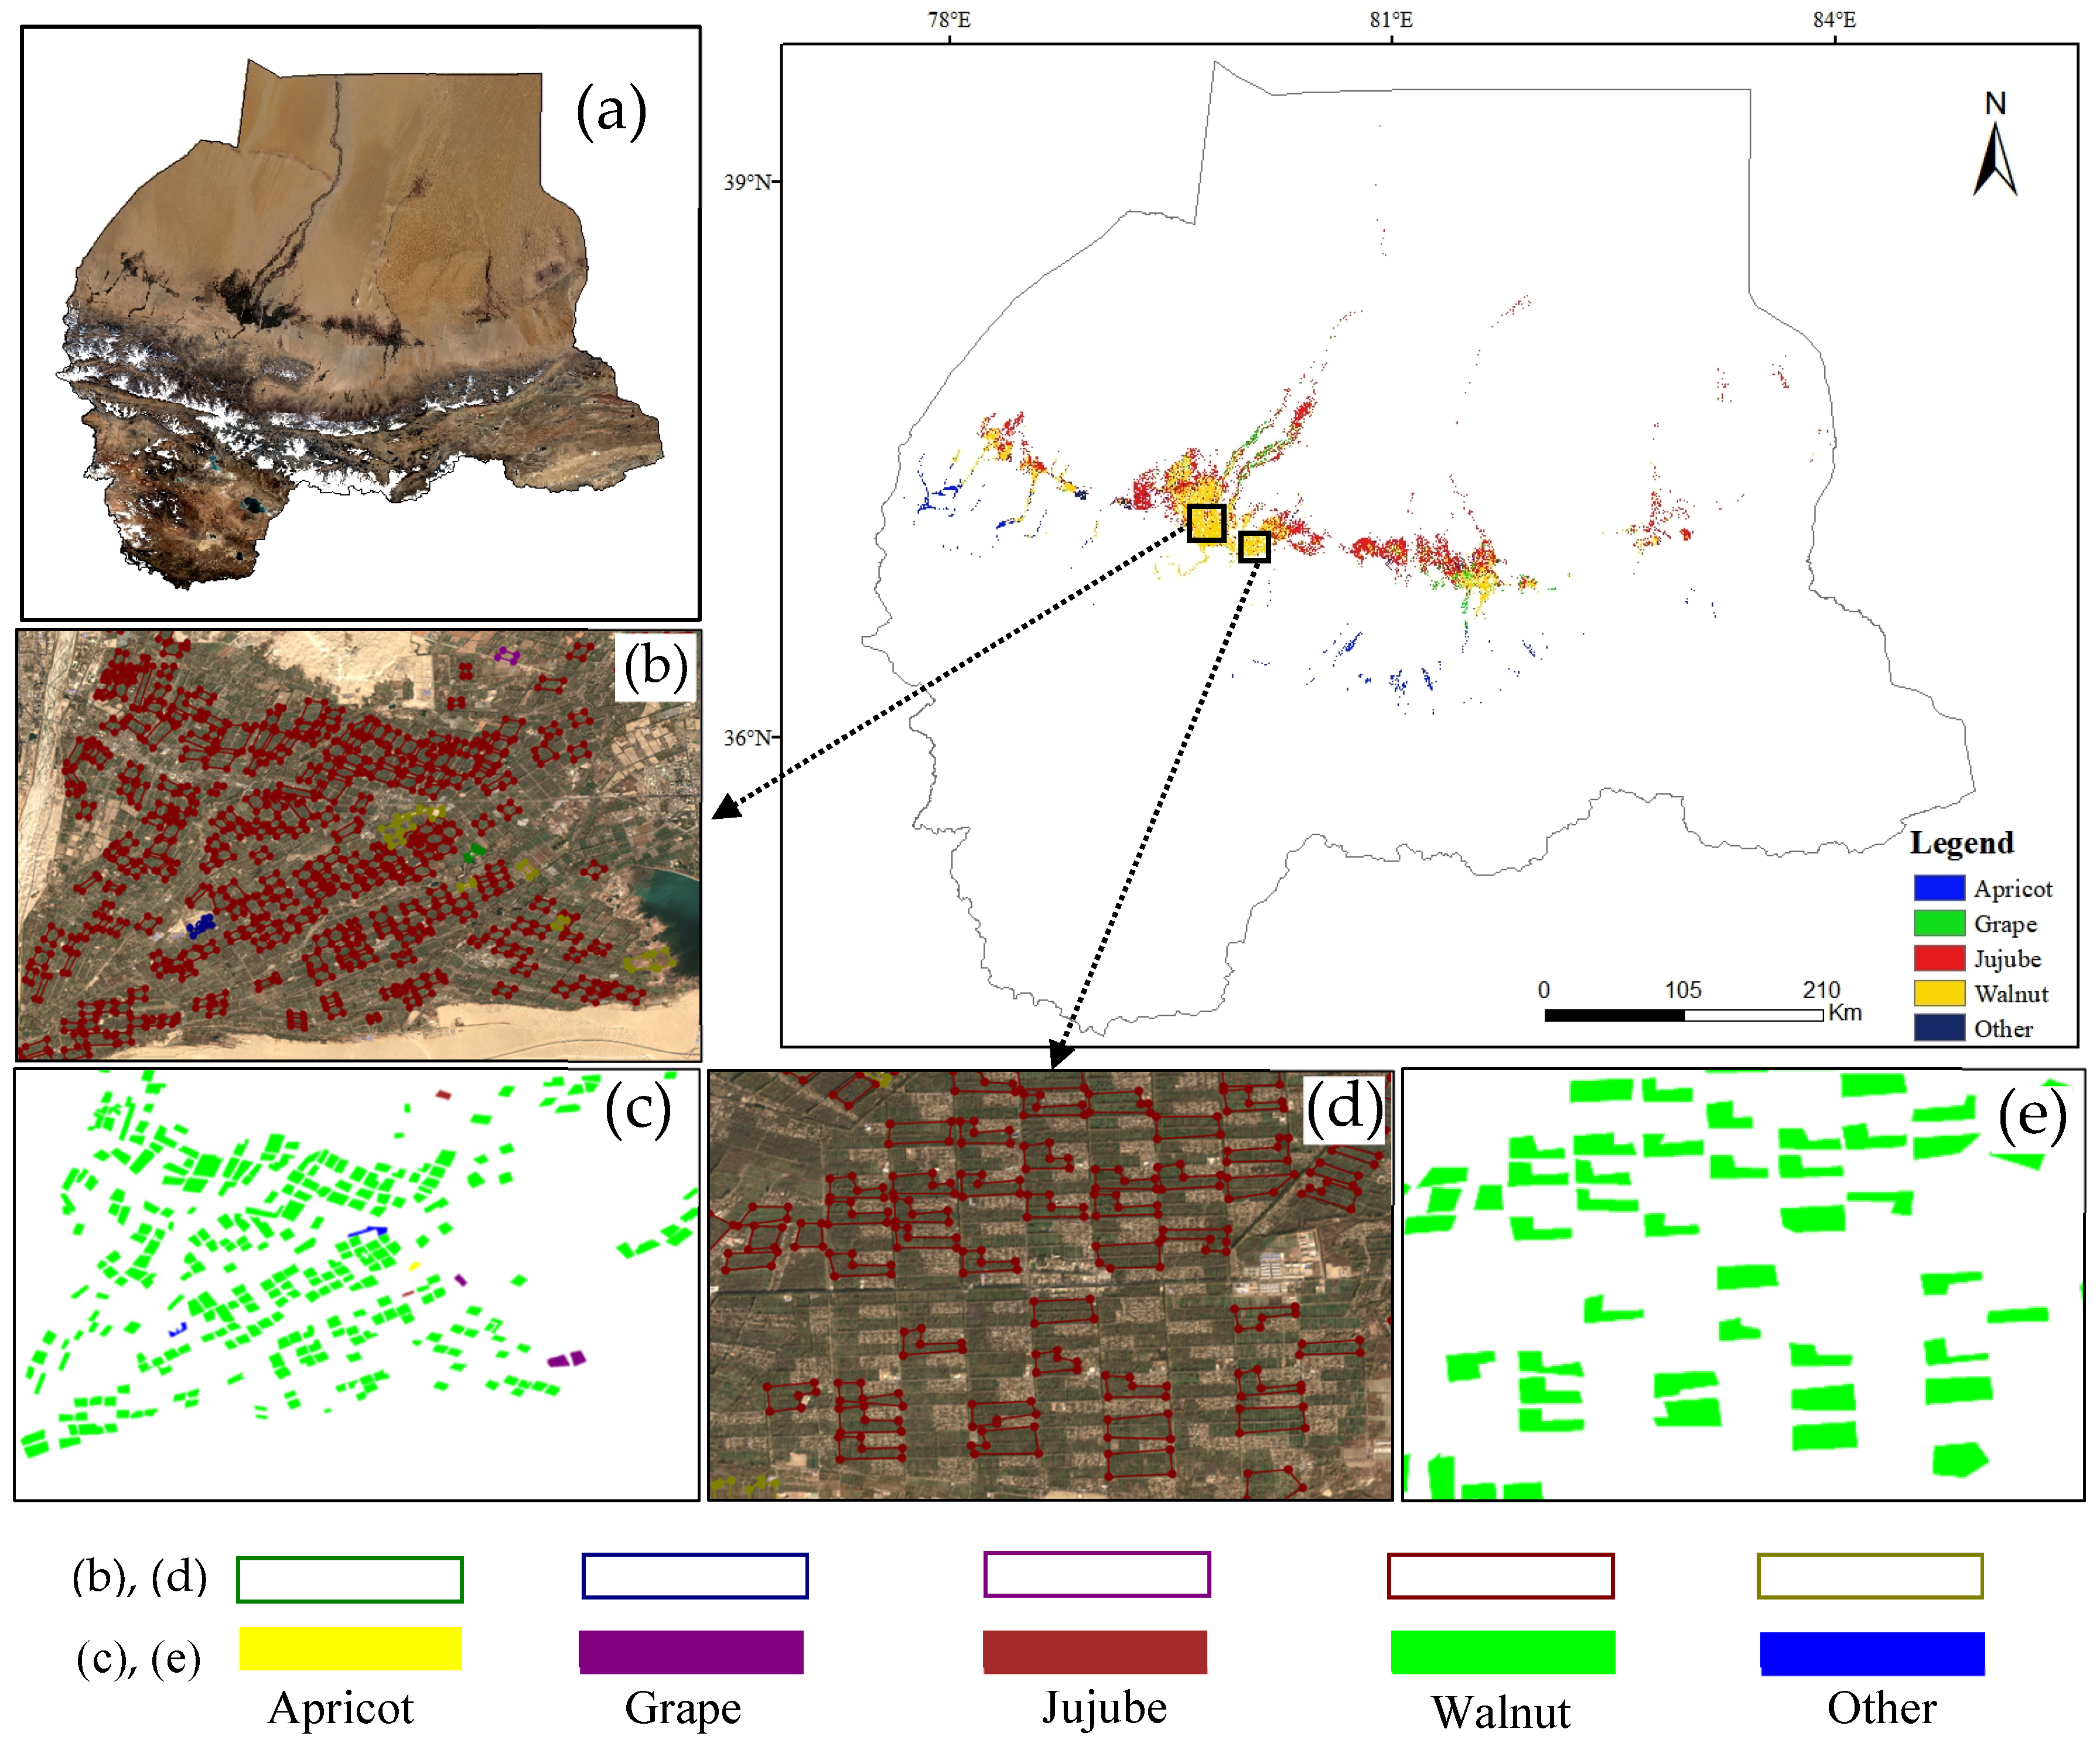
The key findings of the ablation study are visually summarized in Figure 6.
In summary, the ablation experiments not only verified the advantage of employing the Adam optimizer in the baseline model but also systematically confirmed the key contributions of the FGMF and CGAR modules to the observed improvements in overall model performance. Specifically, when all improvements were integrated into CF-EfficientNet, the overall classification accuracy increased from 87.1% to 92.6%, with an improvement of 5.5 percentage points, while the Kappa coefficient rose from 0.677 to 0.830, representing an increase of 0.153. These quantitative results clearly demonstrate the efficiency and effectiveness of the proposed optimization strategy. The corresponding results are shown in Figure 6.

3.3.2. Confusion Matrix Analysis

To further evaluate the classification performance of the proposed CF-EfficientNet model across different fruit tree categories, a confusion matrix was constructed based on the output of the final model (No.e), as shown in Figure 7. The confusion matrix clearly illustrates the model’s specific classification accuracy for each fruit tree category, complementing the overall accuracy (OA) and Kappa coefficient metrics at the macro level. Overall, the model’s predictions are primarily concentrated along the diagonal, indicating high classification accuracy across categories and strong agreement with the ground truth labels.
Notably, the recognition performance for walnut, jujube, and grape categories is outstanding, with 486, 382, and 361 correctly classified samples, respectively, and very few misclassifications. This demonstrates the model’s effectiveness in capturing distinct spectral and textural features of these crops. In contrast, some confusion exists for the apricot category, which is primarily misclassified as walnut or jujube, likely due to overlapping spectral characteristics during growth stages or similar spatial distributions.
The “Other” category exhibits the highest misclassification rate, reflecting ongoing challenges in distinguishing classes with high inter-class heterogeneity or limited sample sizes. This suggests the need for further improvements in data annotation, sample balancing, and feature enhancement in future work.
Overall, the confusion matrix demonstrates the model’s strong discriminative ability at the category level and further validates the effectiveness of the FGMF and CGAR modules. These two modules not only improve the overall metrics (OA and Kappa) but also enhance the model’s capability to differentiate between spectrally similar crops, highlighting the significance of structural optimization in addressing complex crop classification tasks.

4. Discussion

4.1. Temporal Spectral and Vegetation Index Analysis

Figure 8 and Figure 9 present the time-series features of fruit tree spectral reflectance and vegetation indices (VIs) extracted from Sentinel-2 imagery. By analyzing the spectral and VI curves during the peak growth stage (July 15) and the maturation stage (October 30), it was observed that distinct fruit tree types exhibited notable differences in band reflectance and VIs at critical time points, providing discriminative features for classification. Compared with single-date imagery, multi-temporal features captured both the dynamic information during the growth peak and the stable spectral patterns at maturation, thereby improving classification reliability and robustness.
In fruit planting classification, a diverse suite of vegetation indices was constructed to capture a broad spectrum of ecophysiological traits, after which feature selection was applied to identify the most discriminative feature subset. This approach is motivated by the need to comprehensively characterize species-specific differences in growth, structure, and stress responses—differences that are not fully captured by spectral data alone. For example, indices such as NDVI and REP are essential for characterizing photosynthetic activity and phenological stages, thereby enabling species differentiation based on growth dynamics. In contrast, LSWI provides key information on water status, facilitating the distinction of species with similar spectral characteristics but divergent water use patterns or irrigation regimes. The inclusion of soil-adjusted indices (e.g., SAVI) and chlorophyll-sensitive indices (e.g., CVI, GCVI) further enhanced classification accuracy in heterogeneous landscapes and high-biomass conditions, respectively. By leveraging feature-optimized multiparameter analysis, the model effectively exploits fundamental ecophysiological differences among tree species, significantly improving classification robustness and outperforming results based solely on spectral data. The subsequent feature selection process further refined this initial diverse set, identifying the most parsimonious yet effective combination of traits for optimal model performance.
Compared with previous studies, the current approach precisely selected imagery corresponding to both growth peak and maturation stages, balancing dynamic changes and long-term stability, and enhancing model adaptability to different crop types and heterogeneous backgrounds. Nonetheless, some limitations remain. For instance, fruit trees with short growth cycles or extreme phenological patterns may not be fully represented, and missing data from a single sensor or time point could reduce feature completeness. Future work may incorporate multi-source remote sensing data (e.g., hyperspectral or SAR imagery) with finer temporal resolution to improve recognition of extreme phenotypes or small-sample fruit tree types. Additionally, intelligent time-window selection methods could be explored to provide more robust spectral feature support for fruit tree classification and precision agriculture applications.

4.2. Advantages and Potential of Feature Selection

High-dimensional, multi-source remote sensing features provide rich information but may include redundancy and noise that can reduce the training efficiency and generalization ability of deep learning models. In this study, four feature selection methods—RF_RFE, OOB, CFS, and MI—were compared, and the preferred bands generated by RF_RFE were ultimately selected as inputs for the deep learning model. This approach effectively reduced redundancy while retaining key information, thereby improving model robustness.
Compared with existing studies, the feature selection strategy presented here offers several advantages. First, by independently comparing multiple feature selection methods, the characteristics of each approach in terms of information retention, redundancy reduction, and model stability were revealed, providing guidance for similar tasks. Second, fixed parameter settings ensured fairness in the comparison, allowing an objective evaluation of method performance. Third, the strategy provided low-dimensional, information-rich inputs for subsequent deep learning models, reducing computational cost and enhancing adaptability in complex orchard environments.
Future work may explore hyperparameter optimization to further improve feature selection performance and classification accuracy. In addition, integrating dynamic features from multi-temporal and multi-source remote sensing data could enable the development of more intelligent feature selection strategies, providing a more reliable foundation for fruit planting classification and precision agriculture applications.

4.3. CF-EfficientNet Module Design and Performance Advantages

During model optimization, the integration of the FGMF and CGAR modules enhanced the performance of CF-EfficientNet in fruit planting classification tasks. Ablation experiments indicated that the individual application of either FGMF or CGAR improved model performance, whereas their combined use provided a more pronounced complementary effect (Figure 10). This finding suggests that the integration of fine-grained feature capture and global discriminative capability is a key strategy for improving classification accuracy.
Compared with conventional convolutional networks or single attention mechanisms, the FGMF module enhanced sensitivity to local details through multi-scale feature fusion, while the CGAR module leveraged condition-guided information to improve class discrimination, particularly in complex backgrounds and heterogeneous scenarios, effectively reducing misclassification. These complement existing approaches in multi-scale feature extraction and channel attention mechanisms, demonstrating the practical advantages of the proposed combination strategy in complex environments.
Despite achieving high classification performance, CF-EfficientNet has limitations. Its generalization capability may be constrained for classes with very few samples or poorly annotated regions, and the multi-module design increases computational cost, potentially limiting deployment in resource-constrained environments. Future efforts may explore lightweight module designs, combined with transfer learning or semi-supervised strategies, to transfer knowledge from existing remote sensing datasets to small-sample or heterogeneous scenarios, thereby improving adaptability. Additionally, comparing CF-EfficientNet with Transformer-based feature extraction and multi-task learning approaches could further clarify its relative advantages, offering broader optimization pathways for remote sensing image classification.

5. Conclusions

To enhance the classification performance of remote sensing imagery for fruit tree crops, this study proposed the CF-EfficientNet model and conducted a comprehensive analysis from three perspectives: deep learning model selection, feature selection strategies, and architectural optimization. The following conclusions were drawn:
(1) Optimal Benchmark Classification Model
Under both multi-spectral (MS) and preferred band (PB) input conditions, EfficientNetB0 consistently exhibited the best benchmark performance. Specifically, when using the multi-spectral bands, EfficientNetB0 achieved an overall accuracy of 85.8% and a Kappa coefficient of 0.598, surpassing other models. When using the preferred bands, the overall accuracy increased to 87.1%, and the Kappa coefficient improved to 0.677, also outperforming all other models. These results indicate that EfficientNetB0 demonstrates superior classification performance and consistency regardless of whether the full spectral set or the selected bands are used.
(2) Importance of Feature Selection
By comparing four feature selection algorithms (RF_RFE, OOB, CFS, and MI), 13 key bands generated by RF_RFE were identified as the preferred input features. Compared with using the full set of multi-spectral bands, the selected preferred bands not only increased the overall accuracy of EfficientNetB0 by 1.3 percentage points (from 85.8% to 87.1%) and the Kappa coefficient by 0.079 (from 0.598 to 0.677) but also reduced the risk of overfitting and enhanced the model’s ability to discriminate between different crop types. These findings highlight the crucial role of feature selection in improving classification performance.
(3) Effectiveness of CF-EfficientNet Architectural Optimization
Based on the EfficientNetB0 backbone, the FGMF module and CGAR module were incorporated, and the optimizer was changed from SGD to Adam. As a result, the optimized CF-EfficientNet achieved an overall accuracy of 92.6% and a Kappa coefficient of 0.830, representing improvements of 5.5 percentage points and 0.153, respectively, compared with the benchmark model. These quantitative results clearly demonstrate the efficiency and effectiveness of the proposed architectural optimizations and module integration strategy in enhancing classification accuracy and model stability.
In summary, CF-EfficientNet demonstrated superior classification accuracy and generalization capability compared to other benchmark models. The combination of optimized spectral feature selection and structural improvements further enhanced the applicability of deep learning for remote sensing classification, offering a reliable technical foundation for precision agriculture and orchard monitoring.

Author Contributions

Conceptualization, J.M.; methodology, J.M.; writing—original draft preparation, J.M.; writing—review and editing, J.G., L.W., L.L., and Z.P.; visualization, J.M.; supervision, J.G.; project administration, J.G. All authors have read and agreed to the published version of the manuscript.

Funding

This research was funded by the Xinjiang Uyghur Autonomous Region Key R&D Special Project ‘Research on Intelligent Monitoring of Meteorological Disasters Based on Big Data of Forest and Fruit Resources’ (No. 2023B02004).

Data Availability Statement

All data in this article can be obtained by reasonably contacting the corresponding author.

Acknowledgments

We are grateful to the Institute of Resources and Information of the Xinjiang Academy of Forestry Sciences for providing essential data and technical support.

Conflicts of Interest

The authors declare no conflicts of interest.

References

  1. Xu, W.; Li, Z.; Lin, H.; Shao, G.; Zhao, F.; Wang, H.; Cheng, J.; Lei, L.; Chen, R.; Han, S.; et al. Mapping Fruit-Tree Plantation Using Sentinel-1/2 Time Series Images with Multi-Index Entropy Weighting Dynamic Time Warping Method. Remote Sens. 2024, 16, 3390. [Google Scholar] [CrossRef]
  2. Zhao, G.; Wang, L.; Zheng, J.; Tuerxun, N.; Han, W.; Liu, L. Optimized Extraction Method of Fruit Planting Distribution Based on Spectral and Radar Data Fusion of Key Time Phase. Remote Sens. 2023, 15, 4140. [Google Scholar] [CrossRef]
  3. Zhong, L.; Dai, Z.; Fang, P.; Cao, Y.; Wang, L. A Review: Tree Species Classification Based on Remote Sensing Data and Classic Deep Learning-Based Methods. Forests 2024, 15, 852. [Google Scholar] [CrossRef]
  4. Zhou, X.-X.; Li, Y.-Y.; Luo, Y.-K.; Sun, Y.-W.; Su, Y.-J.; Tan, C.-W.; Liu, Y.-J. Research on remote sensing classification of fruit trees based on Sentinel-2 multi-temporal imageries. Sci. Rep. 2022, 12, 11549. [Google Scholar] [CrossRef]
  5. Huang, Y.; Wen, X.; Gao, Y.; Zhang, Y.; Lin, G. Tree Species Classification in UAV Remote Sensing Images Based on Super-Resolution Reconstruction and Deep Learning. Remote Sens. 2023, 15, 2942. [Google Scholar] [CrossRef]
  6. Yan, Y.; Tang, X.; Zhu, X.; Yu, X. Optimal Time Phase Identification for Apple Orchard Land Recognition and Spatial Analysis Using Multitemporal Sentinel-2 Images and Random Forest Classification. Sustainability 2023, 15, 4695. [Google Scholar] [CrossRef]
  7. Qureshi, S.; Koohpayma, J.; Firozjaei, M.K.; Kakroodi, A.A. Evaluation of Seasonal, Drought, and Wet Condition Effects on Performance of Satellite-Based Precipitation Data over Different Climatic Conditions in Iran. Remote Sens. 2021, 14, 76. [Google Scholar] [CrossRef]
  8. Liu, Z.; Xiang, X.; Qin, J.; Tan, Y.; Zhang, Q.; Xiong, N.N. Image Recognition of Citrus Diseases Based on Deep Learning. Comput. Mater. Contin. 2020, 66, 457–466. [Google Scholar] [CrossRef]
  9. Trigo, I.F.; Ermida, S.L.; Martins, J.P.A.; Gouveia, C.M.; Göttsche, F.-M.; Freitas, S.C. Validation and consistency assessment of land surface temperature from geostationary and polar orbit platforms: SEVIRI/MSG and AVHRR/Metop. ISPRS J. Photogramm. Remote Sens. 2021, 175, 282–297. [Google Scholar] [CrossRef]
  10. Chen, J.; Xu, W.; Yu, Y.; Peng, C.; Gong, W. Reliable Label-Supervised Pixel Attention Mechanism for Weakly Supervised Building Segmentation in UAV Imagery. Remote Sens. 2022, 14, 3196. [Google Scholar] [CrossRef]
  11. Dong, S.; Chen, Z. A Multi-Level Feature Fusion Network for Remote Sensing Image Segmentation. Sensors 2021, 21, 1267. [Google Scholar] [CrossRef] [PubMed]
  12. Johansen, K.; Lopez, O.; Tu, Y.-H.; Li, T.; McCabe, M.F. Center pivot field delineation and mapping: A satellite-driven object-based image analysis approach for national scale accounting. ISPRS J. Photogramm. Remote Sens. 2021, 175, 1–19. [Google Scholar] [CrossRef]
  13. Li, X.; He, B.; Ding, K.; Guo, W.; Huang, B.; Wu, L. Wide-Area and Real-Time Object Search System of UAV. Remote Sens. 2022, 14, 1234. [Google Scholar] [CrossRef]
  14. Chen, S.; Chen, M.; Zhao, B.; Mao, T.; Wu, J.; Bao, W. Urban Tree Canopy Mapping Based on Double-Branch Convolutional Neural Network and Multi-Temporal High Spatial Resolution Satellite Imagery. Remote Sens. 2023, 15, 765. [Google Scholar] [CrossRef]
  15. Zhang, D.; Liu, Z.; Shi, X. Transfer learning on efficientnet for remote sensing image classification. In Proceedings of the 2020 5th International Conference on Mechanical, Control and Computer Engineering (ICMCCE), Harbin, China, 25–27 December 2020; pp. 2255–2258. [Google Scholar]
  16. Alhichri, H.; Alswayed, A.S.; Bazi, Y.; Ammour, N.; Alajlan, N.A. Classification of remote sensing images using EfficientNet-B3 CNN model with attention. IEEE Access 2021, 9, 14078–14094. [Google Scholar]
  17. Yin, H.; Yang, C.; Lu, J. Research on remote sensing image classification algorithm based on EfficientNet. In Proceedings of the 2022 7th International Conference on Intelligent Computing and Signal Processing (ICSP), Xi’an, China, 15–17 April 2022; pp. 1757–1761. [Google Scholar]
  18. Mehmood, M.; Hussain, F.; Shahzad, A.; Ali, N. Classification of Remote Sensing Datasets with Different Deep Learning Architectures. Earth Sci. Res. J. 2024, 28, 409–419. [Google Scholar]
  19. Tan, M.; Le, Q.V. EfficientNet: Rethinking Model Scaling for Convolutional Neural Networks. arXiv 2019, arXiv:1905.11946. [Google Scholar]
  20. Wu, H.; Zhou, H.; Wang, A.; Iwahori, Y. Precise Crop Classification of Hyperspectral Images Using Multi-Branch Feature Fusion and Dilation-Based MLP. Remote Sens. 2022, 14, 2713. [Google Scholar] [CrossRef]
  21. Li, L.; Liang, P.; Ma, J.; Jiao, L.; Guo, X.; Liu, F.; Sun, C. A Multiscale Self-Adaptive Attention Network for Remote Sensing Scene Classification. Remote Sens. 2020, 12, 2209. [Google Scholar] [CrossRef]
  22. Xue, G.; Liu, S.; Ma, Y. A hybrid deep learning-based fruit classification using attention model and convolution autoencoder. Complex Intell. Syst. 2020, 9, 2209–2219. [Google Scholar] [CrossRef]
  23. Li, Q.; Yan, D.; Wu, W. Remote Sensing Image Scene Classification Based on Global Self-Attention Module. Remote Sens. 2021, 13, 4542. [Google Scholar] [CrossRef]
  24. Guo, N.; Jiang, M.; Gao, L.; Tang, Y.; Han, J.; Chen, X. CRABR-Net: A Contextual Relational Attention-Based Recognition Network for Remote Sensing Scene Objective. Sensors 2023, 23, 7514. [Google Scholar] [CrossRef] [PubMed]
  25. Antonijević, O.; Jelić, S.; Bajat, B.; Kilibarda, M. Transfer learning approach based on satellite image time series for the crop classification problem. J. Big Data 2023, 10, 54. [Google Scholar] [CrossRef]
  26. Barriere, V.; Claverie, M.; Schneider, M.; Lemoine, G.; d’Andrimont, R. Boosting crop classification by hierarchically fusing satellite, rotational, and contextual data. Remote Sens. Environ. 2024, 305, 114110. [Google Scholar] [CrossRef]
  27. Cui, J.; Wang, Y.; Zhou, T.; Jiang, L.; Qi, Q. Temperature Mediates the Dynamic of MODIS NPP in Alpine Grassland on the Tibetan Plateau, 2001–2019. Remote Sens. 2022, 14, 2401. [Google Scholar] [CrossRef]
  28. Ma, Y.; Liu, H.; Jiang, B.; Meng, L.; Guan, H.; Xu, M.; Cui, Y.; Kong, F.; Yin, Y.; Wang, M. An Innovative Approach for Improving the Accuracy of Digital Elevation Models for Cultivated Land. Remote Sens. 2020, 12, 3401. [Google Scholar] [CrossRef]
  29. Phiri, D.; Simwanda, M.; Salekin, S.; Nyirenda, V.; Murayama, Y.; Ranagalage, M. Sentinel-2 Data for Land Cover/Use Mapping: A Review. Remote Sens. 2020, 12, 2291. [Google Scholar] [CrossRef]
  30. Breiman, L. Random Forests. Mach. Learn. 2001, 45, 5–32. [Google Scholar] [CrossRef]
  31. Li, J.; Cheng, K.; Wang, S.; Morstatter, F.; Trevino, R.P.; Tang, J.; Liu, H. Feature Selection. ACM Comput. Surv. 2017, 50, 1–45. [Google Scholar] [CrossRef]
  32. Hanchuan, P.; Fuhui, L.; Ding, C. Feature selection based on mutual information criteria of max-dependency, max-relevance, and min-redundancy. IEEE Trans. Pattern Anal. Mach. Intell. 2005, 27, 1226–1238. [Google Scholar] [CrossRef]
  33. Guyon, I.; Elisseeff, A. An introduction to variable and feature selection. J. Mach. Learn. Res. 2003, 3, 1157–1182. [Google Scholar]
  34. Deng, W.; Wang, Y.; Ma, L.; Zhang, Y.; Ullah, S.; Xue, Y. Computational prediction of methylation types of covalently modified lysine and arginine residues in proteins. Brief. Bioinform. 2017, 18, 647–658. [Google Scholar] [CrossRef]
  35. Cutler, D.R.; Edwards, T.C.; Beard, K.H.; Cutler, A.; Hess, K.T.; Gibson, J.; Lawler, J.J. Random Forests for Classification in Ecology. Ecology 2007, 88, 2783–2792. [Google Scholar] [CrossRef] [PubMed]
  36. Rawat, W.; Wang, Z. Deep Convolutional Neural Networks for Image Classification: A Comprehensive Review. Neural Comput. 2017, 29, 2352–2449. [Google Scholar] [CrossRef] [PubMed]
  37. Krizhevsky, A.; Sutskever, I.; Hinton, G.E. ImageNet classification with deep convolutional neural networks. Commun. ACM 2017, 60, 84–90. [Google Scholar] [CrossRef]
  38. He, K.; Zhang, X.; Ren, S.; Sun, J. Deep Residual Learning for Image Recognition. In Proceedings of the 2016 IEEE Conference on Computer Vision and Pattern Recognition (CVPR), Las Vegas, NV, USA, 27–30 June 2016; pp. 770–778. [Google Scholar]
  39. Ding, X.; Zhang, X.; Ma, N.; Han, J.; Ding, G.; Sun, J. Repvgg: Making vgg-style convnets great again. In Proceedings of the IEEE/CVF Conference on Computer Vision and Pattern Recognition, Nashville, TN, USA, 20–25 June 2021; pp. 13733–13742. [Google Scholar]
  40. Pasquadibisceglie, V.; Appice, A.; Castellano, G.; van der Aalst, W. PROMISE: Coupling predictive process mining to process discovery. Inf. Sci. 2022, 606, 250–271. [Google Scholar] [CrossRef]
  41. Li, A.; Huang, W.; Lan, X.; Feng, J.; Li, Z.; Wang, L. Boosting Few-Shot Learning with Adaptive Margin Loss. In Proceedings of the 2020 IEEE/CVF Conference on Computer Vision and Pattern Recognition (CVPR), Seattle, WA, USA, 13–19 June 2020; pp. 12573–12581. [Google Scholar]
  42. Cai, J.; Pan, R.; Lin, J.; Liu, J.; Zhang, L.; Wen, X.; Chen, X.; Zhang, X. Improved EfficientNet for corn disease identification. Front. Plant Sci. 2023, 14, 1224385. [Google Scholar] [CrossRef]
  43. Wang, G.; Jin, H.; Gu, X.; Yang, G.; Feng, H.; Sun, Q. Autumn crops remote sensing classification based on improved separability threshold feature selection. Trans. Chin. Soc. Agric. Mach. 2021, 52, 199–210. [Google Scholar]
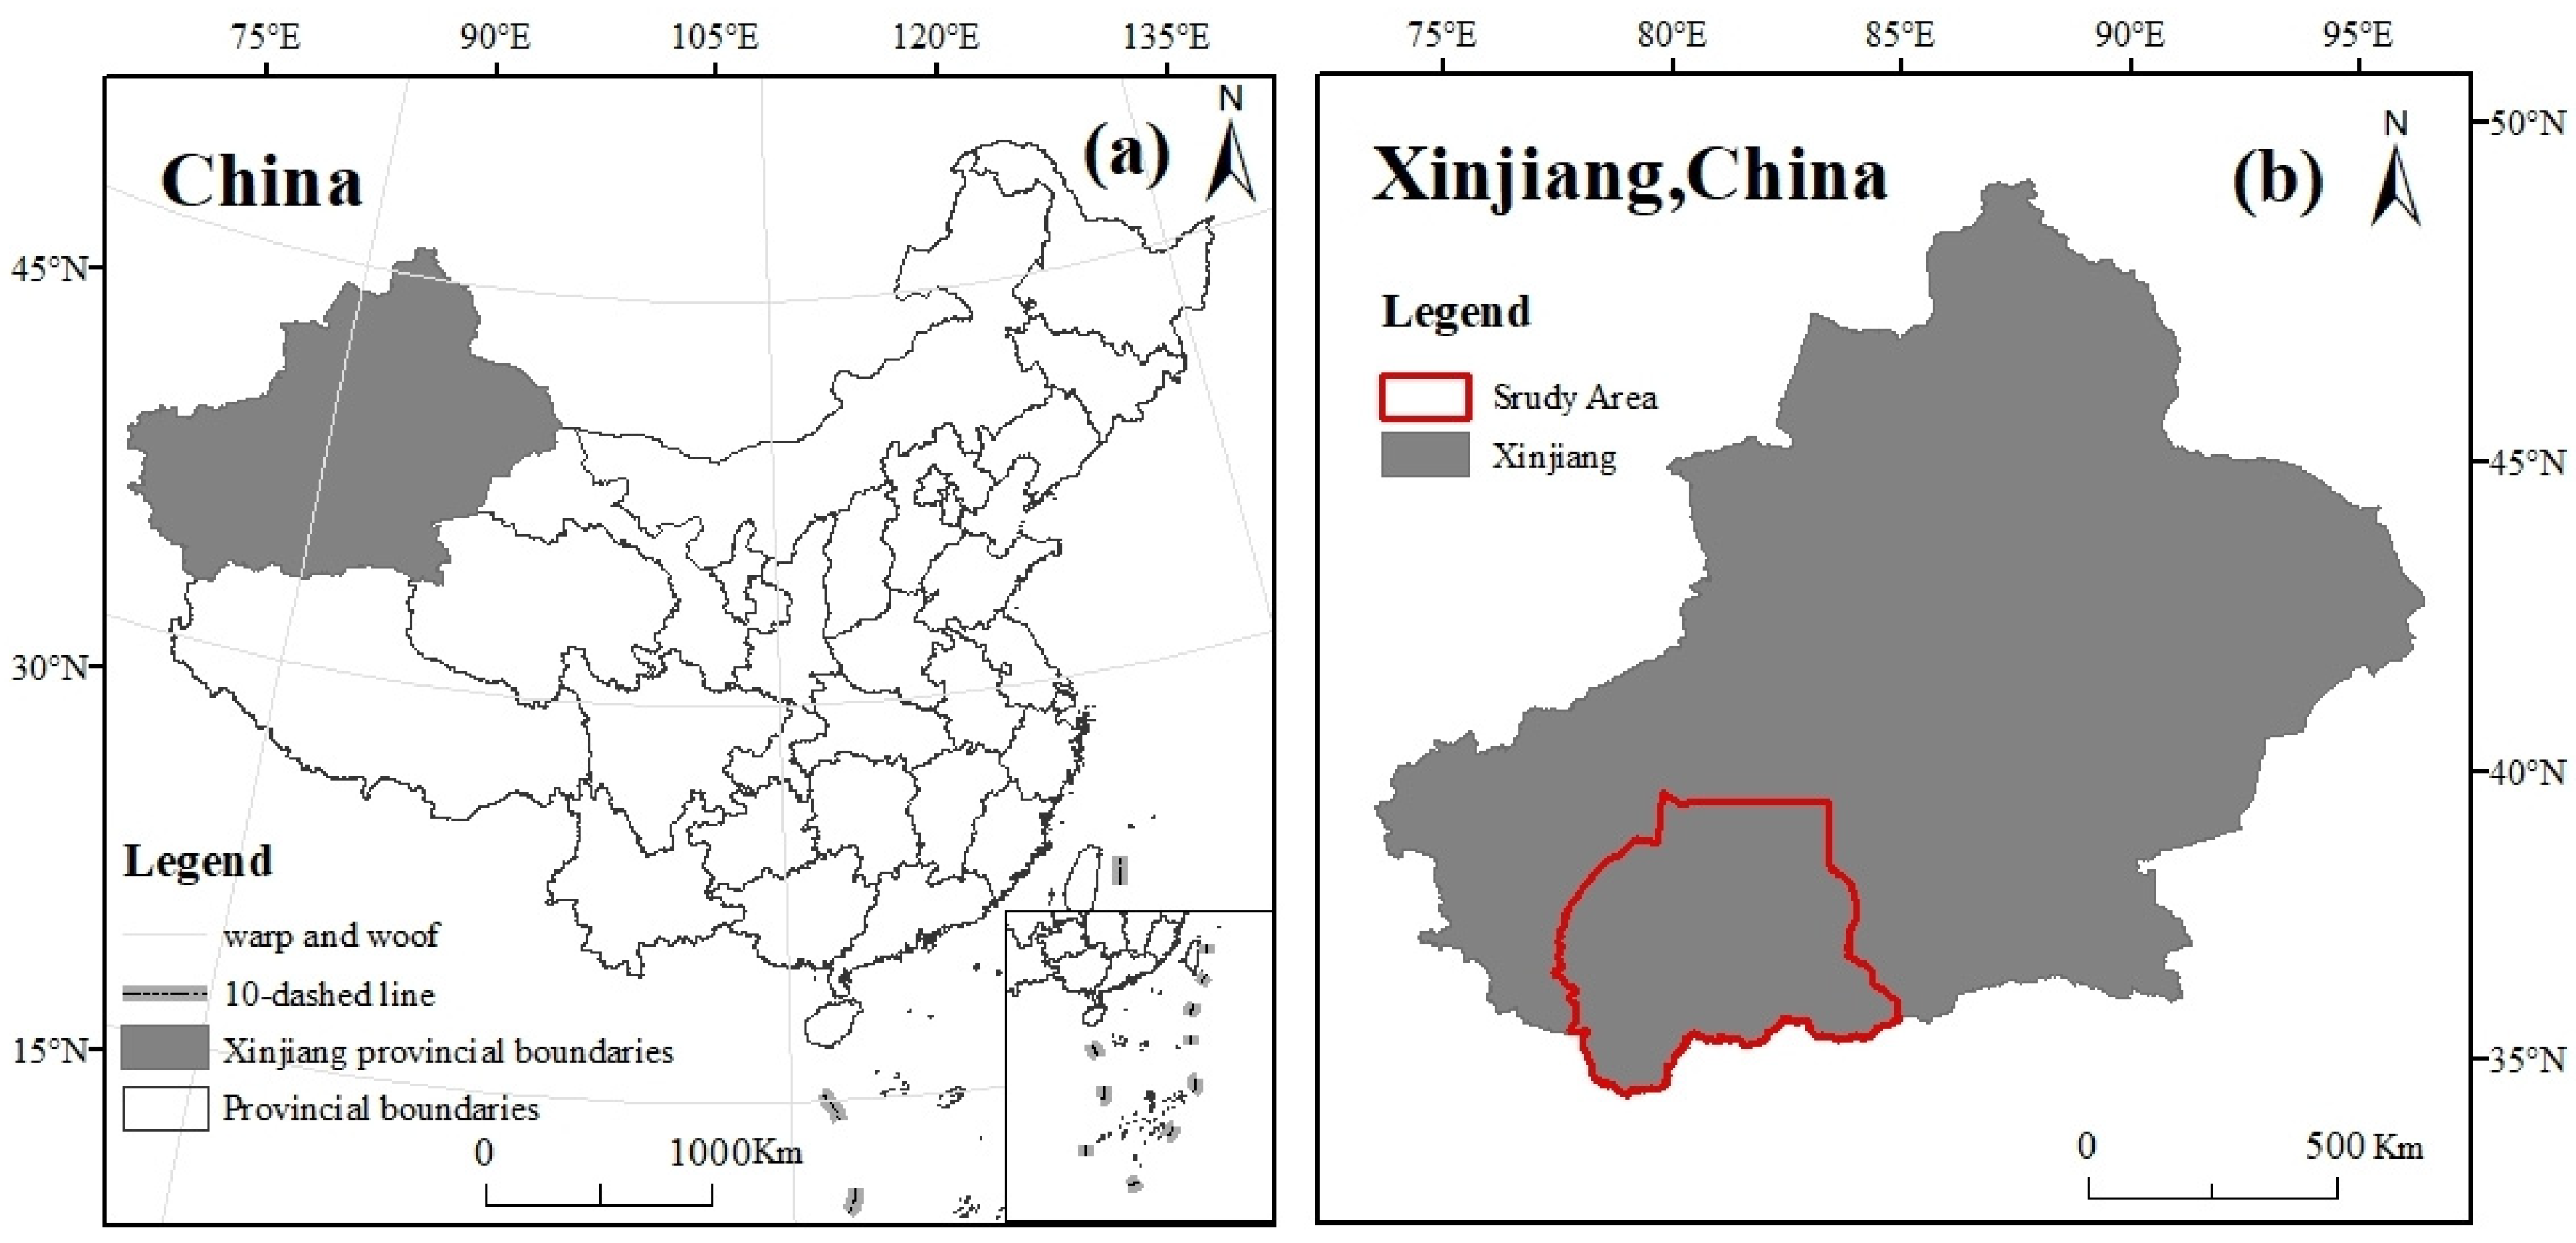
Figure 1. (a) The province in China where the study area is located at; (b) the location of the study area in Xinjiang, China.
Applsci 15 10995 g001
Figure 2. General workflow of this study.
Applsci 15 10995 g002
Figure 3. Structure of CF-EfficientNet network.
Applsci 15 10995 g003
Figure 4. The Kappa coefficient for different numbers of features. Note: The red triangle, circle, square, and diamond indicate the peak values of each curve.
Applsci 15 10995 g004
Figure 5. Overall accuracy and Kappa coefficient of different deep learning models: (a) radar chart of classification performance; (b) quantitative comparison of OA and Kappa coefficients across models.
Applsci 15 10995 g005
Figure 6. Fruit planting distribution map in the Hotan Region: (a) Sentinel-2 image; (b,d) regionally annotated image; (c,e) corresponding regional classification result.
Applsci 15 10995 g006
Figure 7. Confusion matrix of the CF-EfficientNet model (No.e configuration).
Applsci 15 10995 g007
Figure 8. Spectral characteristics of different ground objects (representing 6 March, 8 April, 3 May, 12 June, 15 July, 29 July, 5 September, 2 October, and 30 October 2024, respectively).
Applsci 15 10995 g008
Figure 9. The vegetation index characteristic curve of each place (DVI, EVI, GLI, NDVI, RVI, SAVI, respectively).
Applsci 15 10995 g009
Figure 10. Overall accuracy (OA) and Kappa coefficients of the CF-EfficientNet ablation experiments: (a) baseline EfficientNetB0 + SGD; (b) baseline + Adam; (c) (b) + FGMF; (d) (b) + CGAR; (e) (b) + FGMF + CGAR.
Applsci 15 10995 g010
Table 1. Name and number of classification features.
Feature NameFeature Band NamesNumber of Features
Spectral featureB2-B8, B8A, B11-B1210
Radar featureVV, VH2
Vegetation indexNDVI, EVI, RVI, DVI, GCVI, REP, LSWI, SAVI, CVI9
Terrain featureElevation, Slope, Aspect, Hillshade4
Texture featureasm, corr, ent, idm, savg, sent, shade, svar8
Table 2. Spectral bands of Sentinel-2 images.
Band
Names
Spectral
Band
Central
Wavelength (nm)
Band
Names
Spectral
Band
Central
Wavelength (nm)
BlueB2490Red-EdgeB7775
GreenB3560NIRB8842
RedB4665NIRB8a865
Red-EdgeB5705SWIRB111610
Red-EdgeB6740SWIRB122190
Table 3. Calculate vegetation index.
Vegetation IndexAbbreviationsBased on S2 Expressions
Normalized Difference Vegetation IndexNDVI(B8 − B4)/(B8 + B4)
Enhanced Vegetation IndexEVI2.5 × (B8 − B4)/(B8 + 6 × B4 − 7.5 × B2 + 1)
Ratio Vegetation IndexRVIB8/B4
Difference Vegetation IndexDVIB8 − B4
Green Chlorophyll Vegetation IndexGCVI(B8/B3) − 1
Red-Edge PositionREP700 + 40 × (((B6 + B7)/2) − B5)/(B6 − B5)
Land Surface Water IndexLSWI(B8 − B11)/(B8 + B11)
Soil-Adjusted Vegetation IndexSAVI(B8 − B4) × (1 + 0.5)/(B8 + B4 + 0.5)
Chlorophyll Vegetation IndexCVI(B8/B5) × (B8/B3)
Table 4. Experiment groups.
Name of ExperimentPreferred BandsMulti-Spectral Bands
Featureselevation, RE2, savg, Blue, RE3, VV, Swir1, REP, NIR, idm, GCVI, Green, RE4B2, B3, B4, B5, B6, B7,
B8, B8A, B11, B12
ModelAlexNet, VGG16, ResNet18, RepVGG, EfficientNetB0
Model AdjustmentCF-EfficientNetNone
Note: For further details regarding the preferred bands, see Section 3.1.
Table 5. Comparison of evaluation results of ablation experiments: (a) baseline EfficientNetB0 + SGD; (b) baseline + Adam; (c) (b) + FGMF; (d) (b) + CGAR; (e) (b) + FGMF + CGAR.
No.BaseAdam FGMFCGARAccuracy
OAKappa
a 87.10.677
b 88.20.688
c 89.50.744
d 91.80.782
e92.60.830
Note: “√” indicates that the corresponding method was used in the experiment.
Disclaimer/Publisher’s Note: The statements, opinions and data contained in all publications are solely those of the individual author(s) and contributor(s) and not of MDPI and/or the editor(s). MDPI and/or the editor(s) disclaim responsibility for any injury to people or property resulting from any ideas, methods, instructions or products referred to in the content.