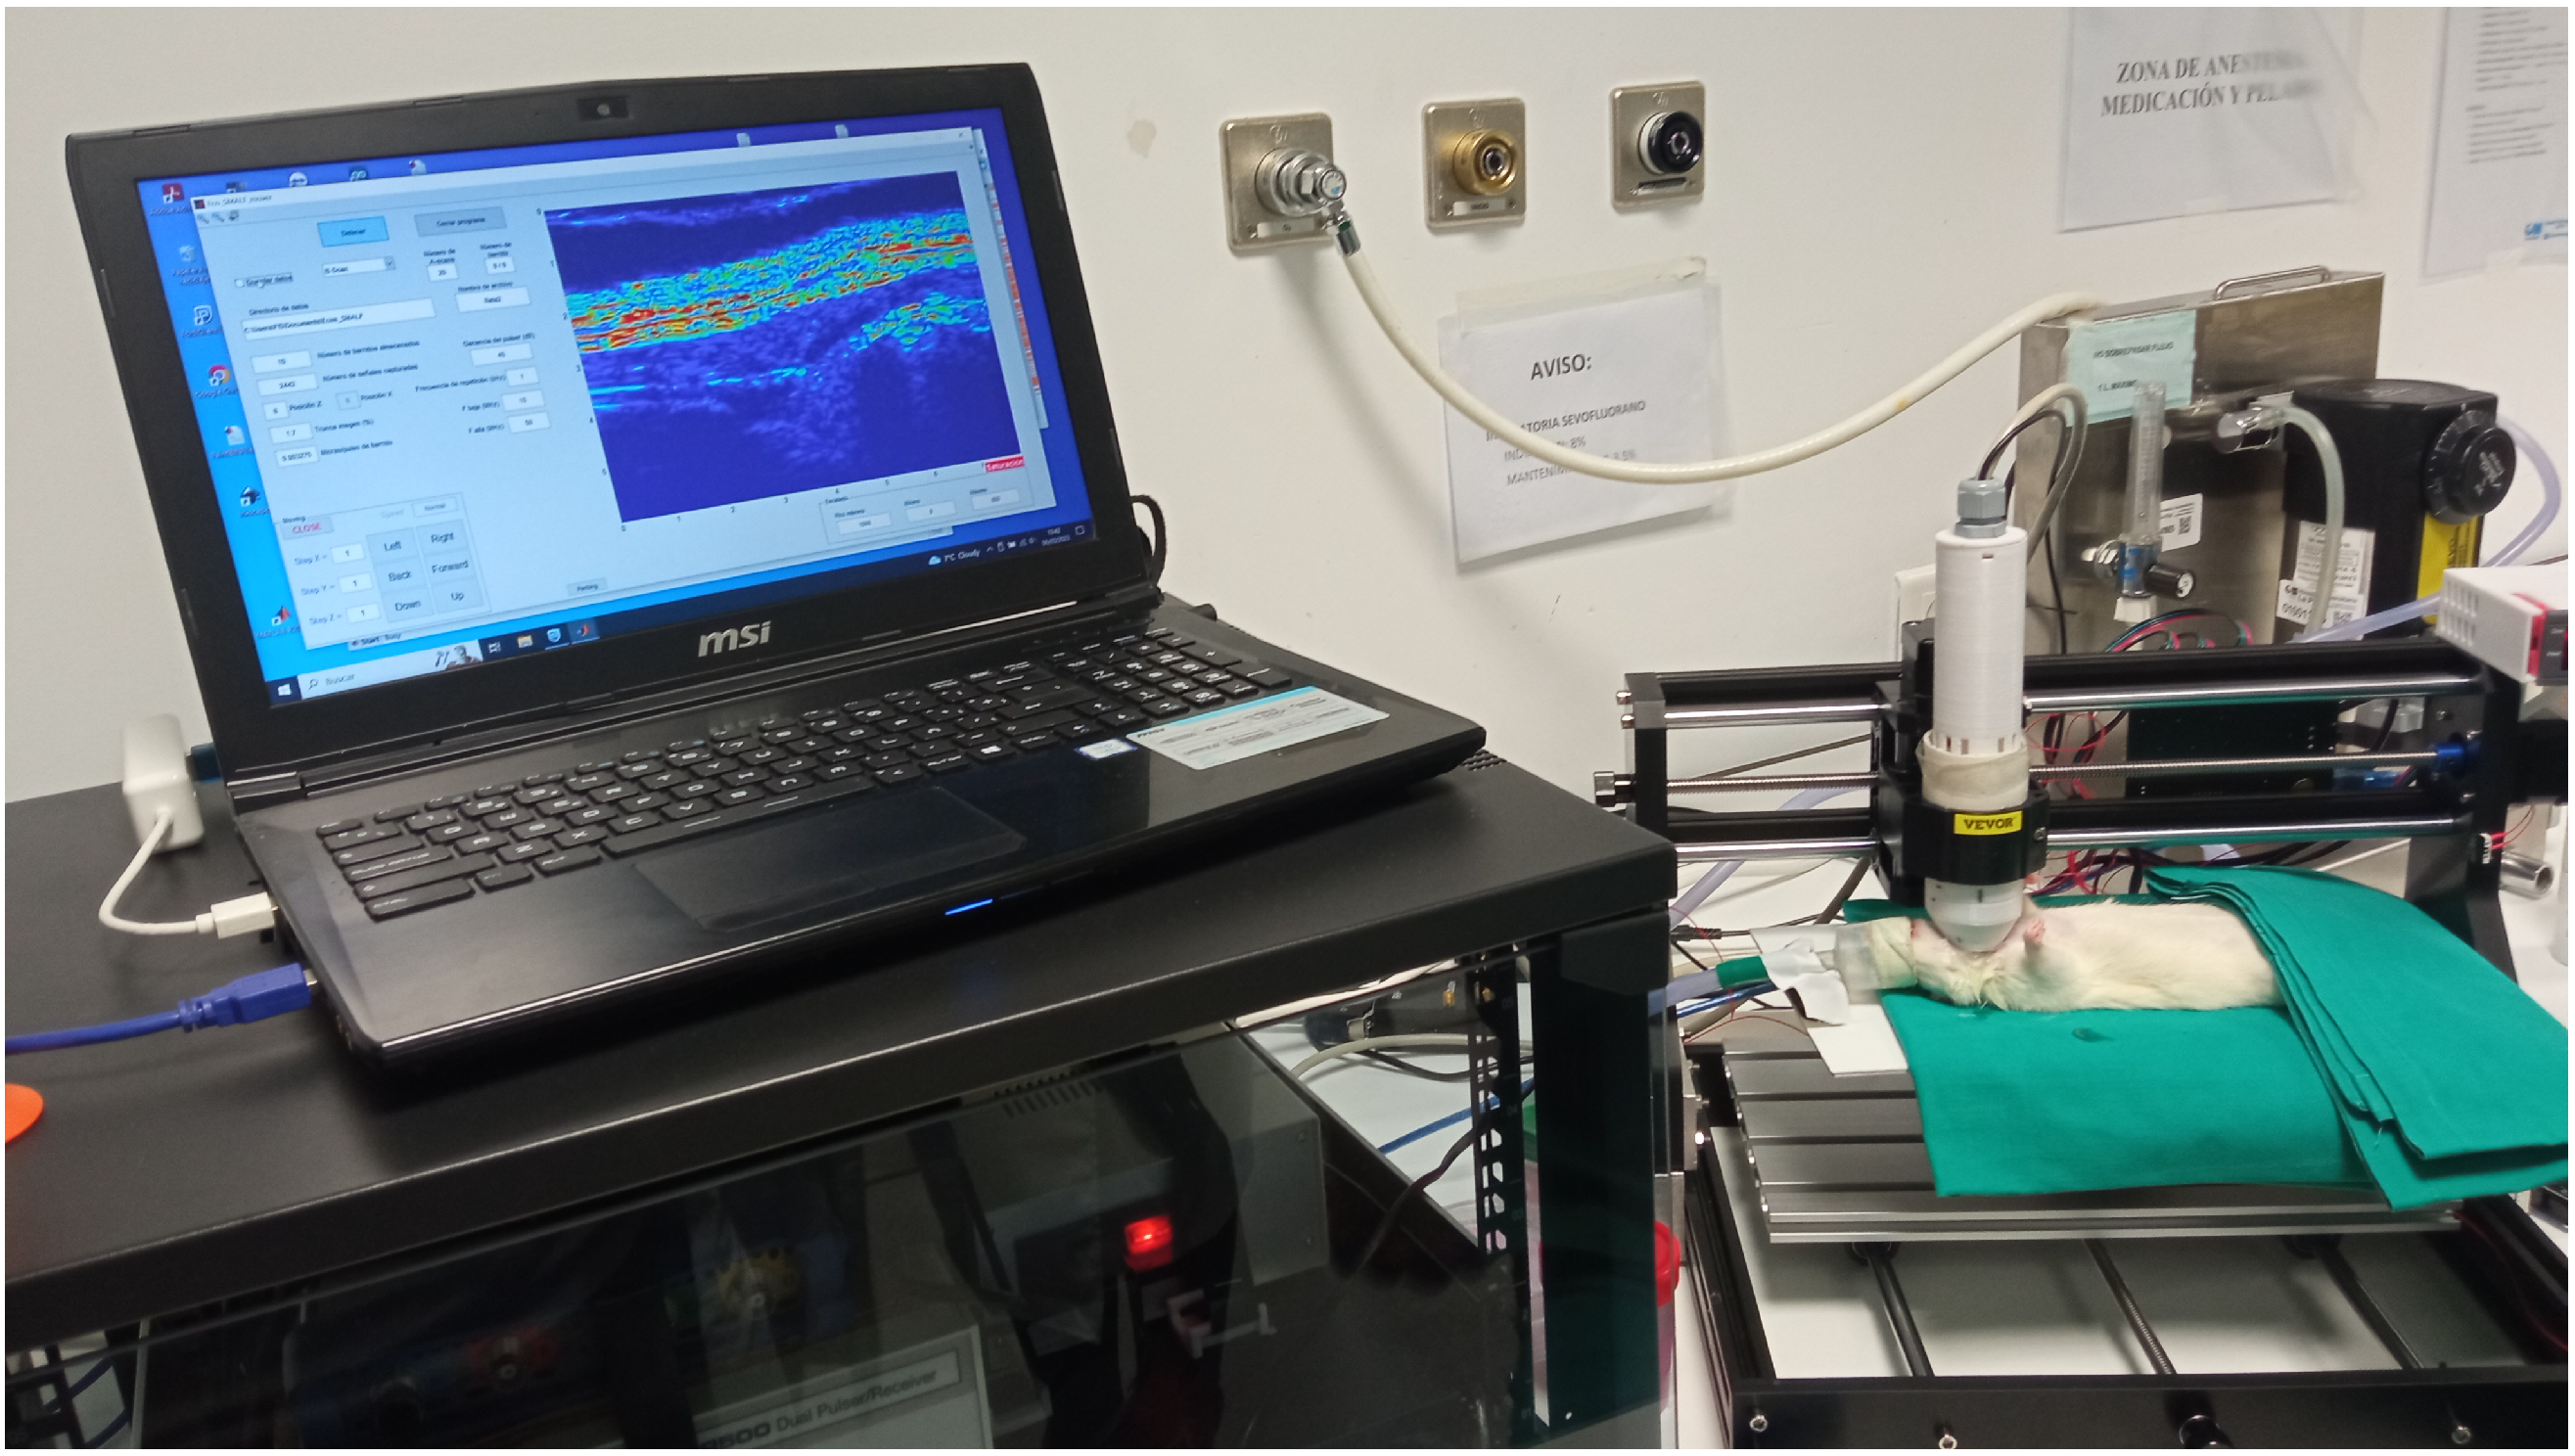
Figure 1.
Prototype of an experimental high-frequency single-transducer ultrasound system, developed within the framework of project PID2022-138013OB-I00 (MCIN/AEI/10.13039/501100011033/FEDER, EU), which served as a precursor to the imaging approach proposed in this work.
Figure 1.
Prototype of an experimental high-frequency single-transducer ultrasound system, developed within the framework of project PID2022-138013OB-I00 (MCIN/AEI/10.13039/501100011033/FEDER, EU), which served as a precursor to the imaging approach proposed in this work.
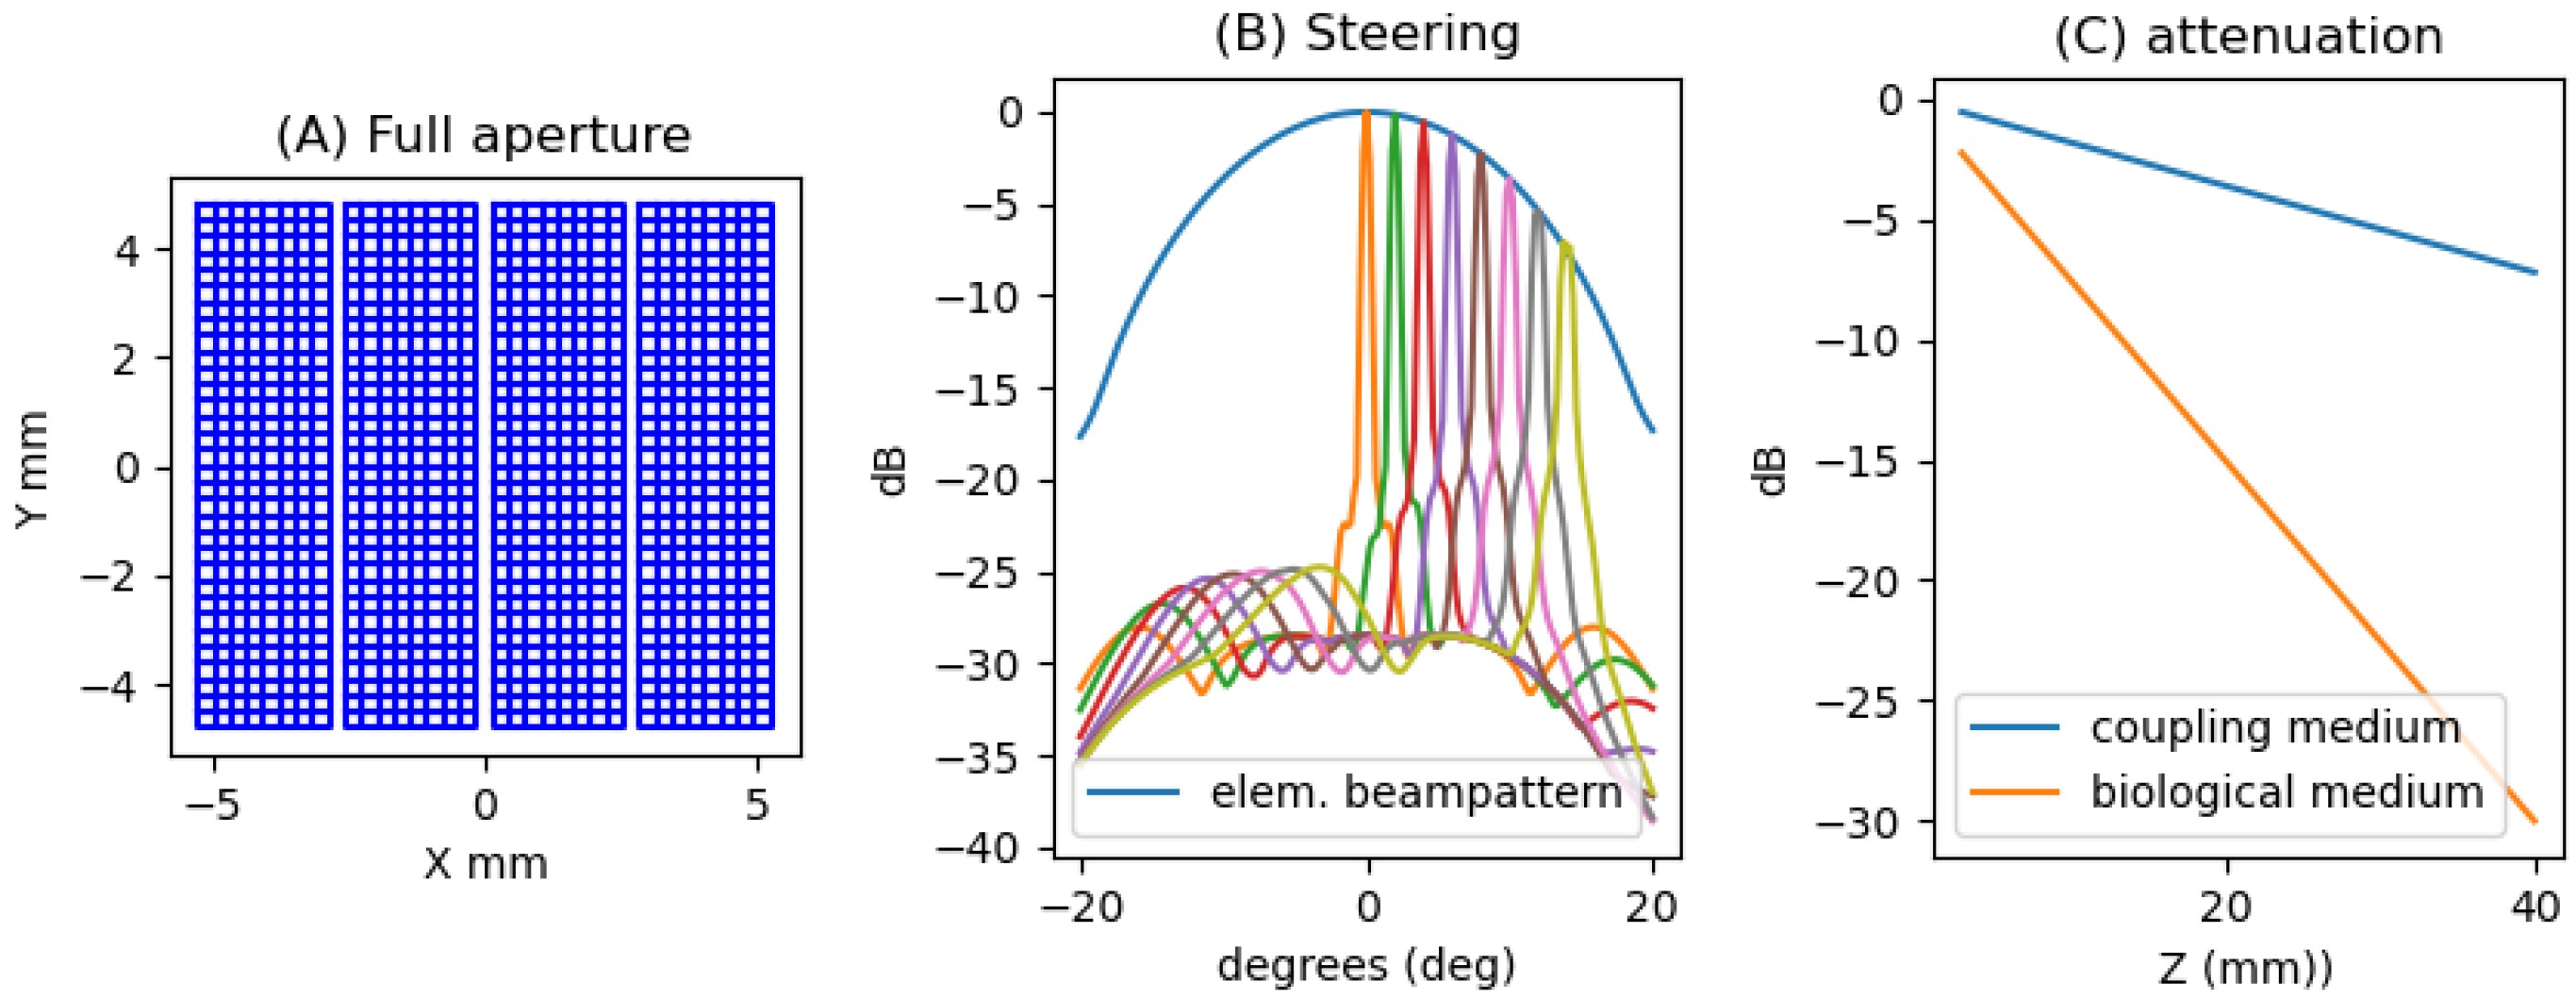
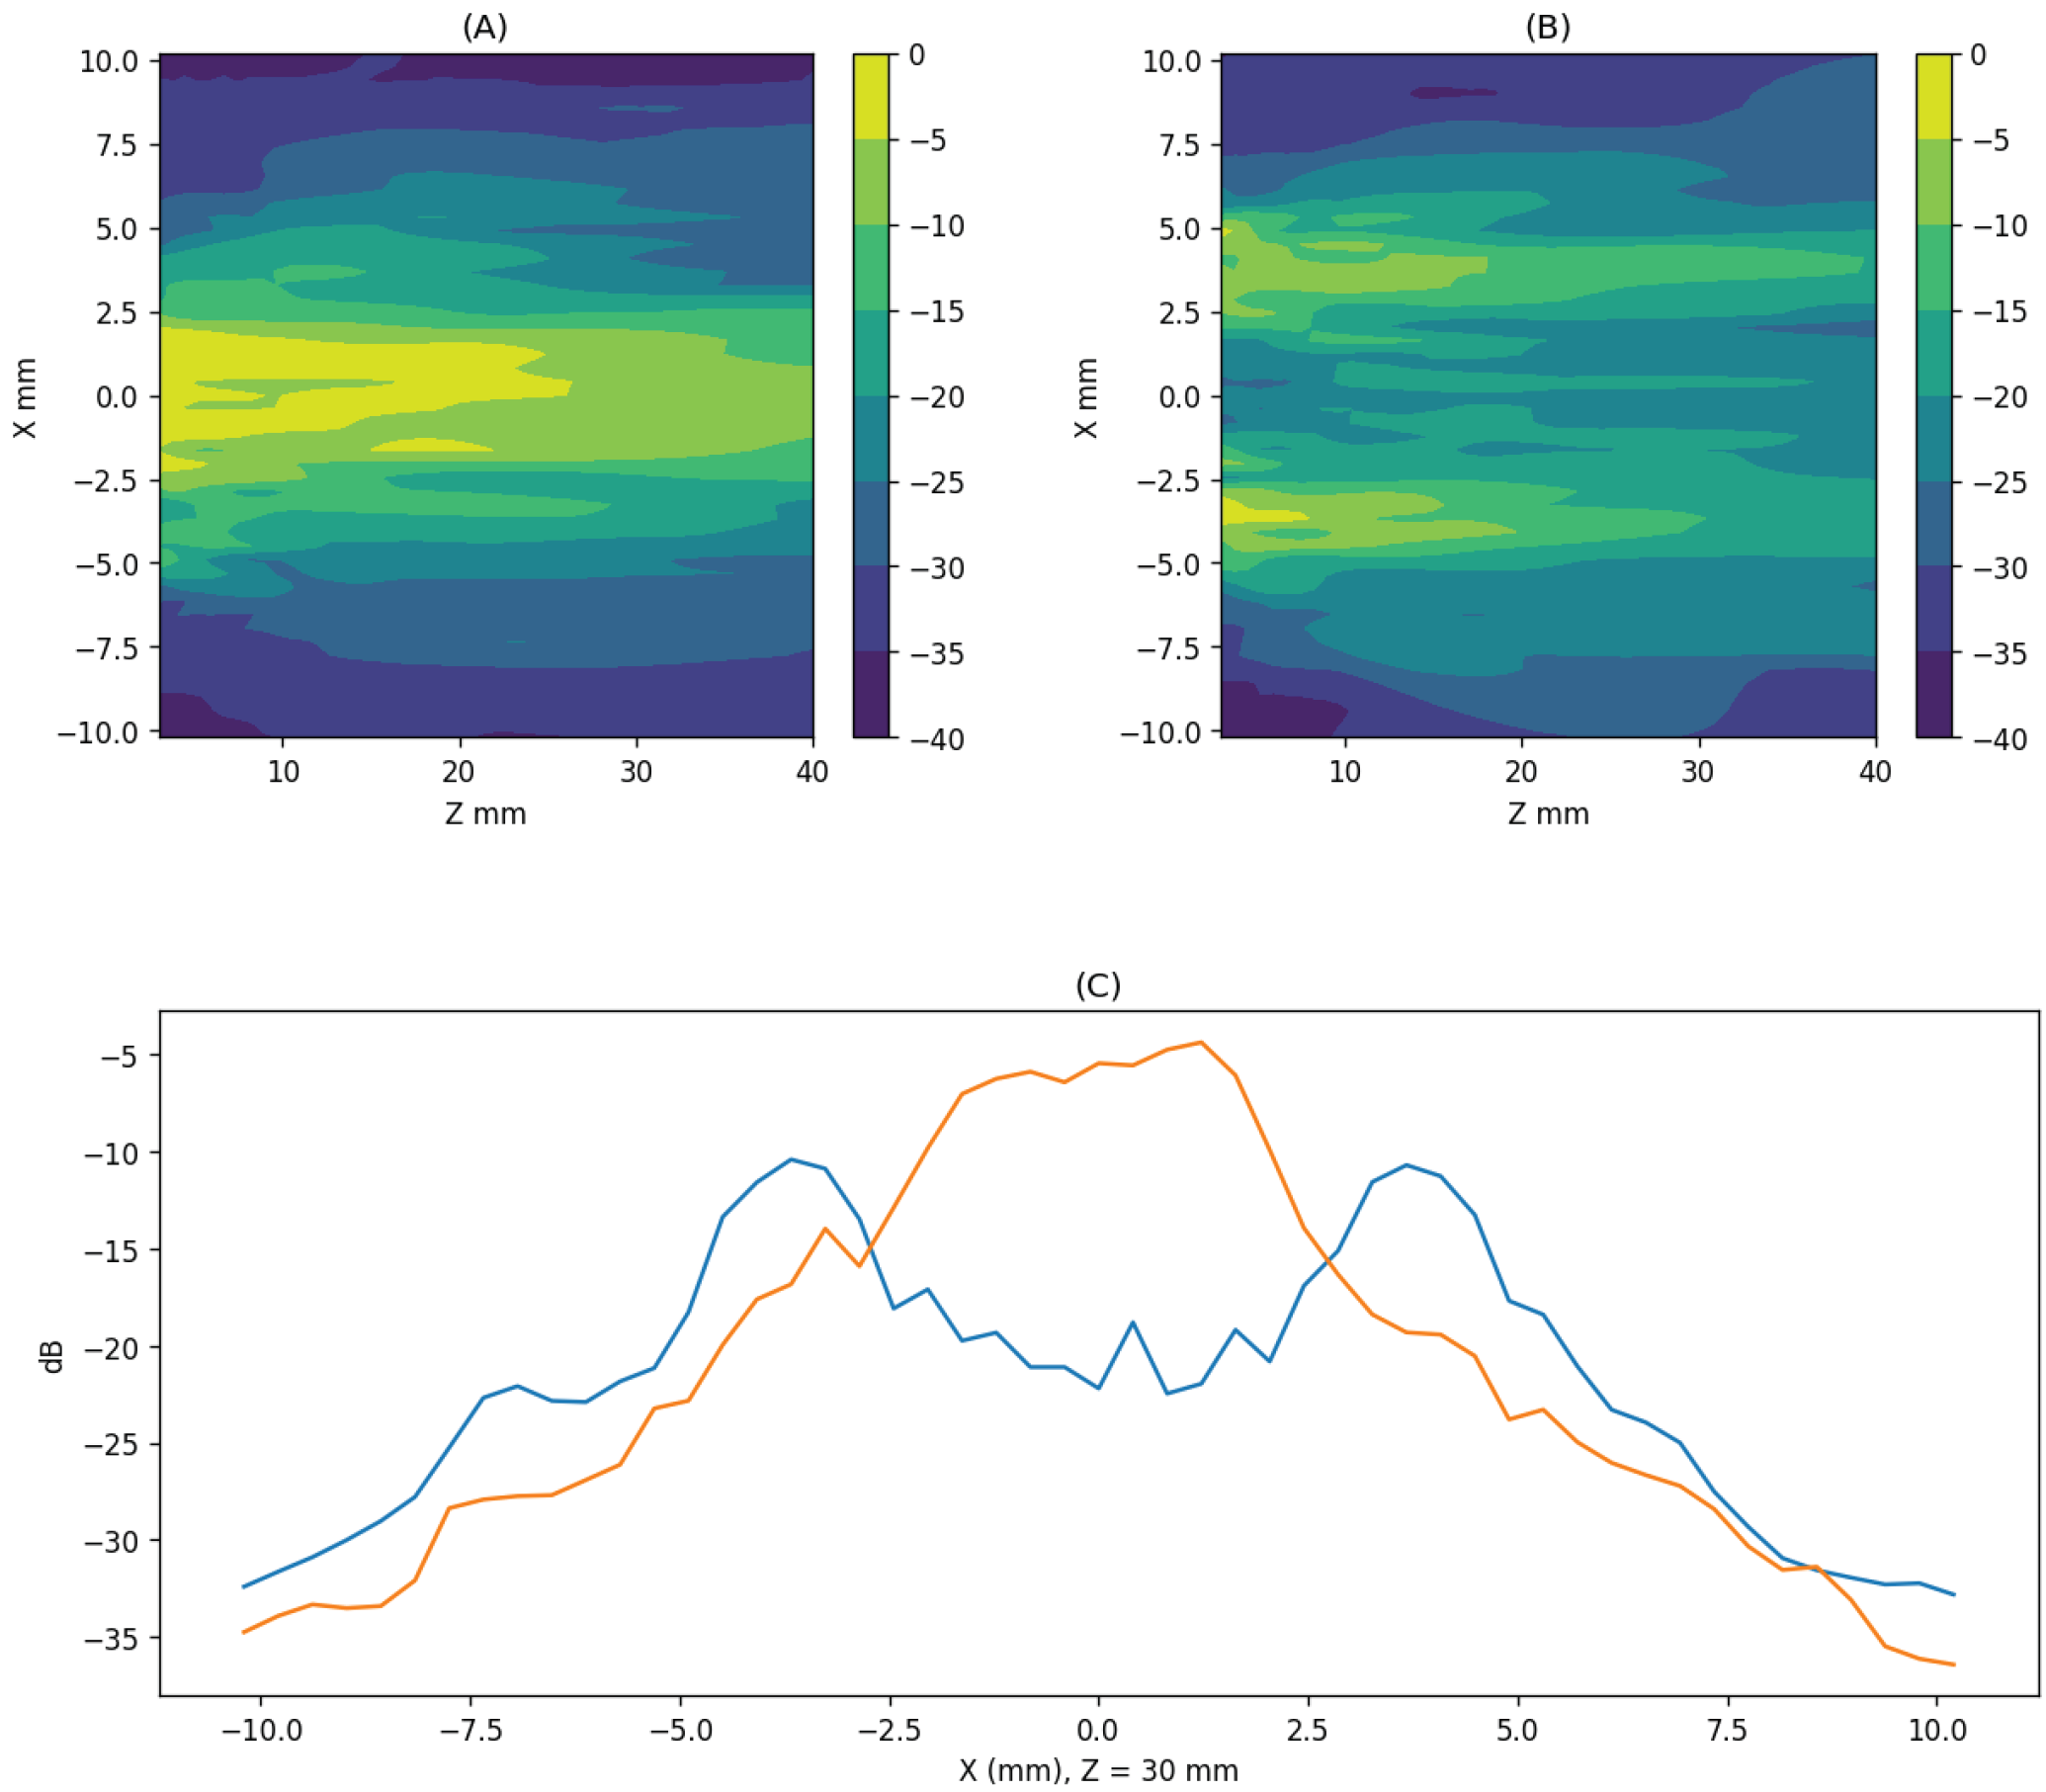
Figure 2.
(A) Element configuration of the array. (B) Lateral profile showing the steering capabilities of the full aperture, from to :, and evolution of the beam from to . (C) Evolution of the attenuation with the propagation in the coupling layer and in the biological tissue.
Figure 2.
(A) Element configuration of the array. (B) Lateral profile showing the steering capabilities of the full aperture, from to :, and evolution of the beam from to . (C) Evolution of the attenuation with the propagation in the coupling layer and in the biological tissue.
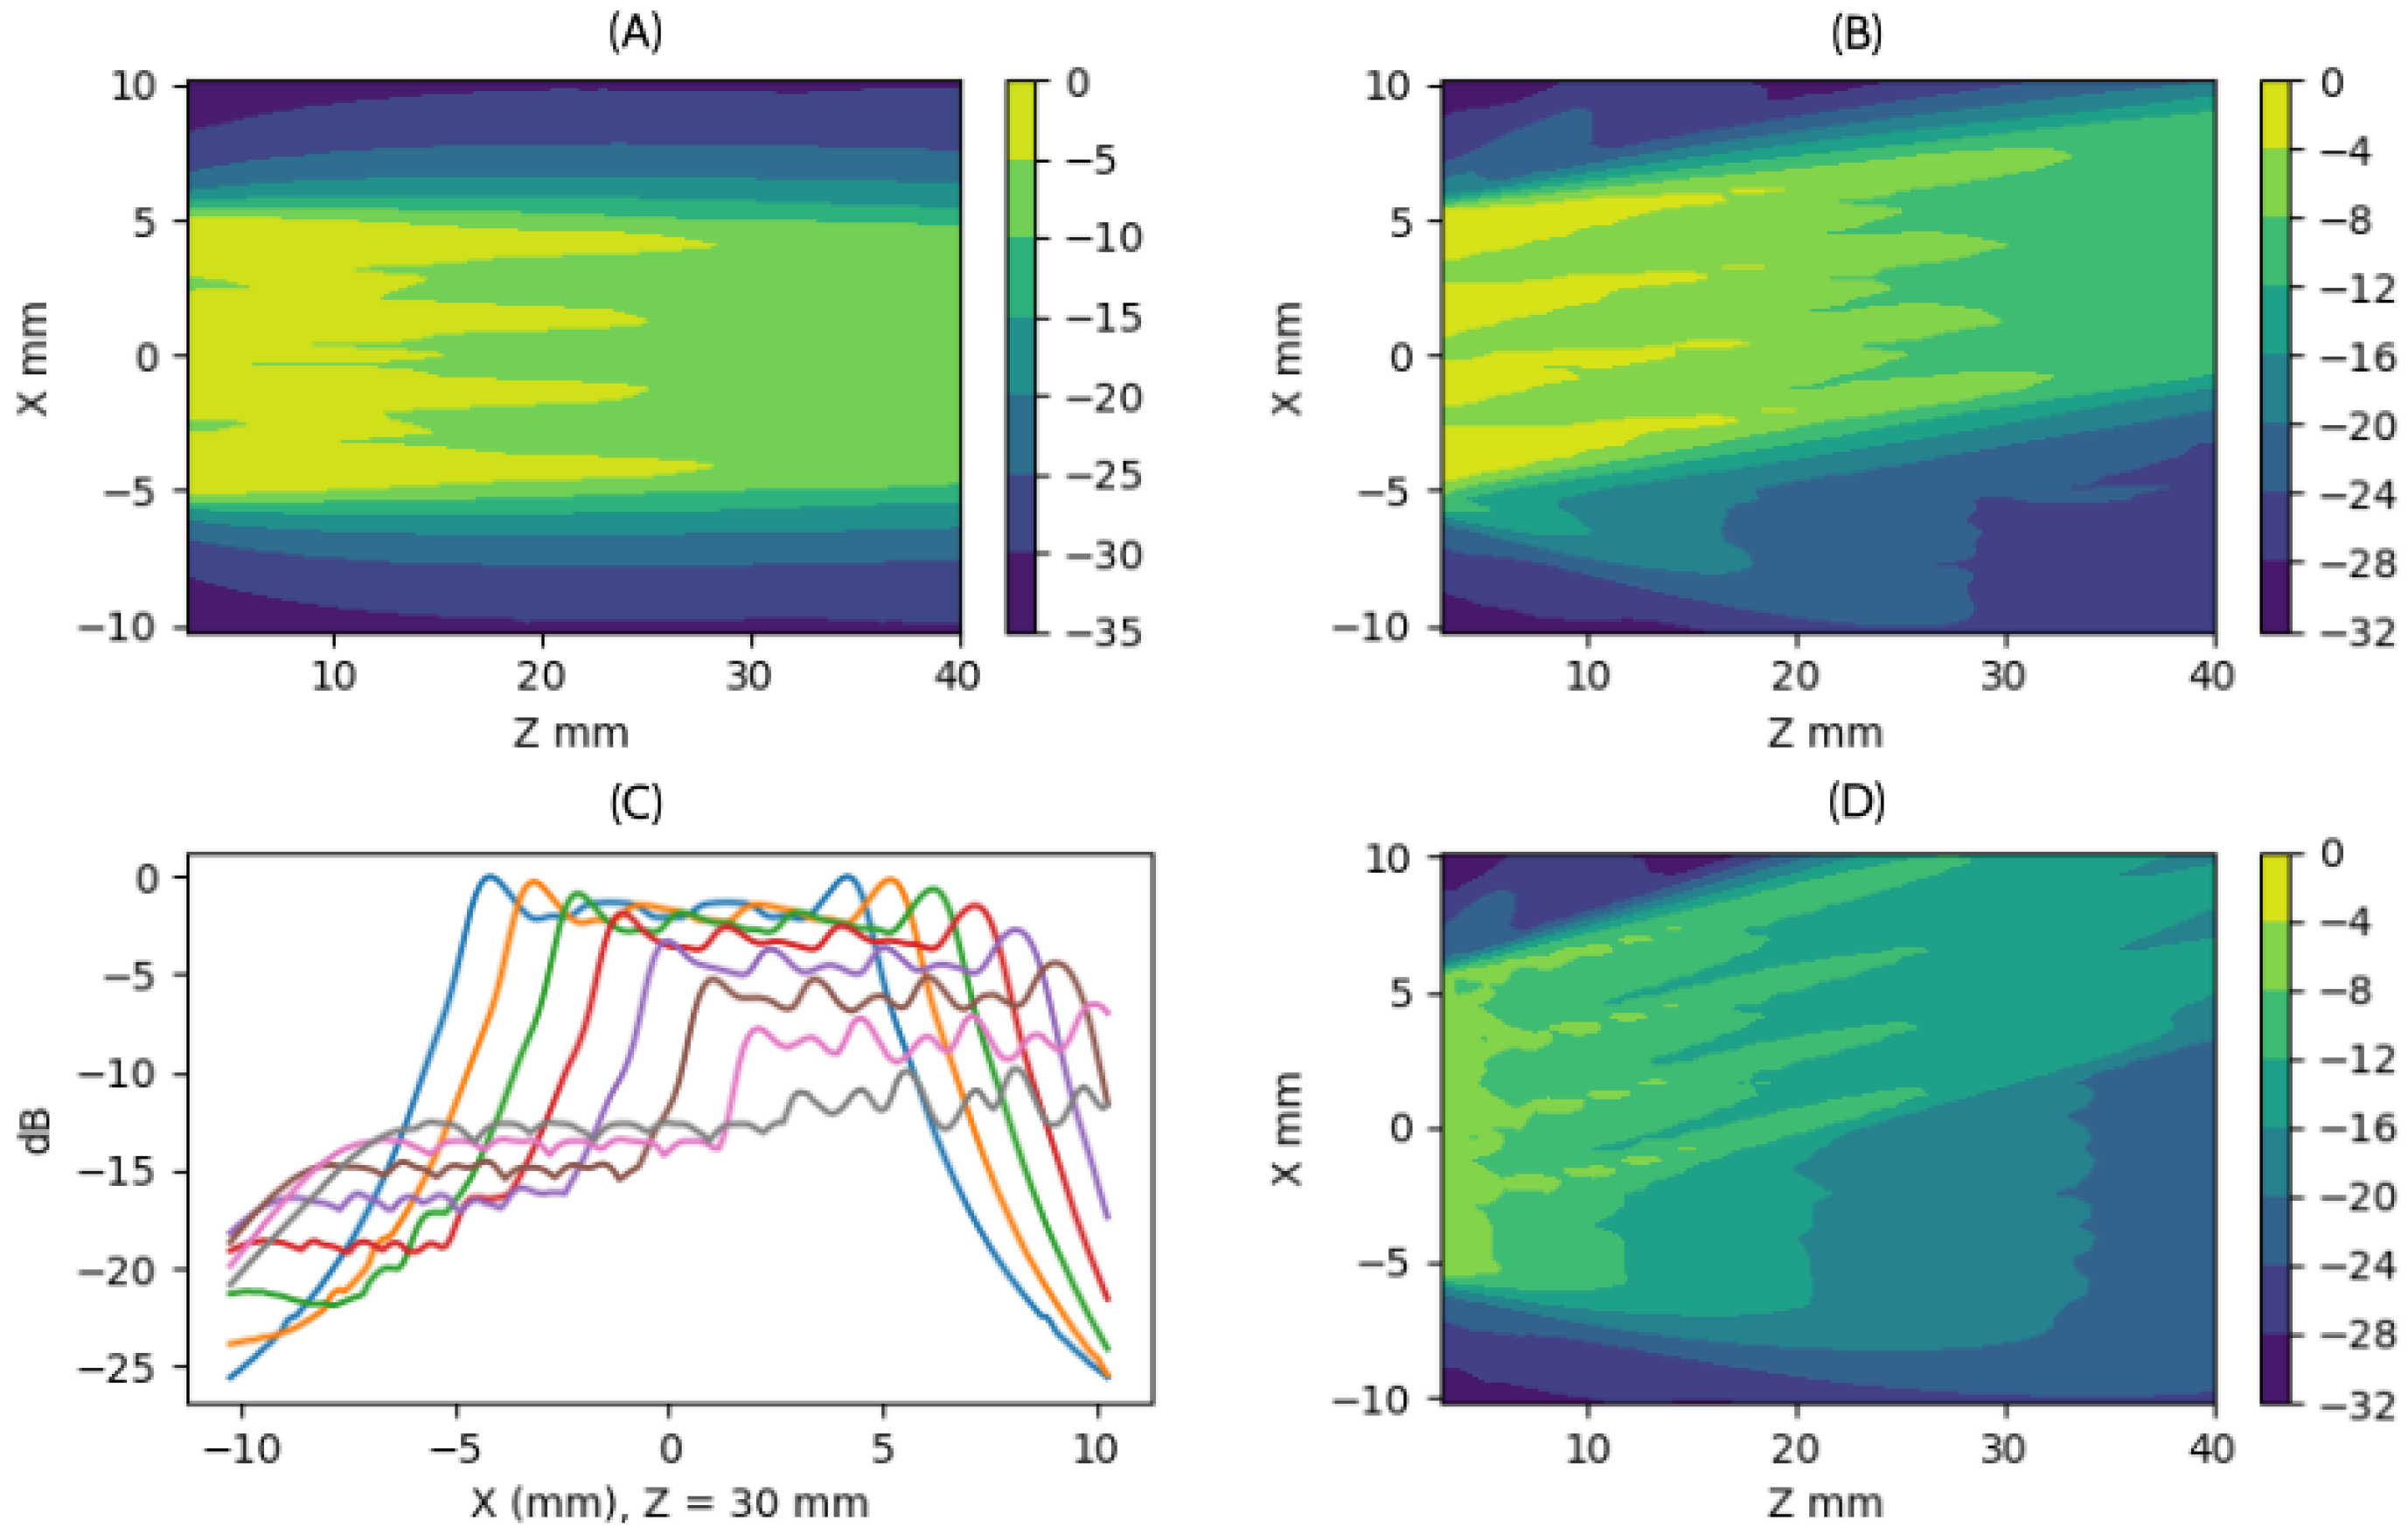
Figure 3.
Beampattern for planar emission in near-field cases of (A) , (B) , and (D) . (C) Lateral profile at with steering from to to .
Figure 3.
Beampattern for planar emission in near-field cases of (A) , (B) , and (D) . (C) Lateral profile at with steering from to to .
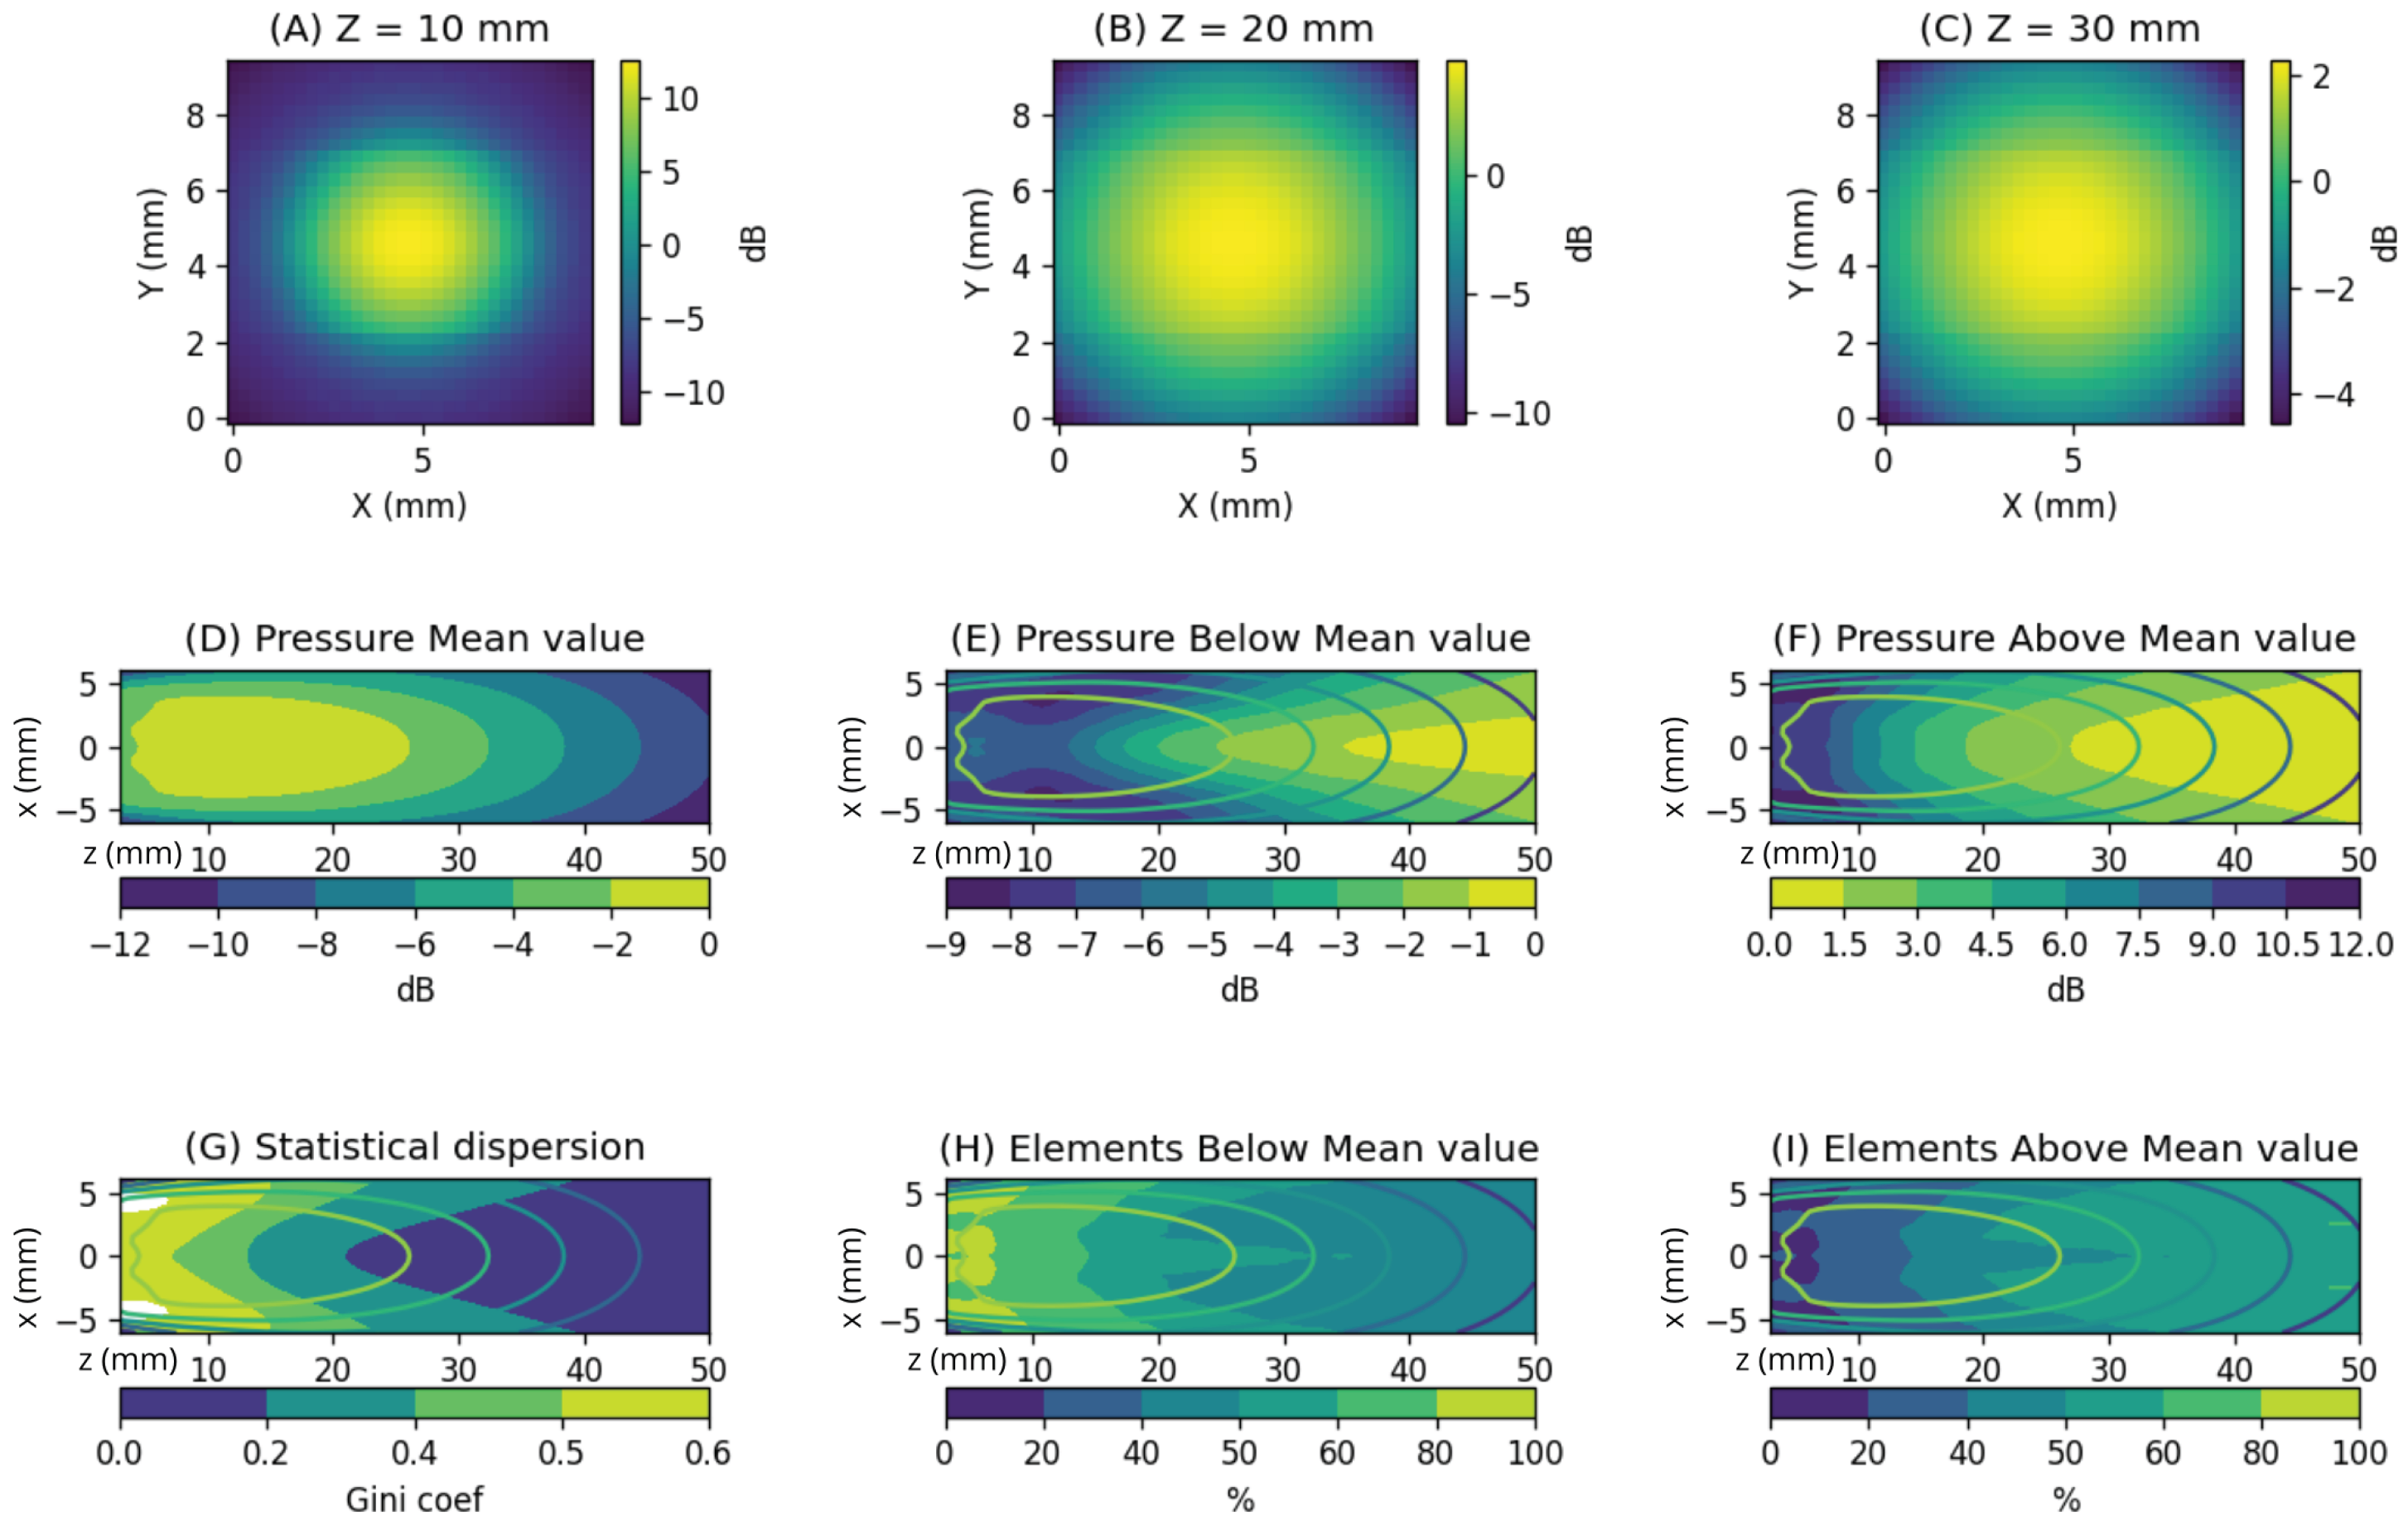
Figure 4.
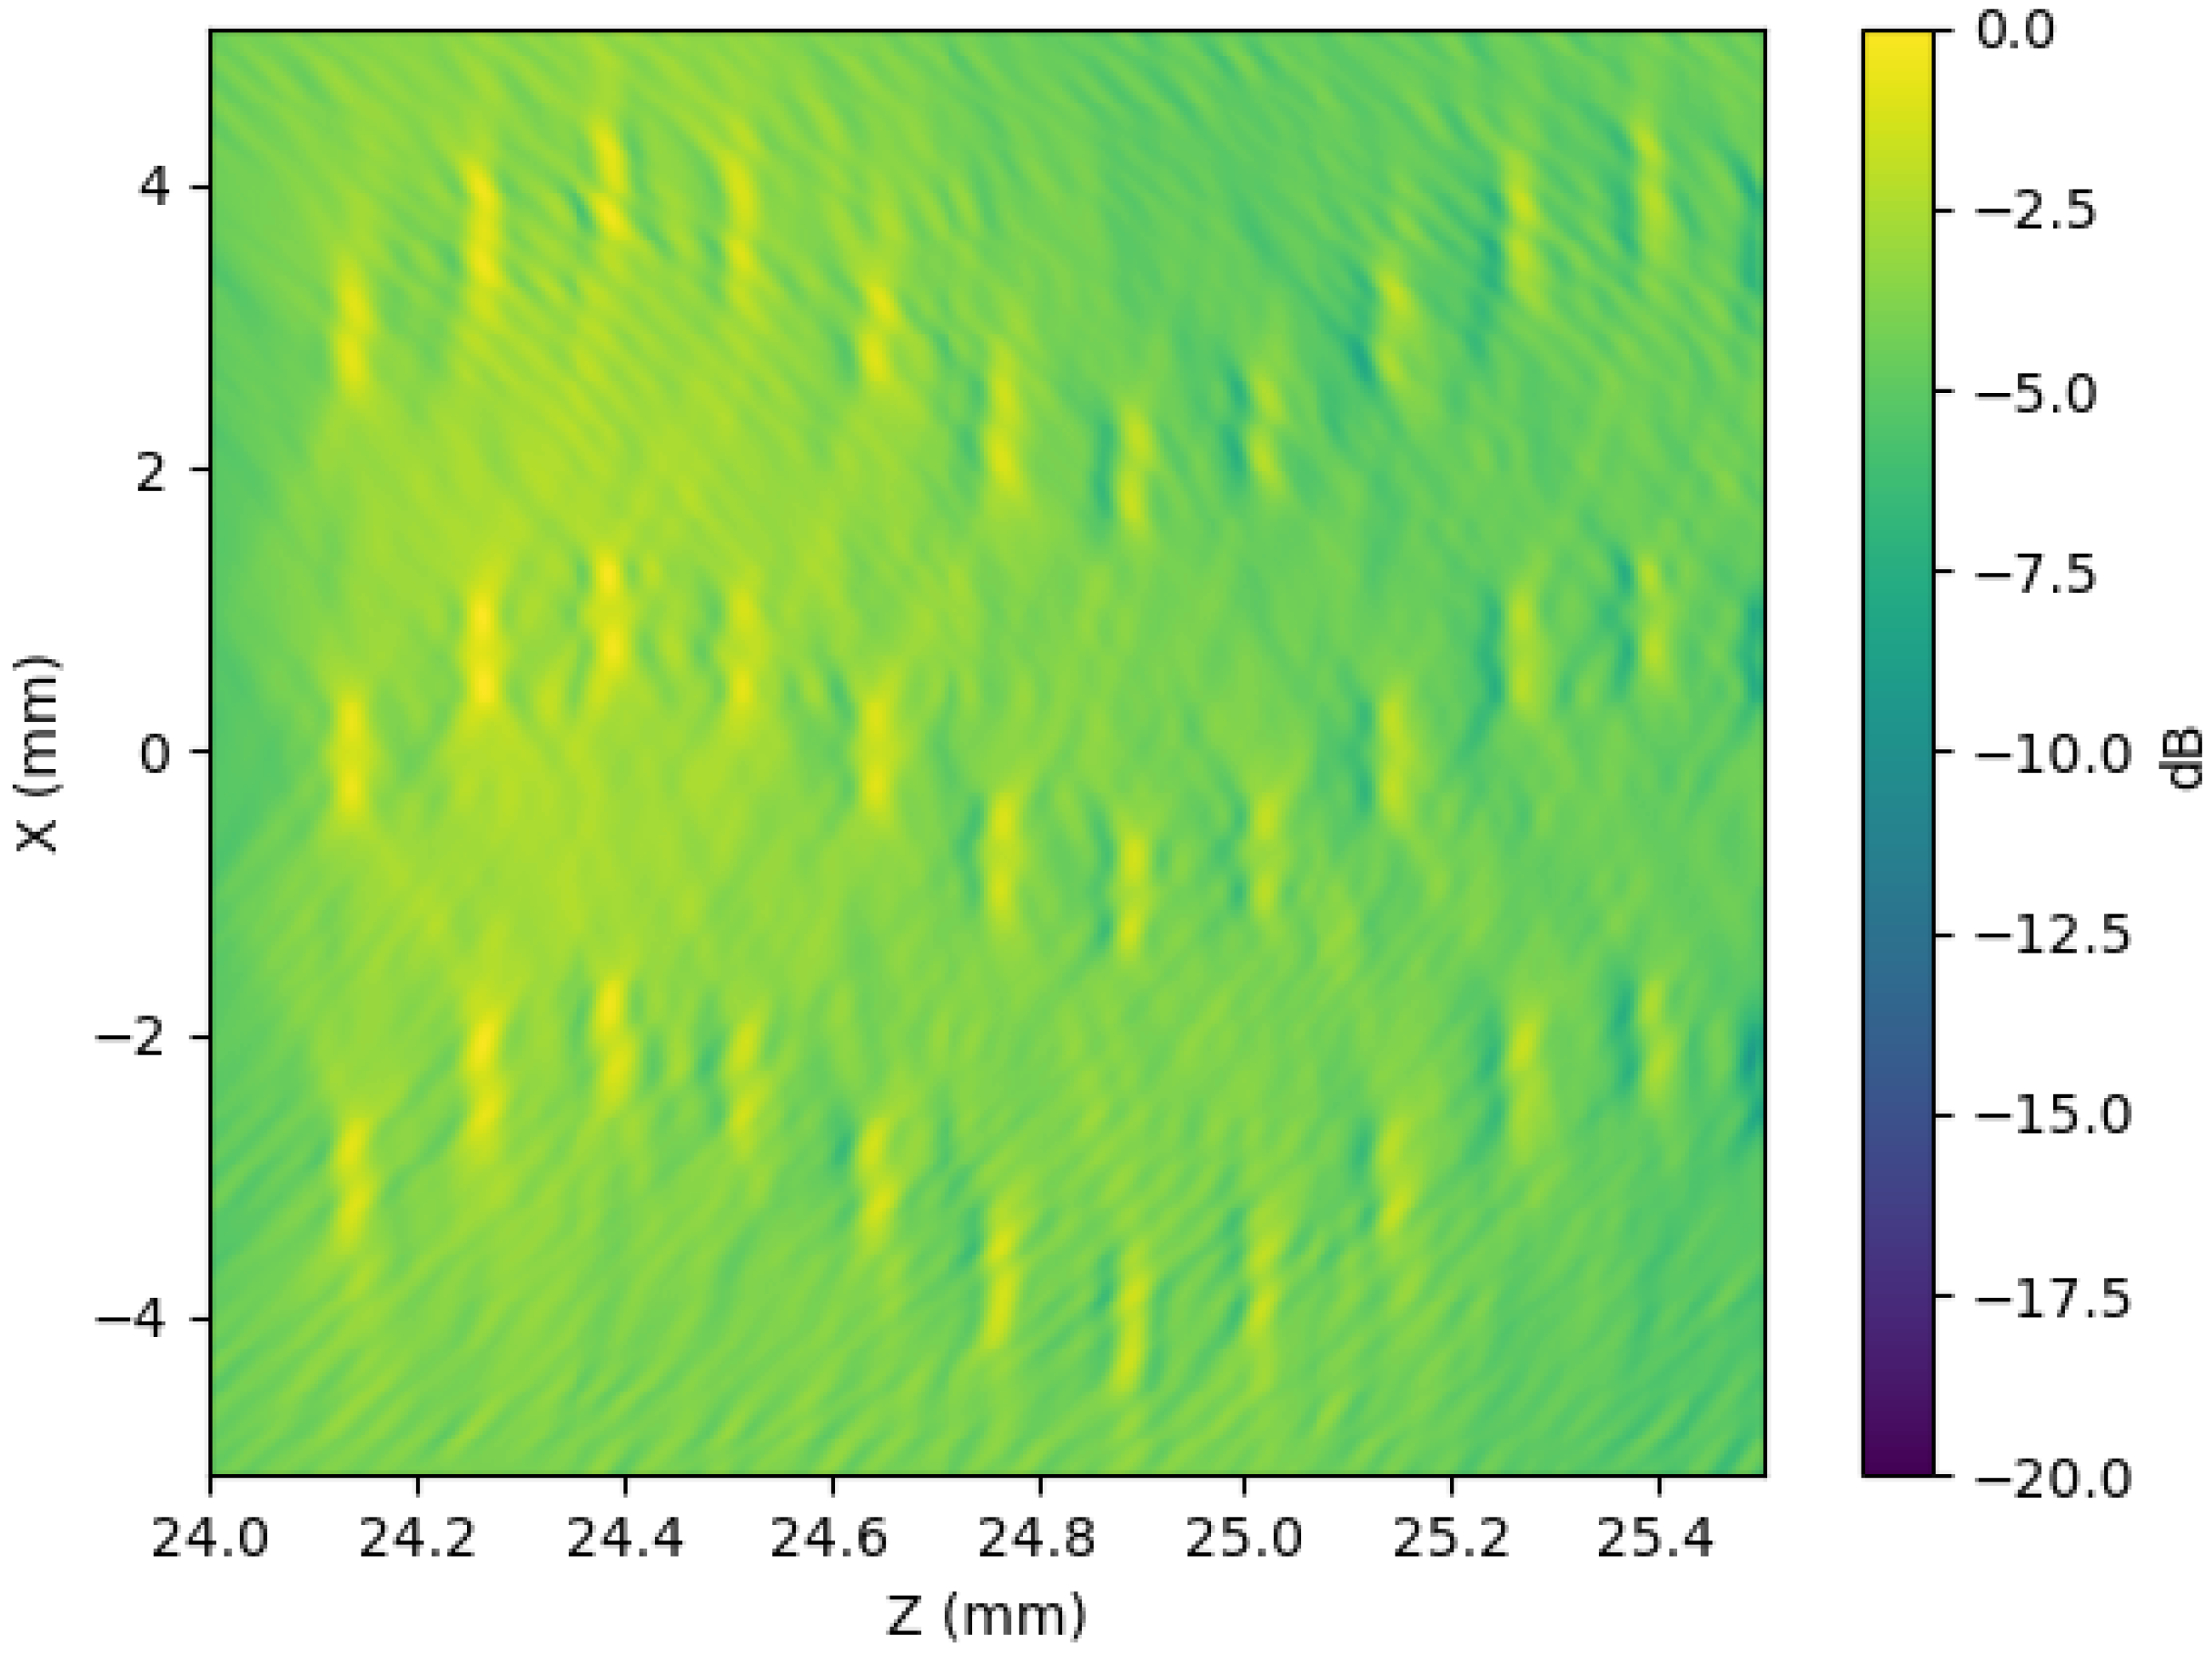
Analysis of element contribution within the region of interest using the full aperture. We considered the region and . (A–C) Show the amplitude with which the aperture elements influence three points along the axis at depths of (A) , (B) , and (C) . Taking the mean value as a reference, we observe differences ranging from up to 40 dB in (A) to around 6 dB in (C). (D) Shows the average gain level applied at each point in the plane. The values in (E) represent the level reached by elements below the mean, while (F) shows the values above it. In (G), we present the statistical dispersion of these values, calculated using the Gini coefficient. (H) Displays the percentage of elements below the mean, and (I) shows the percentage above the mean.
Figure 5.
Three sparsification strategies are shown, where the color indicates the number of active elements in each bin. The maximum number of active elements per bin is 16. (A) Taylor-based apodization scheme (for emission and reception), (B) ring-based apodization scheme (complementary to Taylor apodization in emission), and (C) ring-shaped apodization scheme used in reception.
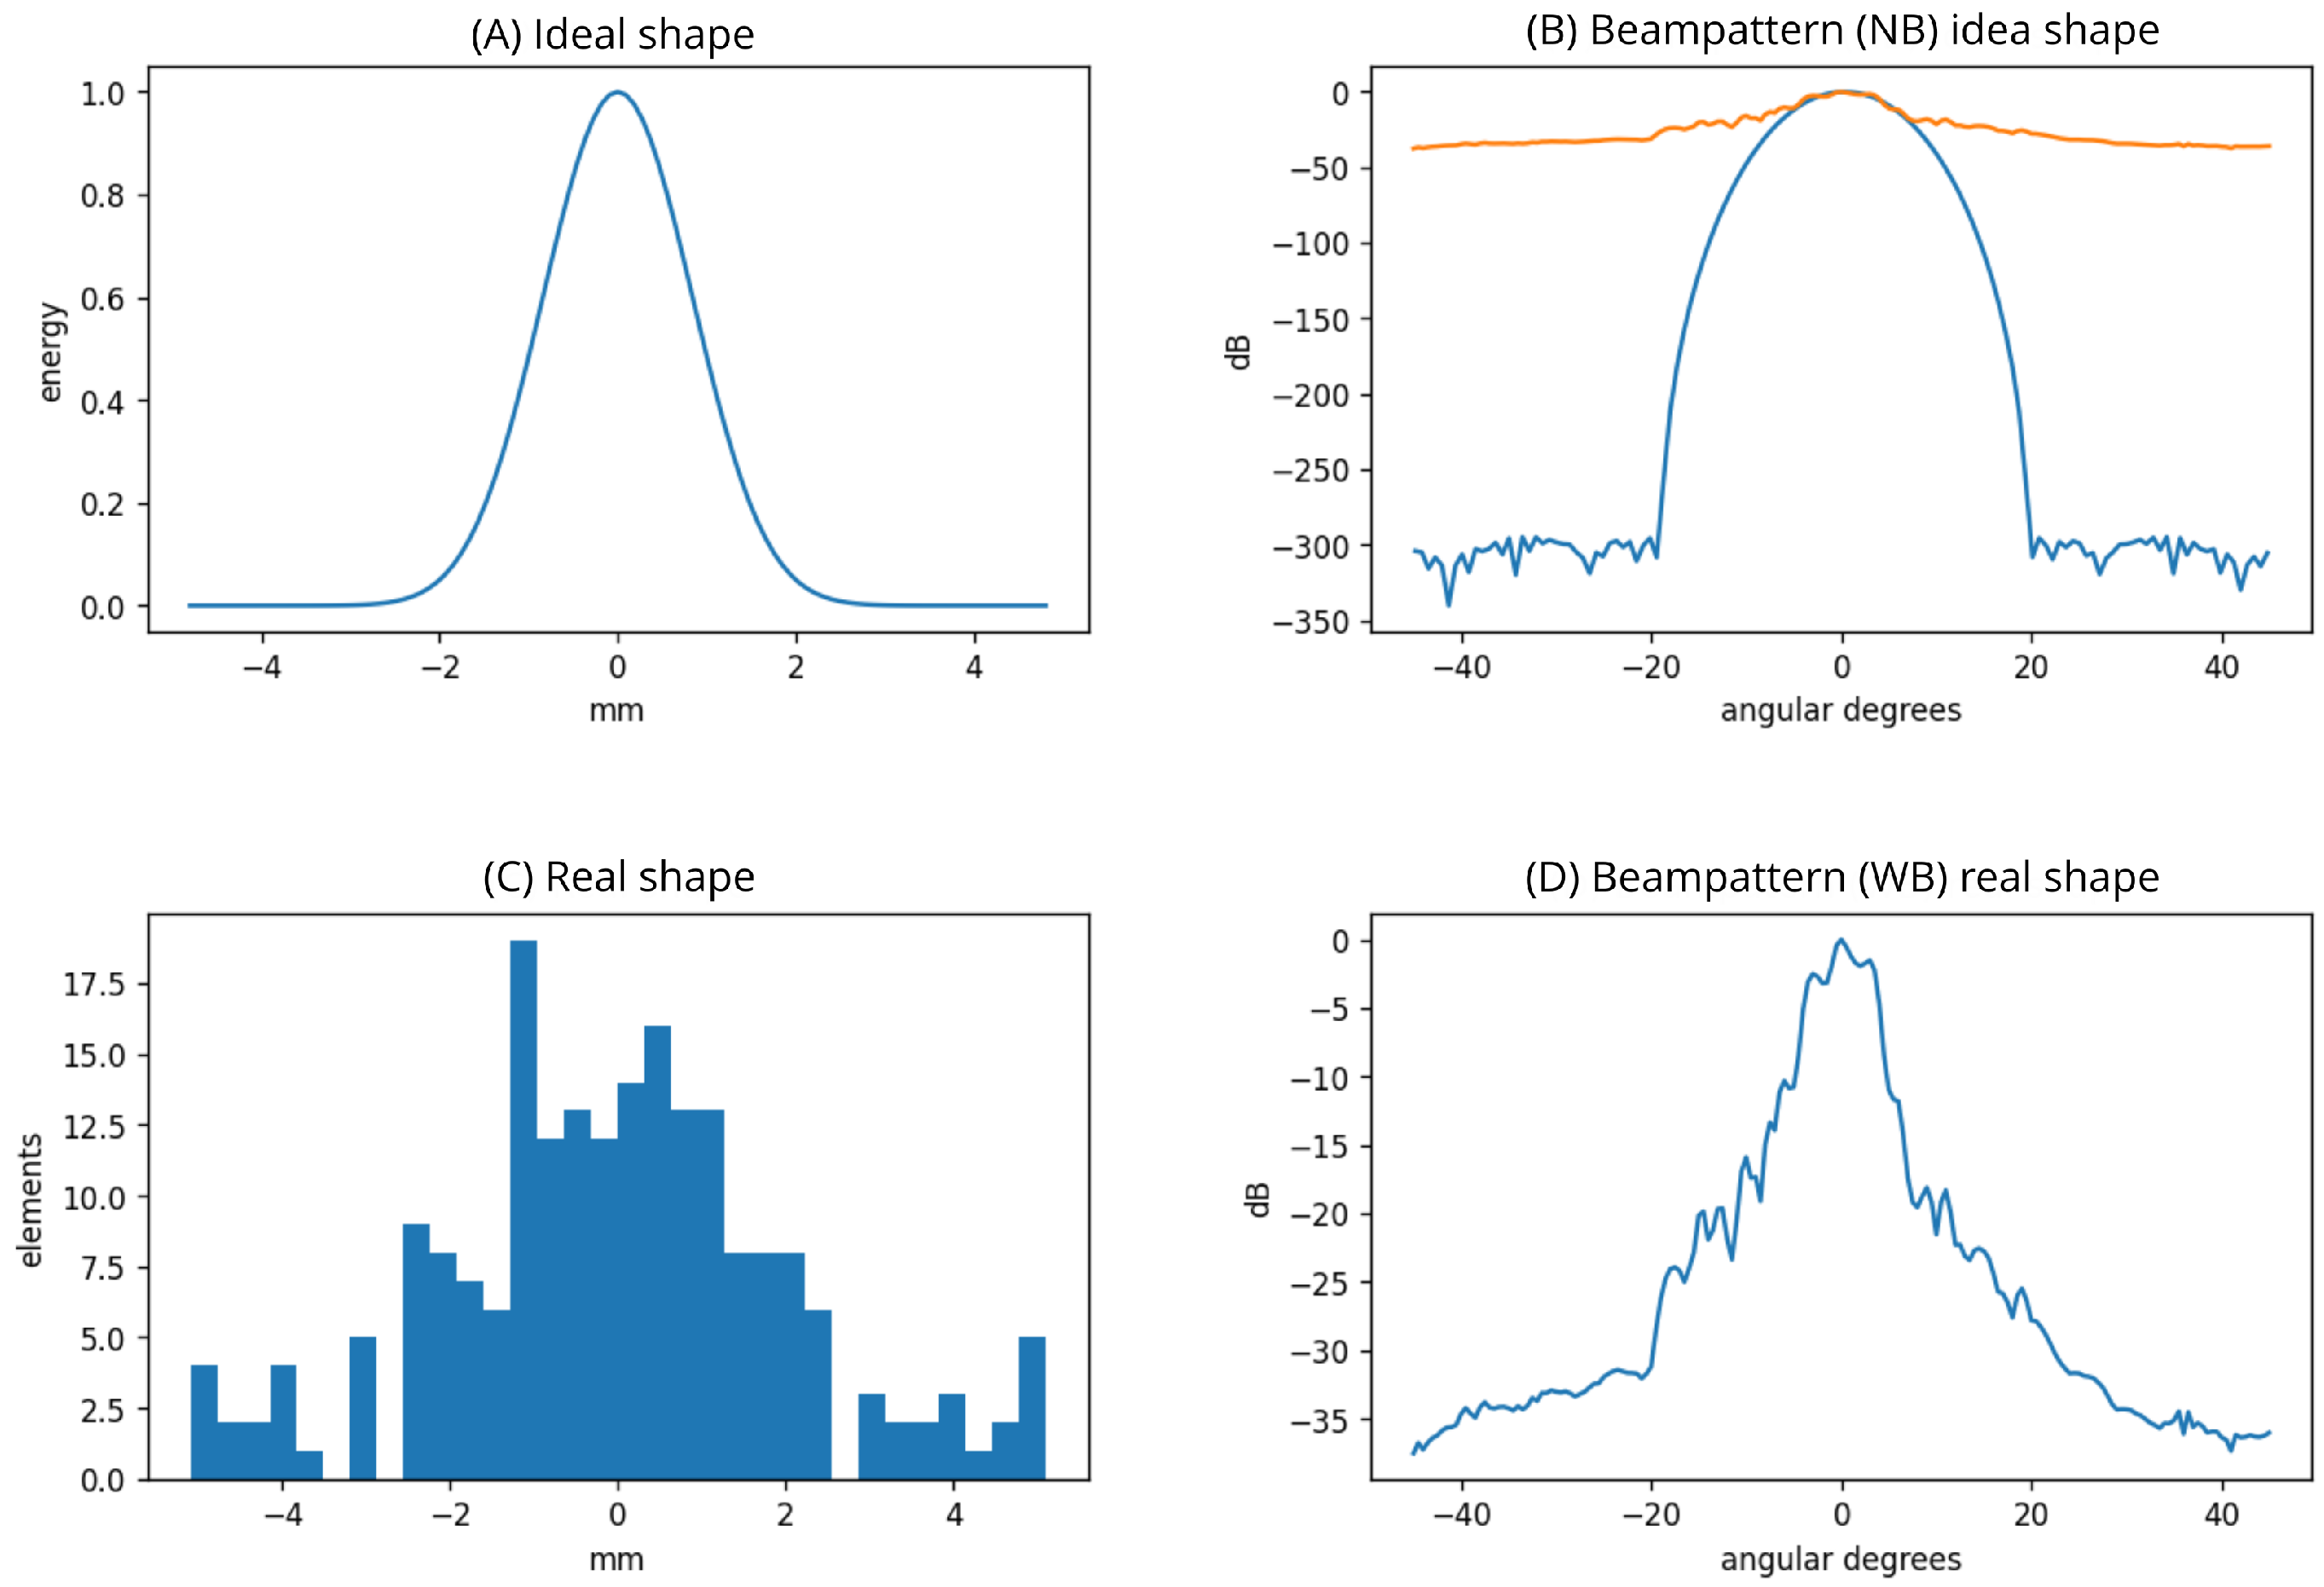
Figure 6.
Difference between the desired acoustic field for the apodized transmitting aperture and the field that can actually be achieved given the technical limitations. (A) The ideal apodization shape. (C) The apodization obtained, represented over the equivalent linear array at axis X = 0, achieved with a binarized aperture, where elements within each bin are randomly selected. (B) Displays both the desired field (blue line) and the achieved field (orange line). (D) Shows the resulting field obtained through sparsity-based reconstruction.
Figure 7.
For the Taylor-apodized scheme, analysis of element contributions at different points in space, we considered the region and . (A–C) Show the amplitude with which the aperture elements influence three points along the axis at depths of (A) , (B) , and (C) . Taking the mean value as a reference, we observe differences ranging from up to 20 dB in (A) to around 6 dB in (C). (D) Shows the average gain level exerted at each point in the plane. The values in (E) represent the level reached by elements below the mean, while (F) shows the values above it. In (G), we present the statistical dispersion of these values, calculated using the Gini coefficient. (H) Displays the percentage of elements below the mean, and (I) shows the percentage above the mean.
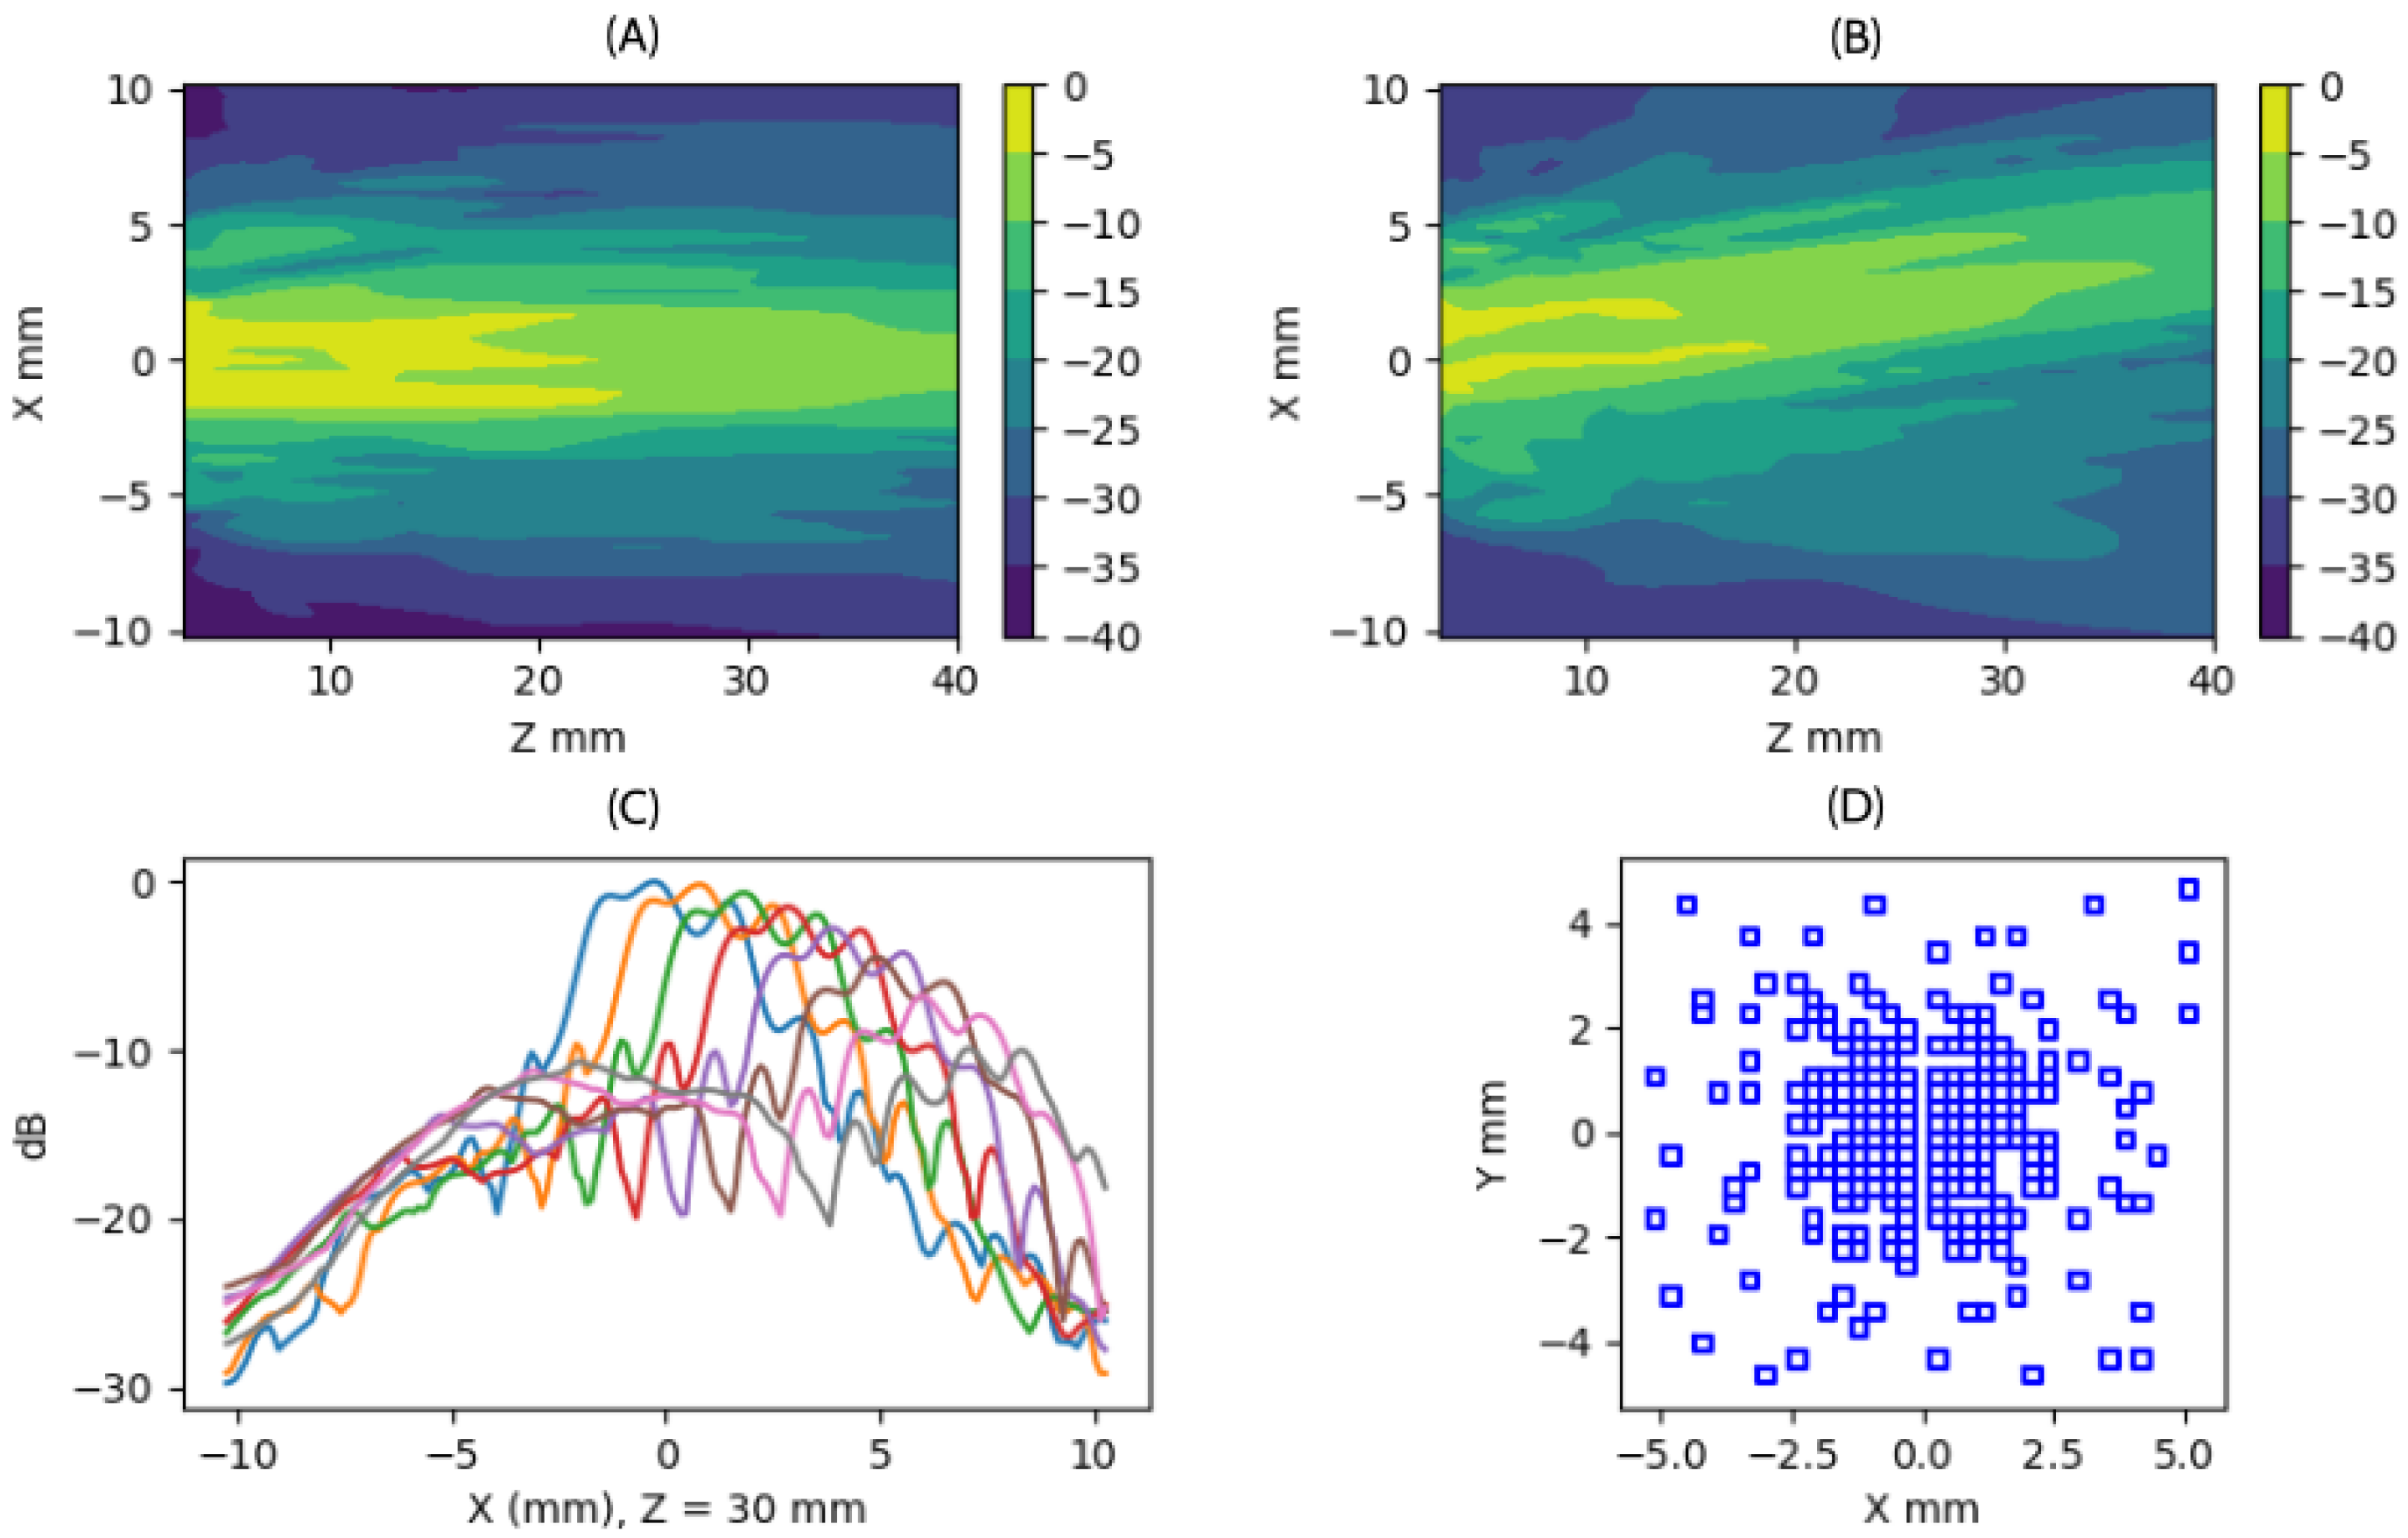
Figure 8.
For a particular realization of the Taylor-apodized aperture shown in (D), (A) displays the field generated by a plane wave emission along the axis . (B) Shows the field generated by a deflected plane wave emission at . (C) Presents the lateral cross-section of the field at , across angles from to in steps of .
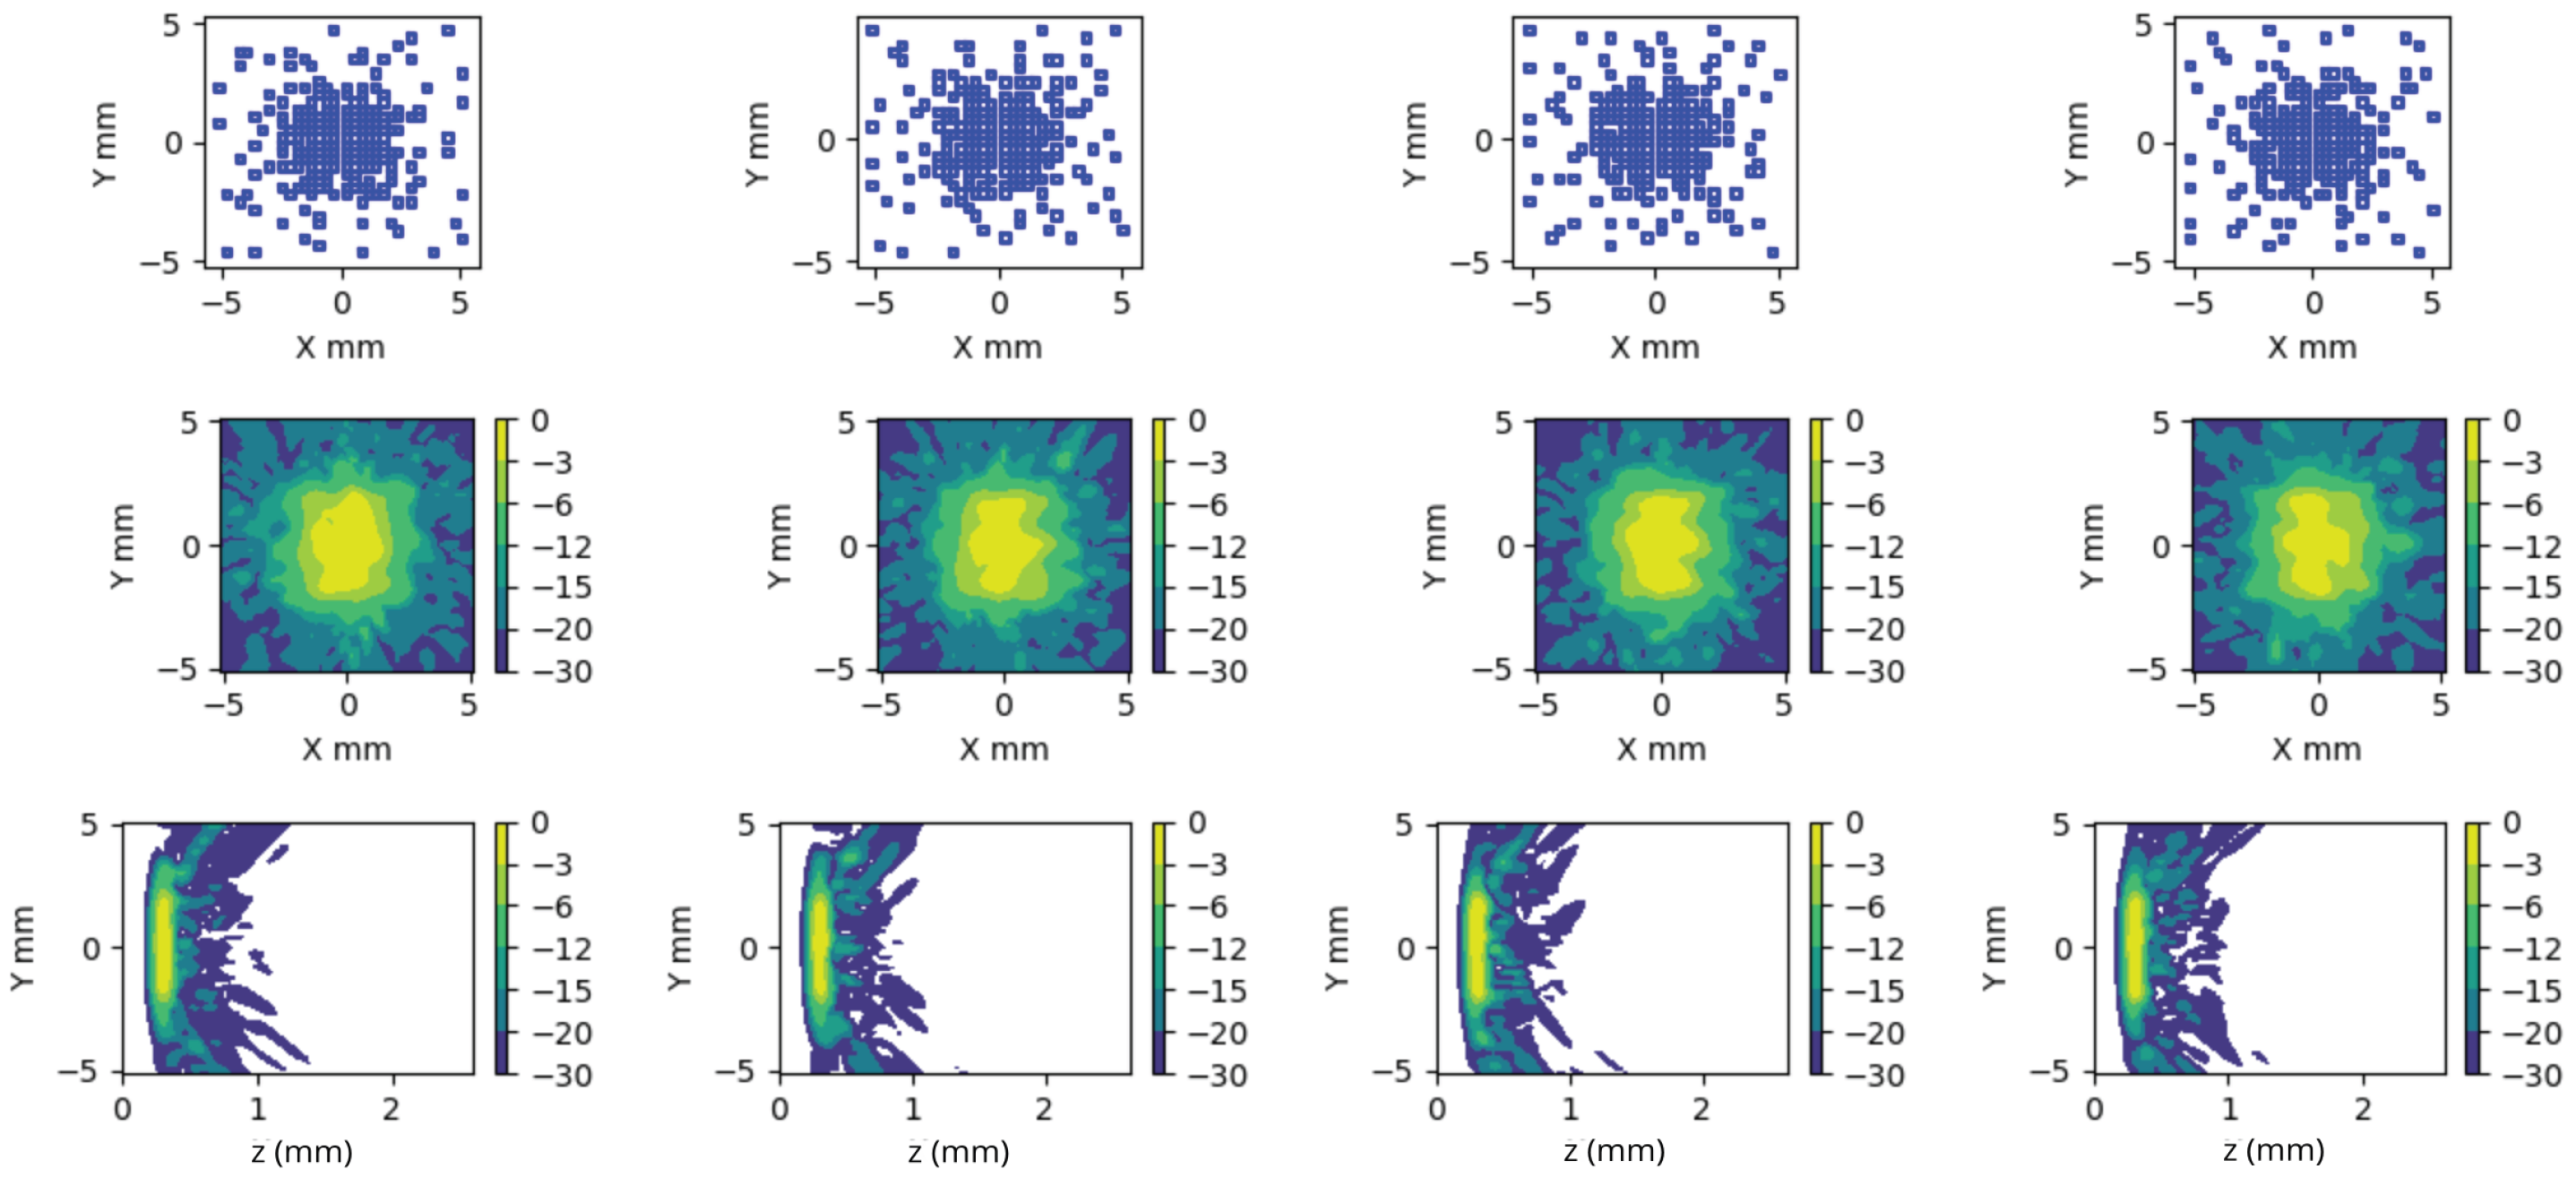
Figure 9.
This figure presents four cases of Taylor apodization realizations. In each column, we show the aperture, the generated field at Z = 30 mm within the aperture’s projection zone, and the envelope of the wavefront produced by a plane wave emission. The most relevant aspect is the variation observed in the tails of these wavefronts, which are intended to enhance the received signal.
Figure 10.
Comparison of different signal combination strategies for a central aperture element. The histogram displays all cases, with a red line indicating the result for each proposed criterion. (A) Random acquisition. (B) Average of all 1024 acquisitions. (C) Average of the 10 lowest-amplitude acquisitions. (D) Single lowest-amplitude acquisition.
Figure 11.
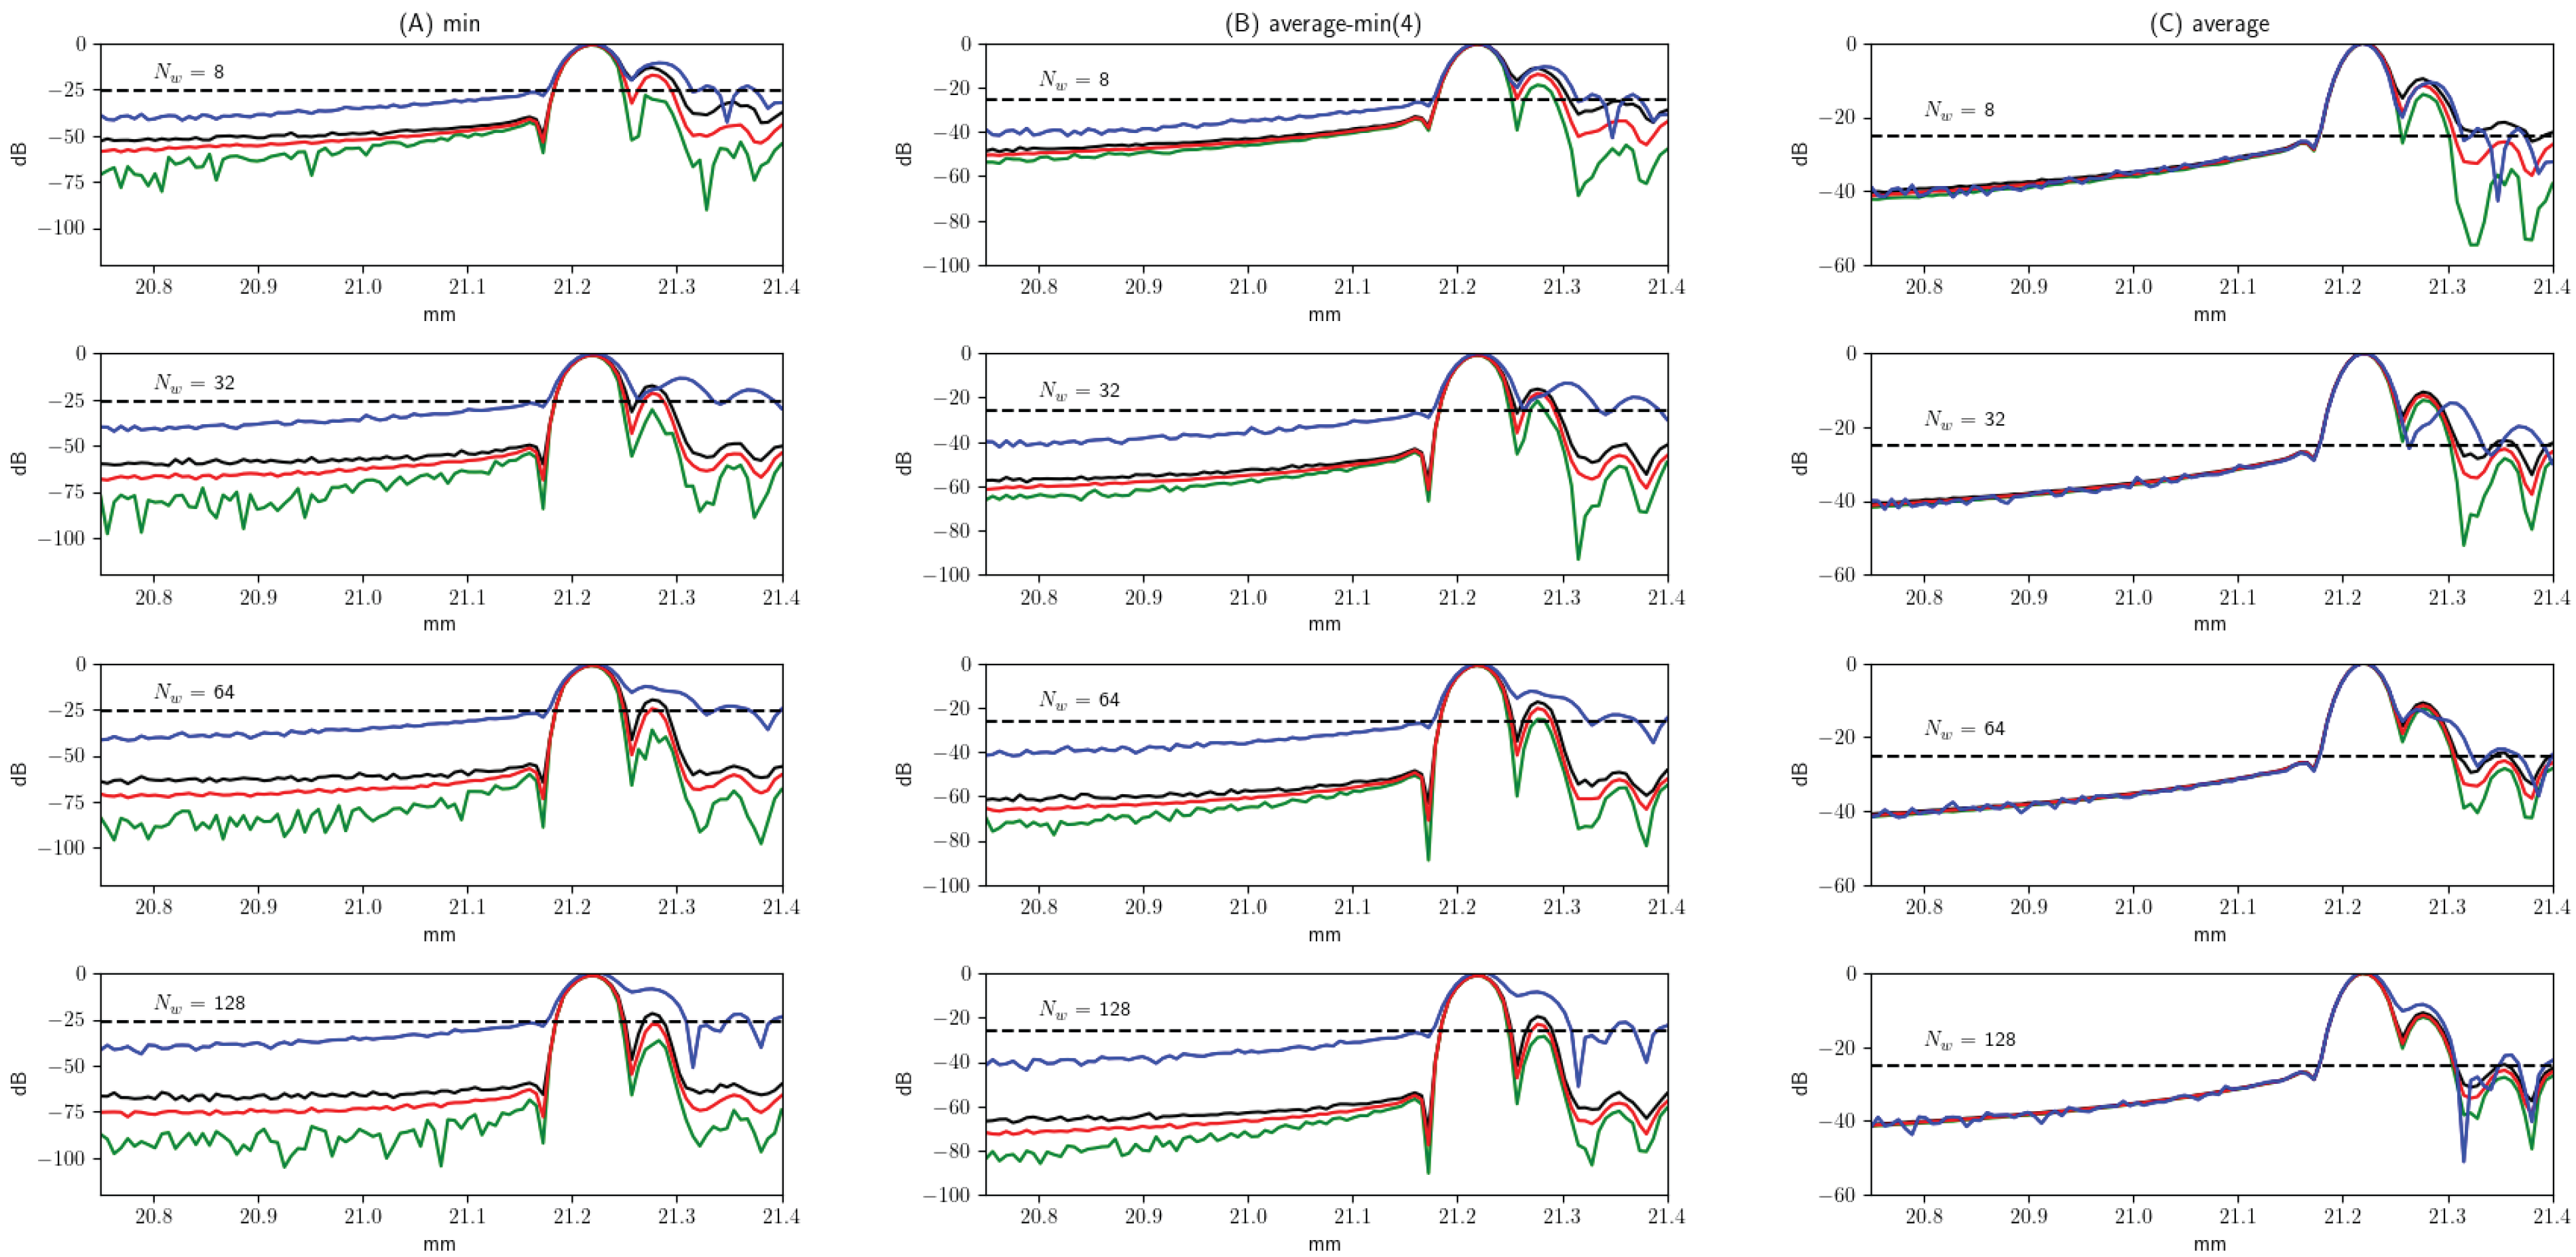
Z-axis image of a reflector located at obtained for using full reception. For each configuration, 300 images were generated by applying the three proposed signal composition methods: (A) minimum, (B) average of the four lowest values, and (C) full average. For each point along the axis, the maximum (black line), minimum (green line), and mean (red line) values are shown. A specific case for is included in blue for reference. In all cases, a signal-to-noise ratio (SNR) of 20 dB was applied. A line at −25 dB from the main peak is plotted as a reference for estimating the axial resolution (). The blue line represents an arbitrary case.
Figure 12.
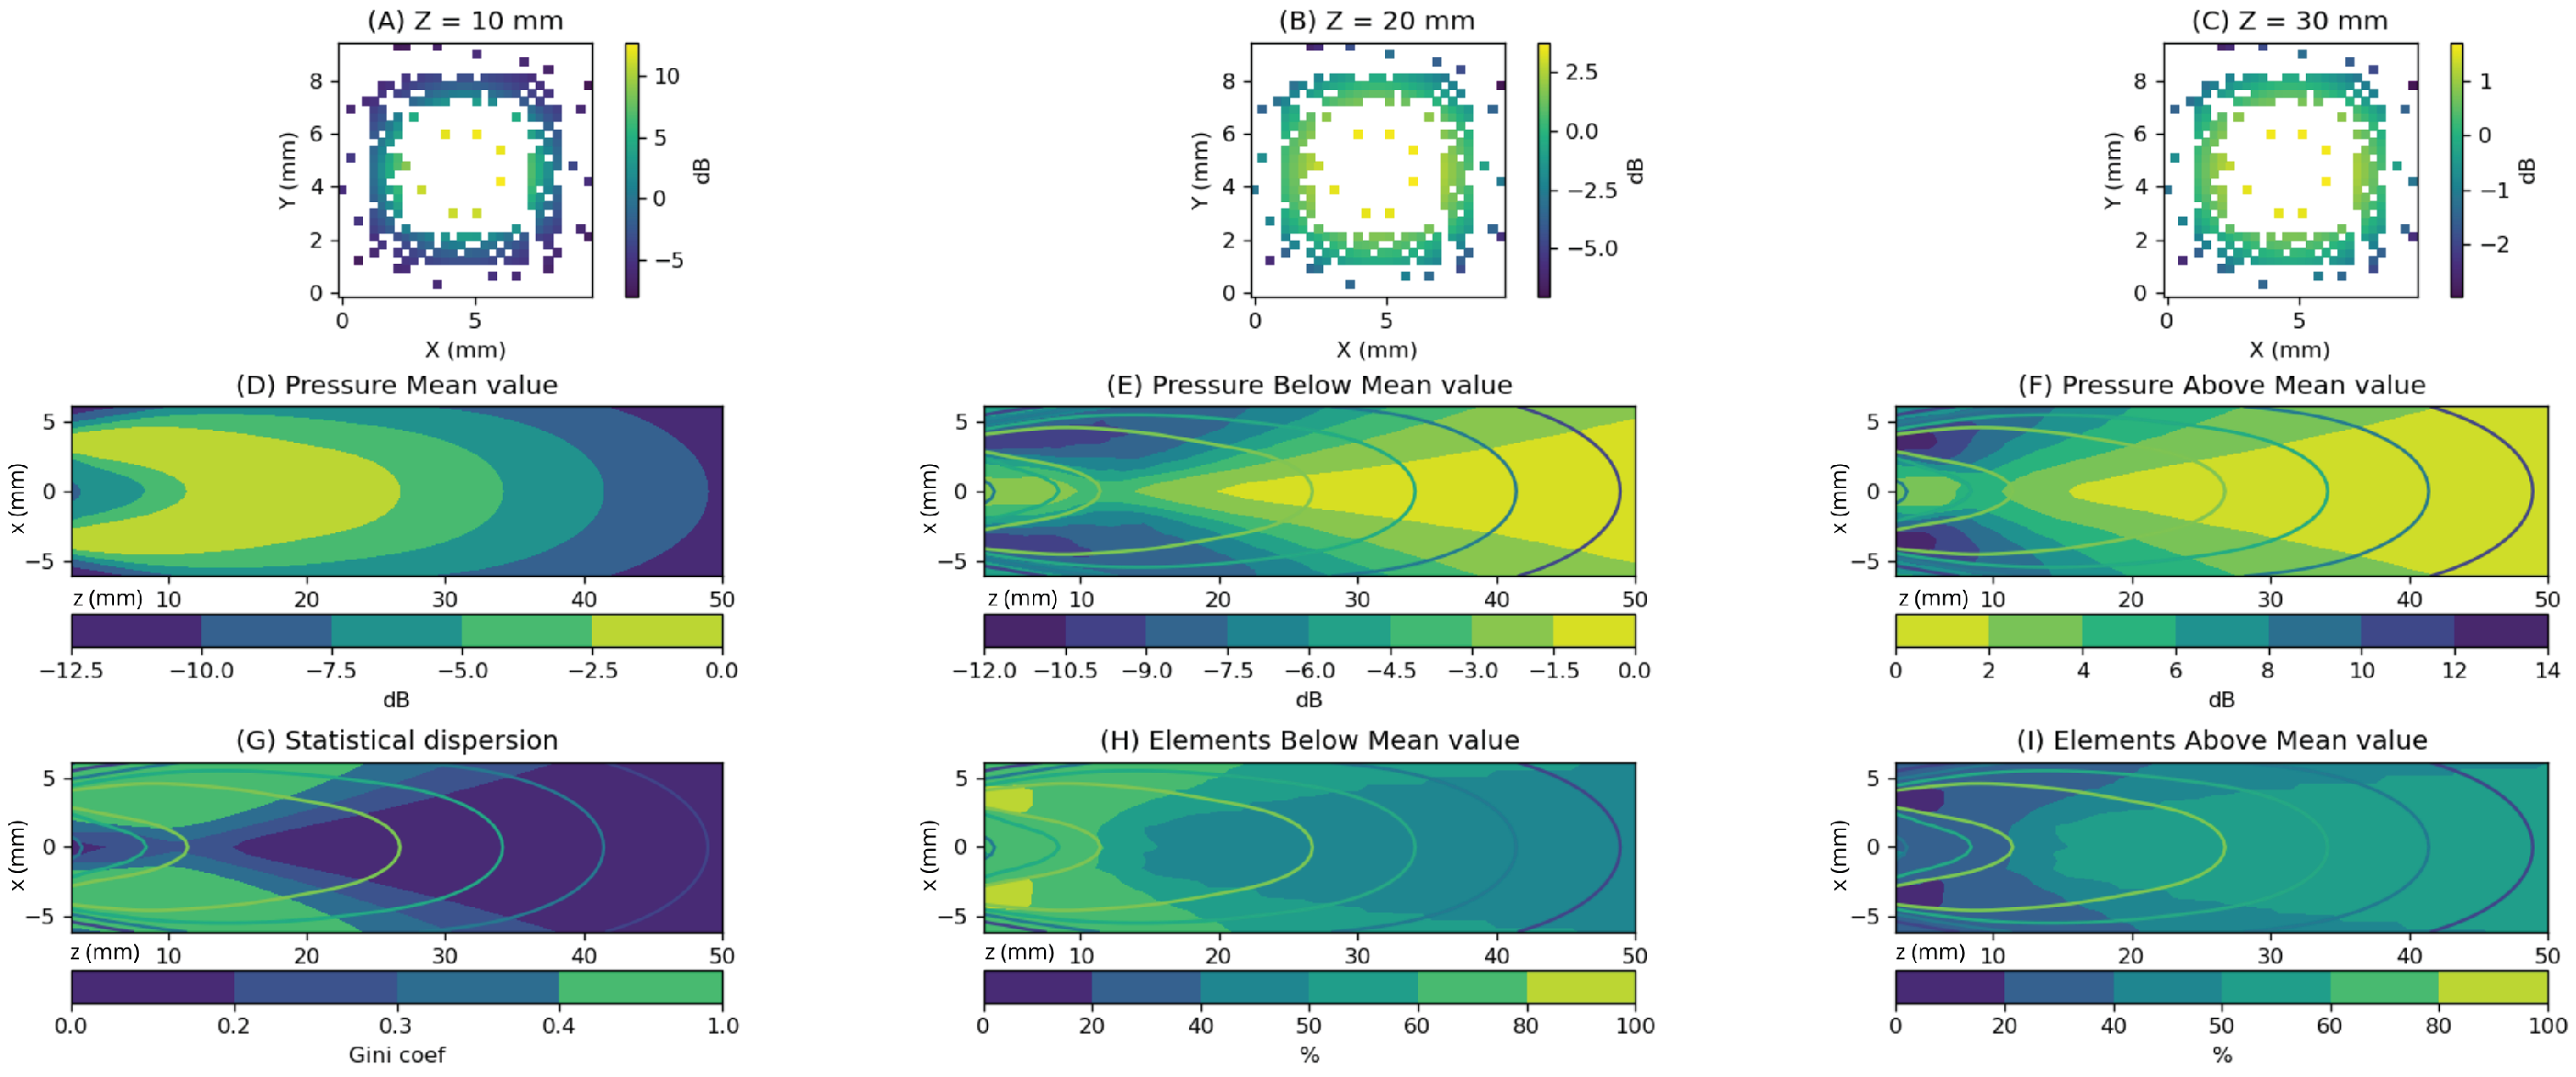
Analysis of the ring-shaped apodized aperture at different points in space; we considered the region and . (A–C) Show the amplitude with which the aperture elements influence three points along the axis at depths of (A) , (B) , and (C) . Taking the mean value as a reference, we observe differences ranging from up to 15 dB in (A) to around 4 dB in (C). (D) Shows the average gain level exerted at each point in the plane. The values in (E) represent the level reached by elements below the mean, while (F) shows the values above it. In (G), we present the statistical dispersion of these values, calculated using the Gini coefficient. (H) Displays the percentage of elements below the mean, and (I) shows the percentage above the mean.
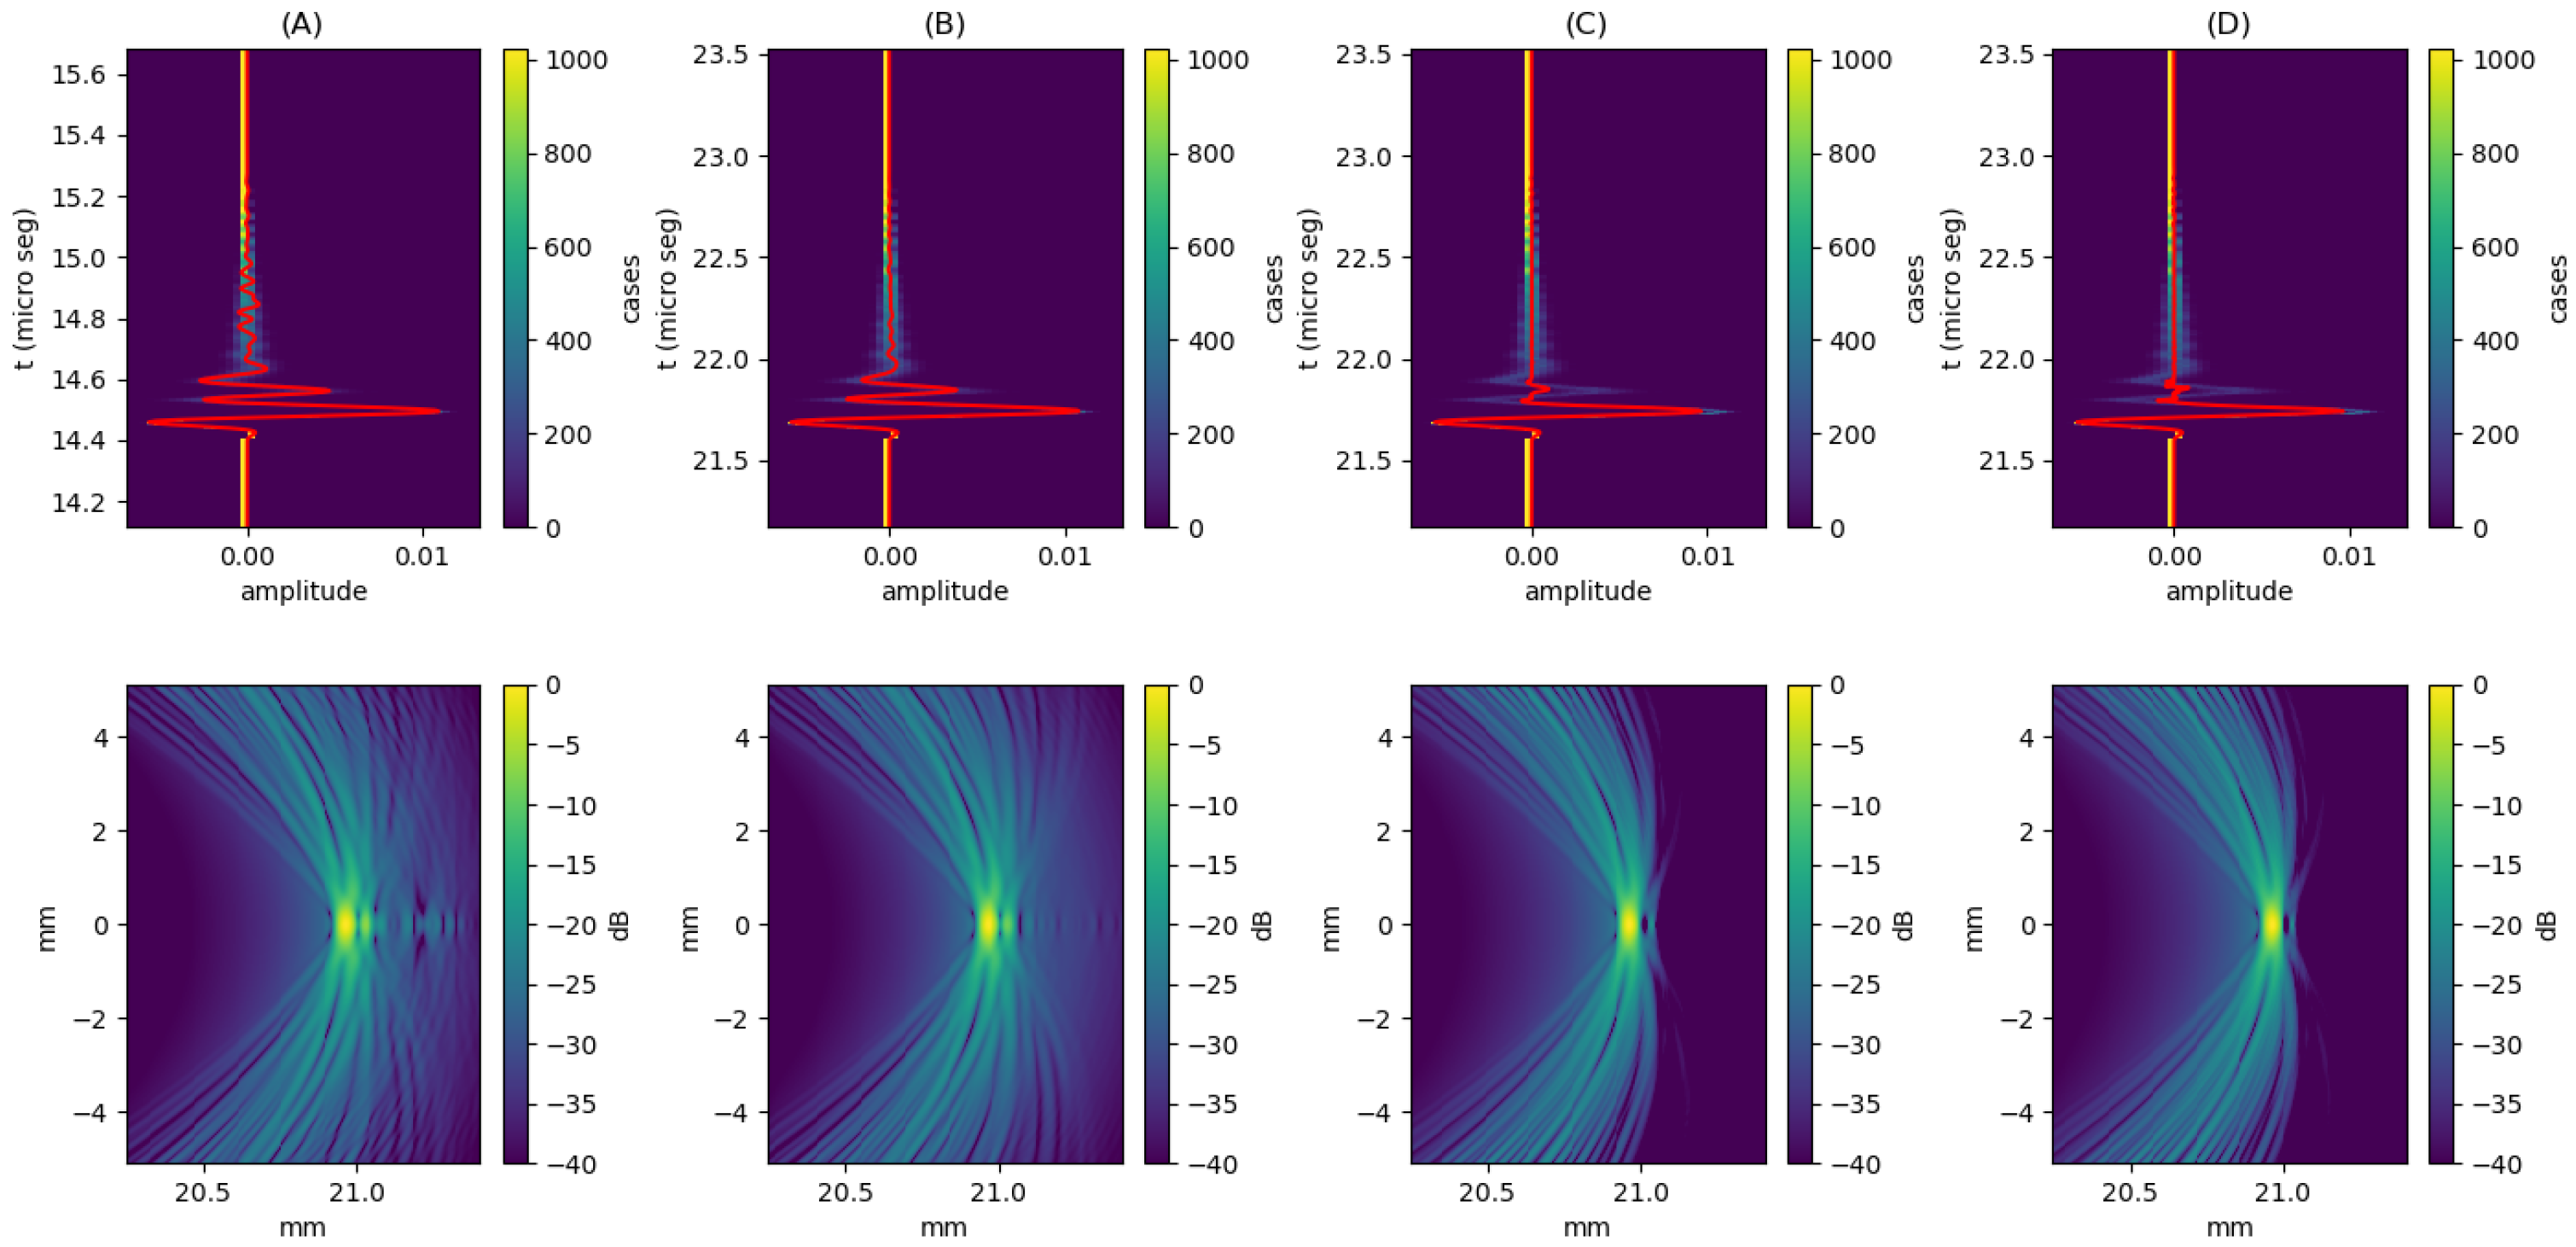
Figure 13.
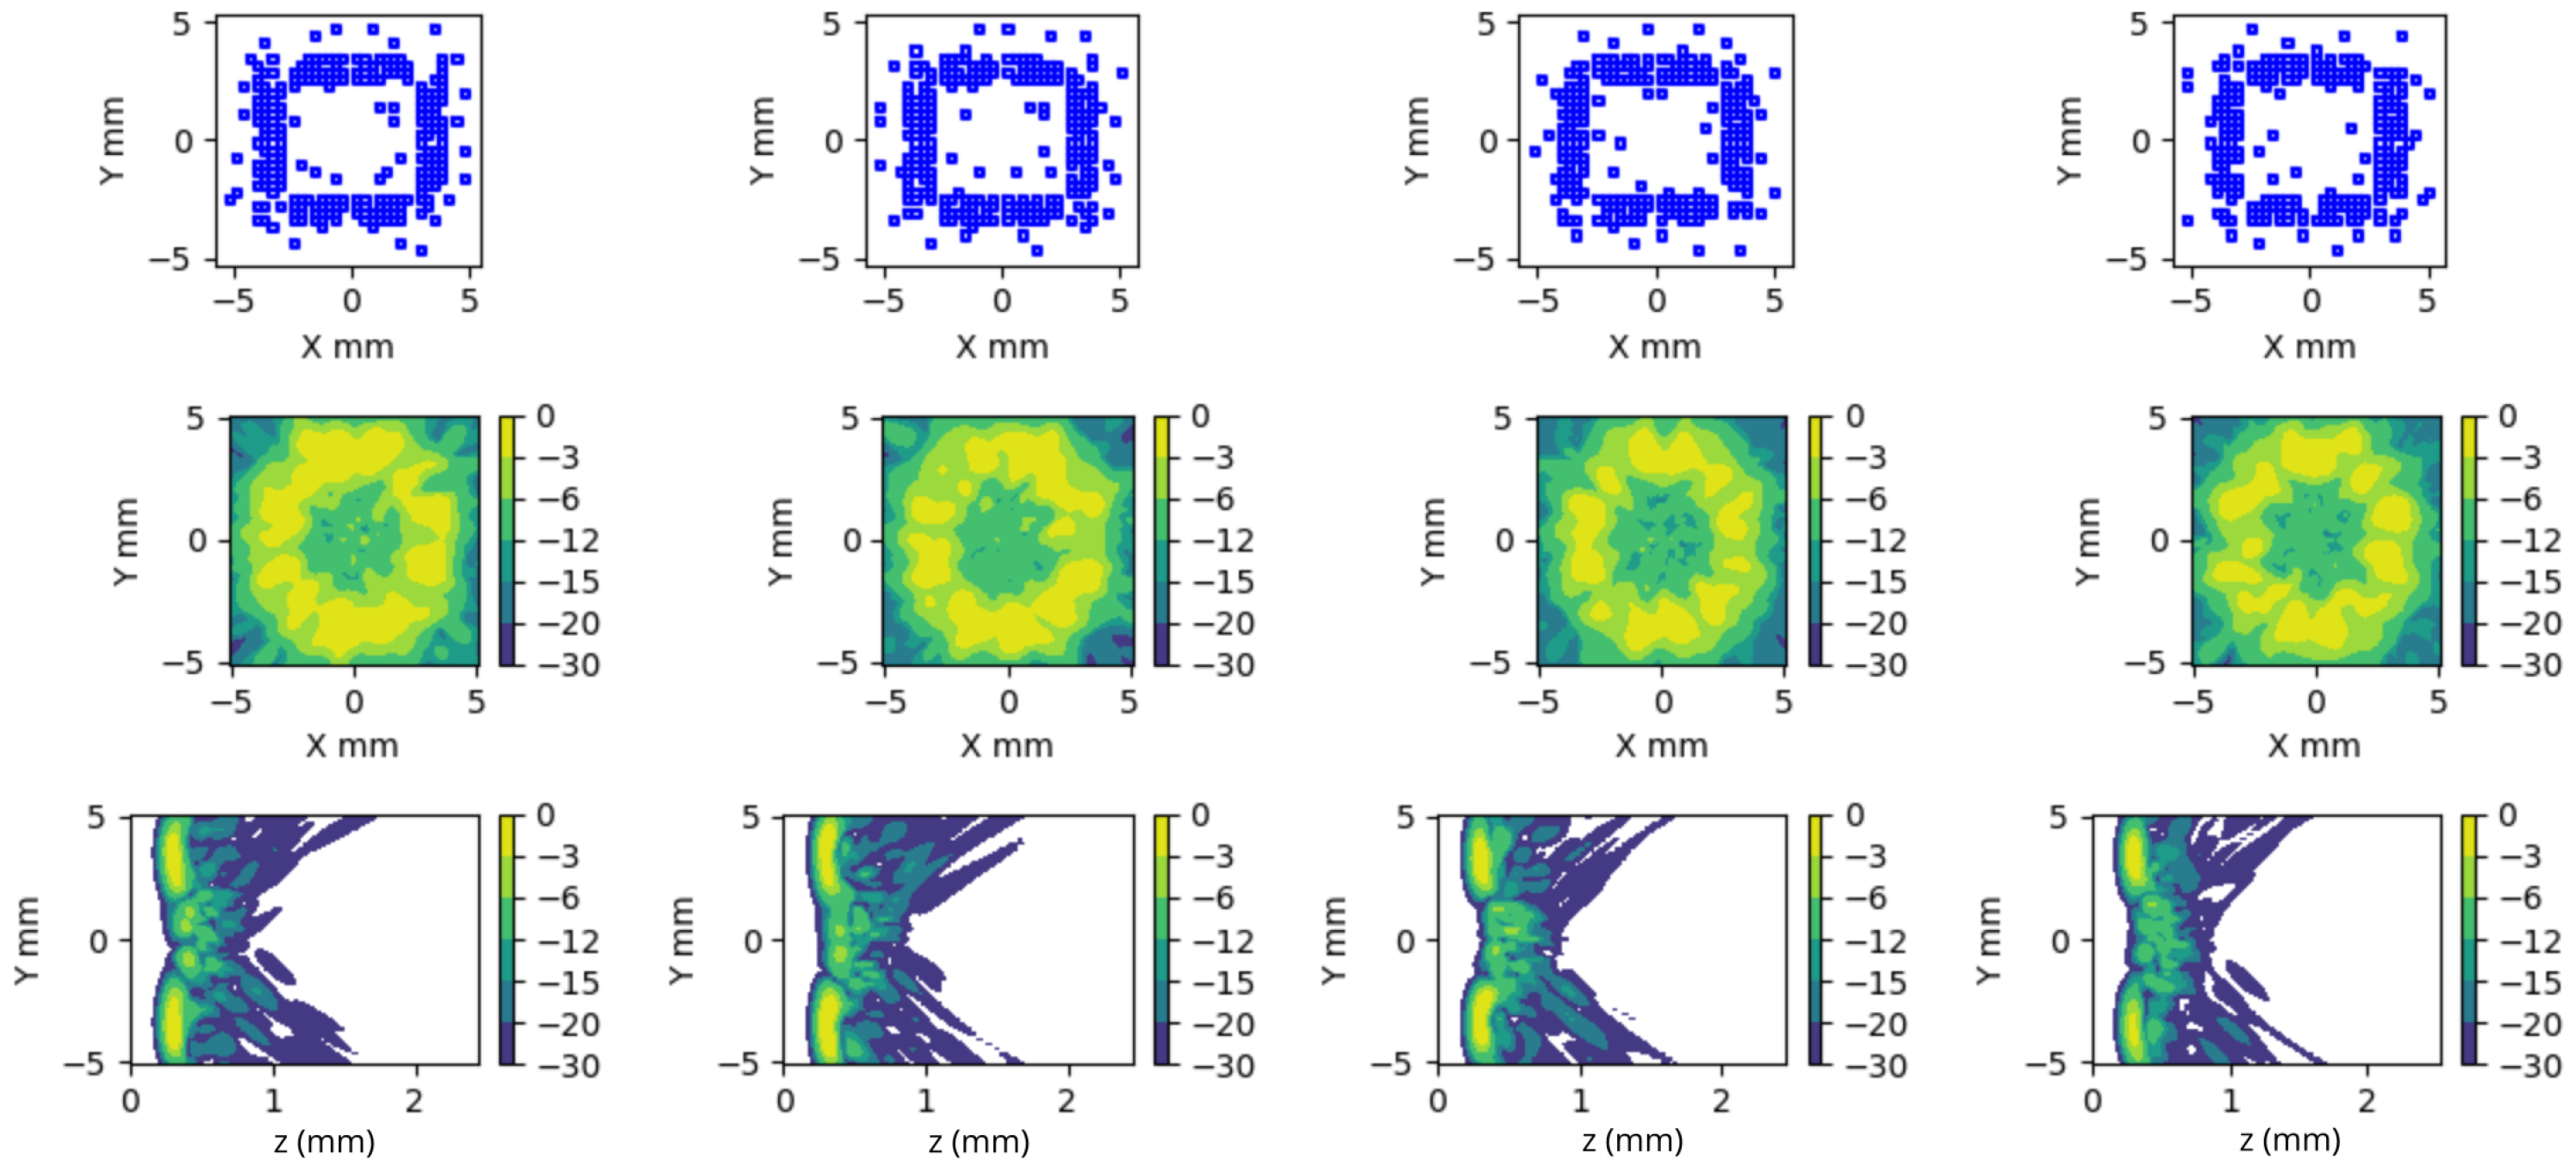
This figure presents four cases of ring-shaped apodization realizations. In each column, we show the aperture, the generated field at Z = 30 mm within the aperture’s projection zone, and the envelope of the wavefront produced by a plane wave emission.
Figure 13.
This figure presents four cases of ring-shaped apodization realizations. In each column, we show the aperture, the generated field at Z = 30 mm within the aperture’s projection zone, and the envelope of the wavefront produced by a plane wave emission.
Figure 14.
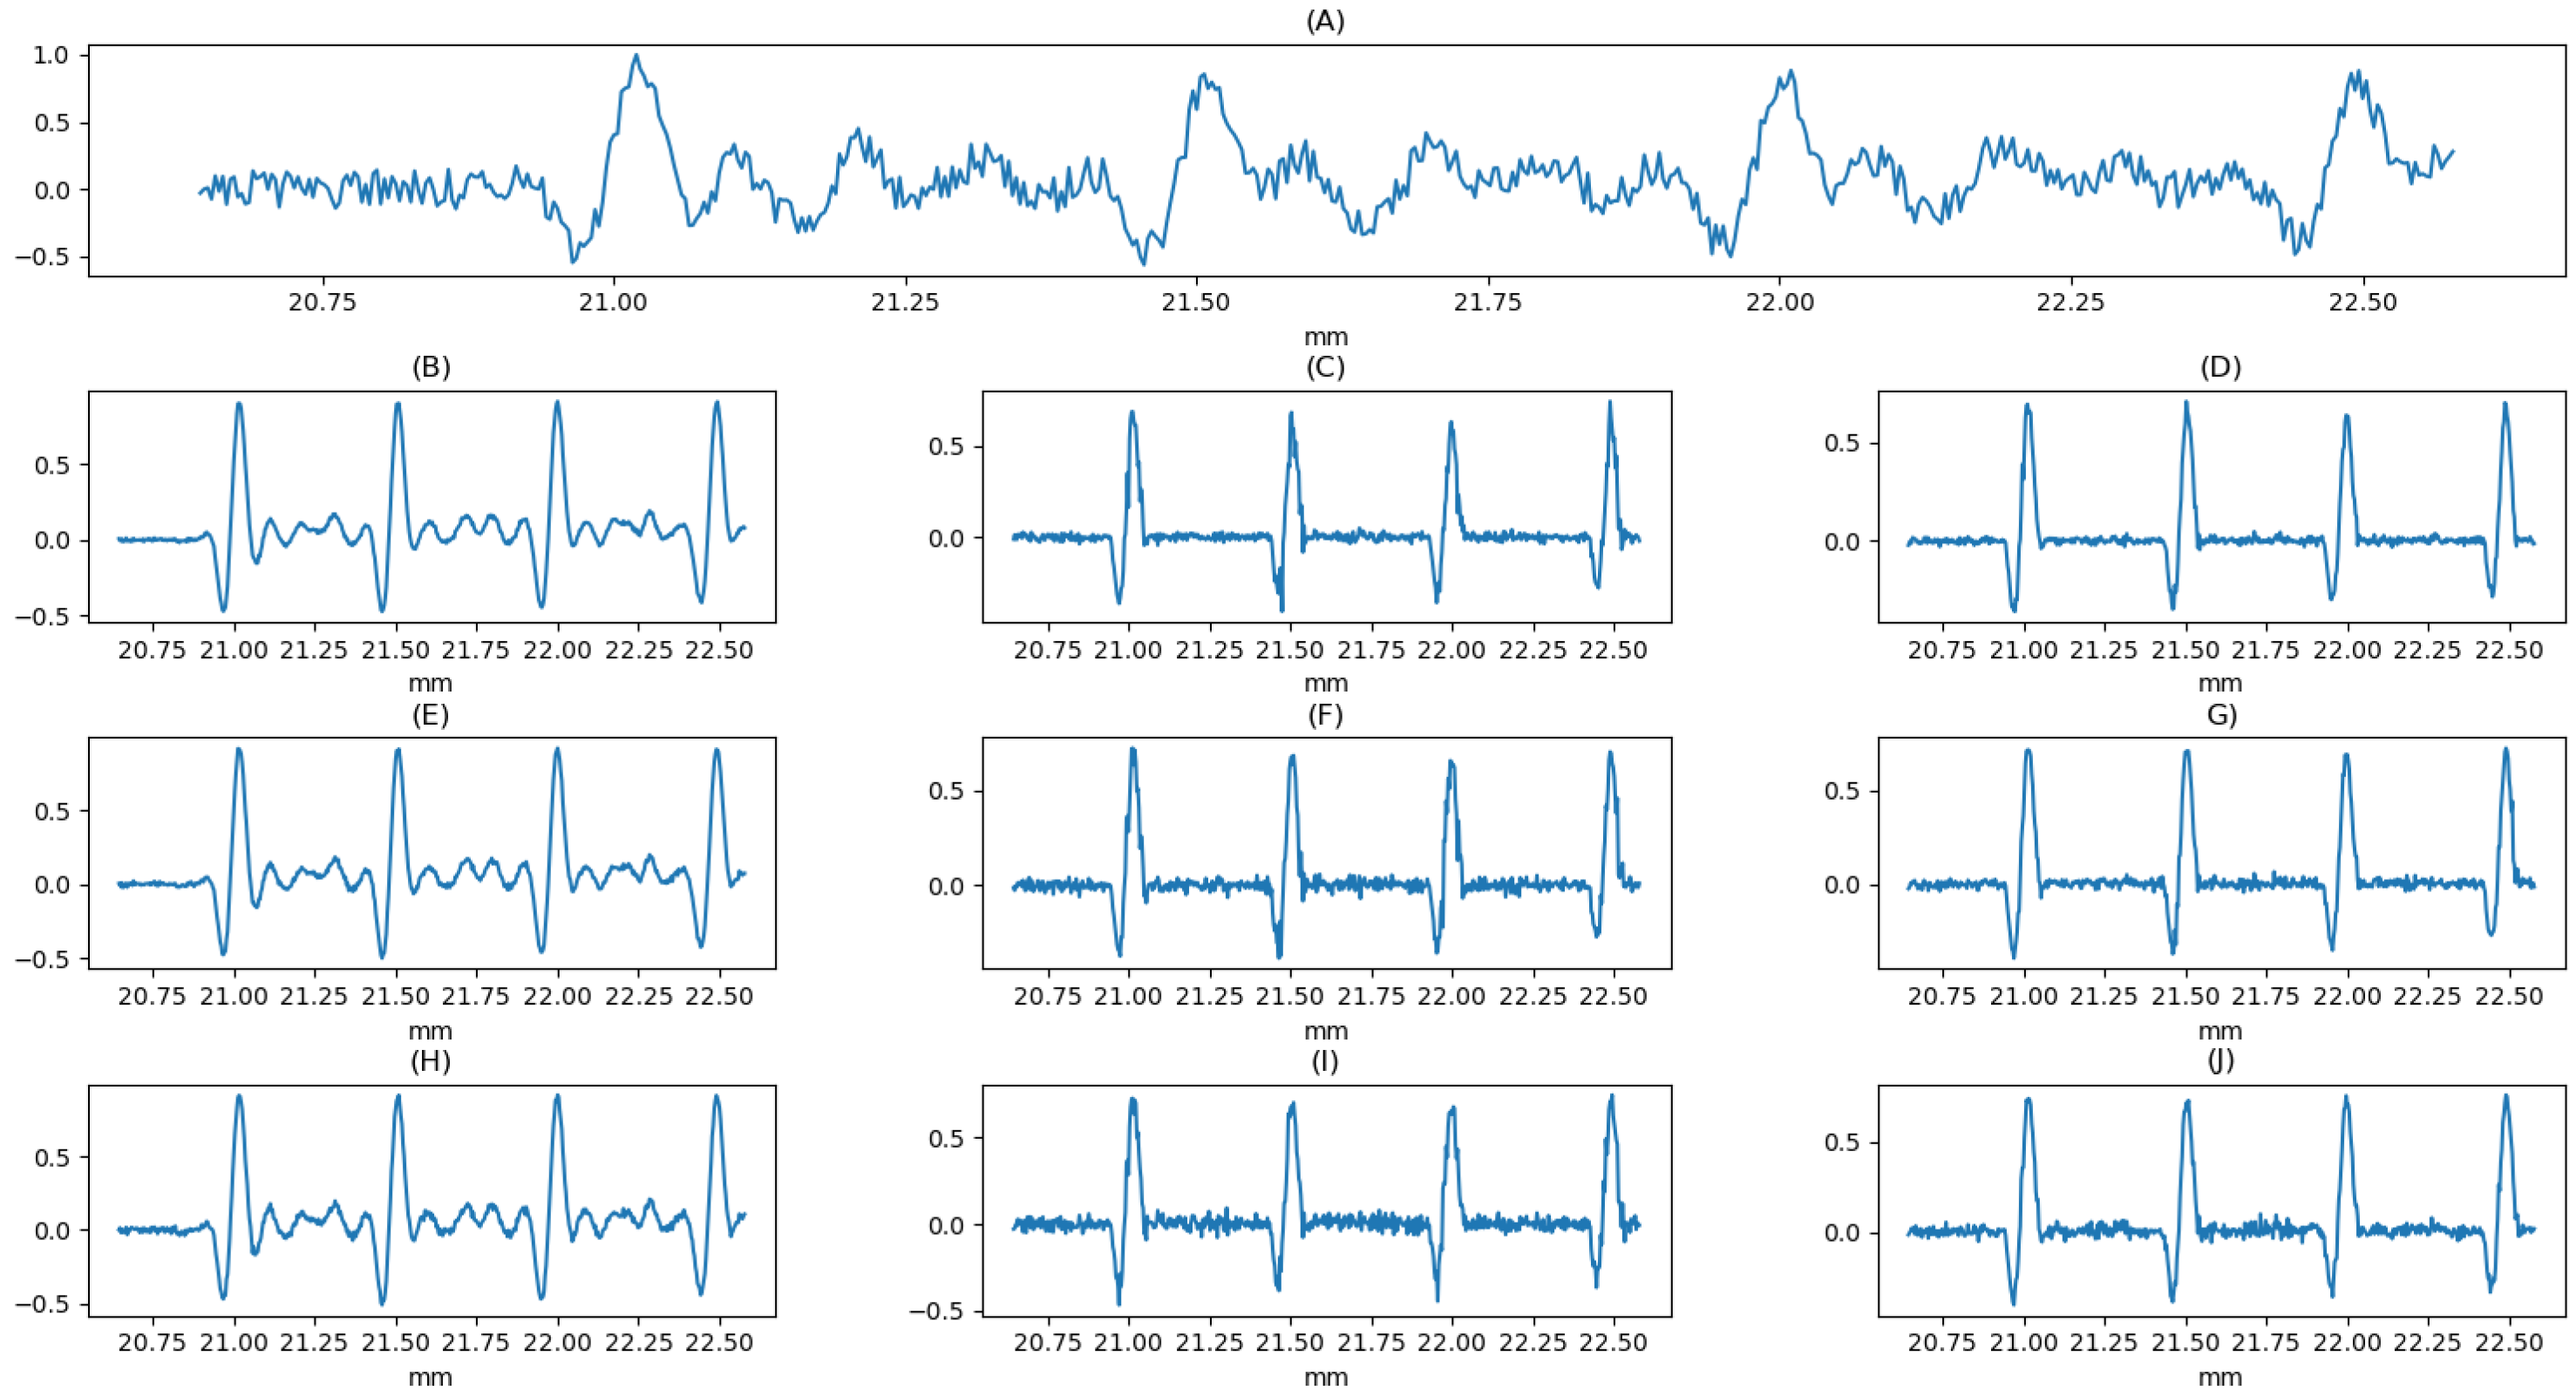
The figure shows the signal received by an element located at position , corresponding to a plane wave emission performed using a series of random apertures defined according to a ring-shaped apodization. The simulation includes attenuation caused by coupling, and 20 dB of noise has been added relative to the echo with the highest gain. In (A), the signal obtained from a single shot is shown. (B–D) Correspond to 128 shots and represent, respectively, the mean, the minimum, and the mean of the four lowest values. (E–G) Correspond to 64 shots and likewise represent the mean, the minimum, and the mean of the four lowest values. (H–J) Correspond to 32 shots and again represent the mean, the minimum, and the mean of the four lowest values.
Figure 15.
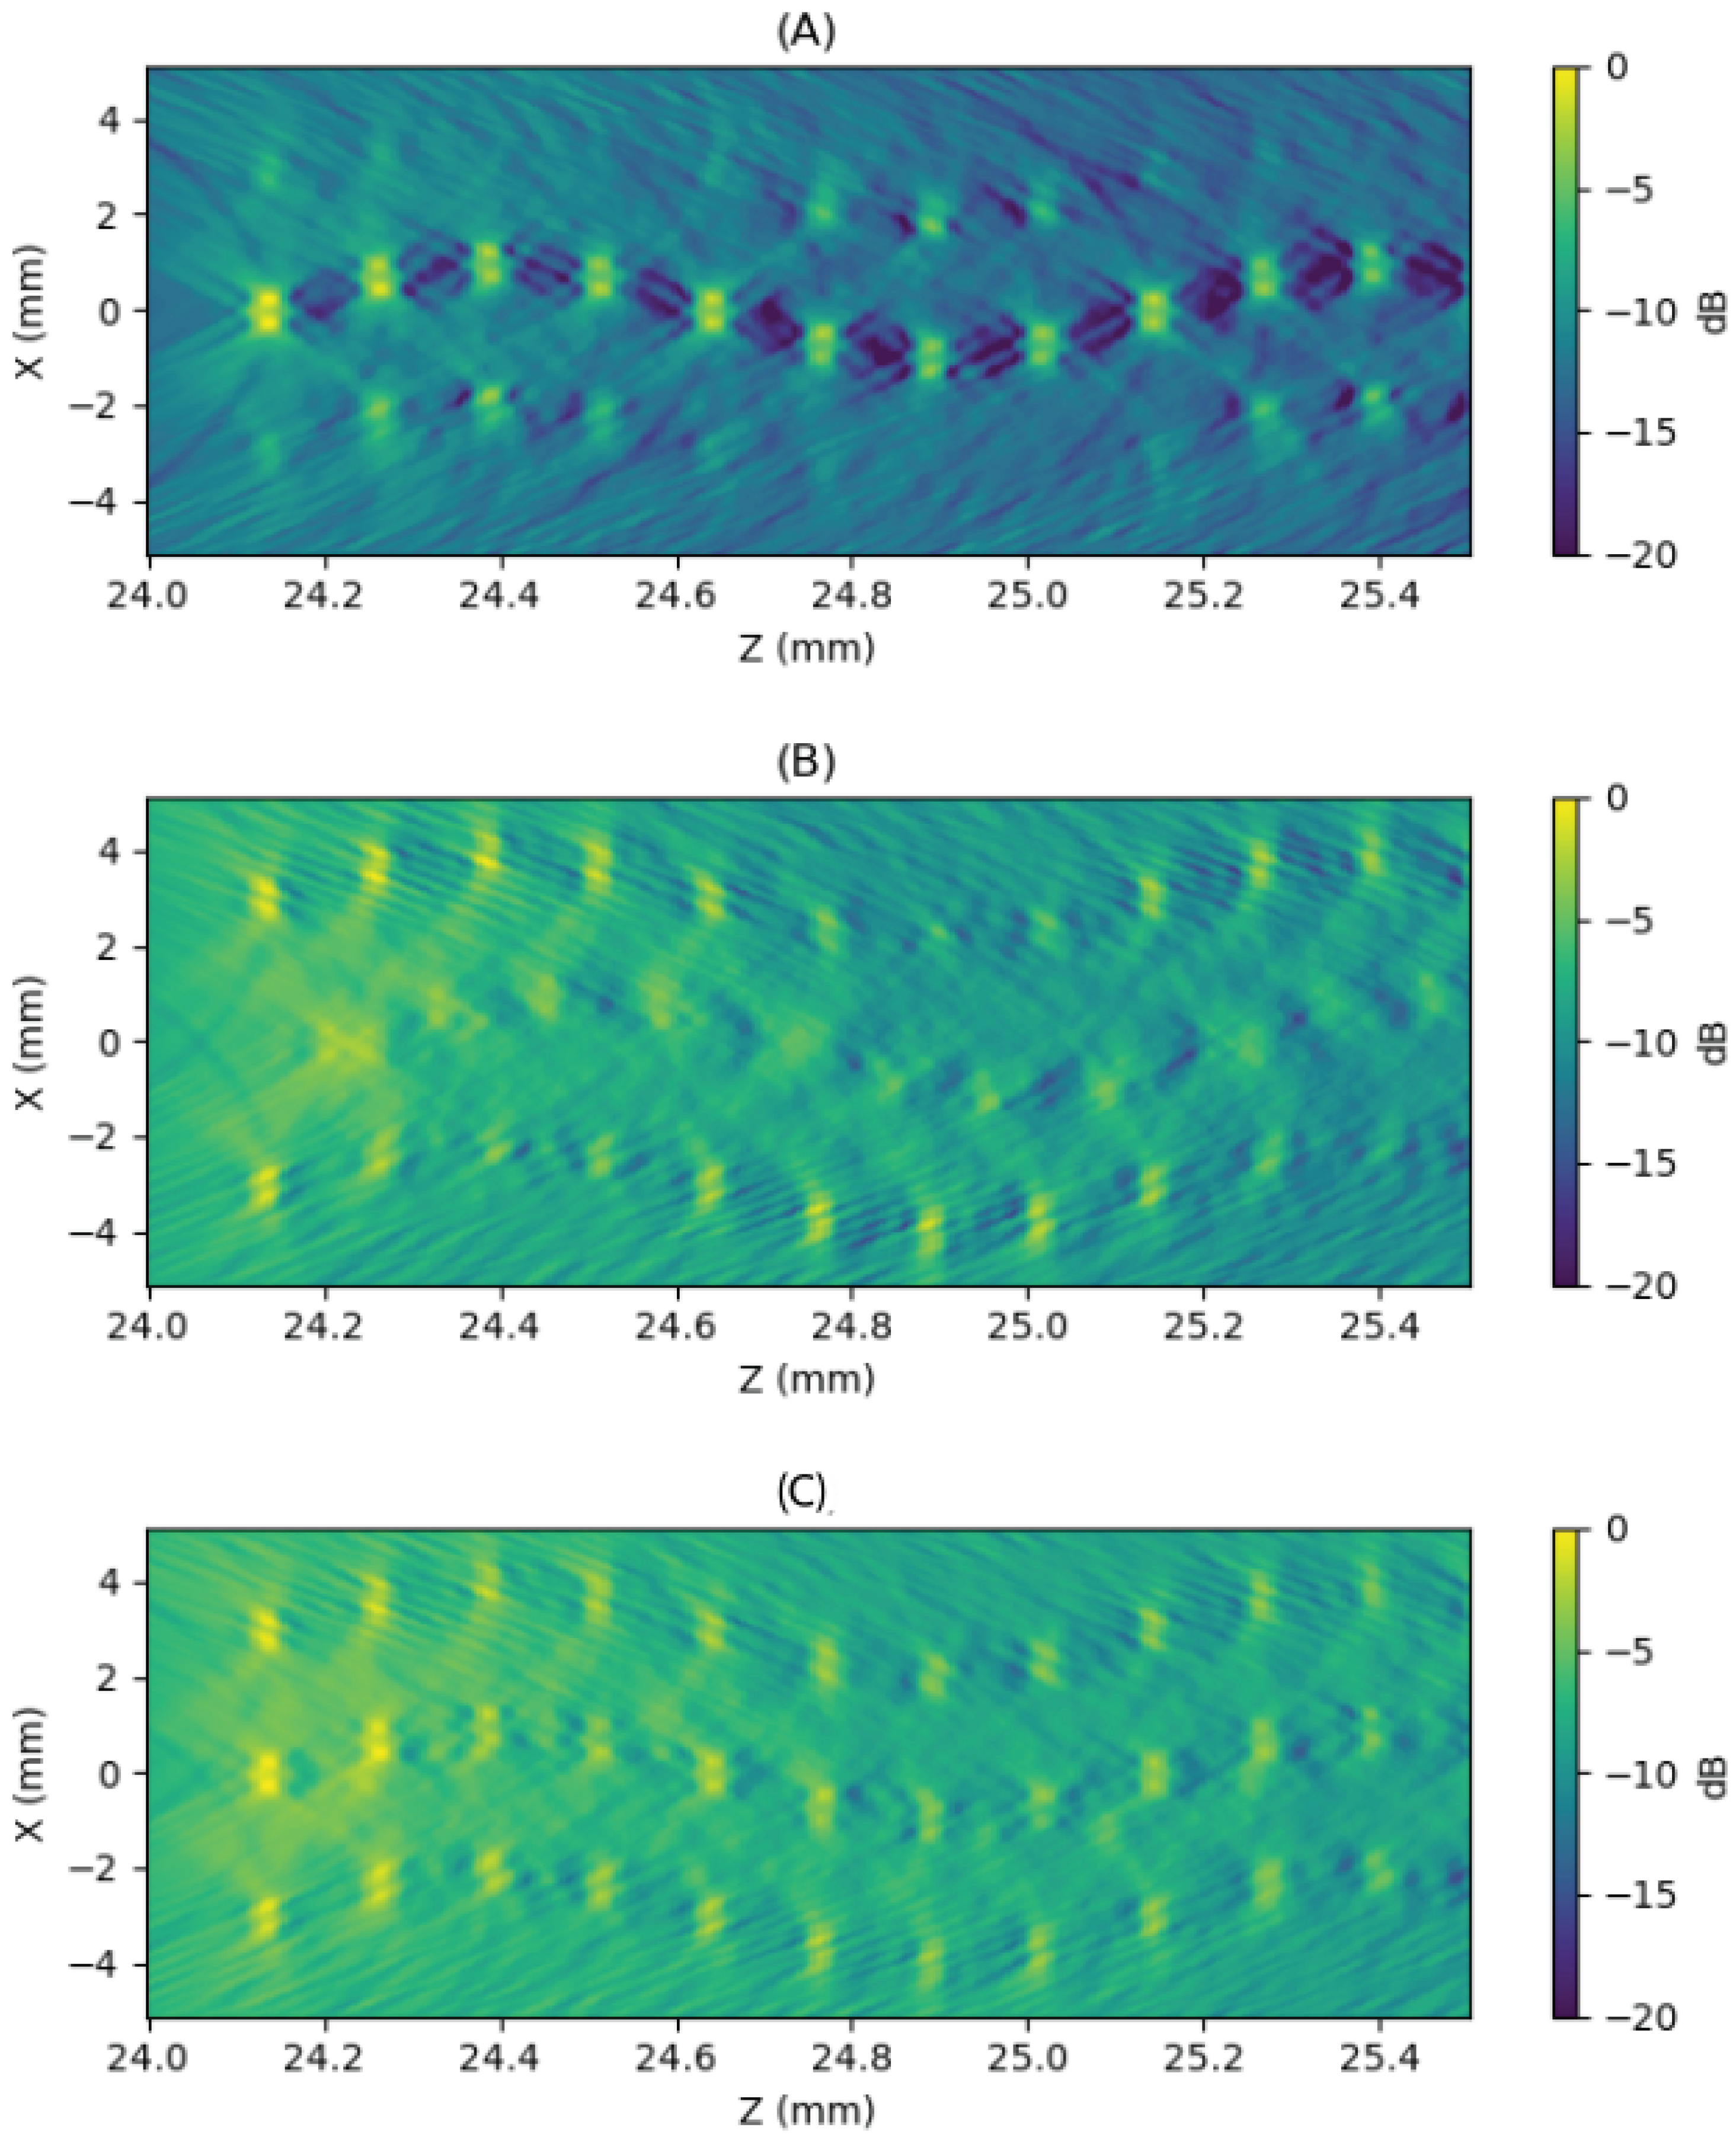
The figure shows how the two emission modes complement each other in a plane wave emission with a deflection angle of . (A) Displays the field generated by a Taylor apodization. (B) Shows the field generated by a ring-shaped aperture. (C) Presents the average of both fields. Although they complement each other well, a drop of approximately 10 dB is observed between the Taylor apodization (original line) and the ring-shaped apodization (blue line).
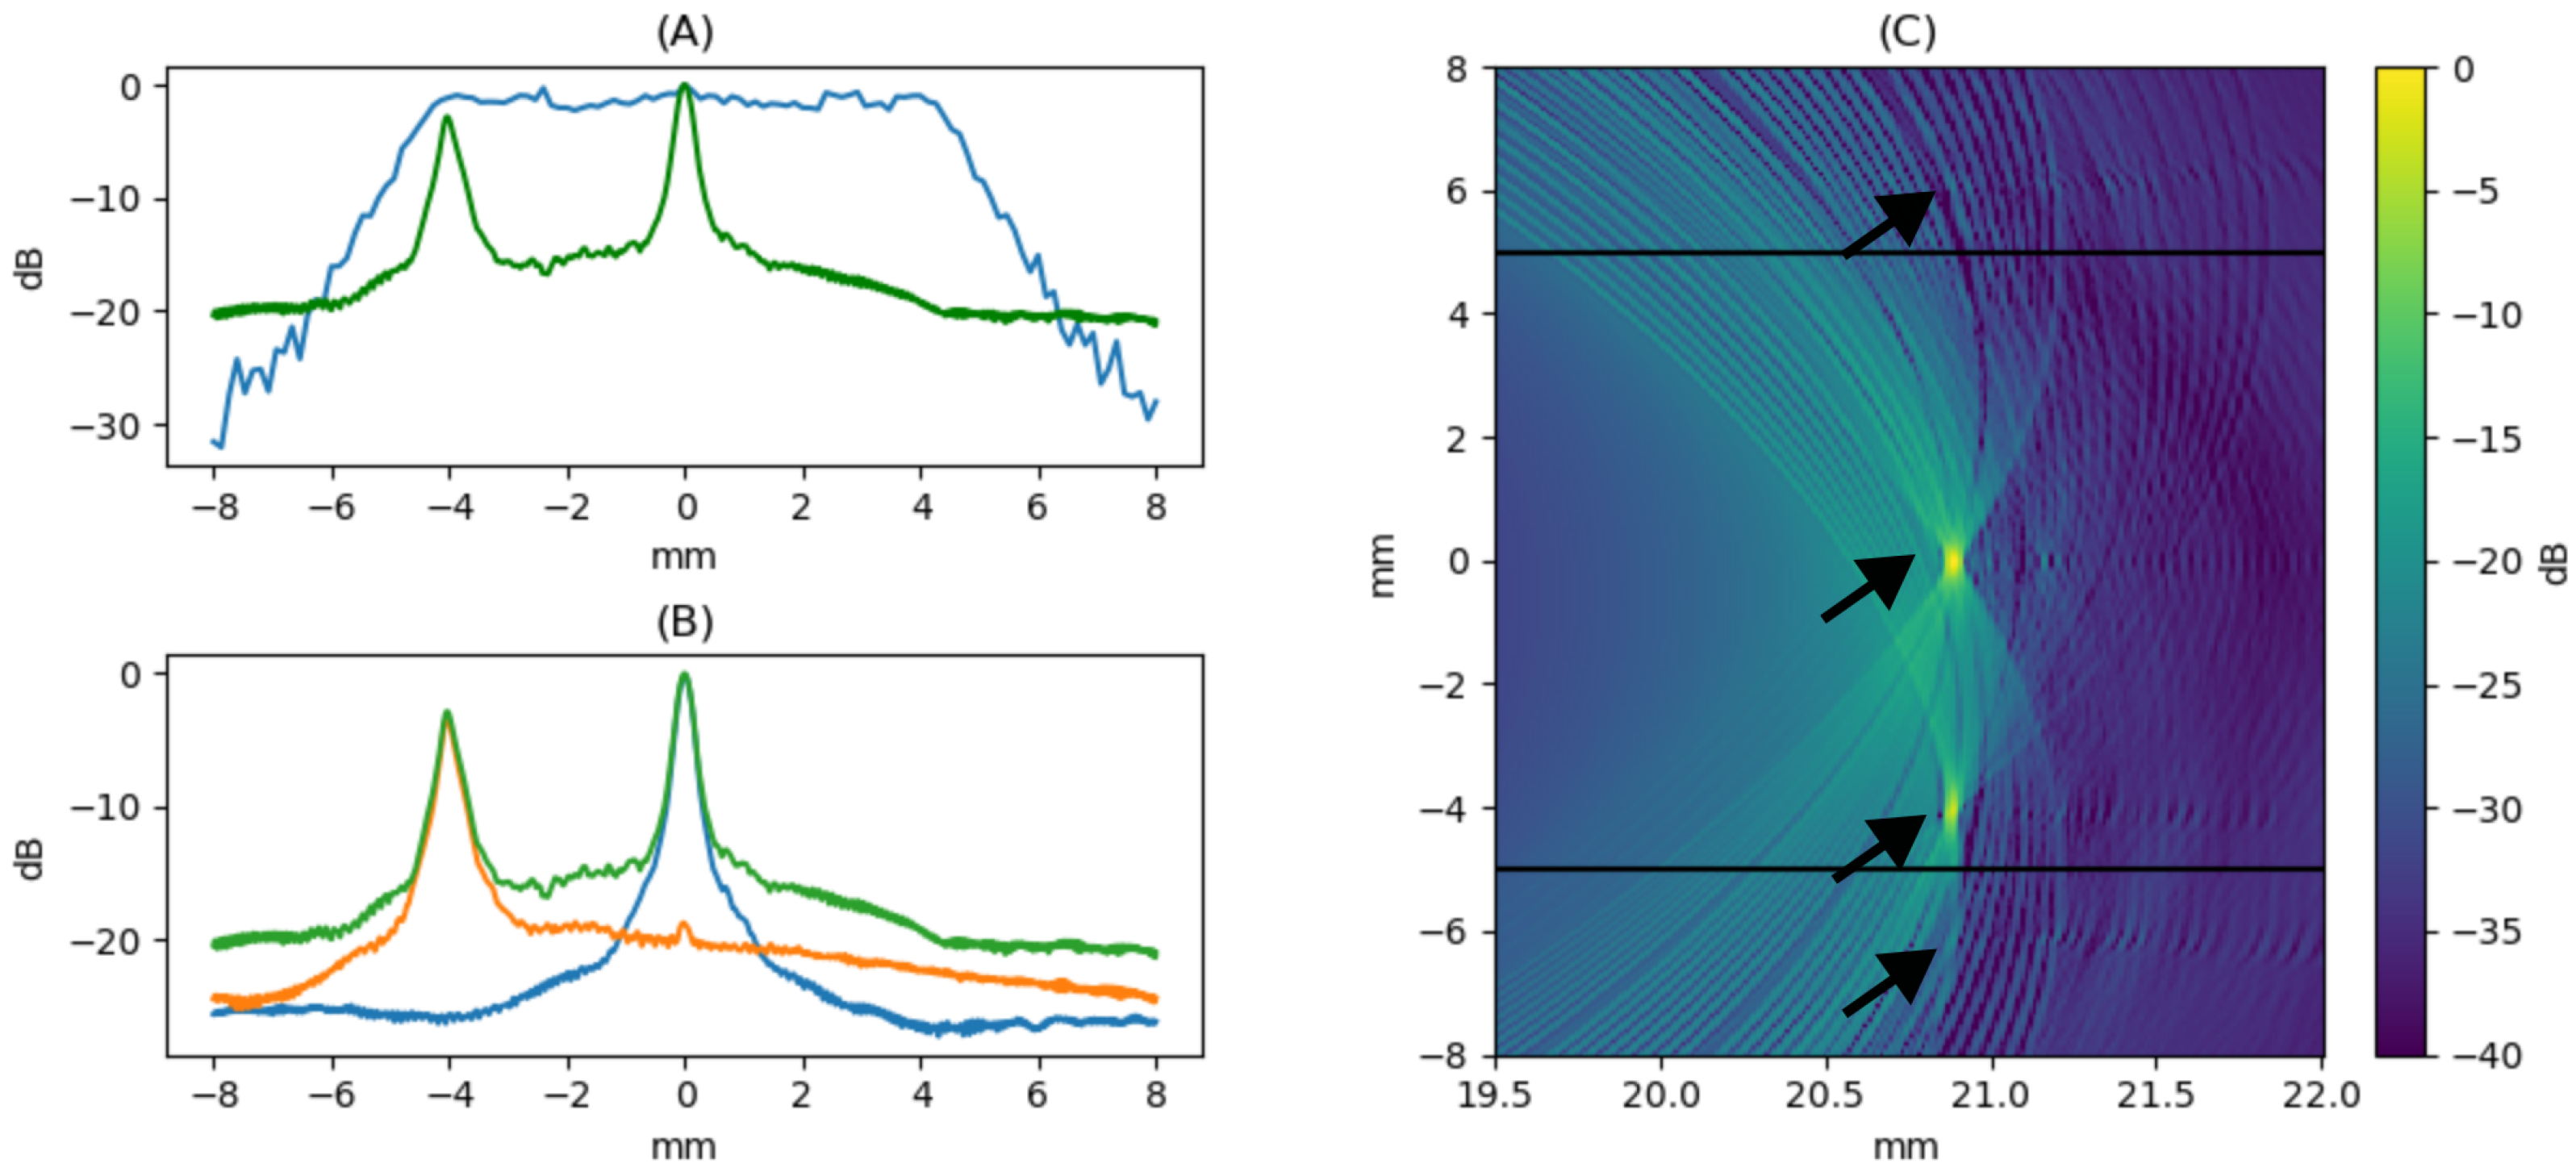
Figure 16.
Visualization. of the combined insonification strategy. (A) Viewing area curve at , showing arraycoverage of with a 1 dB ripple and 9 dB drop at 5 mm from the center (blue line). (B) Based on the average of the four lowest-amplitude acquisitions over 128 emissions, beamforming results using ring-apodized signal (red), Taylor-apodized signal (blue), and combined signal (green, also in (A)). (C) Final reconstructed image showing target visibility across regions. The positions of the reflectors are indicated with arrows.
Figure 17.
For a scenario in which a sequence of reflectors spaced 250 m apart has been placed, (B) was computed using a full aperture from a flat emission. A composite image was also generated from four acquisitions (A-1–A-4), each consisting of eight emissions based on Taylor apodization and processed using minimum absolute techniques (, min-method) (C). (D) Shows a detailed view of the signal obtained at the element located at (0.3, −0.15). The signal corresponding to the full aperture emission is shown in blue, while the one corresponding to the Taylor-apodized and minimum-processed emission is shown in orange.
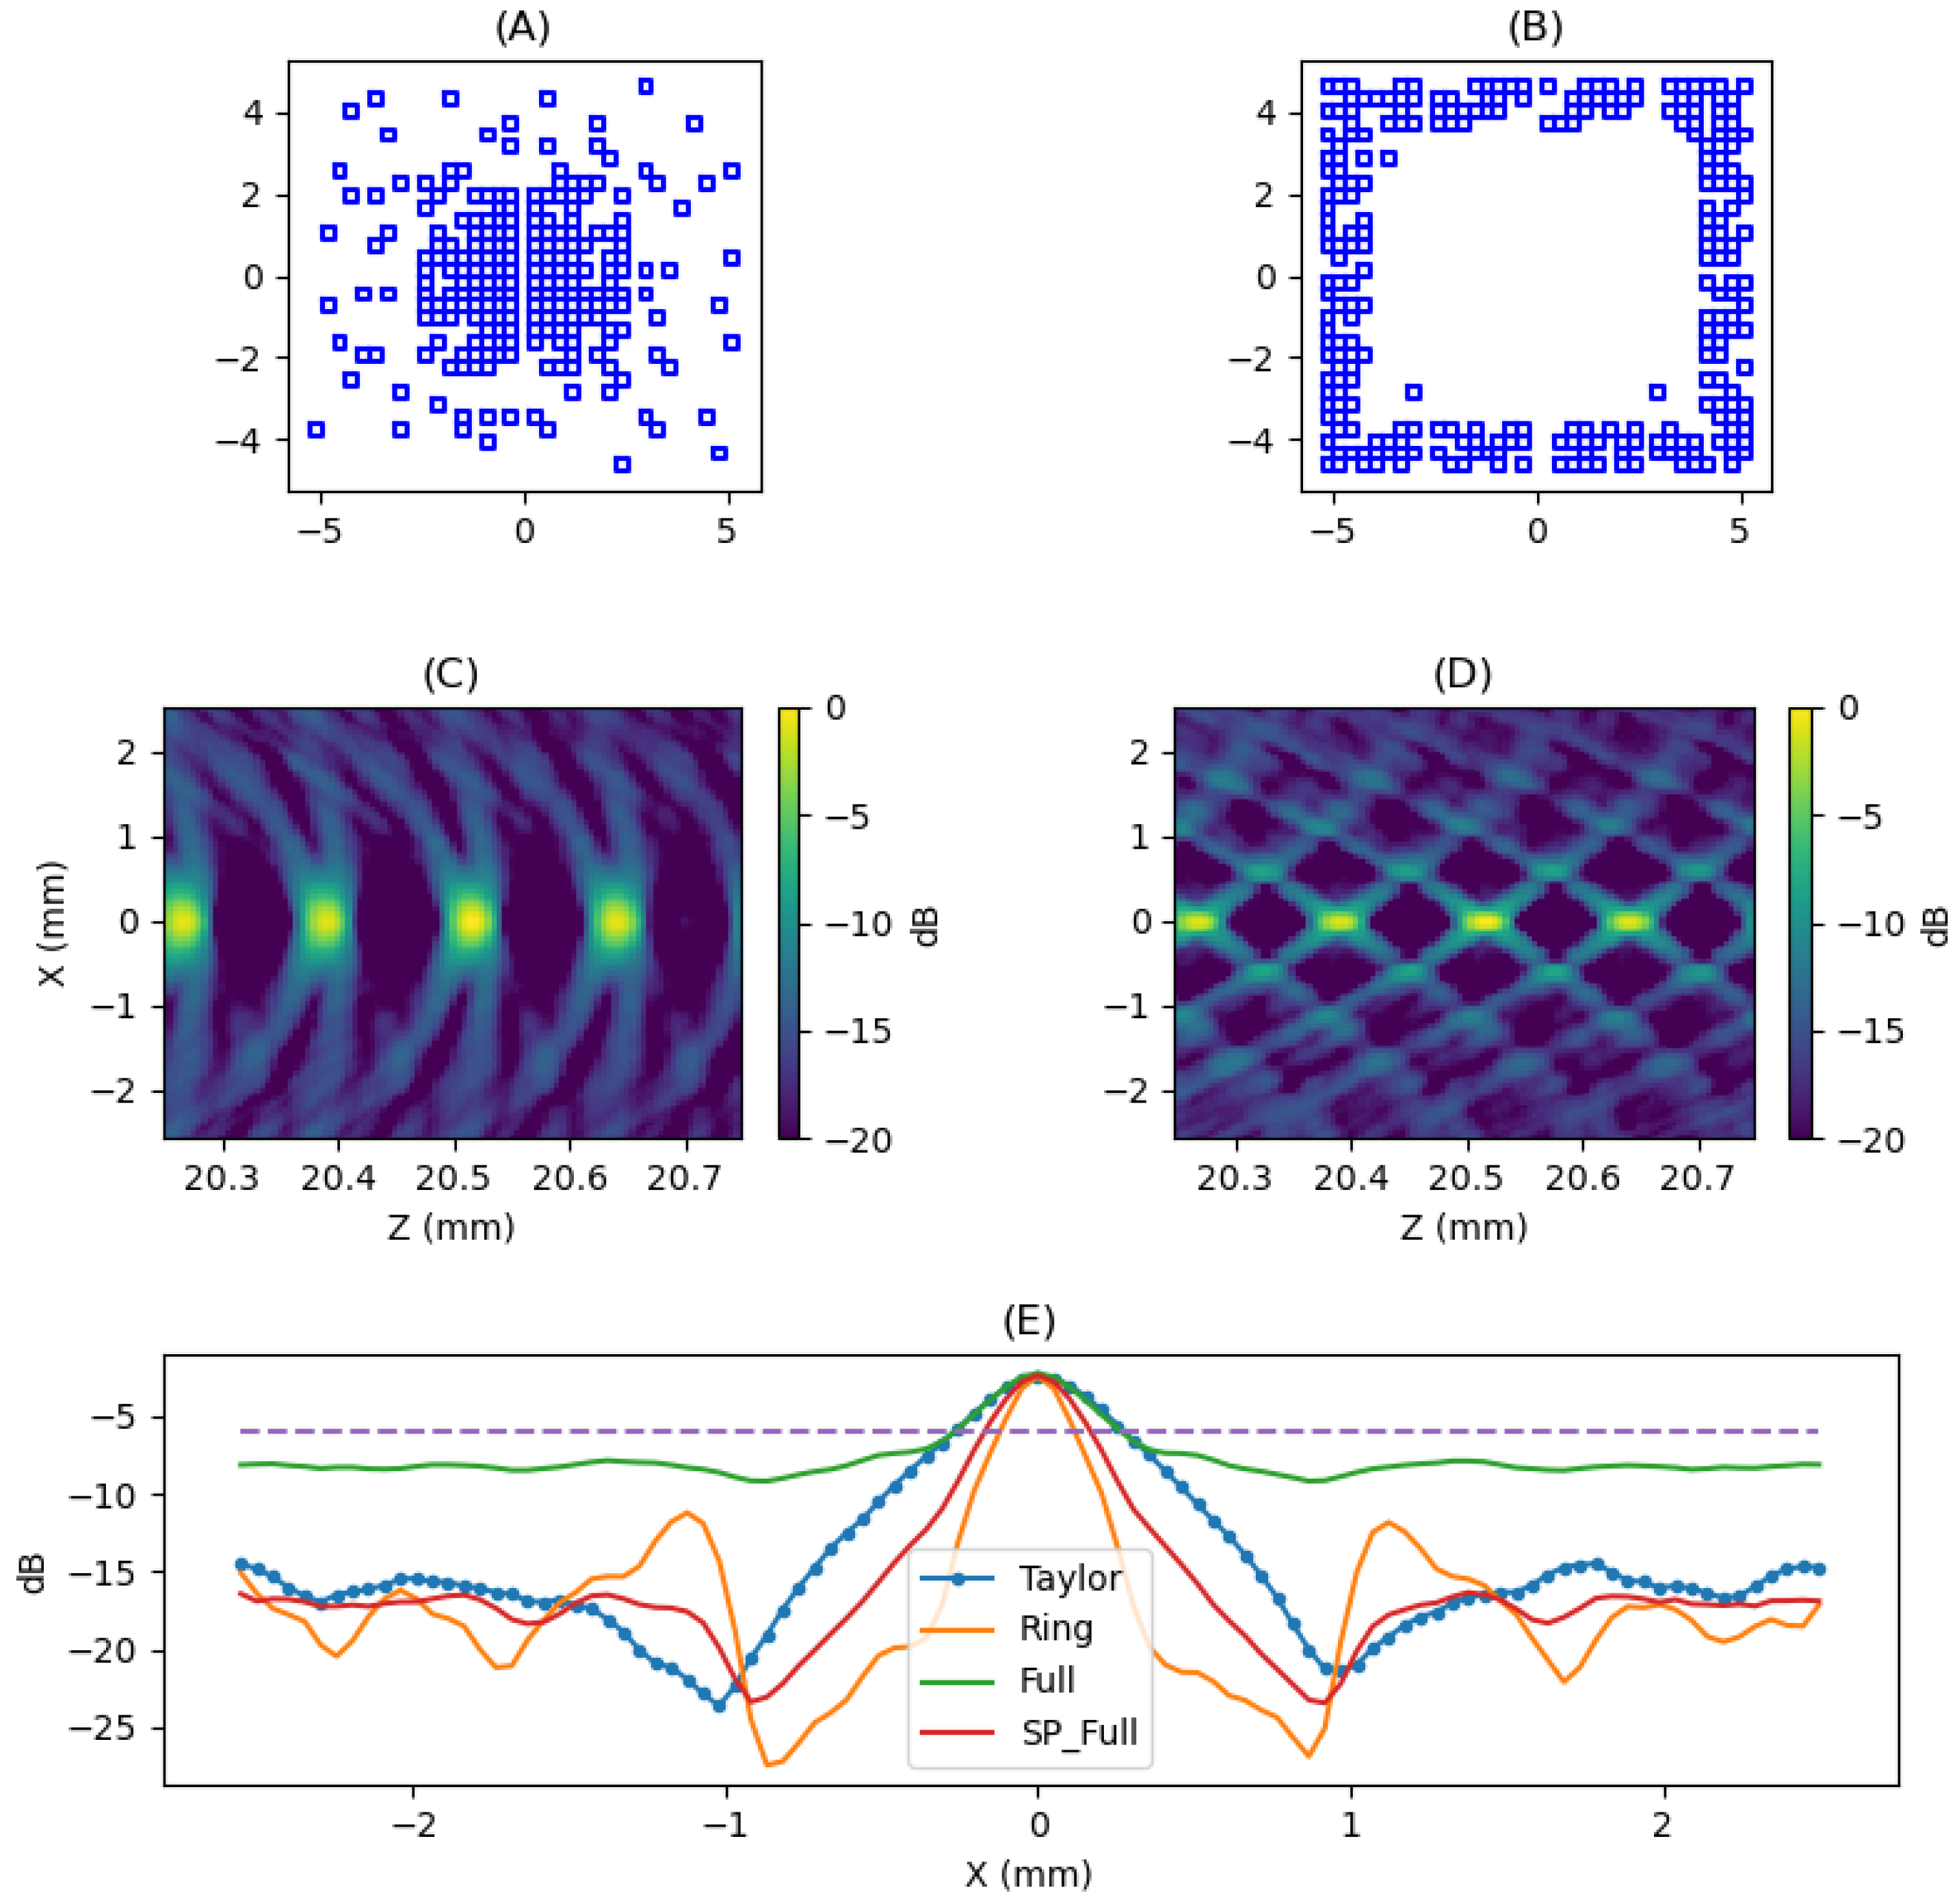
Figure 18.
For the same scenario described in
Figure 17, the image obtained using a reception aperture based on (
A,
C) Taylor apodization and (
B,
D) a ring-shaped aperture mounted on the outer bins is presented. (
E) Displays the lateral profile of the four reception configurations over the target at
. The −6 dB threshold (purple dash line) serves as a criterion for lateral resolution.
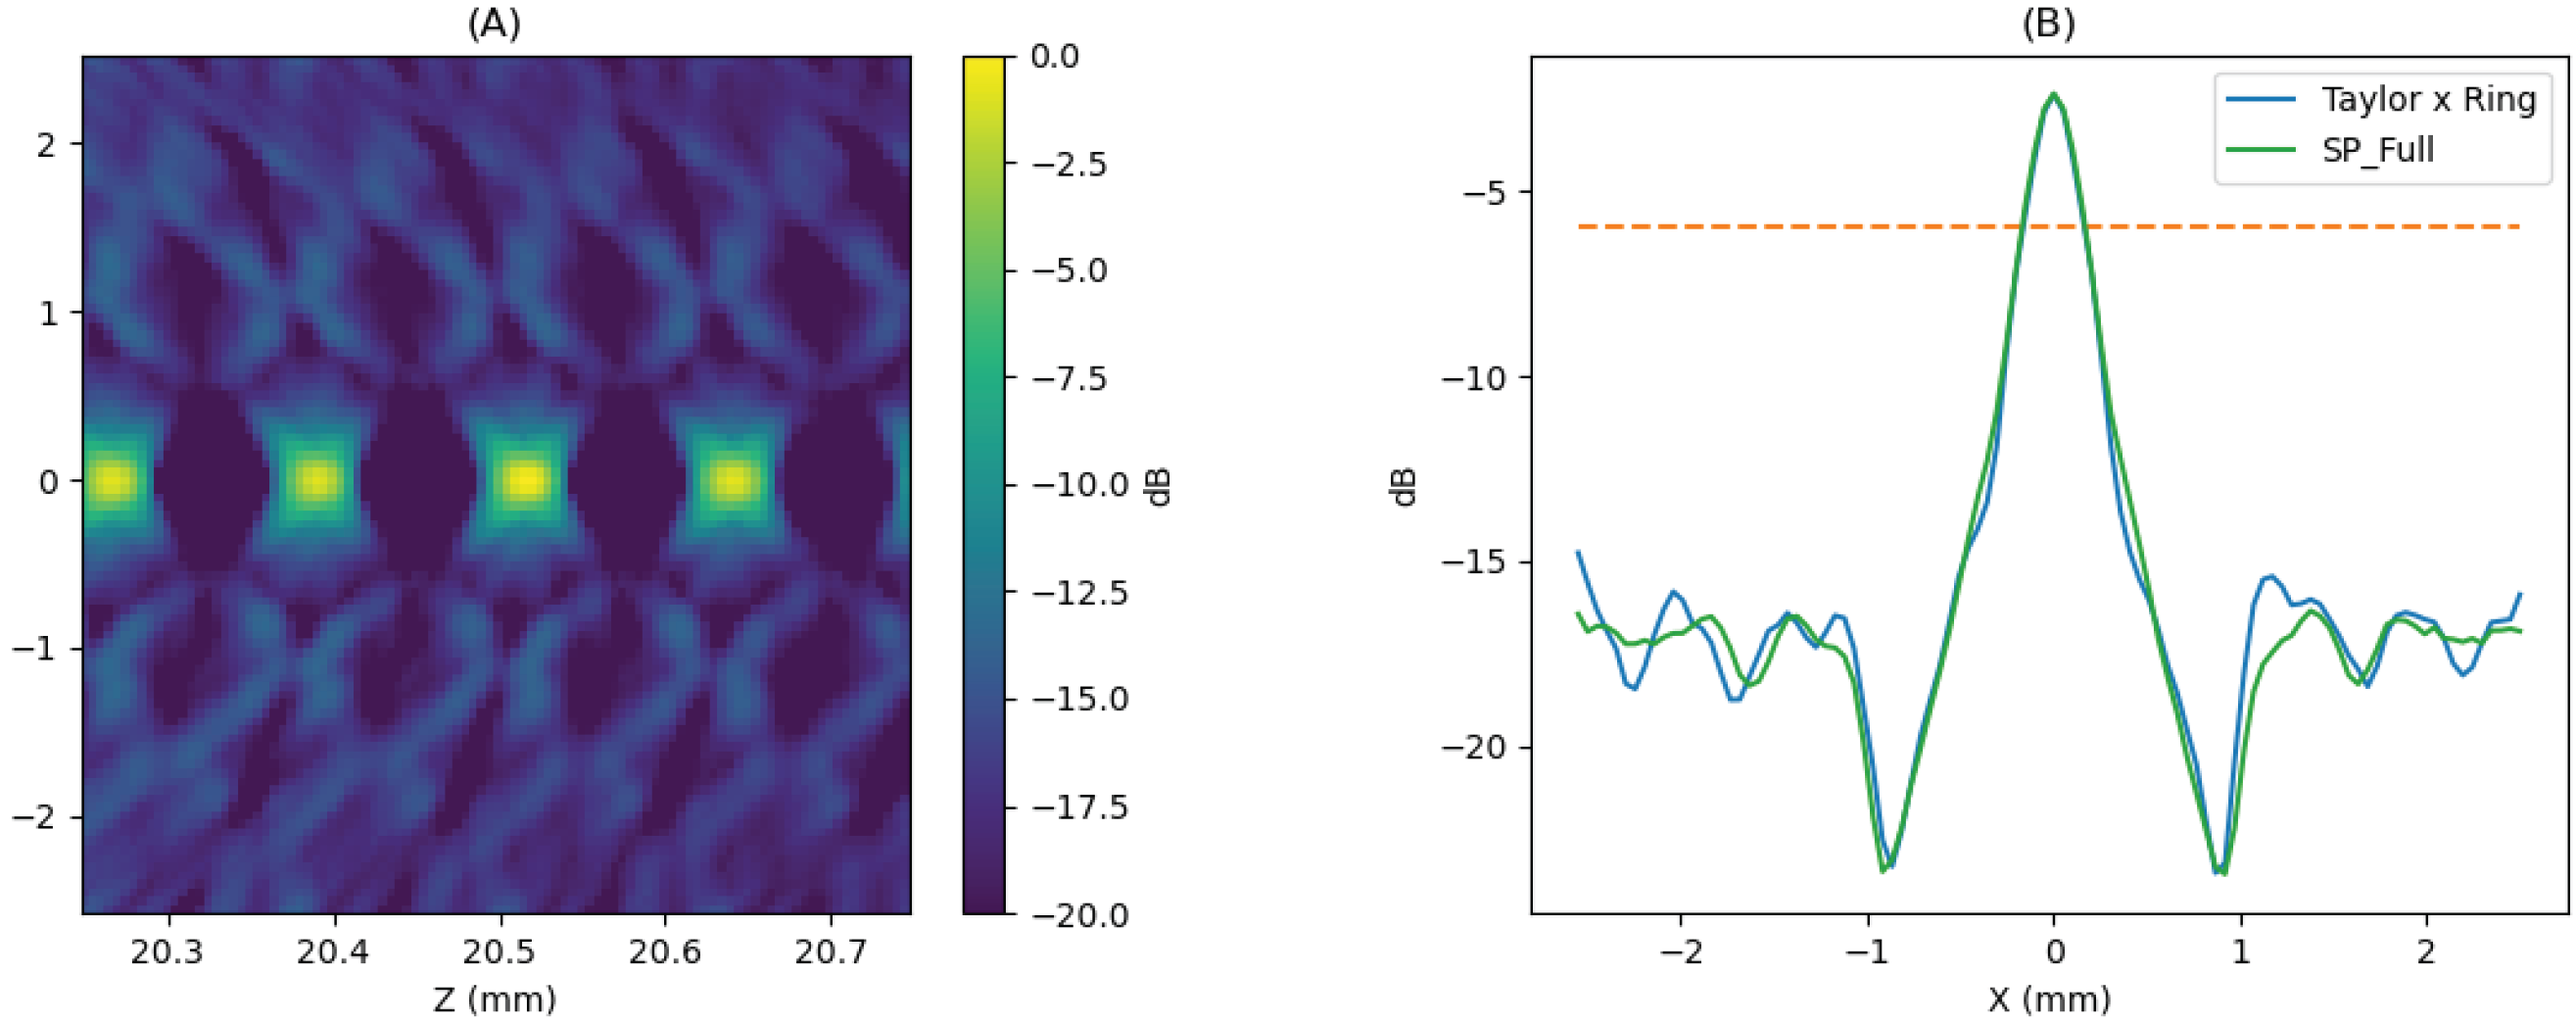
Figure 19.
For the same scenario described in
Figure 17, (
A) was obtained using a reception aperture based on the geometric average of the configurations (see
Figure 18C,D). (
B) Displays the lateral profiles of the four reception configurations over the target at
, along with the corresponding profile for SP_FULL for comparison. The −6 dB threshold (orange dash line) serves as a criterion for lateral resolution.
Figure 20.
Image generated using plane wave emission with a deflection angle of and full aperture. The scenario consists of three curves formed by pairs of points spaced 125 m apart in the X direction and 500 m in the Z direction.
Figure 20.
Image generated using plane wave emission with a deflection angle of and full aperture. The scenario consists of three curves formed by pairs of points spaced 125 m apart in the X direction and 500 m in the Z direction.
Figure 21.
Image generated using plane wave emission with a deflection of
. The scenario consists of three curves formed by pairs of points spaced 125
m apart in the X direction and 500
m in the Z direction. The image was obtained from four acquisitions using 256 receiving elements, completing the full aperture. In (
A), the image corresponds to emissions using a Taylor-tapered apodization aperture (min. with 8 shots). In (
B), the image corresponds to emissions using a ring-shaped aperture (min with 8 shots). In (
C), the final image is obtained by summing the signals from both emissions over the same reception channels prior to beamforming (see Equation (
7),
).
Figure 22.
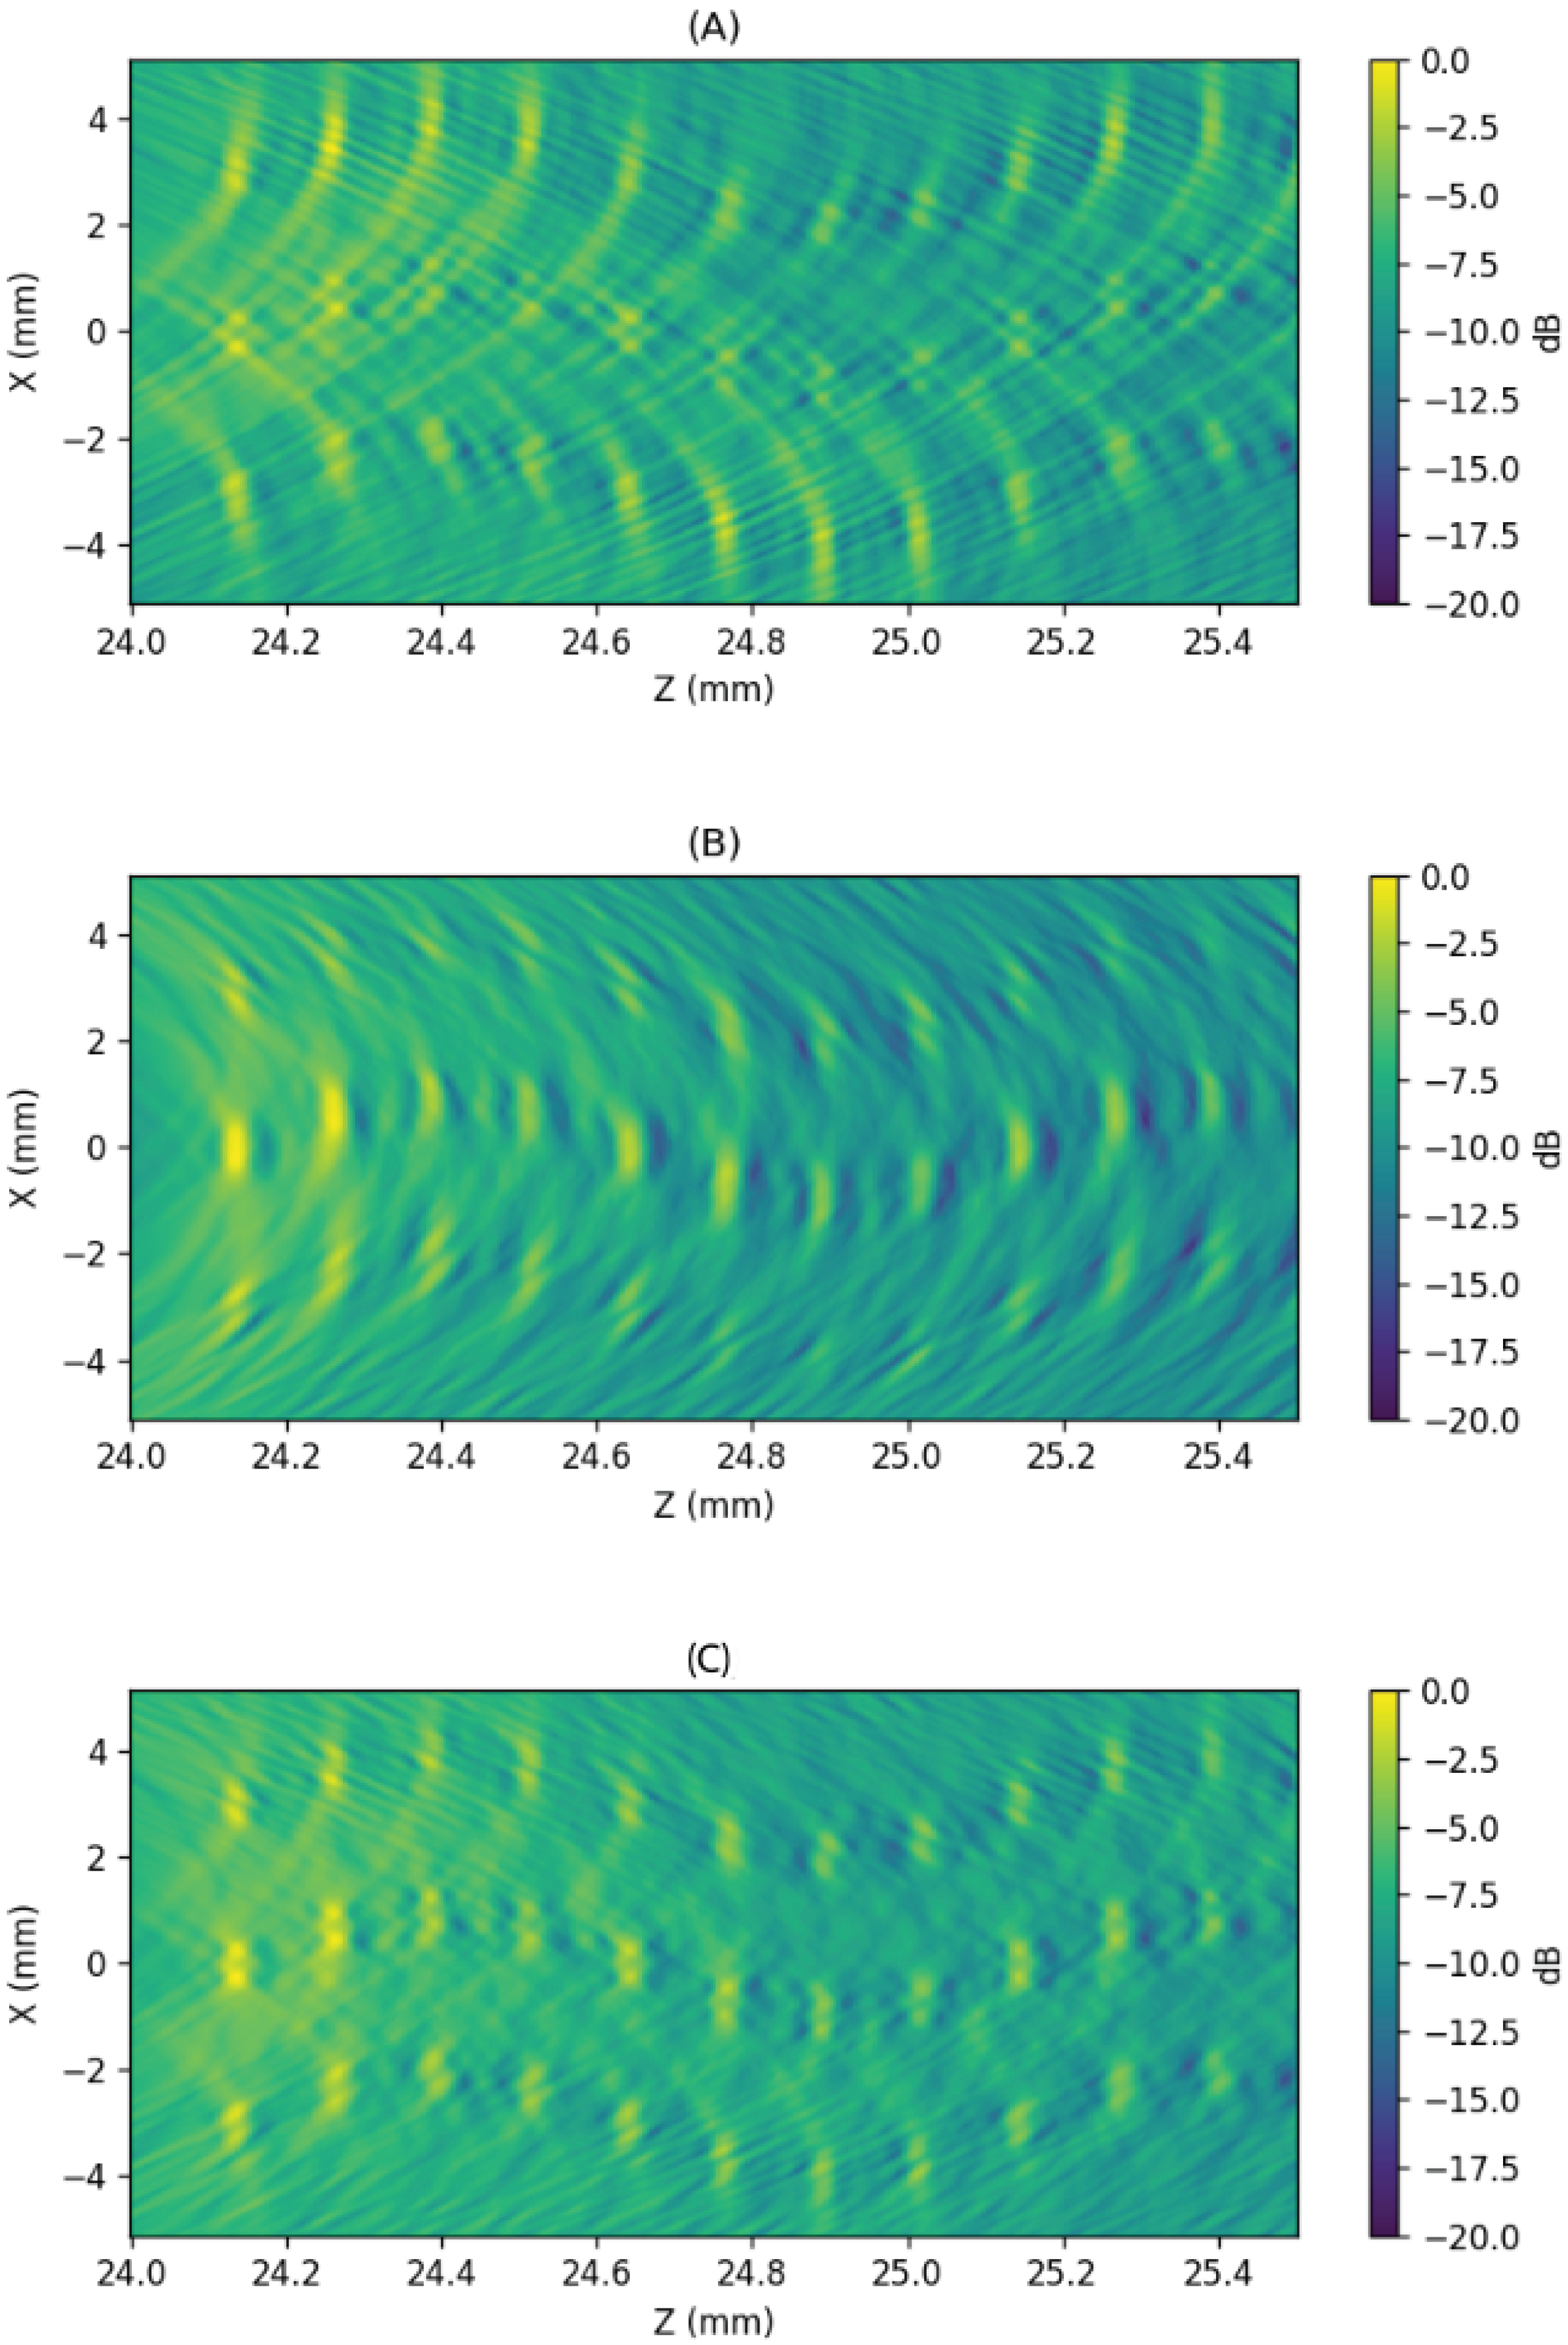
Image generated using plane wave emission with a deflection angle of . The scenario consists of three curves formed by pairs of points spaced 125 m apart in the X direction and 500 m in the Z direction. (A) Was obtained using 256 receiving elements, modeled with a Taylor apodized aperture, by summing the signals from both emissions (min with 8 shots) over the same reception channels prior to beamforming. (B) Was obtained using 256 receiving elements, modeled with a ring-shaped aperture, also by summing the signals from both emissions (min with 8 shots) over the same reception channels prior to beamforming. (C) Was obtained by combining (A,B) using a geometric mean.
Figure 23.
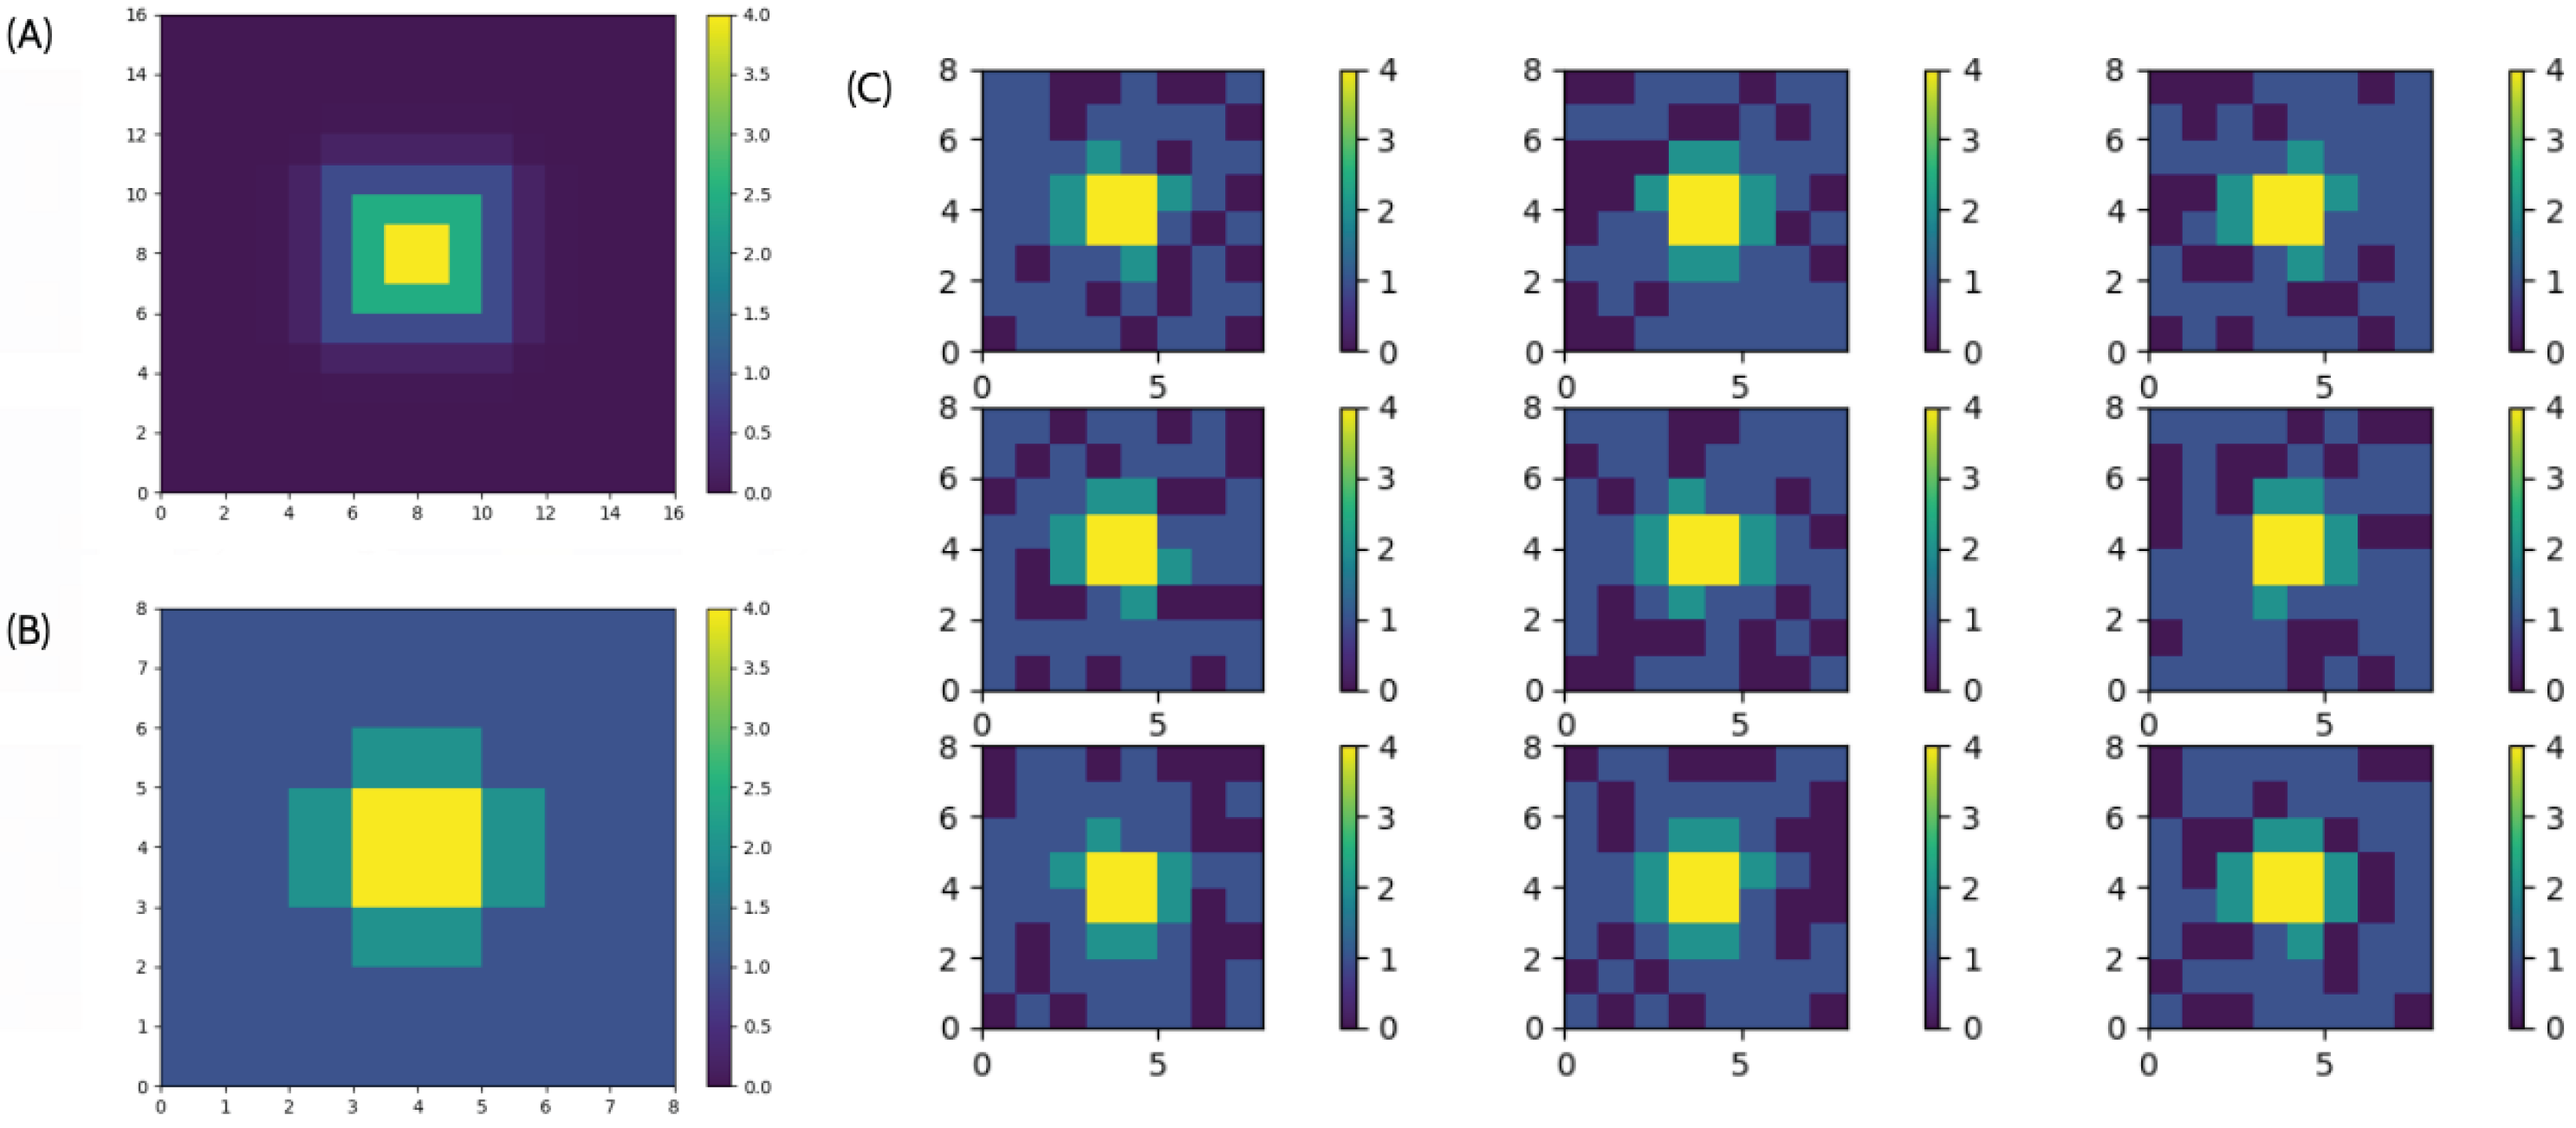
(A) The desired apodization strategy for a array, (B) its adaptation as a sparsity strategy to match the available aperture and resources, and (C) several resulting dispersion strategies.
Figure 23.
(A) The desired apodization strategy for a array, (B) its adaptation as a sparsity strategy to match the available aperture and resources, and (C) several resulting dispersion strategies.
Figure 24.
(A) The 5 MHz element 2D array from Doppler; (B) the experimental setup; and the four scenarios used in the experiments: (C-1) imaging the head of a pin; (C-2) two filaments at different depths; (C-3) seven parallel wires at the same depth; (C-4) and the rat skull.
Figure 24.
(A) The 5 MHz element 2D array from Doppler; (B) the experimental setup; and the four scenarios used in the experiments: (C-1) imaging the head of a pin; (C-2) two filaments at different depths; (C-3) seven parallel wires at the same depth; (C-4) and the rat skull.
Figure 25.
Comparison of three imaging techniques, full plane wave, min, and average-min(4), applied to a point-like reflector (pinhead). The top row shows the signal from a single channel, the middle row displays the full dataset from 256 elements, and the bottom row presents the reconstructed images.
Figure 26.
Imaging of two reflectors at different depths using full plane wave, min, and average-min(4) techniques. The top row shows the reconstructed images, while the bottom row presents maximum intensity projections along the axial (Z) and lateral (X) directions. The blue line is the full plane wave, and the red line is the average-min(4). Contour lines at dB and dB highlight the improved resolution and energy localization achieved.
Figure 27.
Reconstruction of four wires spaced 1 mm apart, positioned at slightly different depths. The images compare full plane wave, min, and average-min(4) techniques. Contour lines at dB and dB are used to assess lateral resolution and energy spread.
Figure 27.
Reconstruction of four wires spaced 1 mm apart, positioned at slightly different depths. The images compare full plane wave, min, and average-min(4) techniques. Contour lines at dB and dB are used to assess lateral resolution and energy spread.
Figure 28.
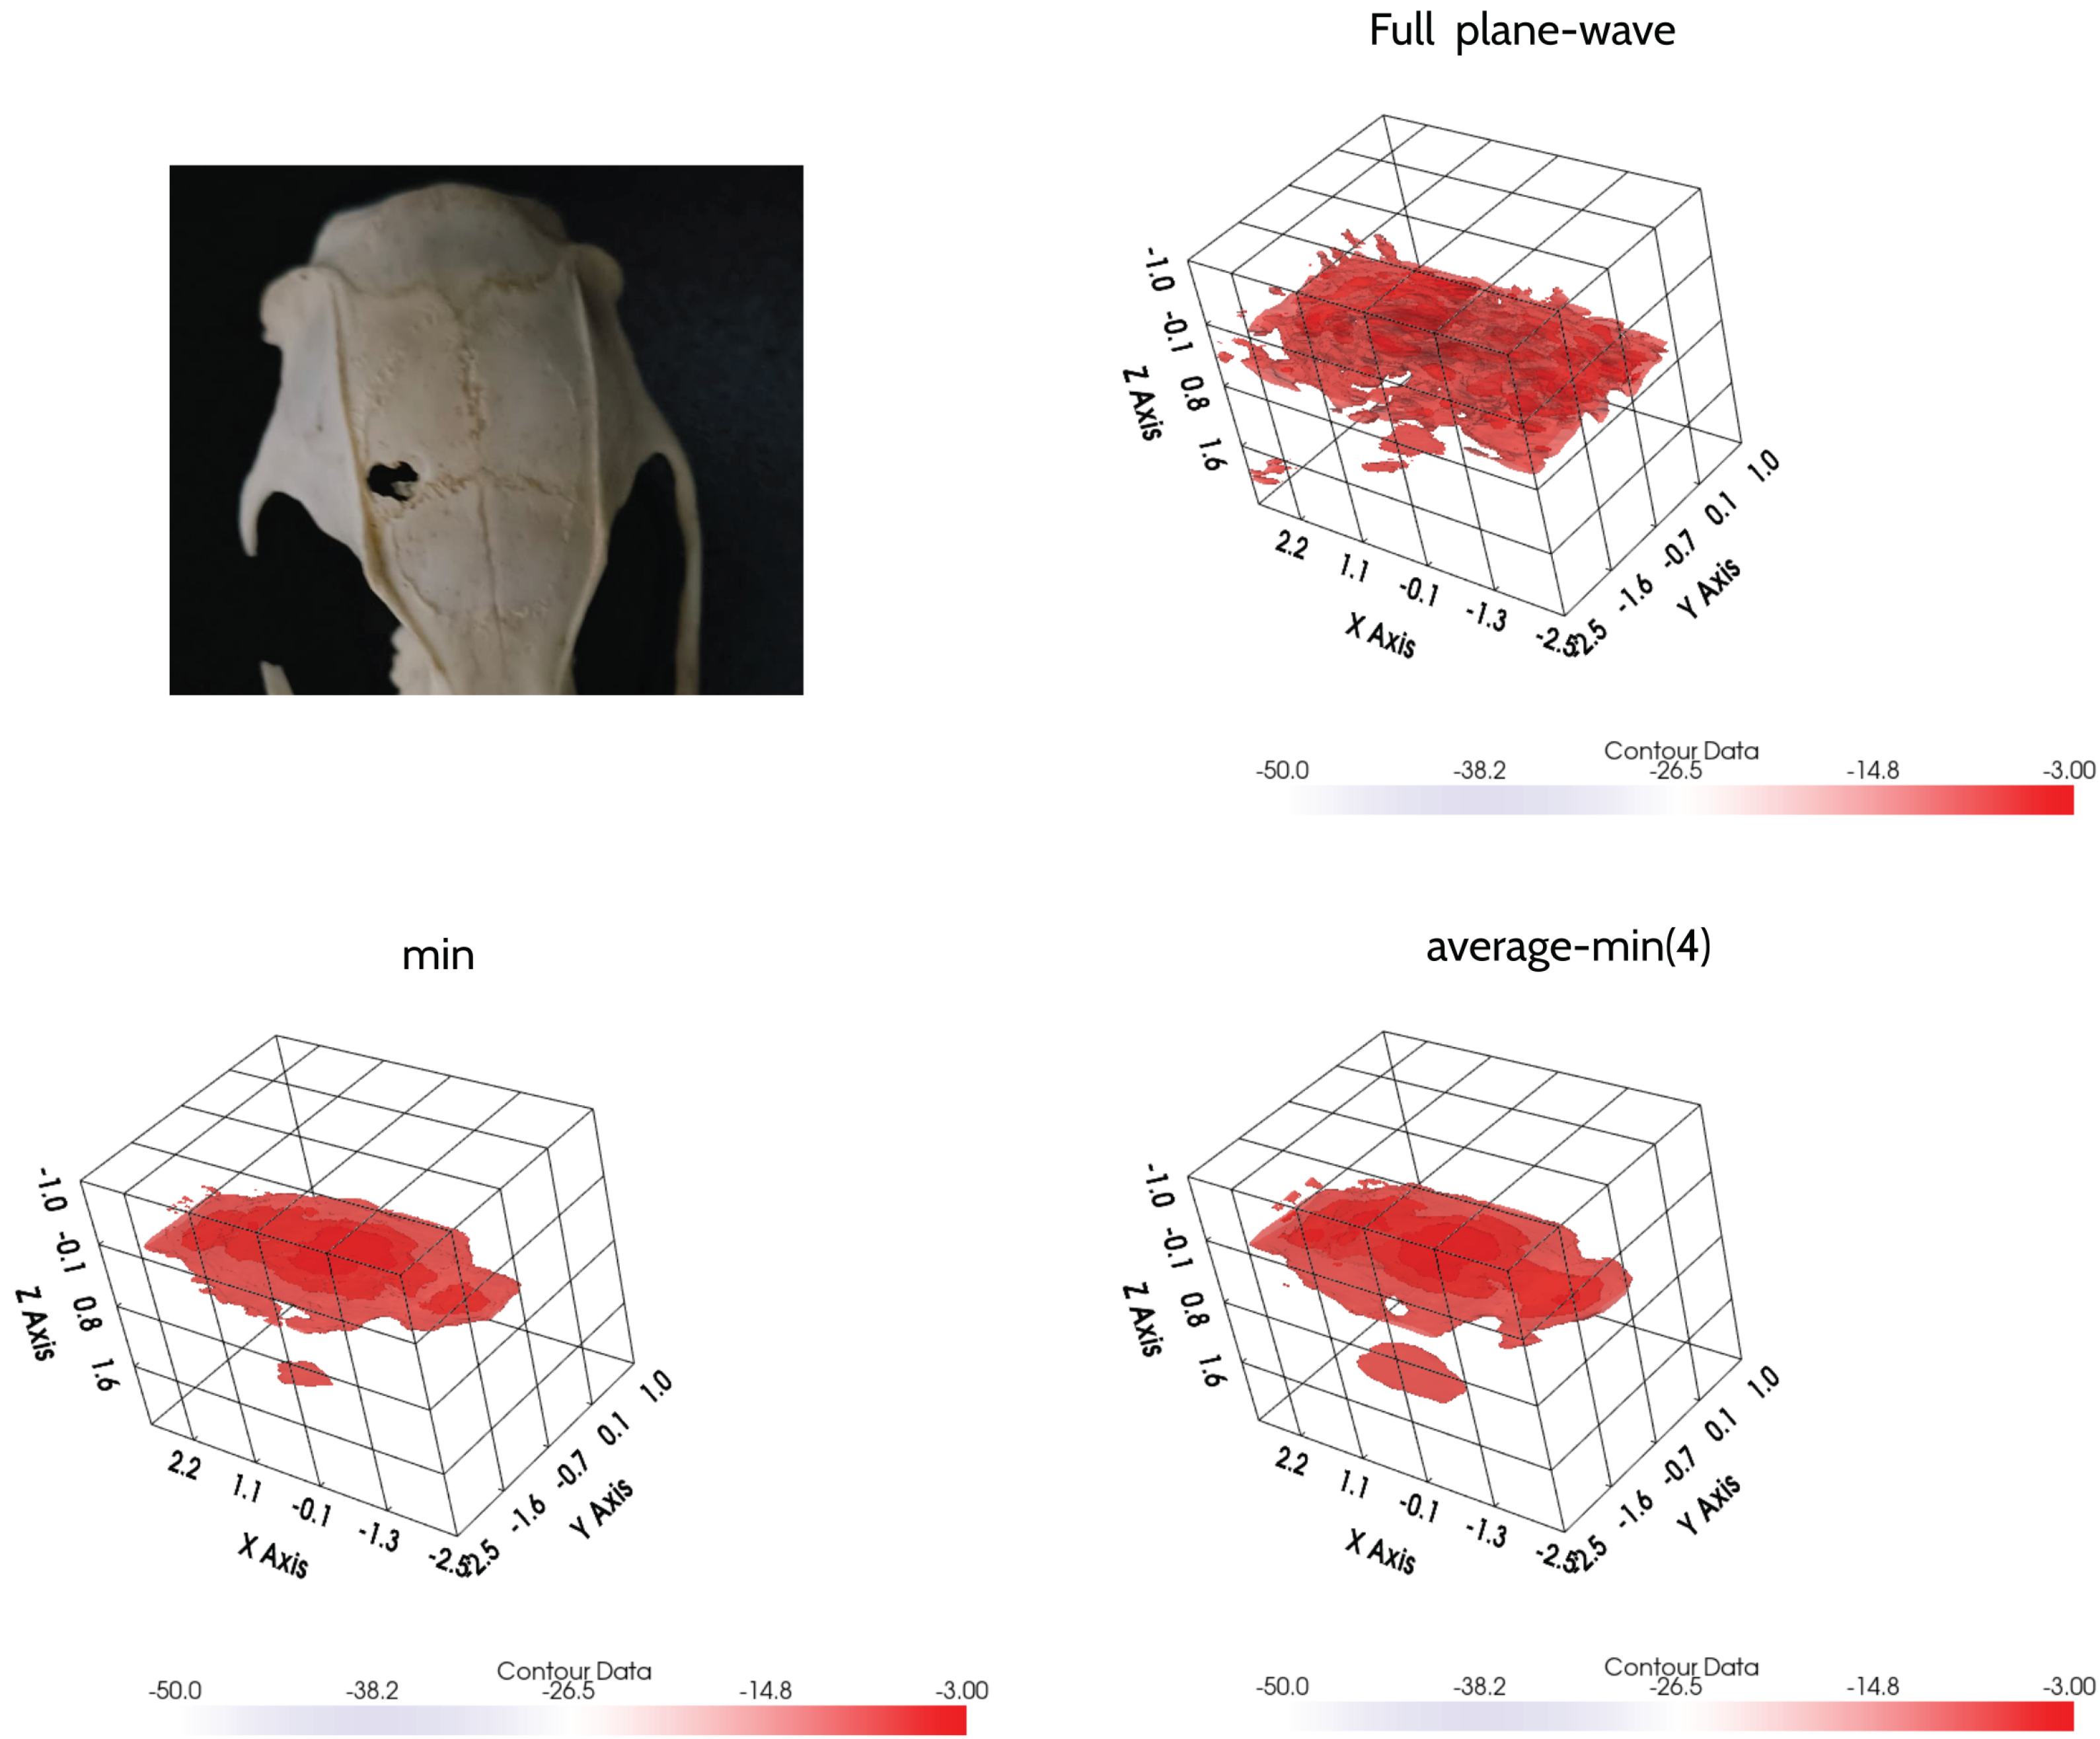
Evaluation of wave penetration through a rat skull using three imaging techniques. A reflector placed behind the skull serves to assess reconstruction performance.
Figure 28.
Evaluation of wave penetration through a rat skull using three imaging techniques. A reflector placed behind the skull serves to assess reconstruction performance.
Table 1.
Data extracted from
Figure 11 used to evaluate the performance of each configuration (dynamic range at three points, variance, and axial resolution).
Table 1.
Data extracted from
Figure 11 used to evaluate the performance of each configuration (dynamic range at three points, variance, and axial resolution).
| Method | mm | mm | mm | mm | mm | mm | (m) |
|---|
| Mean (dB) | Std (dB) |
| 8 | min | 0.71 | 16.47 | 43.9 | 0.032 | 3.05 | 5.72 | 100 |
| average-min(4) | 0.34 | 13.58 | 34.69 | 0.018 | 1.5 | 4.99 | 110 |
| average | 0.0 | 11.37 | 26.67 | 0.0 | 0.91 | 3.55 | 123 |
| 32 | min | 1.0 | 20.46 | 53.47 | 0.026 | 2.85 | 2.88 | 97 |
| average-min(4) | 0.75 | 17.23 | 45.29 | 0.019 | 1.41 | 2.37 | 104 |
| average | 0.0 | 11.35 | 25.87 | 0.0 | 0.38 | 1.11 | 123 |
| 64 | min | 1.12 | 23.37 | 59.28 | 0.023 | 3.64 | 2.6 | 97 |
| average-min(4) | 0.9 | 19.43 | 51.62 | 0.015 | 1.62 | 1.67 | 103 |
| average | 0.0 | 11.34 | 26.39 | 0.0 | 0.37 | 0.9 | 123 |
| 128 | min | 1.69 | 26.31 | 64.75 | 0.021 | 3.75 | 3.12 | 58 |
| average-min(4) | 1.49 | 21.99 | 57.58 | 0.016 | 2.01 | 1.54 | 97 |
| average | 0.47 | 11.37 | 26.26 | 0.0 | 0.25 | 0.67 | 123 |
Table 2.
Resolution data measured in the pinhead experiment.
Table 2.
Resolution data measured in the pinhead experiment.
| | | | | | |
|---|
| full plane wave | 270 m | 573 m | 1000 m | 800 m | 1600 m |
| min | 210 m | 300 m | 800 m | 565 m | 1480 m |
| average-min(4) | 210 m | 300 m | 565 m | 800 m | 1480 m |
