Article

Integrated Fatigue Evaluation of As-Built WAAM Steel Through Experimental Testing and Finite Element Simulation

1
Department of Materials Engineering, KU Leuven, Gent Campus, 3001 Leuven, Belgium
2
Department of Mechanical Engineering, Virginia Tech, Blacksburg, VA 24060, USA
*
Author to whom correspondence should be addressed.
Appl. Sci. 2025, 15(20), 10936; https://doi.org/10.3390/app152010936
Submission received: 17 September 2025 / Revised: 2 October 2025 / Accepted: 8 October 2025 / Published: 11 October 2025
(This article belongs to the Special Issue Fatigue and Fracture Behavior of Engineering Materials)

Abstract

Additive Manufacturing (AM) has attracted considerable interest over the past three decades, driven by growing industrial demand. Among metal AM techniques, Wire and Arc Additive Manufacturing (WAAM), a Directed Energy Deposition (DED) variant, has emerged as a prominent method for producing large-scale components with high deposition rates and cost efficiency. However, WAAM parts typically exhibit rough surface profiles, which can induce stress concentrations and promote fatigue crack initiation under cyclic loading. This study presents an integrated experimental and numerical investigation into the fatigue performance of as-built WAAM steel. Fatigue specimens extracted from a WAAM-fabricated wall were tested under cyclic loading, followed by fractography to assess the influence of surface irregularities and subsurface defects on fatigue behaviour. Surface topography analysis identified critical stress-concentration regions and key surface roughness parameters. Additionally, 3D scanning was used to reconstruct the specimen topography, enabling detailed 2D and 3D finite element (FE) modelling to analyze stress distribution along the as-built surface and predict fatigue life. A Smith-Watson-Topper (SWT) critical plane-based approach was applied for multiaxial fatigue life estimation. The results reveal a good correlation between experimental fatigue data and numerically predicted results, validating the proposed combined methodology for assessing durability of as-built WAAM components.

1. Introduction

Additive Manufacturing (AM) has evolved from a rapid prototyping tool to a key manufacturing process that offers unique advantages such as design flexibility and reduced material waste. The interest in AM has rapidly grown over the past decades driven by a growing demand for more versatile and sustainable manufacturing in many industries, including aerospace [1] and automotive [2,3]. Increased design freedom of AM facilitates an optimization of structural components, which leads to significant performance enhancements of both aerospace and automotive applications.
Wire and Arc Additive Manufacturing (WAAM) is a specific AM technique based on Direct Energy Deposition (DED). The process relies on melting metal wire using an electric arc and depositing it layer by layer. The high deposition rate and ability to produce large components make WAAM an attractive alternative technique compared to traditional manufacturing methods as well as other AM methods. However, the as-welded surface of WAAM components typically exhibits significant waviness and roughness, which introduce stress concentrations that negatively affect the fatigue performance of components subjected to cyclic loading [4]. While additional subtractive post-processing could address these surface imperfections, doing so would negate some of the inherent benefits of WAAM, such as material efficiency and limited production steps. In this regard, the mechanical characterization of WAAM parts in their as-built condition has become an important research topic.
Since the WAAM process is fundamentally a controlled welding process, the feedstock materials typically consist of commercially available welding wires. These range from steels to high-performance alloys commonly used in the aerospace industry, such as titanium, aluminum, and nickel alloys. Steel and its alloys have long been a popular choice due to their affordability, versatility, and the extensive body of knowledge available regarding their properties and processing. As a result, significant research has been dedicated to the application of WAAM for steel components [5]. As with any manufacturing method, WAAM has inherent advantages and disadvantages. One major concern is that WAAM-fabricated components often exhibit inferior mechanical properties compared to conventionally produced counterparts. Therefore, it is critical to identify and mitigate defects before these components are deployed in safety-critical applications. Some of the primary challenges associated with WAAM-fabricated parts include unwanted deformation due to internal residual stresses, the presence of porosity, delamination between layers, and crack formation during the deposition process [6].
The high thermal gradients generated between the weld pool and surrounding material lead to differential thermal expansion and contraction, akin to casting processes. This results in residual stresses that can cause unpredictable deformation. Effective management of thermal gradients is essential in WAAM and can be achieved by tailoring process parameters, planning deposition paths, consulting phase diagrams, applying rolling, and conducting post-process heat treatments. Alternatively, predictive models and pre-production simulations can be employed to compensate for distortions in iterative component designs [7]. Avoiding porosity formation during material deposition is crucial due to its detrimental effect on mechanical properties, especially fatigue performance. Porosities can be classified into two types: material-induced and process-induced. Material-induced porosities often stem from contaminants that become entrapped in the melt pool. Process-induced porosities are influenced by the deposition technique, transfer mode, and path strategy. These can be reduced by adopting Cold Metal Transfer (CMT) variants with pulsating modes, optimizing shielding gas flow rates, and implementing real-time thermal monitoring and control [7]. Structural defects in WAAM components often originate from steep thermal gradients and the inherent material characteristics involved in the deposition process. These defects include solidification cracks, which result from solute segregation that disrupts the complete solidification of the weld pool; grain boundary cracks, typically caused by variations in grain morphology or the formation and dissolution of precipitates along grain boundaries; and delamination, which refers to the separation of successive layers due to insufficient melting, inadequate heat input, poor weld penetration, metallurgical incompatibilities, or surface contamination [7].
Given the growing potential of WAAM for diverse engineering applications, research in this field has expanded significantly in recent years. Current studies on WAAM steel components primarily investigate microstructure, processing parameters, and mechanical properties, including fatigue performance. Recent work has examined the high-cycle fatigue behaviour of WAAM specimens extracted from printed walls [2,4,6], revealing that fatigue failures often initiate at delaminated layers due to localized stress concentrations. These studies highlight the critical role of weakly bonded regions and internal defects in the failure mechanisms of WAAM components [4]. However, the fatigue performance of as-built WAAM steel parts, and, in particular, the influence of process-induced surface roughness on fatigue life, remains insufficiently understood. Yet this knowledge is crucial to using as-built WAAM components in engineering applications. Thus, to address this research gap, this study presents a combined experimental and numerical investigation of surface roughness and stress concentration effects on the fatigue performance of as-built WAAM steel components. The key novelty of this work compared to the state-of-the-art is that the methodology integrates 3D-scanned surface topography data of as built- WAAM components with advanced finite element (FE) modelling to increase the accuracy of fatigue life predictions by explicitly accounting for as-built surface texture effects.
To investigate the fatigue performance of as-built WAAM components, fatigue specimens were extracted from a WAAM-fabricated wall and subjected to cyclic loading tests. Prior to testing, each specimen underwent 3D scanning to measure its surface topography. The surface topography data was incorporated into both 2D and 3D FE models, enabling a comprehensive comparative analysis of stress distributions. This approach revealed critical peak stress locations near specimen edges, providing valuable insights into potential fatigue failure initiation locations. The experimental programme was complemented by detailed fractography analysis to examine the influence of surface irregularities and subsurface defects on fatigue performance. Surface topography characterization further identified critical stress-concentration regions and key roughness parameters affecting fatigue performance. For fatigue life prediction, the study employed a multi-faceted analytical approach: (1) correction of the fatigue strength and endurance limit of machined WAAM material using calculated stress concentration factors for as-built specimens, and (2) application of the Smith-Watson-Topper (SWT) critical plane method for multiaxial fatigue life estimation. This integrated methodology enabled full consideration of surface texture effects in both stress analysis and fatigue life prediction.

2. Experimental Procedure

2.1. Material and Manufacturing WAAM Wall

The WAAM wall was fabricated using standard Gas Metal Arc Welding (GMAW) with a 6-axis robotic cell (CLOOS QRC320H) coupled to a 450 A welding power source (Qineo Pulse, Carl Cloos Schweißtechnik GmbH, Haiger, Germany) and synchronized with a rotary table, as shown in Figure 1. A 1.2 mm diameter G3Si1 welding wire (EN ISO 14341 A compliant [8]) was deposited onto an S235 structural steel substrate using a wire feed rate of 4.5 m/min and welding current of 174 A, with complete deposition parameters provided in Table 1. To ensure optimal deposition quality, the process employed a zig-zag welding pattern that alternated start and end points between layers, effectively minimizing lack-of-fusion defects while improving dimensional accuracy and reducing residual stresses [9]. The wall was built by depositing ninety 2 mm high layers with two passes per layer, resulting in a final 14 mm thick structure whose dimensions are detailed in Figure 1b, while Table 2 and Table 3 provide the chemical composition and mechanical properties of both the wire and substrate materials, respectively.

2.2. Microstructural Characterization

Microstructural analysis was conducted on a section extracted from the G1Si3 WAAM wall. As reported in another study [6,10], the as-built material exhibited an average carbon content of 0.15%. Figure 1c presents the resulting micrograph, revealing a predominantly ferritic (α) grain structure with localized pearlite (α + Fe3C) formation evident as darker regions along grain boundaries. Scanning electron microscopy during fractographic analysis further identified zones of rapidly solidified martensite and undissolved cementite carbides. The microstructure displays an average grain size of 22 µm in the central region, gradually increases to 27 µm near the edges, suggesting minor variations in cooling rates across the deposited wall.

2.3. Specimen Extraction

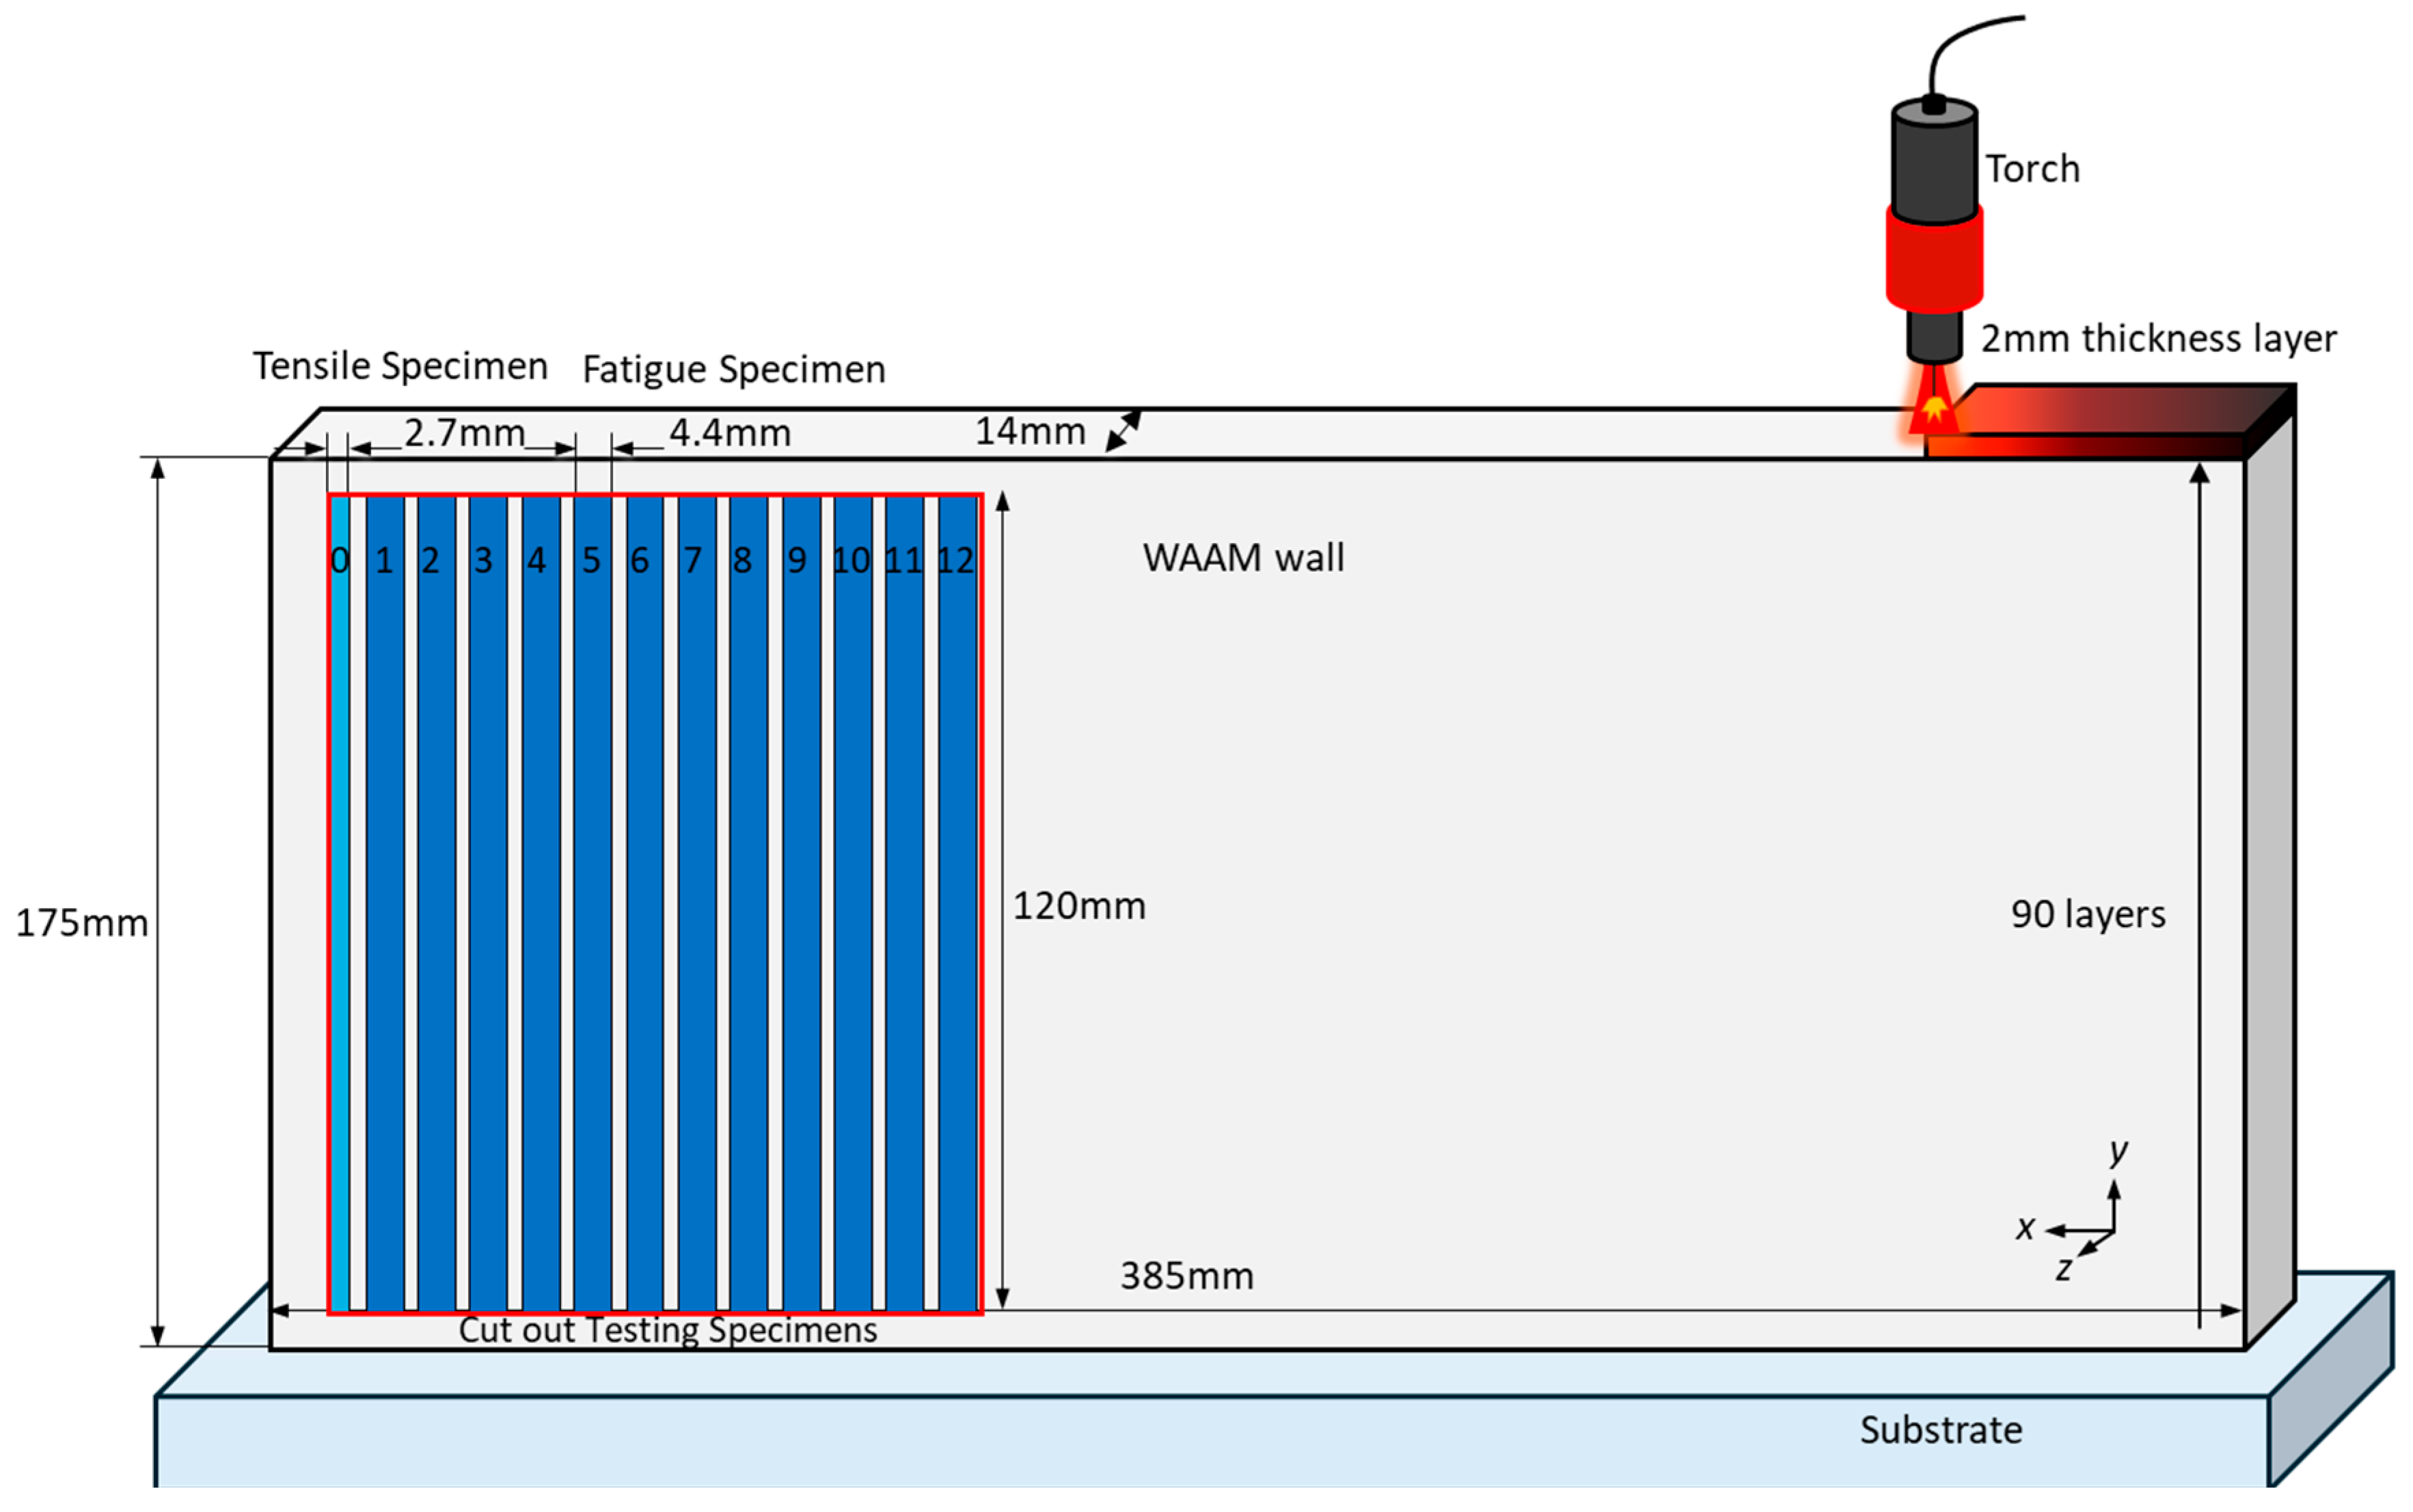
A total of 13 specimens (12 for fatigue testing and 1 for tensile testing) were extracted from the WAAM wall using abrasive water jet cutting as shown in Figure 2. The fatigue specimens had a constant cross-section and measured 120 mm in length, approximately 14 mm in width, and 4.4 mm in thickness. After extraction, all edges of the specimens were deburred and cleaned using ultrasonic cleaner to remove contaminants and abrasive particles. The use of flat, relatively thin, non-standard specimens was motivated by the study’s focus on as-built surface topography, aiming to represent worst-case scenario conditions.

2.4. Surface Topography Reverse Engineering

Prior to fatigue testing all as-built specimens were subjected to 3D scanning using a GOM ATOS Core 200, Carl Zeiss GOM Metrology GmbH, Braunschweig, Germany industrial optical scanner, which provides a measuring resolution down to 20 µm depending on the measuring volume and configuration. For the specimens in this study, the chosen setup ensured a resolution sufficient to accurately capture the as-built surface topography and geometrical features relevant to the fatigue analysis. Exposure times ranged from 15 to 20 ms for the initial scans to 50–60 ms for capturing the entire as-built surface, typically requiring 5–8 scans per side of each specimen. The raw scan data were then post-processed by removing artefacts such as table noise, then aligned and merged using common reference points. The resulting high-resolution faceted meshes were refined using GOM Inspect software 2022 Service Pack 2 and exported as STL files for further processing. Transitioning from raw scan data to accurate computer-aided design (CAD) models proved challenging due to the intricate and irregular geometries of the as-built WAAM specimens. A precise digital reconstruction was essential to accurately capture stress concentrations and correlate them with experimental test results. To address this, Rhinoceros 3D software (Rhino 8.1) was chosen as the primary reverse engineering tool, owing to its robust performance with complex mesh data and wide industry adoption for handling non-standard geometries.
In general, CAD reconstruction techniques fall into two categories: feature-based and free-form modelling strategies. Given the geometric complexity of the WAAM specimens and the methodology employed in this study, only the Non-Uniform Rational B-Spline (NURBS) auto-surfacing approach was adopted. NURBS represents surfaces using a mathematically defined grid of weighted control points, enabling the design and reconstruction of both standard analytical forms and complex free-form geometries that are otherwise difficult to reproduce using basic parametric operations such as extrusions or revolutions. A key advantage of NURBS surfaces is their ability to closely conform to the original scanned mesh, ensuring high geometric fidelity between the digital CAD model and the physical specimen. Moreover, the fitting principle behind NURBS allows for rapid model generation, making it a practical solution for complex reverse engineering tasks.
Geometric data were obtained by importing the models of each specimen into Rhino software (Rhino 8.1). Contour lines were generated at 0.1 mm intervals to ensure high resolution in both the longitudinal (y-axis) and normal (z-axis) directions, depending on the specific information required along the specimen’s gauge length. For each closed contour line along the longitudinal direction, the cross-sectional area and the absolute deviation of each cross-sectional centroid relative to the overall specimen centroid were calculated. This analysis was performed using Grasshopper 1.0 (bundled with Rhino 8.1), a visual programming language integrated with Rhino’s modelling environment, as illustrated in Figure 3a. However, accurately characterizing the specimen width posed challenges due to irregularities along the as-welded edges. This issue was addressed by identifying the intersection points between a series of evenly spaced planes (0.1 mm apart) and the contour curves on both sides of the specimen, using Grasshopper code. For each contour curve, the intersection coordinates were extracted, and the average, minimum, and standard deviation of the width were computed.
Next, to characterize the significant surface profile variations in the as-built WAAM specimens, a detailed surface topography analysis was conducted by extracting topographic data points for the reconstructed 3D CAD model along the specimen’s edge. Figure 3b illustrates the data acquisition process at the right side of the middle contour. The primary profile within the initial gauge length was segmented into discrete, equidistant sections for measuring the waviness of the as-built surfaces. Waviness parameters, including the arithmetic mean deviation (Wa), root mean square deviation (Wq), and maximum profile height (Wz), were evaluated. This set of surface topography parameters provided critical insights into the surface topography’s influence on potential fatigue initiation locations. Determining the waviness profiles of the primary 3D-scanned surface requires a systematic approach that combines measurement techniques with mathematical analysis. The EN ISO 4288:1996 standard [11] outlines the rules and procedures for surface texture assessment, considering parameters such as profile length, aperiodic profile deviations, and sampling lengths. However, applying these standard parameters directly to as-built WAAM components presents challenges, as the surface texture features inherent to this process are more pronounced and irregular. To address this issue, the interactive scientific graphing and data analysis software OriginPro 2023b (10.05) was used, incorporating a discrete Gaussian filter, in accordance with EN ISO 16610-21:2025 [12].
Moreover, to identify the critical surface valleys, a Python 3.10 script was developed based on the concept of peak prominence, a method commonly used in signal processing and topographic analysis. Peak prominence quantifies how much a peak stands out relative to its surroundings and is defined as the vertical distance between a peak and its lowest contour line. In other words, it represents the vertical distance between a peak and the key col, also sometimes called a key saddle or just col, which is the lowest point on the highest connecting ridge to a taller summit. This concept was adapted in this study to identify valleys rather than peaks by inverting the dataset, following the approach outlined by Al-Badrawi et al. [13].

2.5. Uniaxial Tensile Test Using DIC Technique

The monotonic stress–strain response of the as-deposited WAAM material was characterized through a static tensile test performed on a ZwickRoell Z250/SN5A (ZwickRoell GmbH & Co. KG, Ulm, Germany) series testing machine at ambient temperature, utilizing a specimen whose geometric properties and surface topography were previously determined via laser scanning and data processing as detailed above. Prior to testing, the specimen underwent thorough degreasing and cleaning, with its clamping lengths taped for protection, followed by surface preparation involving a white base coat and black speckle pattern application to enable Digital Image Correlation (DIC) measurements. For DIC implementation, two Manta G-609B cameras (Allied Vision Technologies GmbH, Stadtroda, Germany) were mounted on a tripod with an optimal 10–15° stereo angle near the test bench, undergoing stereo calibration to establish their 3D spatial relationship before capturing sequential images at predetermined intervals throughout the loading process. The resulting displacement field measurements, together with synchronized force data and mean cross-sectional area calculations, were used to construct the engineering stress–strain curve. This curve subsequently served as the basis for defining the isotropic elastoplastic material model in the numerical simulations, while the speckle pattern deformation provided full-field strain evolution across the gauge length during tensile loading. The stress–strain values were obtained based on the averaged strain field of the Area of Interest (AOI). The processing settings used were a subset of 15 pixels and a step size of 8 pixels. Further, an Average Normalized Sum of Squared Differences (ANSSD) correlation criterion was selected to calculate the strain fields. An affine shape function was chosen to preserve the linearity of the shape, and a cubic spline interpolation function to measure sub-pixel deformation.

2.6. Fatigue Testing and Post Fracture Analysis

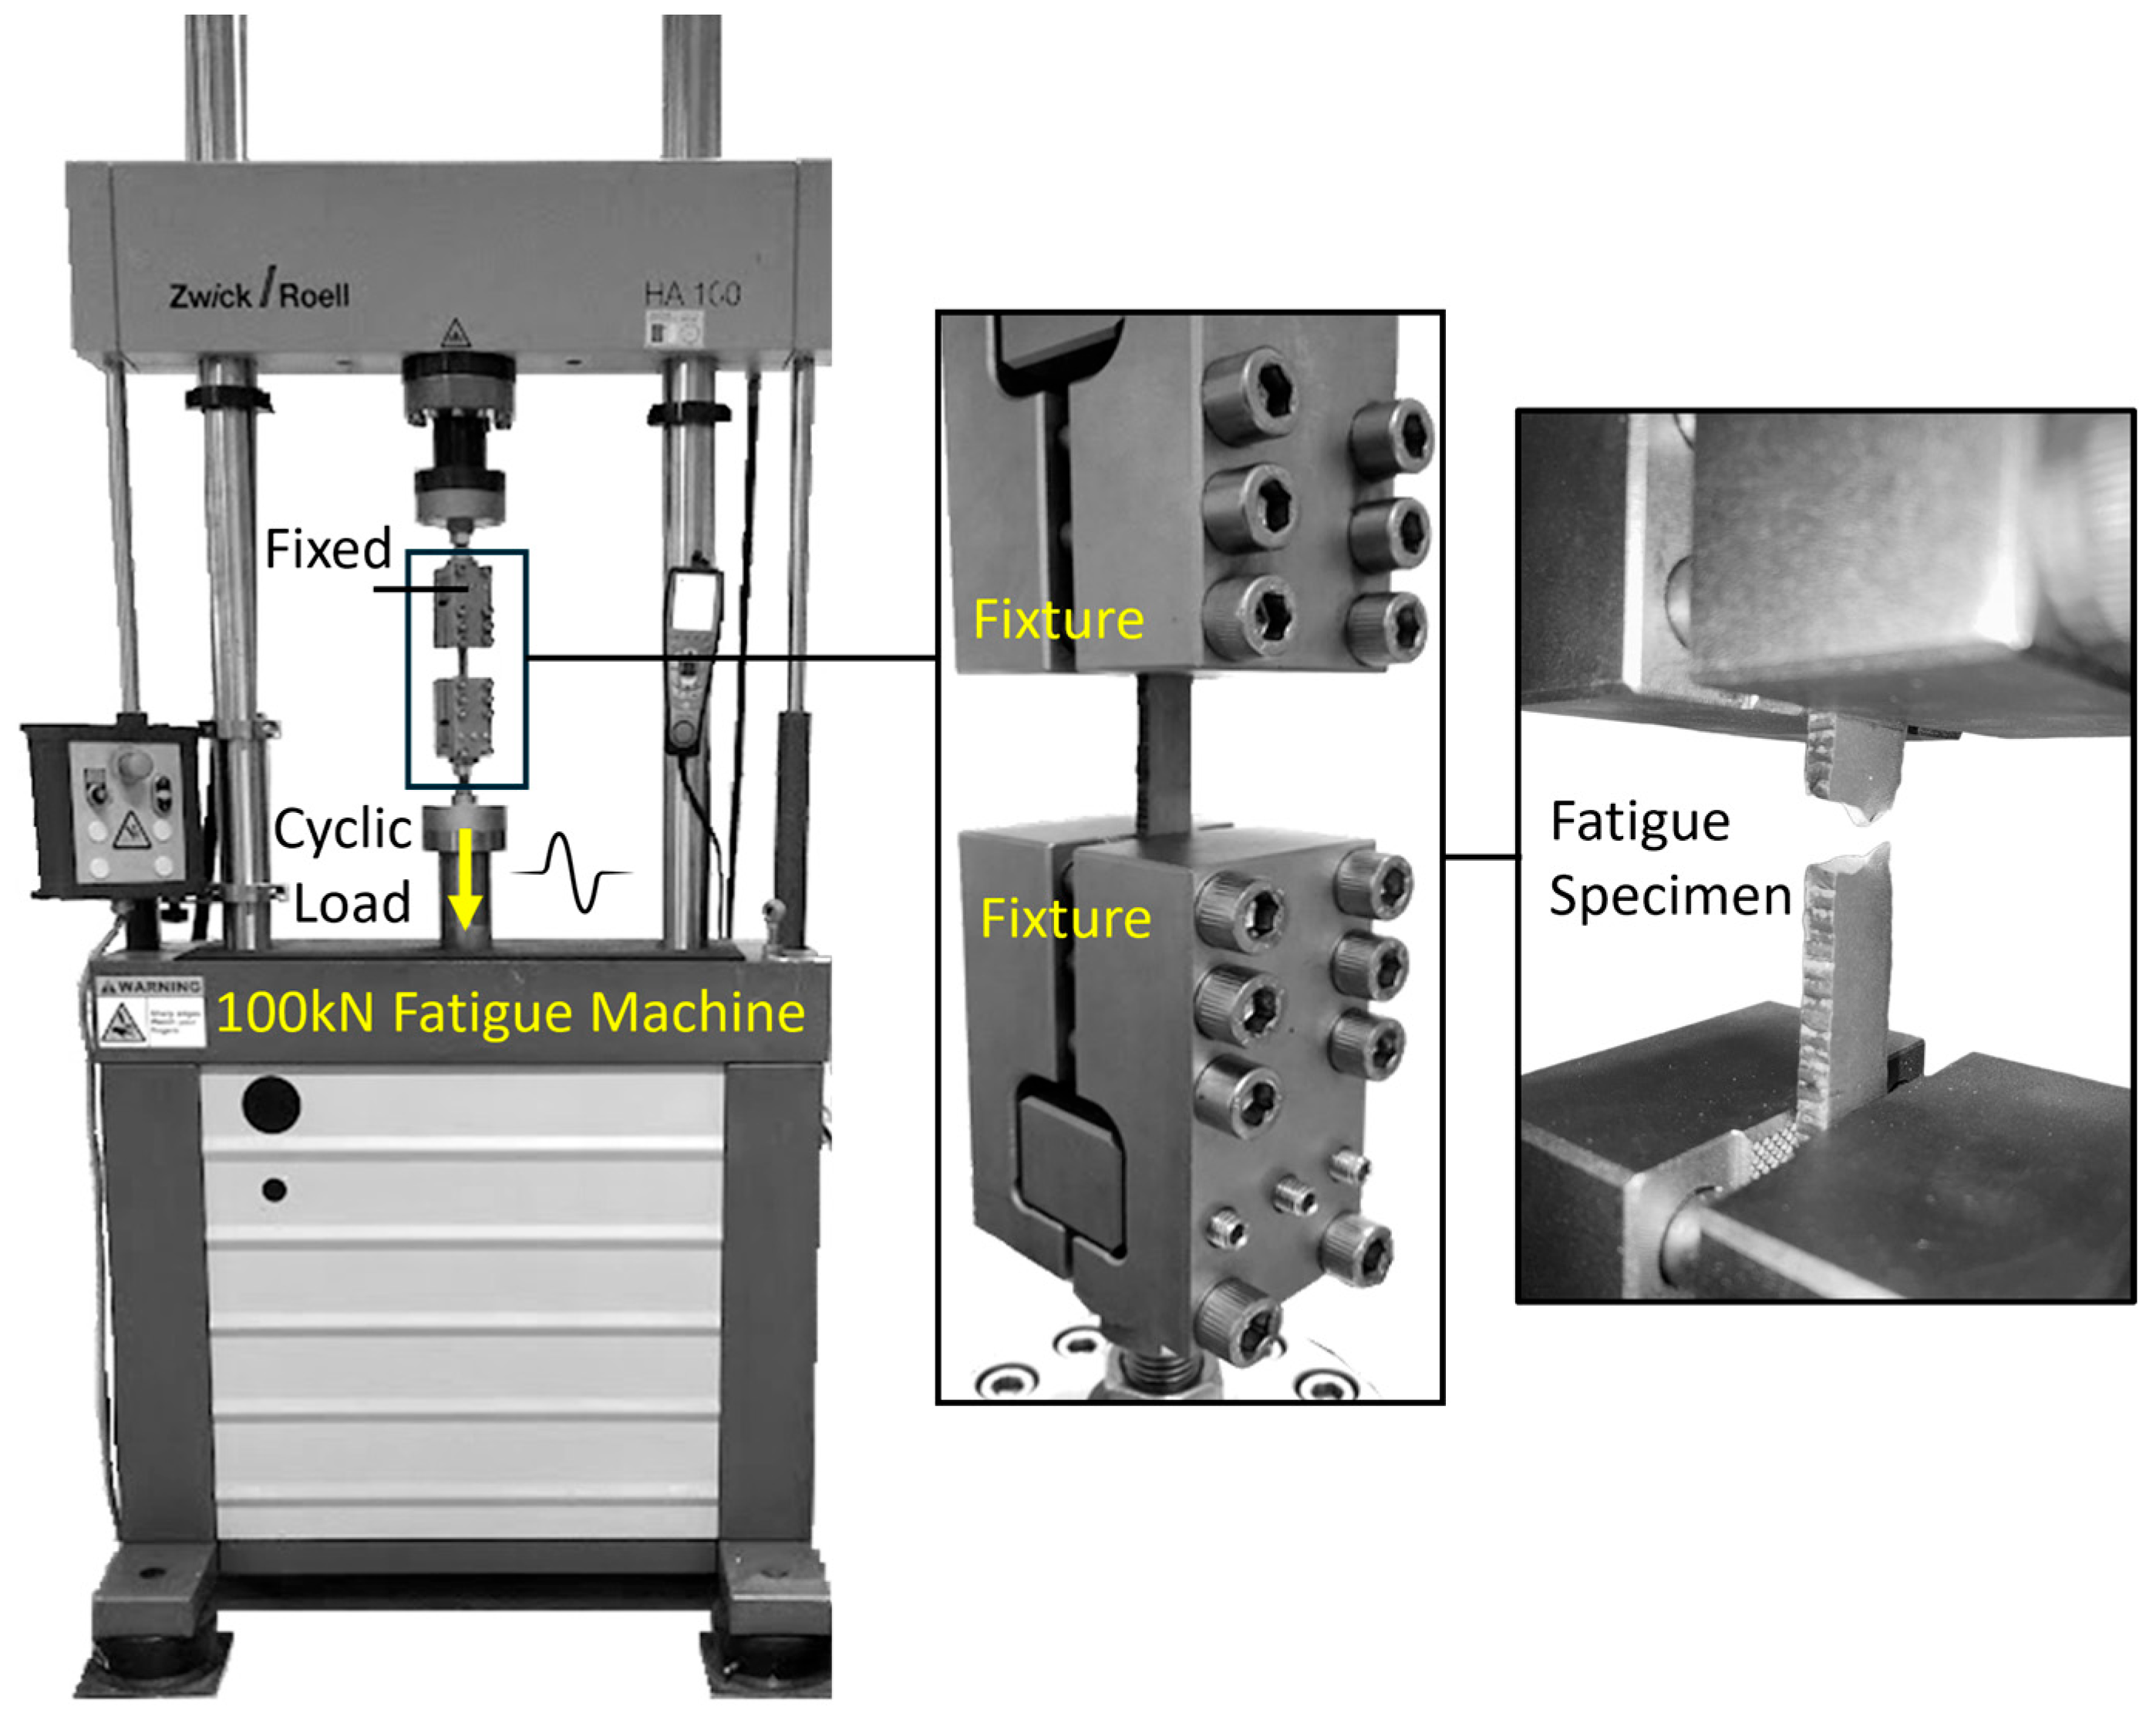
The fatigue behaviour of as-built WAAM specimens was investigated through constant amplitude uniaxial testing at room temperature, employing a load-controlled, sinusoidal waveform with a stress ratio R = 0.1. Eleven fatigue tests were conducted using a 100 kN ZwickRoell HA (ZwickRoell GmbH & Co. KG, Ulm, Germany) 100 servo-hydraulic testing machine (as shown in Figure 4) at a frequency of 20 Hz, with stress amplitudes calculated based on the average cross-sectional area. The fatigue specimens were clamped to provide an unclamped gauge section of 50 mm, with a minimum clamping length of 35 mm on each side. Special care was taken during clamping to ensure that no stress-concentration features were located at the clamping edges, thereby preventing premature fatigue failure due to clamp-induced contact forces. The testing protocol incorporated continuous stiffness monitoring via axial displacement measurements, implementing a 4 mm absolute displacement threshold as a software-based failure criterion to automatically terminate tests upon complete specimen fracture. Given the preliminary nature of the material characterization and the geometric variability inherent to as-built specimens, the experiments were designed to systematically explore a broad range of stress amplitudes without predetermined cycle limits, enabling the acquisition of fatigue life data spanning 104 to 107 cycles, thereby providing an S-N curve representation for subsequent finite element analysis validation and material performance evaluation.
Following fatigue testing, fractography analysis was conducted using a JEOL JSM-6480 (JEOL Ltd., Tokyo, Japan) Scanning Electron Microscope (SEM) operating in Back-Scatter Electron (BSE) mode at 10 kV accelerating voltage with magnifications up to 1500× to systematically investigate fatigue failure mechanisms in the as-built WAAM material. The BSE imaging’s superior compositional contrast enabled detailed characterization of crack initiation sites, particularly revealing how surface irregularities, subsurface porosity clusters, and localized lack-of-fusion defects acted as preferential nucleation points for fatigue cracks.

2.7. Fatigue Data Evaluation

The experimental fatigue test results were systematically evaluated through stress-life (S-N) analysis following International Institute of Welding (IIW) guidelines for welded components [14]. As all specimens were tested to complete failure, the primary relationship between applied stress range (Δσ) and cycles to failure (Nf) was established through double logarithmic regression analysis. The fundamental S-N power law relationship [15].
N f = C / σ m
was linearized for statistical treatment as:
log N f = log C m . log N f
where m represents the inverse slope of the S-N curve and C is the fatigue capacity coefficient. Three characteristic slope values were investigated: the experimentally derived regression slope, along with the IIW-recommended values of m = 3 and m = 5 for comparative analysis [14]. Following IIW recommendations for achieving 95% survival probability at two-sided 95% confidence levels. The IIW guidelines recommend testing at minimum two stress levels between 104–106 cycles, with the derived FAT class indicating the permissible nominal stress range at 2 × 10⁶ cycles under these reliability conditions. Complementary analysis using Basquin’s equation
σ a = σ f 2 N f b
provided additional characterization of the fatigue strength coefficient (σf′) and exponent (b), enabling direct comparison with published WAAM material data. This multi-faceted approach allowed comprehensive evaluation of both the as-built surface effects on intrinsic material fatigue behaviour.

3. Numerical Modelling

3.1. Developing 2D and 3D FE Models

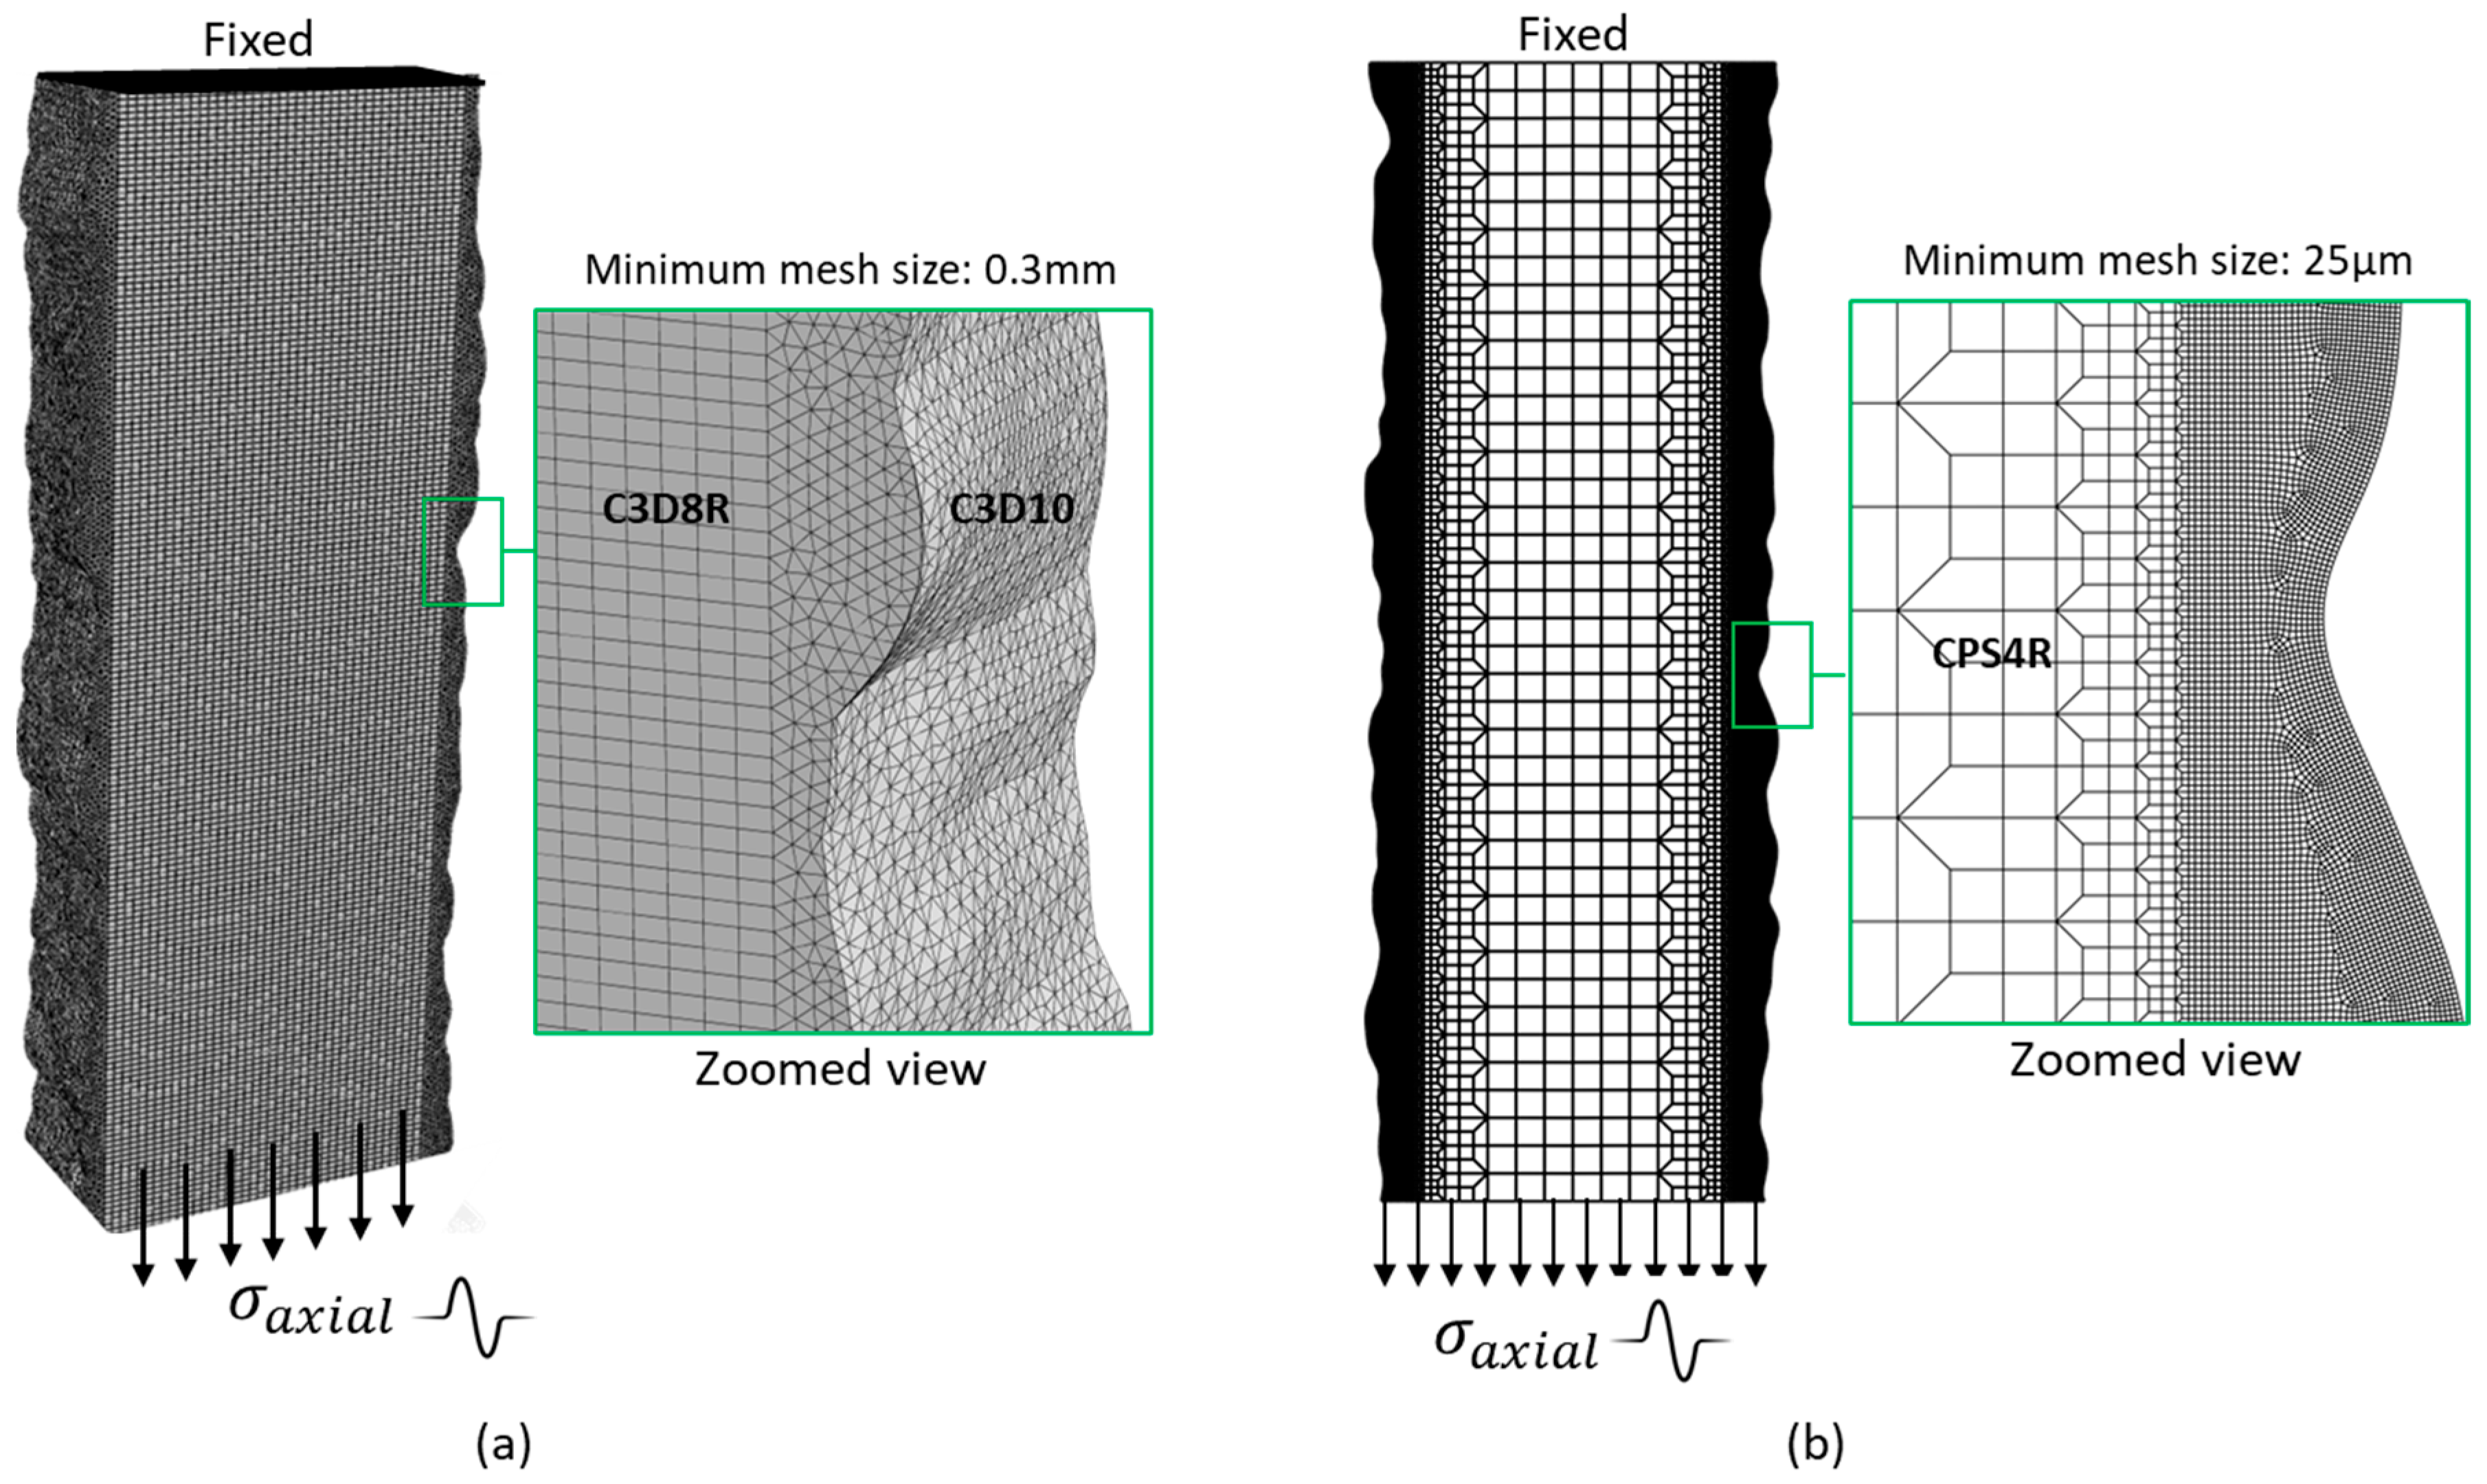
The digitized CAD models of scanned specimens were imported into ABAQUS 2022 software to develop both 2D and 3D FE models, as shown in Figure 5a,b, with the primary objective of identifying critical stress concentration valleys along specimen edges where fatigue failure initiation was predicted to occur. For the 3D modelling approach, the fatigue loading was applied as a tensile stress calculated from the maximum test force divided by the average cross-sectional area using a linear elastic material model (E = 210 GPa, ν = 0.3) with ramp amplitude boundary conditions that replicated the experimental minimum and maximum loads.
The meshing strategy employed second-order tetrahedral elements (C3D10) with a 0.3 mm global seed size near the irregular edges to capture surface topography effects, transitioning to hexahedral elements (C3D8R) in the specimen’s central region through default free meshing algorithms, while boundary conditions constrained one end fully and permitted only longitudinal displacement at the loaded end. To assess computational efficiency trade-offs, comparative 2D plane stress models were developed to process sliced specimen sections, implementing a refined meshing approach with element sizes gradually transitioning from 25 μm at critical edges to coarser elements in the central region. This optimized scheme accounted for the specimen’s high length-to-thickness ratio while maintaining solution accuracy, with loading and boundary conditions applied consistently with the 3D models as illustrated in Figure 5, enabling direct comparison of stress concentration predictions and computational resource requirements between modelling approaches. Moreover, the locally refined mesh was applied at the specimen edges to capture the steep stress gradients associated with geometrical irregularities. This approach reflects the general principle for modelling notch effects that the element size must be sufficiently fine to resolve local stress concentrations yet not excessively refined to avoid numerical artefacts and unnecessary computational effort.

3.2. Multiaxial Fatigue Life Estimation Criterion

The developed finite element models provided local stress distribution data that enabled fatigue life prediction for as-built WAAM components through implementation of the Smith-Watson-Topper (SWT) critical plane criterion, a multiaxial fatigue damage model that accounts for combined stress–strain effects by evaluating the product of maximum normal stress ( σ n , m a x ) and strain amplitude ( ε /2) on the critical plane [16]. This physics-based approach overcomes limitations of conventional stress-based methods by simultaneously considering both the driving force for crack initiation (through strain amplitude) and the influence of mean stresses (through maximum normal stress), making it particularly suitable for analyzing WAAM components with their characteristic surface topography and process-induced residual stresses. The SWT damage parameter was calculated at each material point using the FE-derived stress/strain histories, with the maximum value identifying the most probable failure location. The corresponding number of cycles to failure was computed by integration with the material-specific fatigue properties calibrated for WAAM steel. Therefore, the fatigue lifetime was estimated using the following formulation [16].
σ n , m a x ε 2 = ϵ f σ f 2 N f b + c + σ f 2 E 2 N f 2 b
where ε f and σ f are the fatigue ductility and strength coefficients, respectively, b and c denote the fatigue strength and ductility exponents, E is Young’s modulus, and Nf is the predicted cycles to failure. This physics-based approach was computationally implemented via a Python 3.10 routine in ABAQUS 2022 software which automatically identified critical plane orientations through coordinate transformation of stress/strain tensors, calculated the damage parameter using a moving window algorithm across all potential planes, with particular attention to surface roughness-induced stress gradients in the as-built WAAM specimens [17,18]. The material parameters ( ε f = 0.56, σ f = 1413.7 MPa, b = −0.163, c = −0.48) were calibrated against fatigue data for WAAM steel from reference [19], accounting for characteristic process-induced anisotropies and typical defect distributions observed in prior microstructural analysis.

4. Results and Discussion

4.1. Reverse Engineering and Evaluation of As-Built Surface Topography

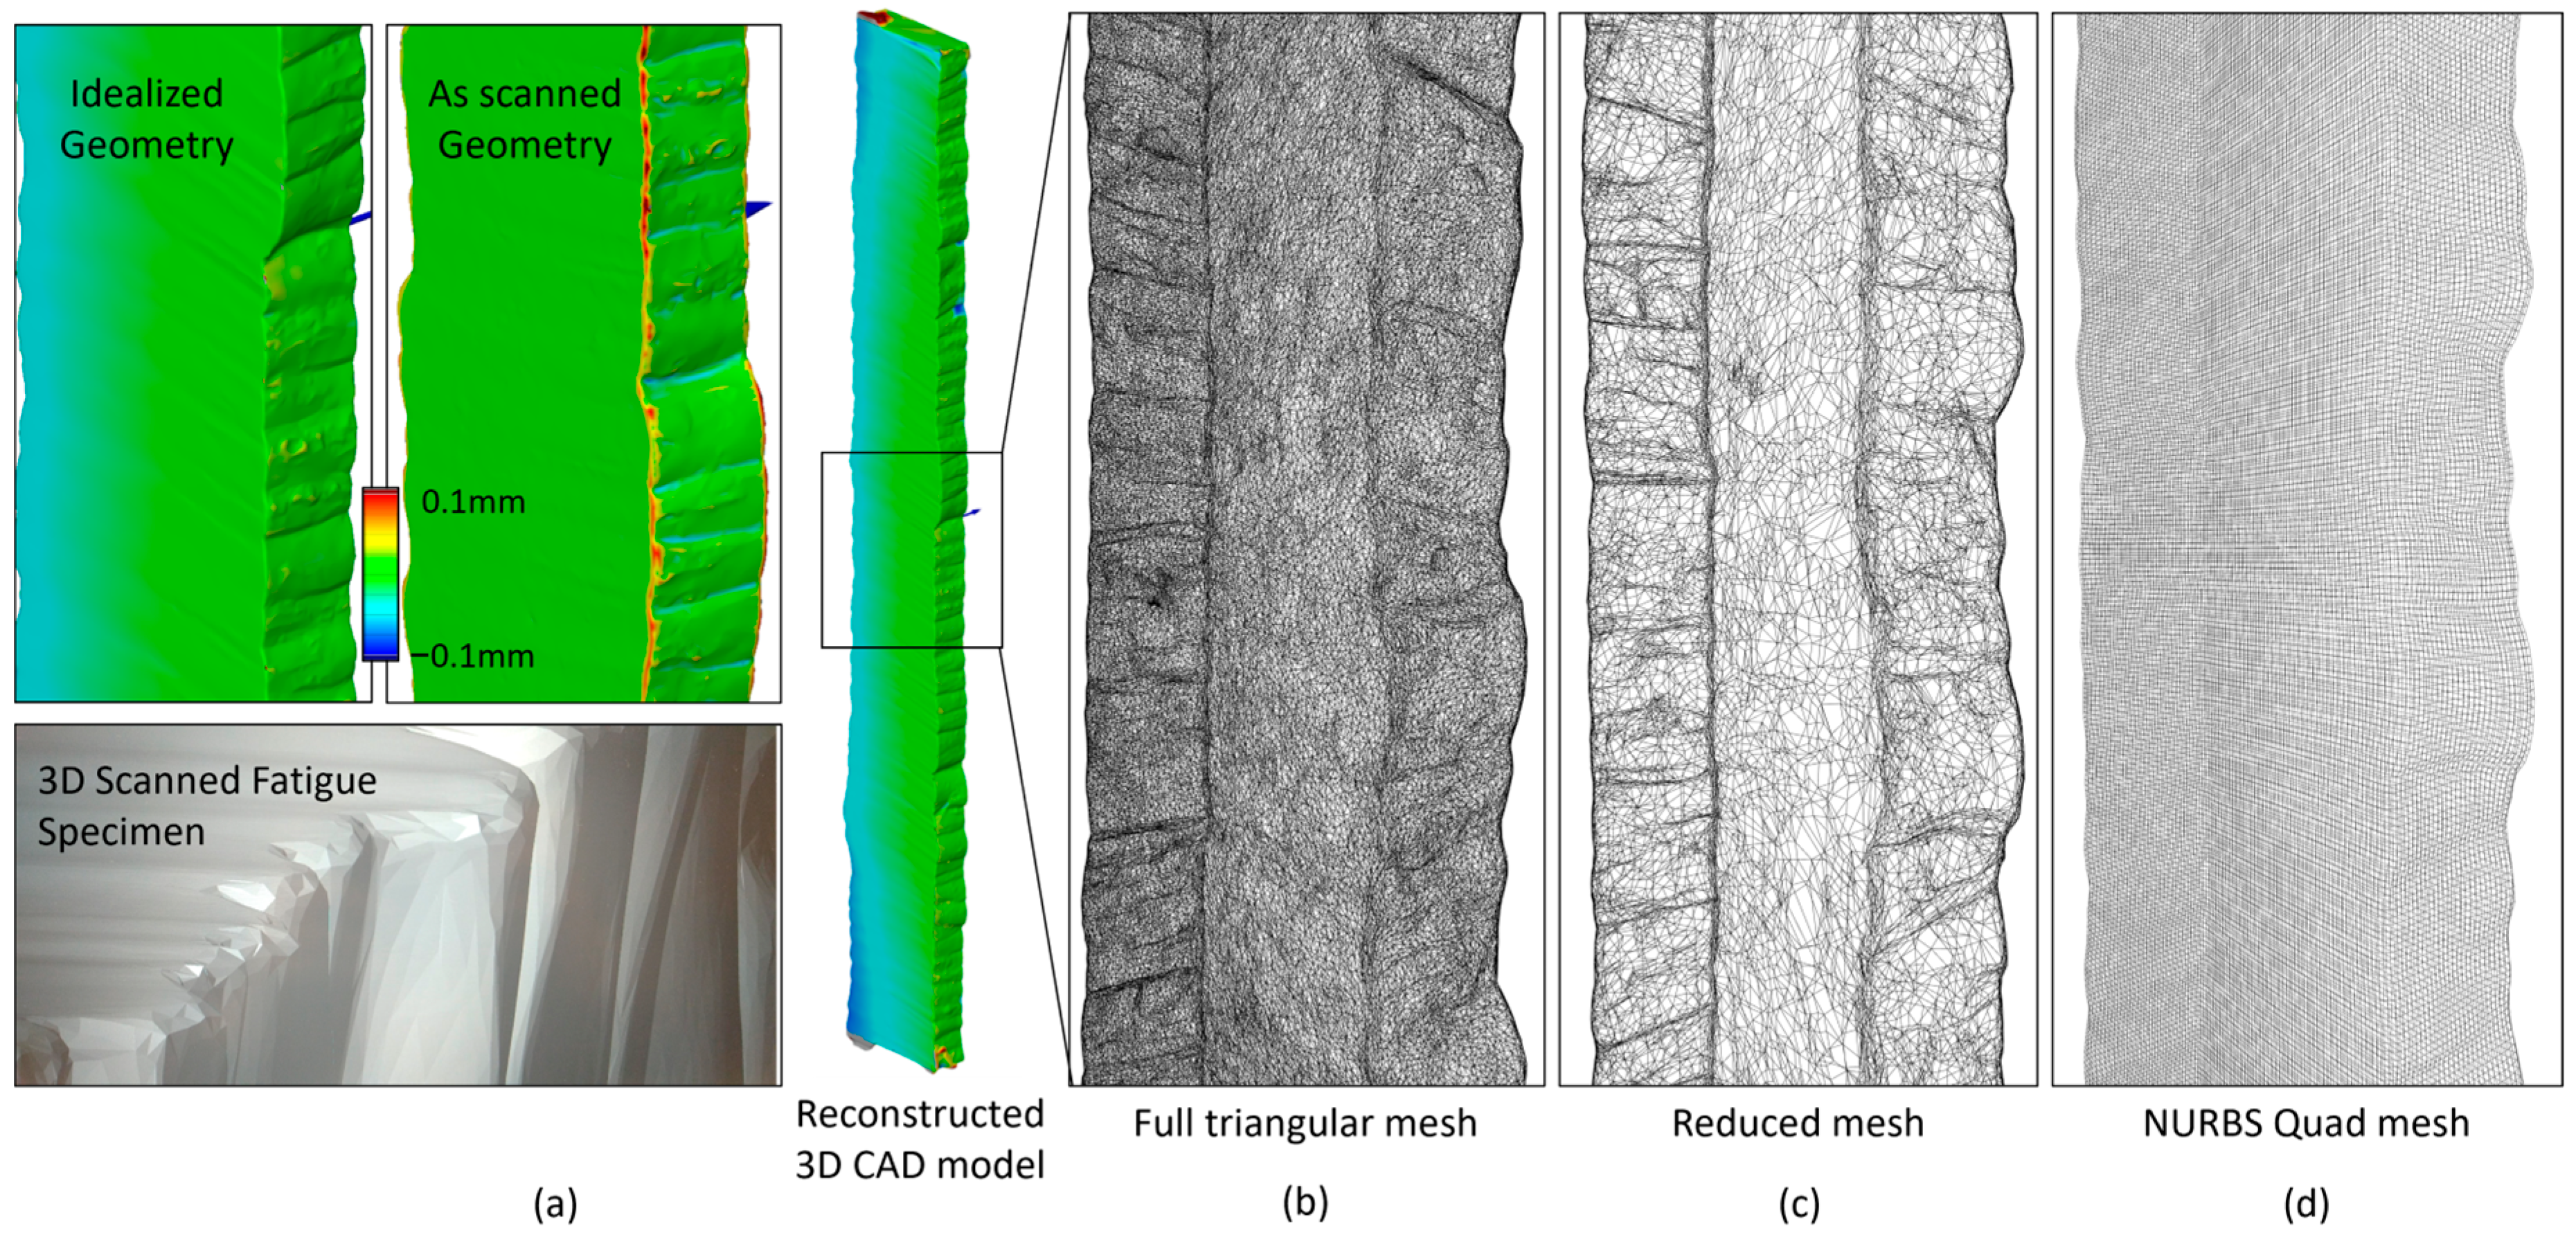
It was observed that increasing the edge length leads to a noticeable reduction in geometric detail. To evaluate reconstruction accuracy, several scanned as-built WAAM specimens and their corresponding NURBS-based models were imported into GOM Inspect, aligned, and compared through surface deviation analysis. These evaluations revealed that an average edge length between 0.25 mm and 0.30 mm offers an optimal trade-off between geometric fidelity and file size, resulting in a sufficiently accurate surface representation with STL files averaging around 150 megabytes. Although increasingly fine resolutions (e.g., 0.1 mm) may offer marginal accuracy improvements, they are not recommended due to the scanner’s accuracy limit of 0.08 mm and the substantial increase in file size. The same methodology was applied to compare the idealized geometry with the as-scanned geometry of fatigue specimen FTS-11, extracted from the WAAM block, as shown in Figure 6a. To facilitate the use of the 3D scanned models, the rounded edges of the as-scanned part were modified to create an idealized geometry, which was then used for the 3D FE analysis. Figure 6b–d compare the irregular triangular mesh, the mesh simplified for processing, and the quad-mesh-based NURBS model.
Table 4 shows the surface topography analysis to evaluate the variation in several surface topography parameters for all specimens. It was observed that Wa values ranged from 0.055 mm to 0.141 mm, with a median of 0.086 mm. The Wz parameter ranged from 0.312 mm to 0.767 mm, with a median of 0.473 mm. Other roughness indicators, such as Wq, varied between 0.076 mm and 0.182 mm, with an interquartile range (IQR) from 0.094 mm to 0.147 mm. As expected, the Wq values were slightly higher than the Wa values across all specimens, reflecting the influence of peak-to-valley fluctuations in the surface profiles.
The overall distribution of these parameters indicates that the as-built surfaces are relatively rough. The relatively large Wz values suggest the presence of pronounced valleys and peaks, while the difference between Wa and Wq highlights the contribution of sharp asperities to the surface morphology. Based on this surface roughness assessment, it can be concluded that even under low fatigue load levels, the presence of such valleys can induce substantial stress concentrations, potentially serving as initiation sites for fatigue failure.

4.2. Tensile Properties

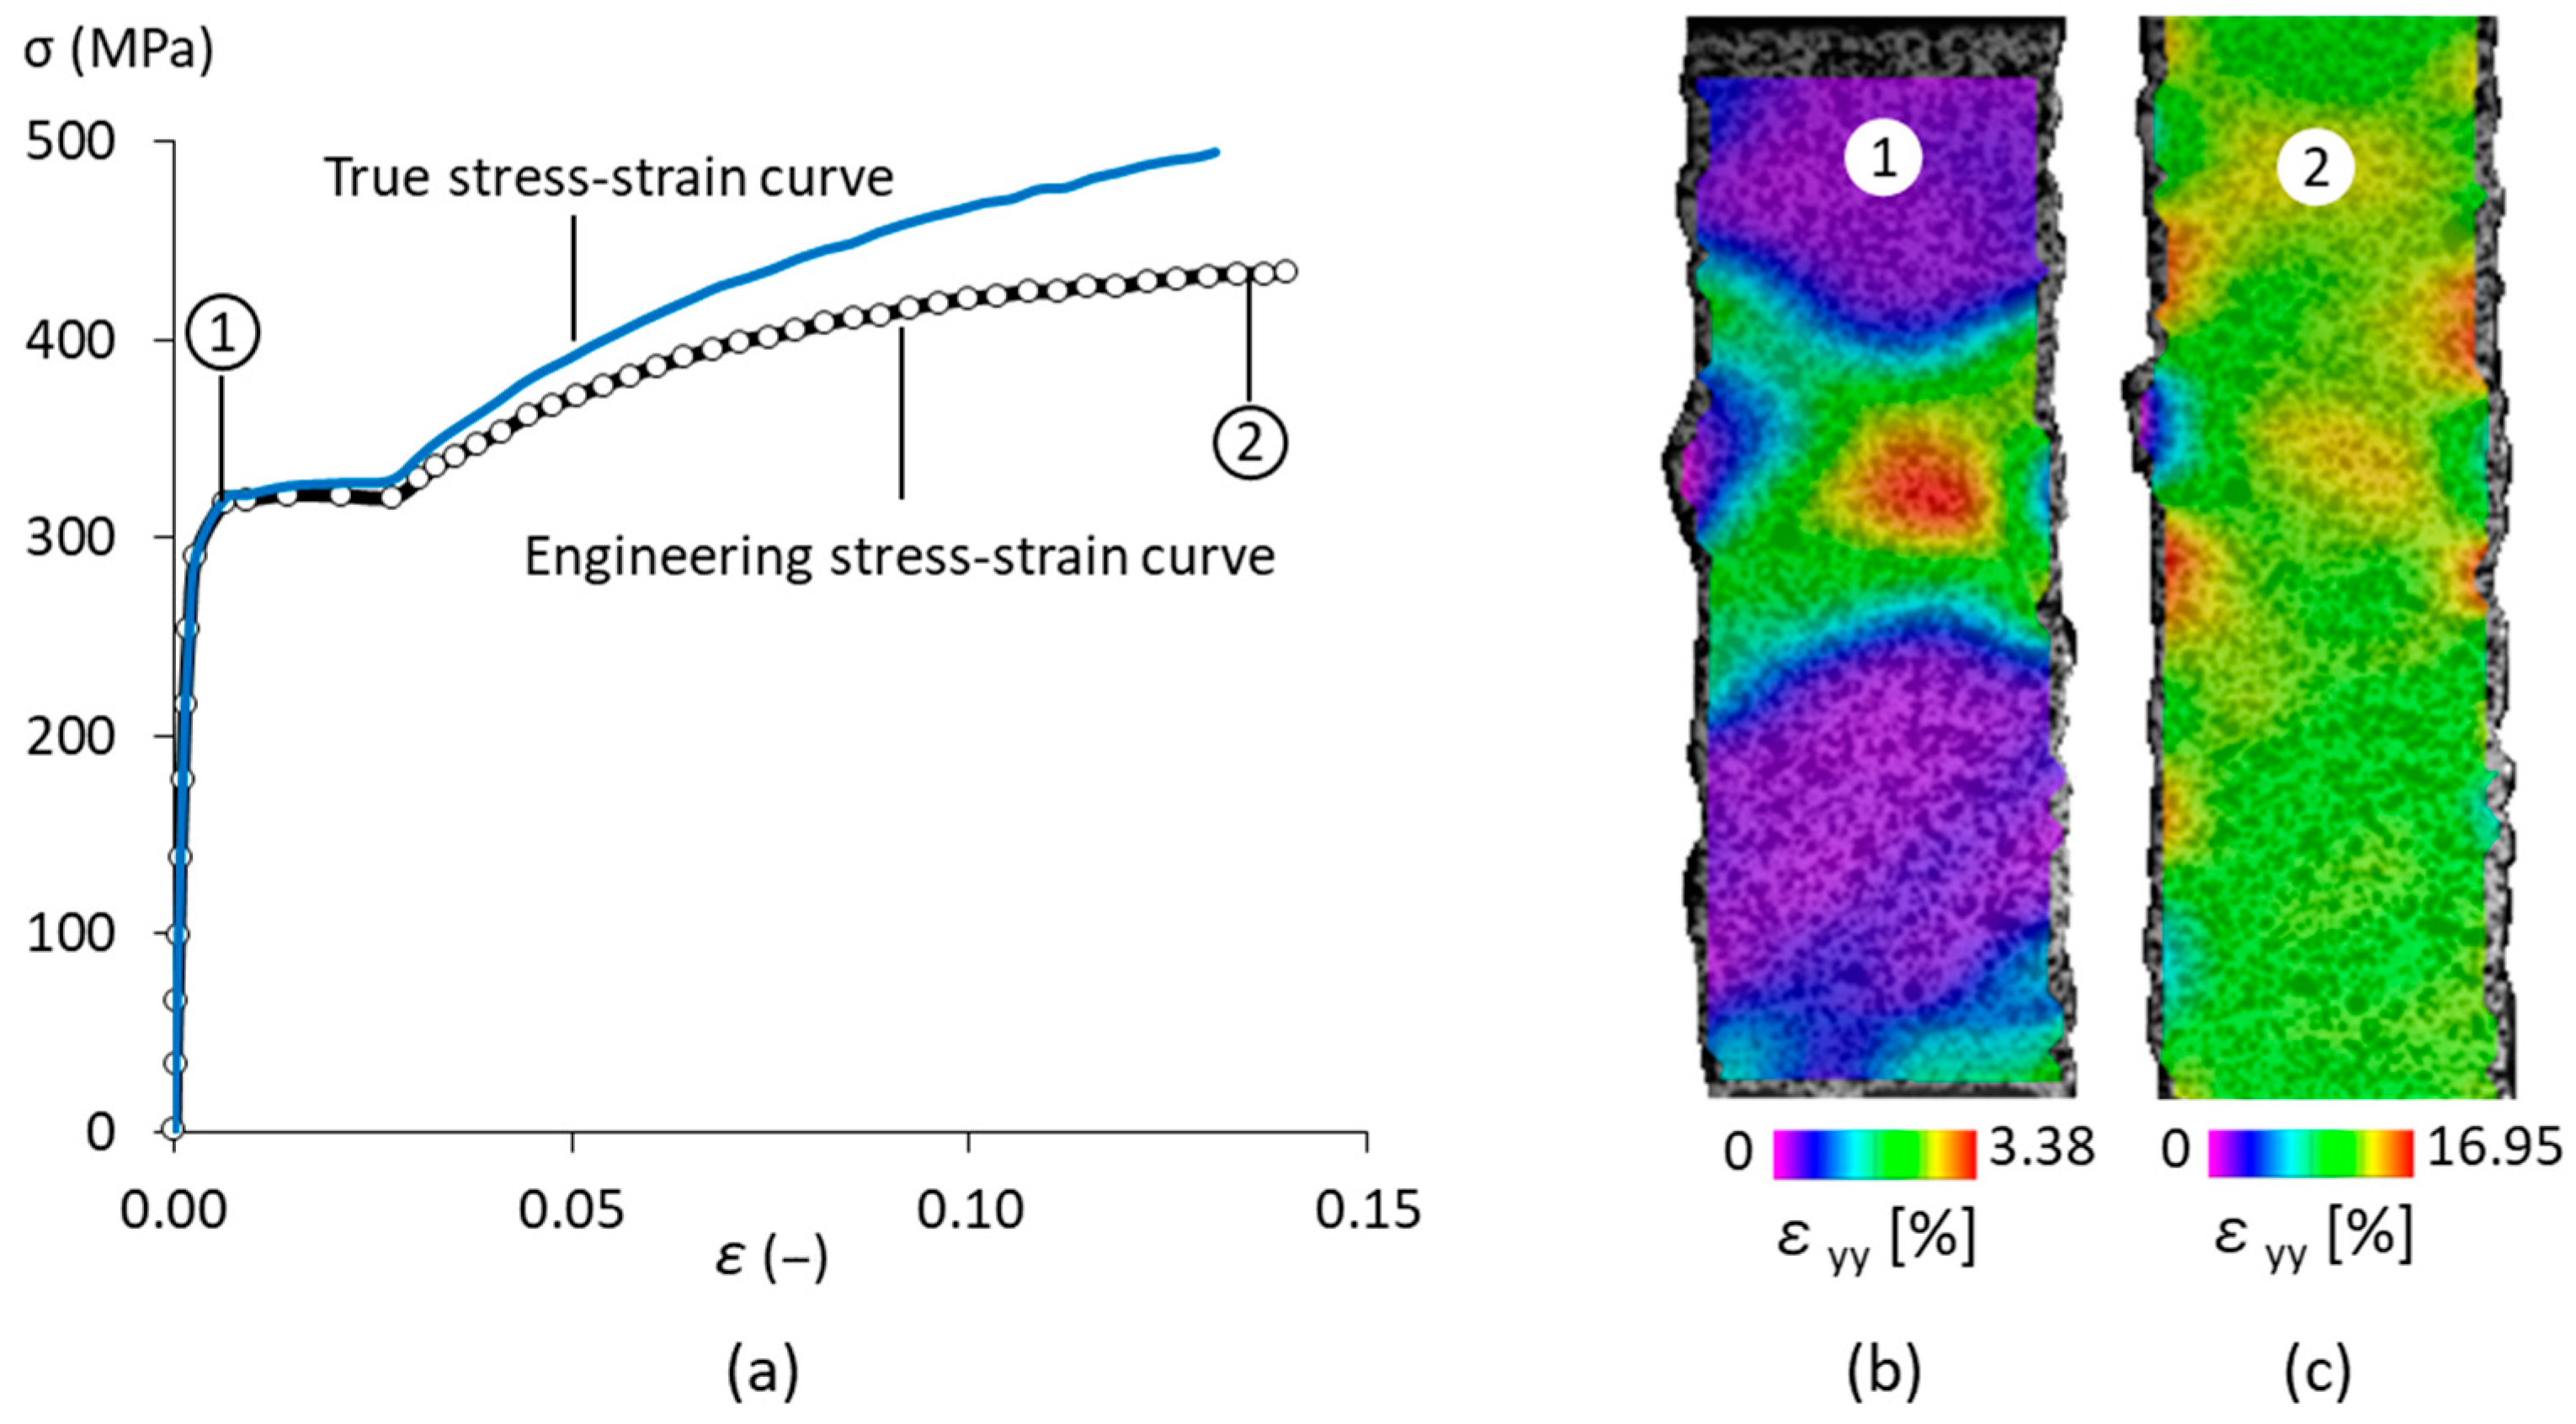
Figure 7 shows the obtained stress–strain progression of the DIC tensile specimen and the graphical conversion to its true form. From Figure 7b it can be deduced that the applied force was quite uniform, while in Figure 7c the stress concentrations around single valleys start to become more clear, with local strain values up to 17%. The tensile test results as shown in Figure 7 and Table 5 which are in good agreement with data from literature [19].

4.3. Fatigue Experiments and Fractography

Figure 8 illustrates the S-N, nominal stress range (Δσ)-life ( N f , e x p ), curve constructed from the fatigue test results summarized in Table 6.
Summary of fatigue test results for as-built WAAM specimens. The observed results are also compared with the fatigue performance of as-built G3Si1 material reported in the literature [19,20]. The line shown in the figure represents the estimated fatigue strength classification (FAT class), calculated using the standard inverse slope of 5, as recommended by the IIW [14]. The FAT class is defined as the stress range at which a component can endure 2 million load cycles with a 95% survival probability under constant amplitude loading. Based on this methodology, a FAT class of 111 MPa was determined for the tested specimens, implying that they are expected to survive at least 2 million cycles under a stress amplitude of 55 MPa, with a high degree of statistical confidence.
Moreover, it is important to note that the IIW framework was originally developed for welded joints, based on assumptions concerning weld geometry, residual stresses, and typical imperfections associated with conventional welding processes. In the absence of a widely accepted fatigue classification standard for WAAM or other additive manufacturing processes, the FAT class was applied by analogy to WAAM parts as a conservative reference, an approach that has proven effective in previous studies [6,17].
Additionally, a regression analysis was performed on the experimental data to determine the actual inverse slope of the S-N curve, reflecting the observed fatigue behaviour of the material more accurately. This analysis yielded a slightly lower inverse slope of 4.8. As a result, the corresponding FAT class derived from the natural trend of the data was slightly lower as well, 108 MPa. While this deviation is relatively small, it highlights the importance of experimental validation, as actual material performance may differ from standard assumptions depending on factors such as surface condition, internal defects, and process-induced residual stresses.
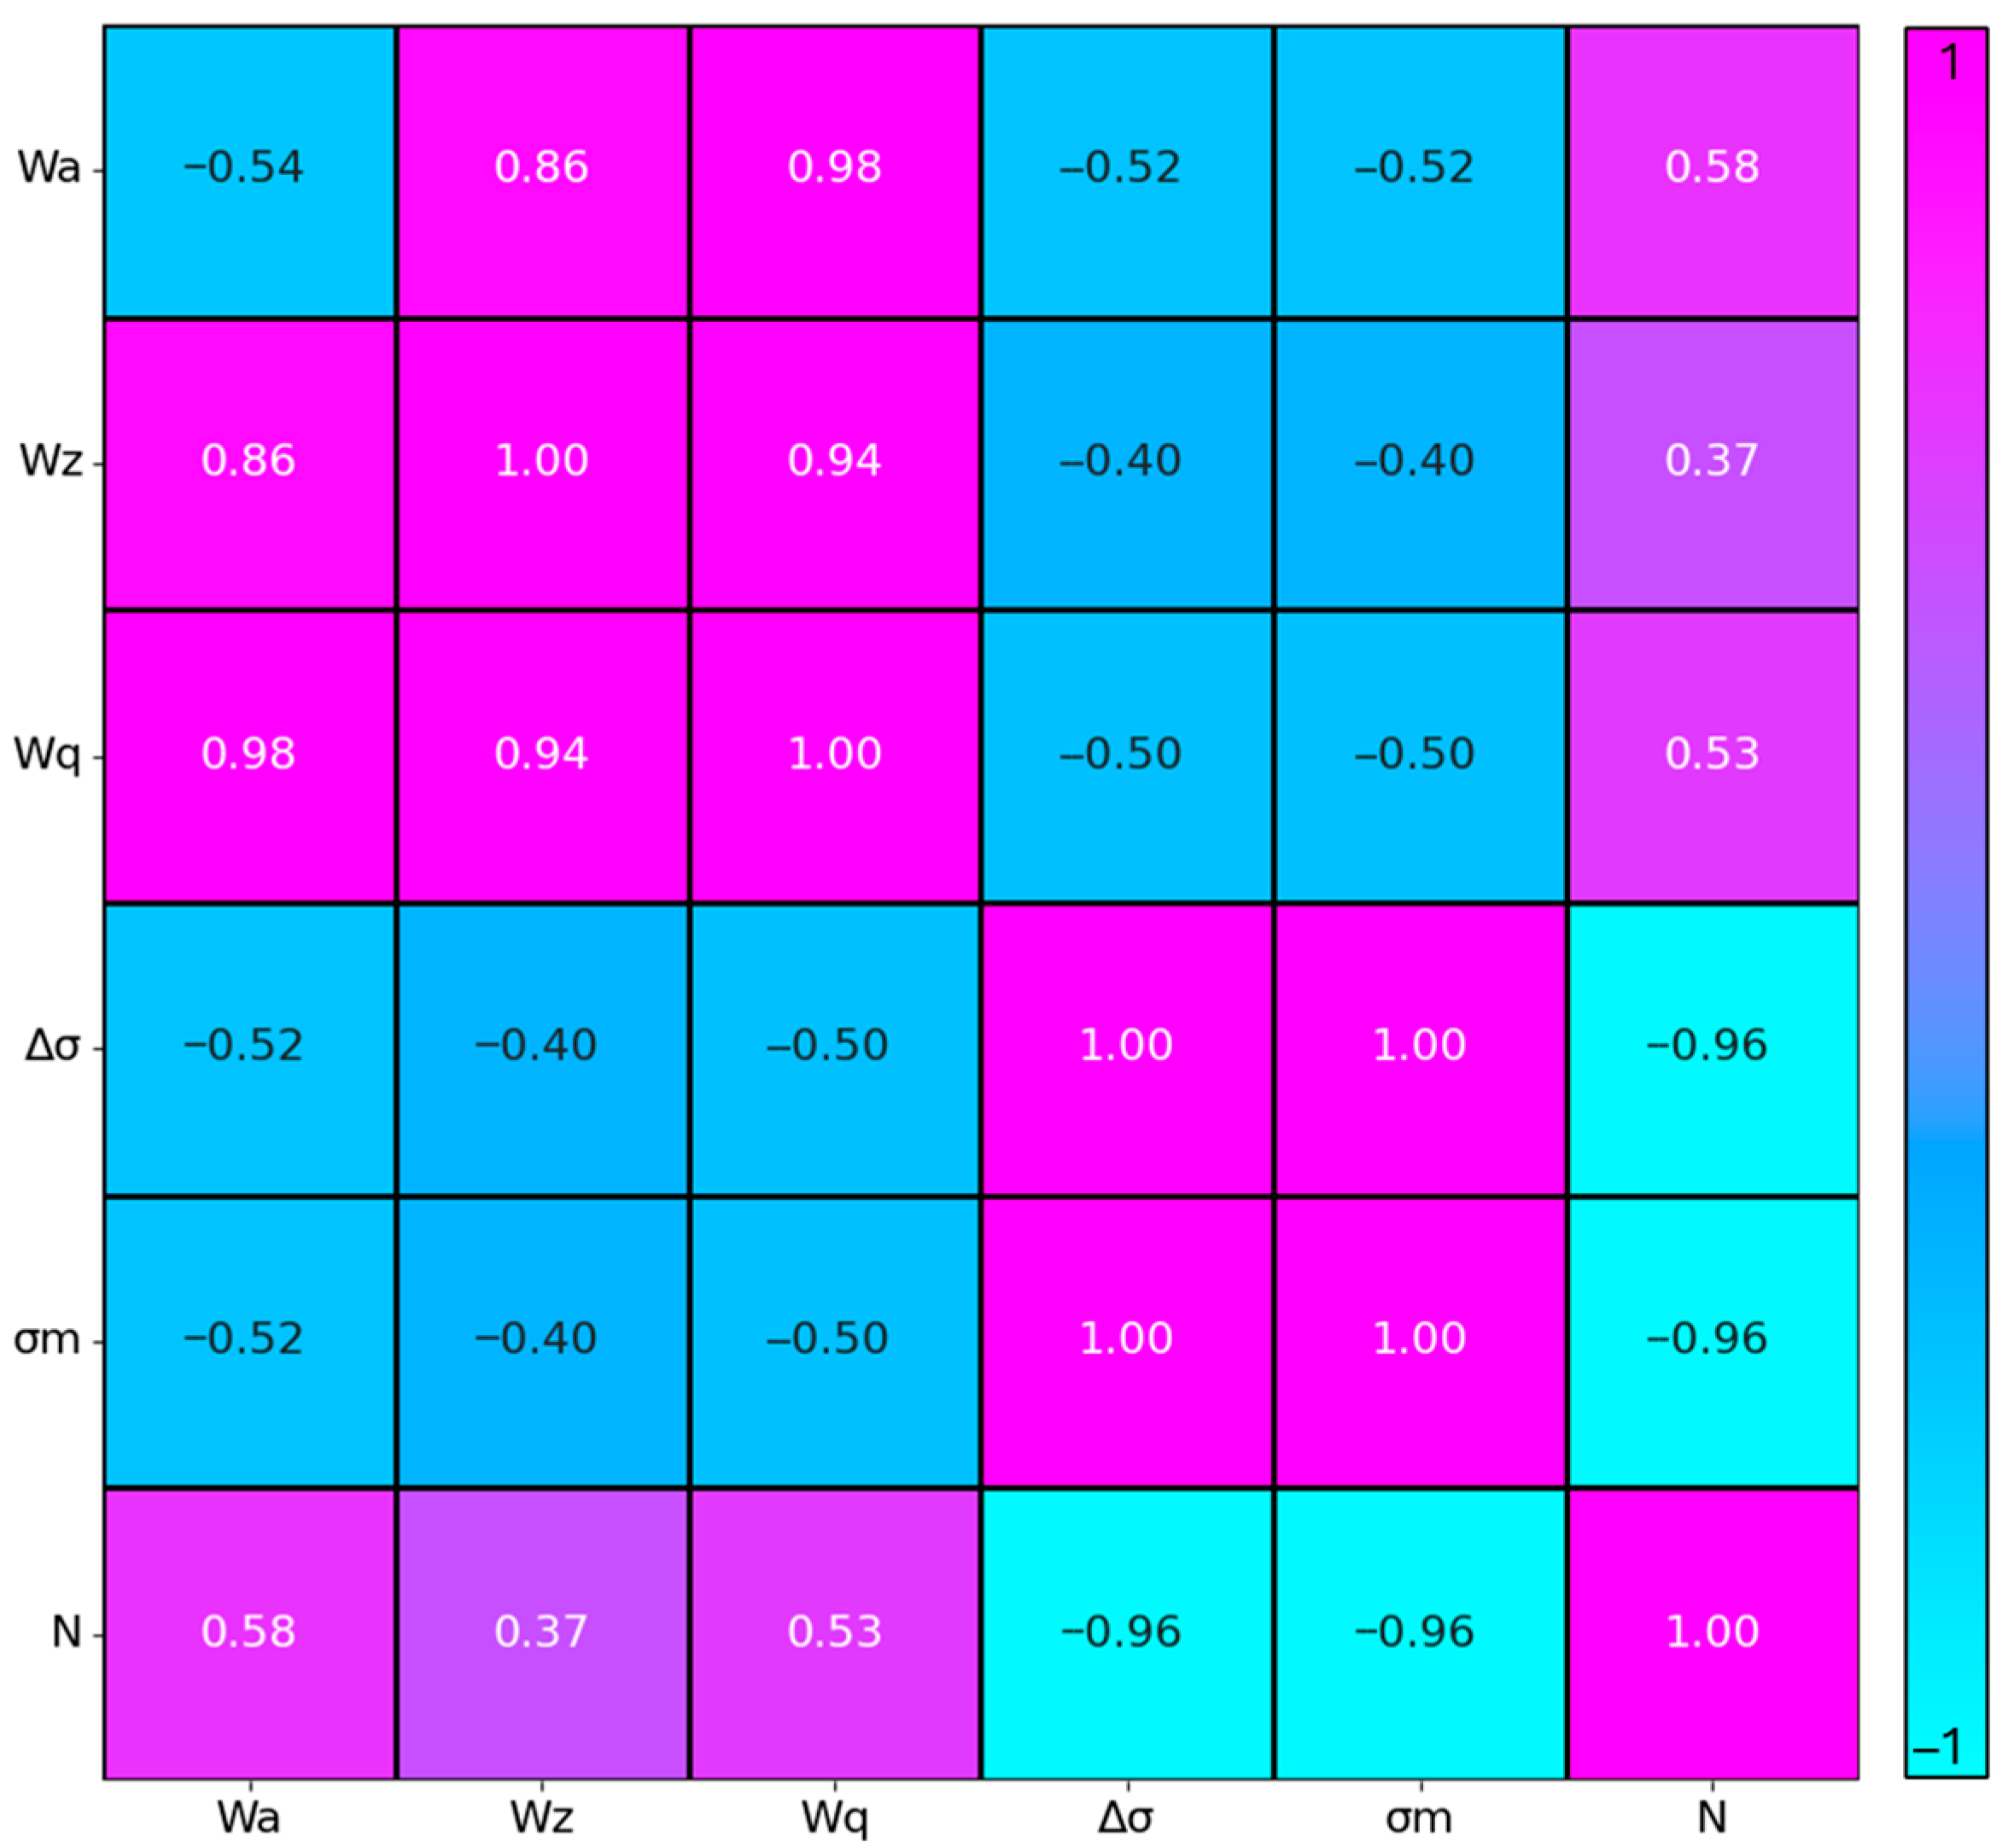
Figure 9 shows Pairwise correlation matrix which reveals observed relationships between surface topography parameters, waviness parameters, and fatigue variables (Δσ, σm, N).
In terms of stress amplitude relationships, negative correlations are found with waviness parameters, Wa (−0.52), Wq (−0.50), and Wz (−0.40), implying that components with higher waviness tolerated lower stress amplitudes. Looking at cycles to failure (N), a strong negative correlation with stress amplitude (−0.96) is evident, as expected. Positive correlations with waviness parameters, Wa (0.58), Wq (0.53), and Wz (0.37), suggest that wavier surfaces achieved longer fatigue lives at given stress levels. In stress amplitude-specific interpretations, specimens tested at higher Δσ exhibited systematically lower waviness parameters, as reflected in the negative correlations of Wa, Wq, and Wz.
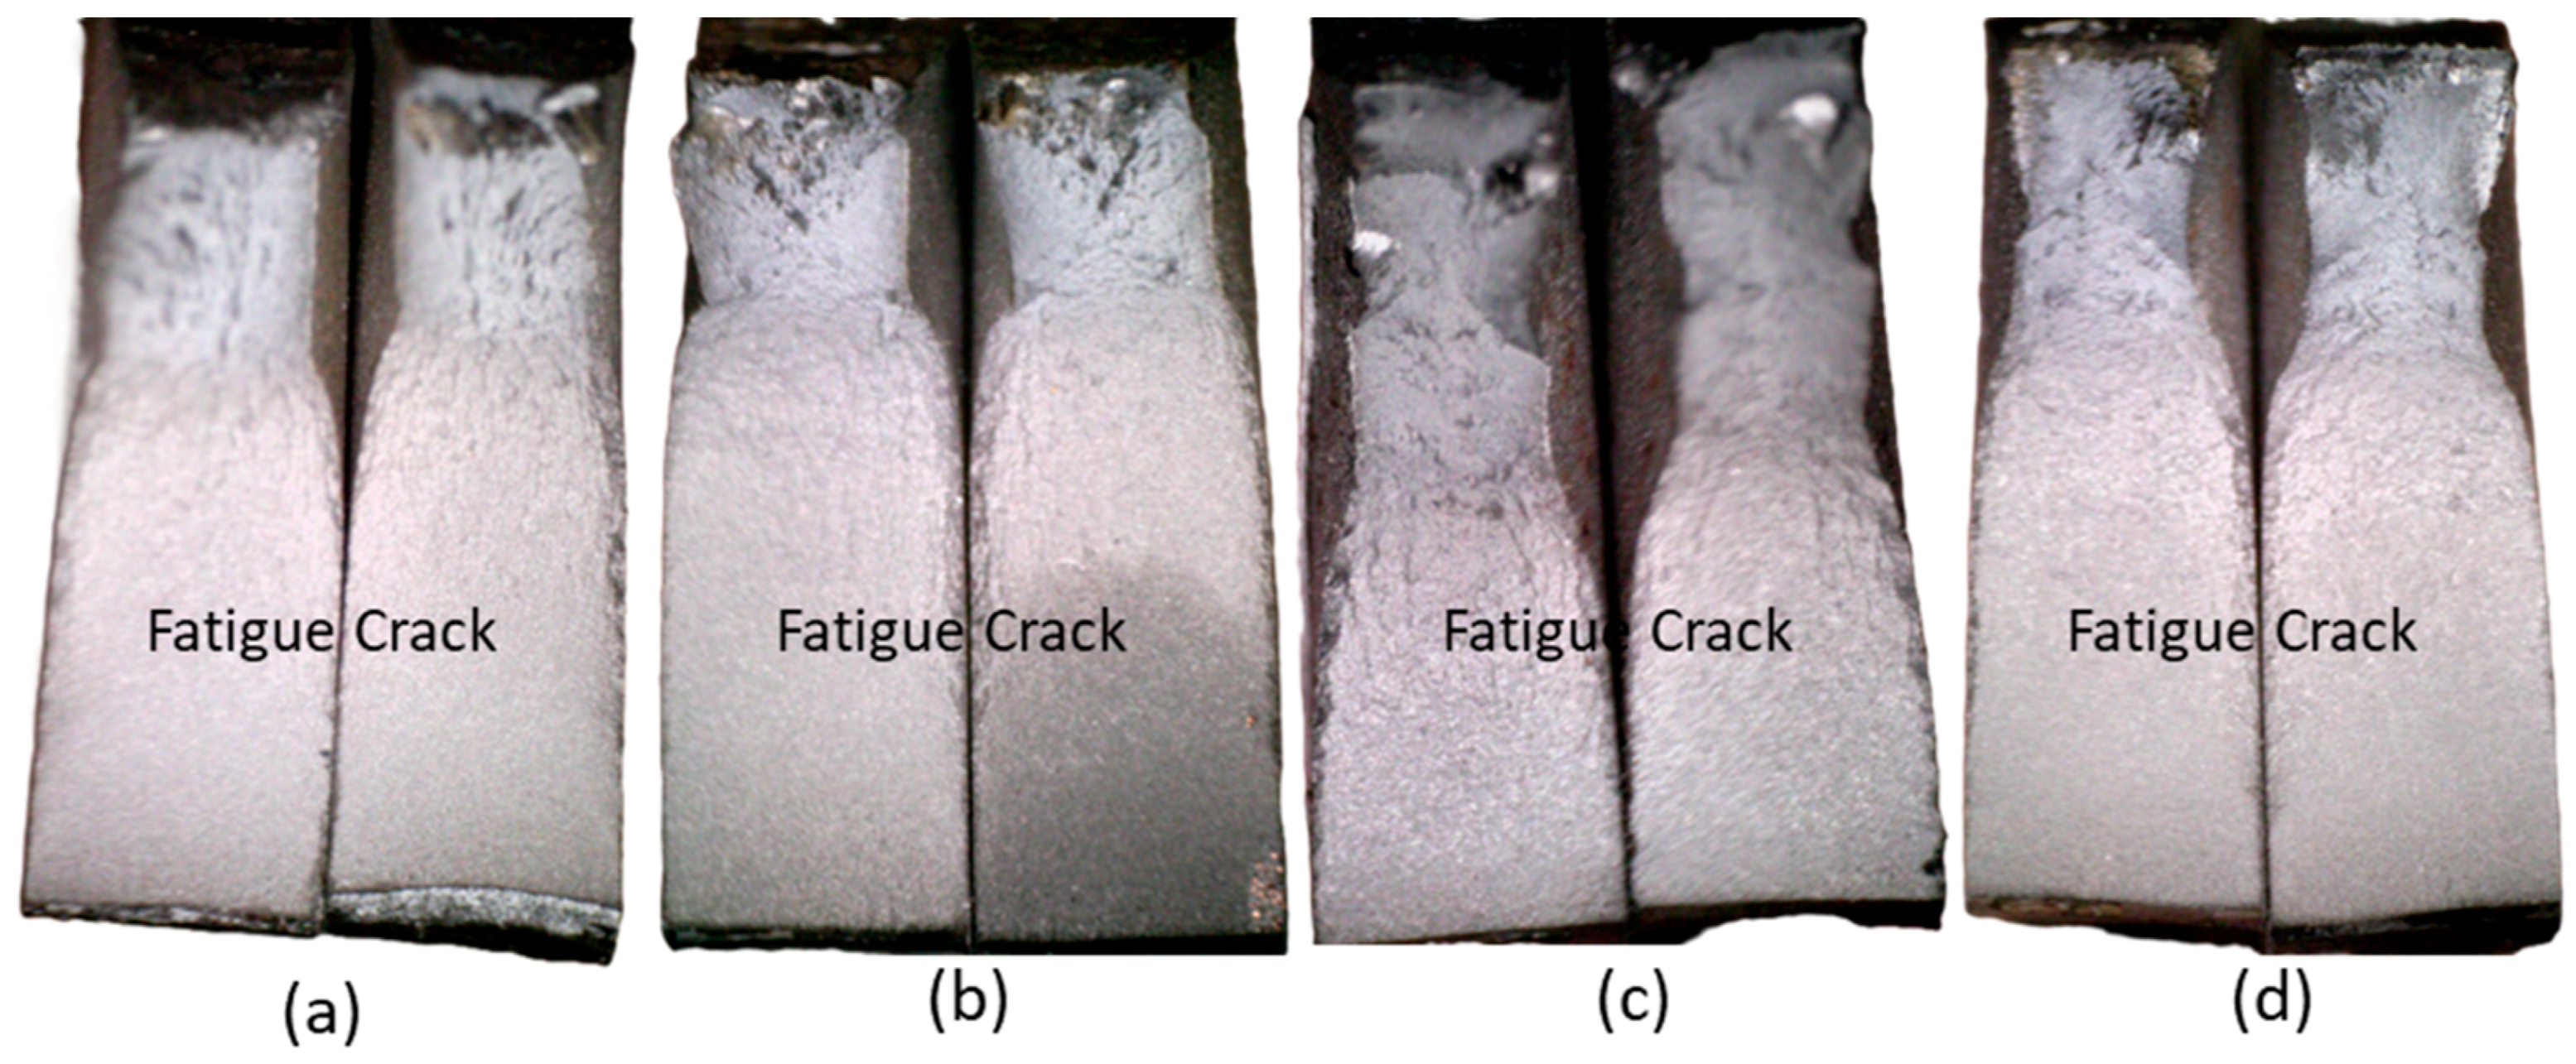
Optical microscopy analysis reveals two distinct regions on the fracture surface: a fine, bright grain morphology indicating the initiation and propagation zone, and a darker region with coarser grains and tensile fracture zone, representing plastic deformation at the end of the specimen’s lifespan, as shown in Figure 10. Upon examining the fracture surface, it can be concluded that FTS-3 experienced a higher load than FTS-10 and FTS-11, as shown in Figure 10a–c, respectively. This assumption is supported by the fact that the plastic region of FTS-3 constitutes approximately 46% of the total fracture surface area, compared to around 34% for FTS-11. Additionally, it was observed that cracks initiated at the as-built surface, acting as stress raisers, which aligns with common fractographic observations in fatigue failure case studies.
The examination of propagation zones showed distinctive fatigue striation patterns; the spacing and morphology provided quantitative insights into crack growth rates under cyclic loading, while secondary electron imaging complemented the analysis by highlighting topographical features of the fracture surface.
Of particular significance was the identification of oxide inclusions and microstructural heterogeneities along prior beta grain boundaries that significantly influenced crack path deviation and propagation kinetics. The fractography evidence directly correlated with the observed stress concentration factors from numerical modelling, demonstrating how WAAM process-inherent features like partially melted particle boundaries and gas porosity clusters served as critical stress risers that dominated the fatigue failure mechanisms. This microstructural-level understanding of damage initiation and progression provided essential validation of the macroscopic fatigue test results while offering specific targets for future process optimization to improve the fatigue resistance of WAAM components.
Figure 11 provides an overview of the distinct fracture regions of specimen FTS-11 and is composed of three individual SEM images. Region I corresponds to the crack initiation and propagation zone, where fatigue cracks are observed to have originated from multiple sites along the as-built surface. These cracks coalesced during propagation, as evidenced by the presence of ratchet marks (highlighted in yellow), which indicate accelerated crack growth and ultimately contributed to premature failure. Within this region, inclusions and voids are visible, acting as stress concentrators that promote both crack initiation and growth. In the upper middle image, fatigue striations are faintly visible in the vicinity of impurities, further suggesting localized cyclic damage. The lower middle image reveals a crack originating from a specimen corner, with nearby impurity likely contributing to the initiation process. The upper right image displays a ductile fracture surface, while the lower right image highlights the presence of spherical dimples, features typical of a final rapid uniaxial tensile overload occurring during the last few fatigue cycles.

4.4. Stress Distribution and Fatigue Lifetime Estimation

Figure 12 illustrates the correlation between the surface topography of the specimen, the stress distribution obtained from the FE model, and the location of fatigue crack initiation. Figure 12a presents a rendered 3D view of the scanned specimen surface, offering a clearer visualization of the topographic features. This detailed rendering enables a more intuitive assessment of surface irregularities that may contribute to stress concentration. In Figure 12b, the identification of critical surface valleys is performed using the ‘inverse prominence’ criterion. This approach consistently highlights the same critical valley across multiple scans, along with several other prominent valleys. The dashed line in the figure represents a point-by-point map of the 3D surface profile, effectively marking the precise positions of these valleys. Figure 12c provides a contour plot of the same surface, offering an alternative representation that complements the 3D view and further emphasizes the depth and distribution of the surface valleys. Finally, Figure 12d displays the von Mises stress distribution derived from the 3D FE model. The region of maximum stress is clearly marked, and notably, this high-stress location corresponds closely with the position of the critical valley identified earlier, suggesting a strong link between surface topography and fatigue crack initiation.
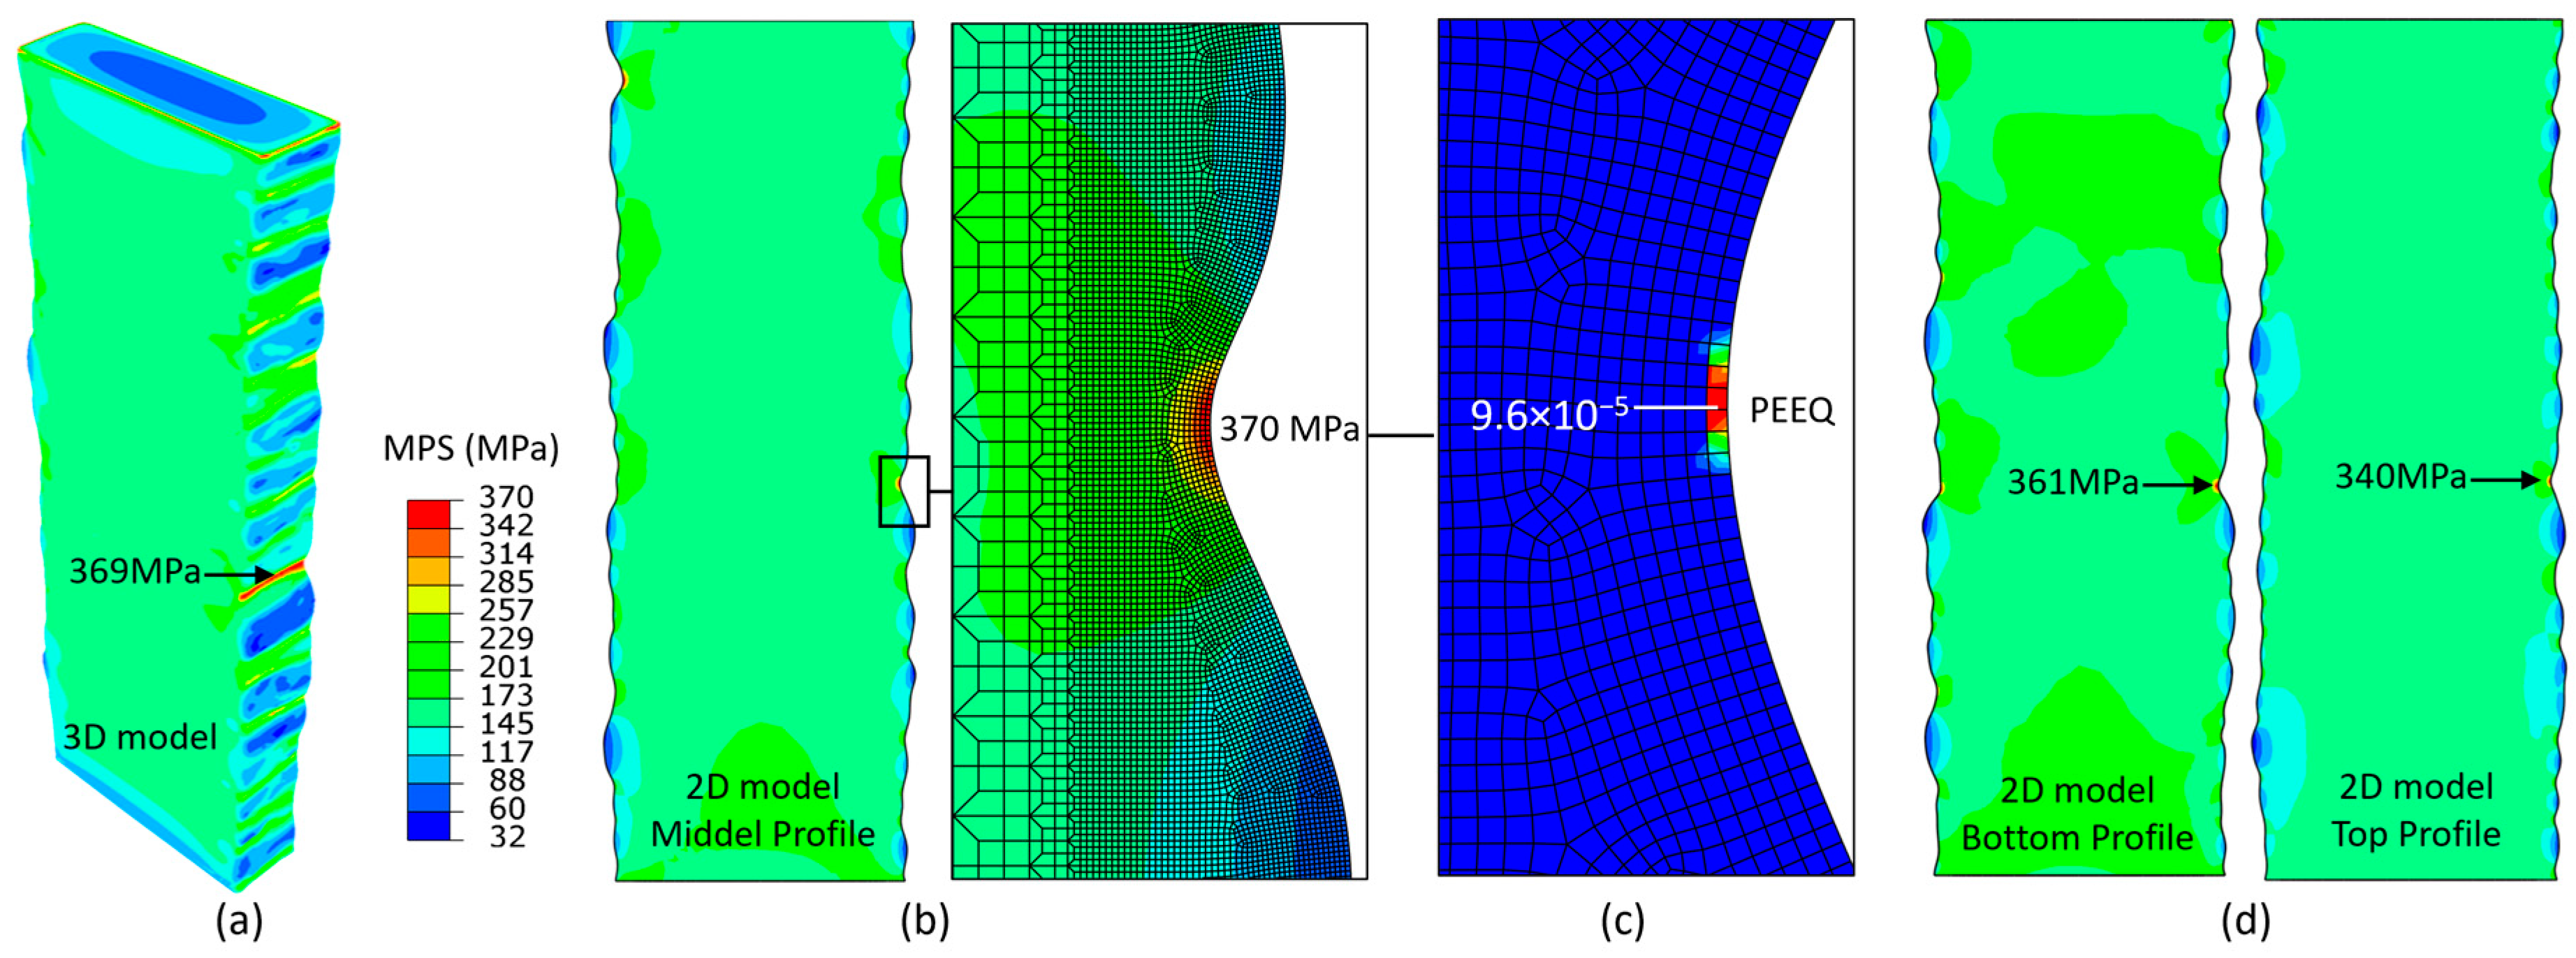
Figure 13 presents a comparative analysis of stress distributions obtained from both 3D and 2D FE models for the FTS-10 fatigue specimen. In Figure 13a, the maximum principal stress (MPS) is shown to be localized at a surface valley on the as-built geometry, reaching a peak value of 369 MPa. This stress concentration aligns with surface irregularities that act as potential fatigue crack initiation sites. When compared to the 2D model in Figure 13b, which uses a surface profile extracted from the mid-plane of the 3D scan, the maximum stress occurs at the same location, with a slightly higher magnitude of 370MPa. This suggests that the 2D model reasonably captures the critical stress behaviour despite the dimensional simplification. Figure 13c shows the distribution of the equivalent plastic strain (PEEQ), indicating that plastic deformation is highly localized at the surface notch. This localized accumulation supports the conclusion that fatigue damage is likely to initiate at geometrically critical surface features rather than through the bulk material.
To further assess the validity of using a 2D mid-plane profile, an extended 2D analysis was conducted to examine stress contours at the top, middle, and bottom surfaces of the 3D scanned specimen. The results, presented in Figure 13d, reveal only minor variations in both overall stress distribution and maximum stress values across these planes. These findings confirm that the mid-plane profile used in the 2D model provides a sufficiently accurate representation of the stress field through the specimen’s thickness. Therefore, the simplification to a 2D contour extracted from the centre plane can be considered a valid and efficient approach for preliminary fatigue assessment and computational modelling of similar WAAM components, as has been observed in previous studies [21,22].
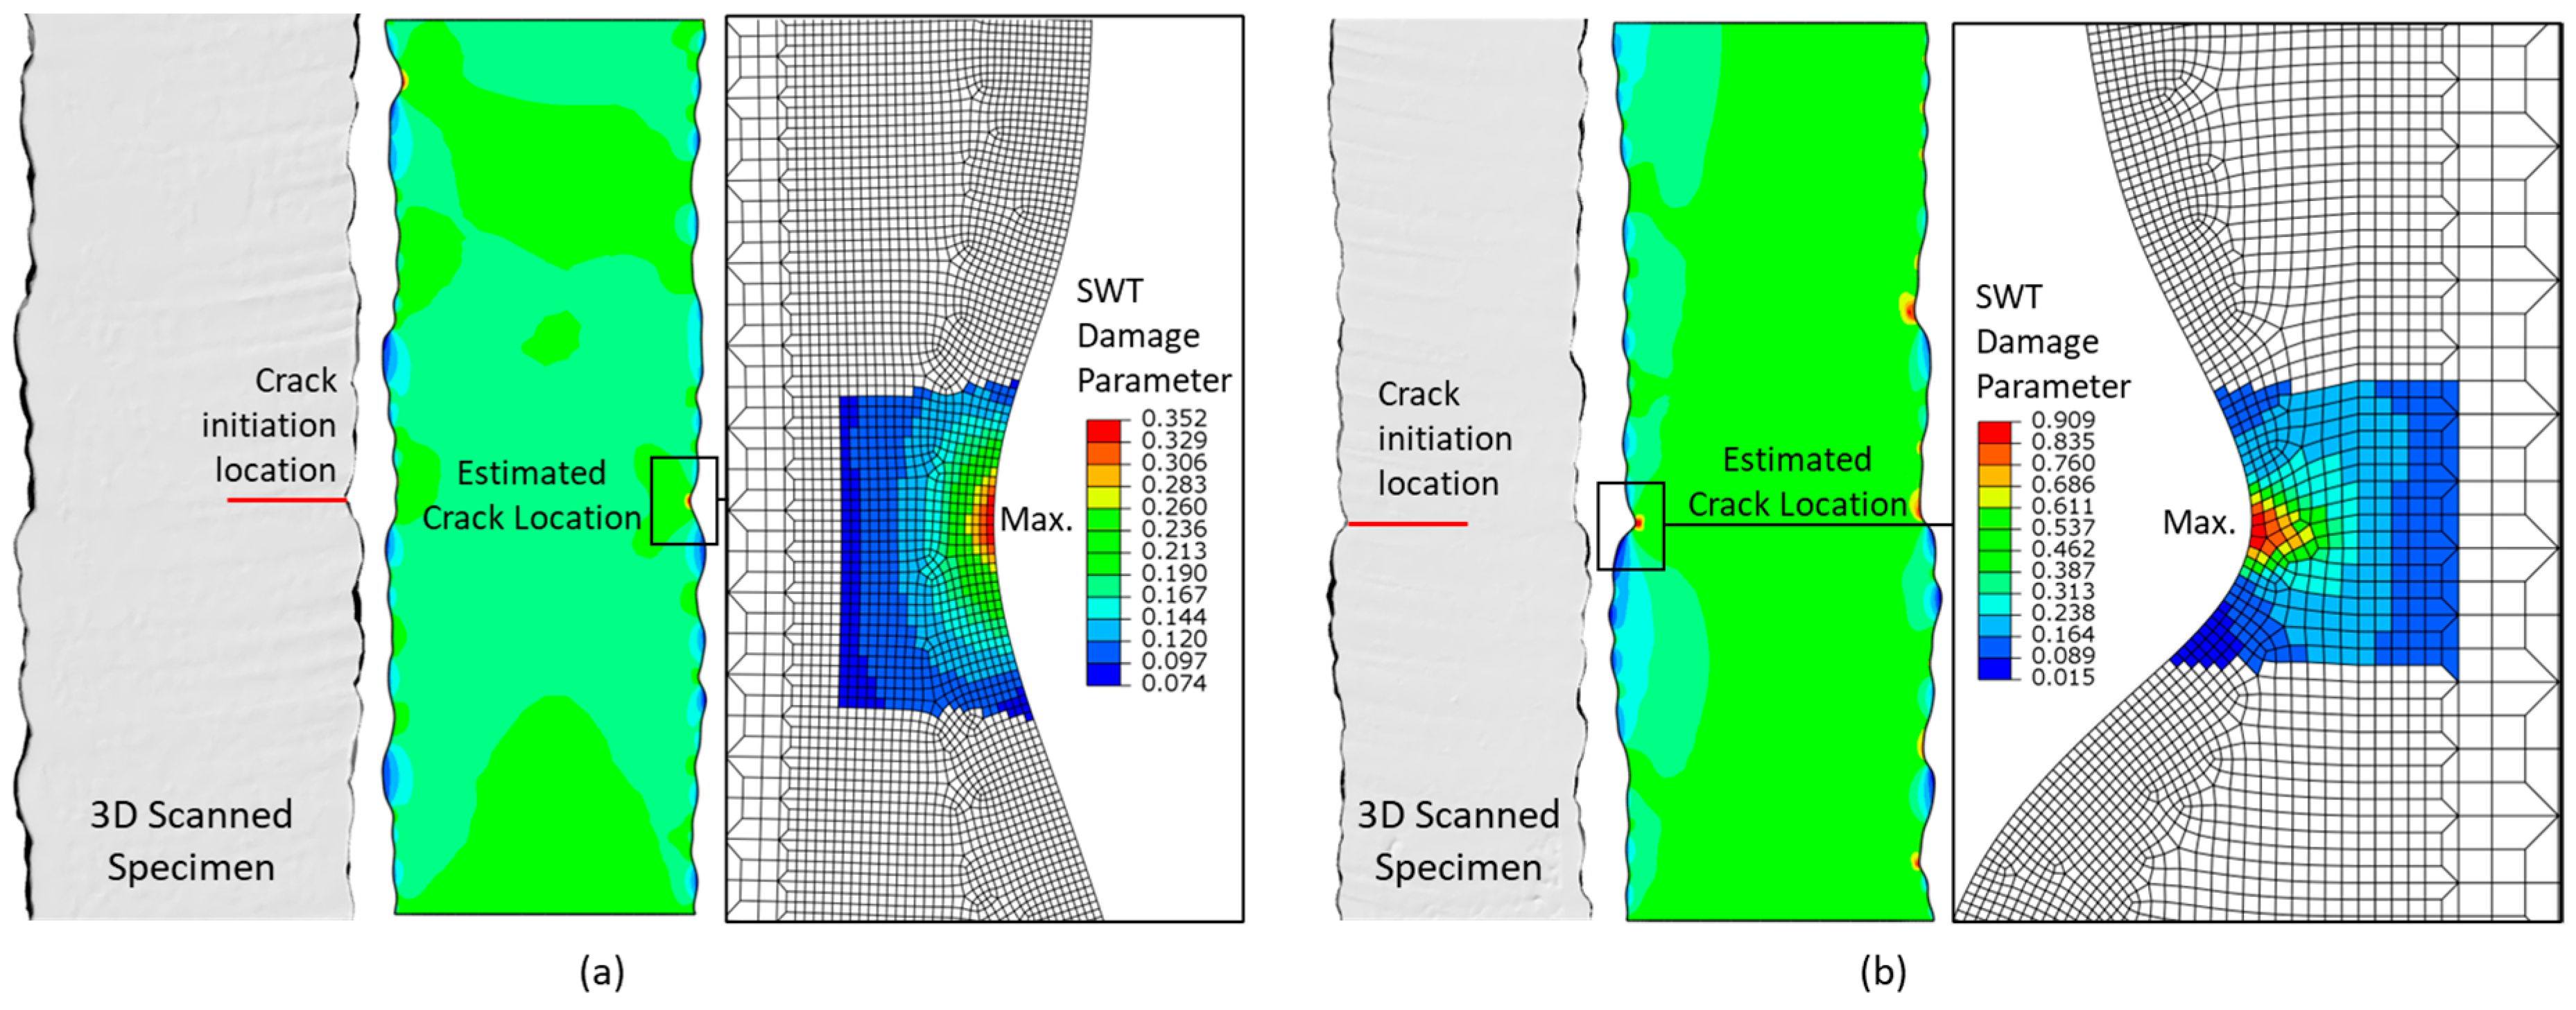
Figure 14a,b compare the experimentally observed fatigue crack initiation sites with the predictions obtained from 2D FE simulations for specimens FTS-10 and FTS-11, respectively. Specifically, the figures illustrate the correspondence between the actual failure locations and the areas exhibiting the maximum SWT damage parameter in the FE models. Notably, a strong correlation is observed between the critical valleys identified in the simulations, based on surface geometry and stress analysis, and the experimentally determined crack initiation sites. This agreement highlights the predictive capability of the numerical approach in capturing the fatigue-critical features of the surface.
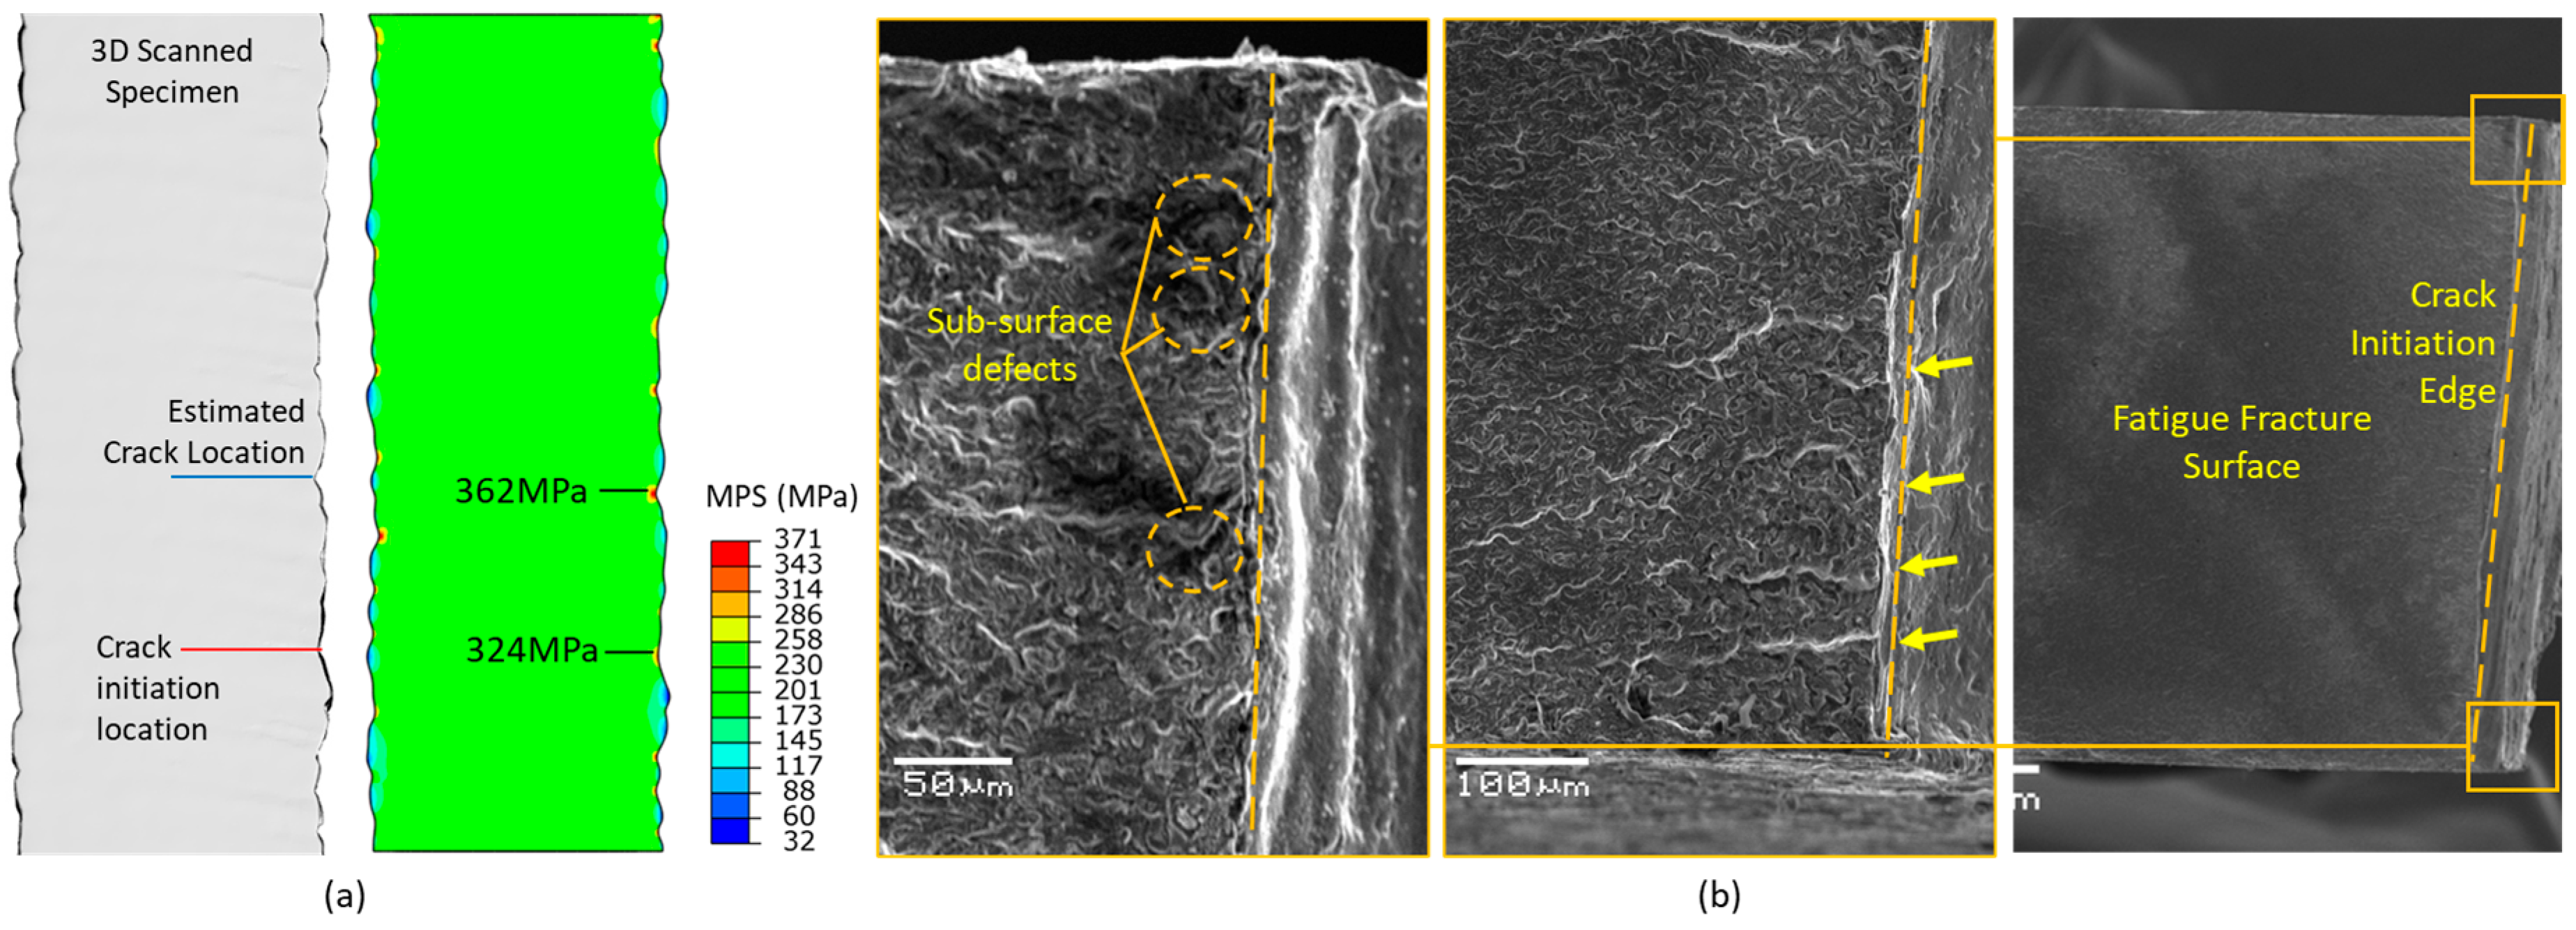
However, an exception was observed for specimen FTS-3, where the failure occurred in a valley different from the one predicted by the 2D simulation, as illustrated in Figure 15a. To investigate this deviation, a detailed fractographic analysis was conducted to understand the underlying causes. Figure 15b shows an overview of the fracture surface at the crack initiation site for FTS-3. The image shows multiple small cracks (indicated by yellow arrows) originating from the as-built surface, which then coalesced into larger cracks along the crack front. Prominent near surface defects, such as small voids and inclusions, are visible in this region and likely act as stress concentrators. These defects may have increased the surface stress values at the predicted stress concentration site, estimated by the FE model to be around 324 MPa, raising them to over 362 MPa at the crack initiation location. This suggests that the failure in FTS-3 was driven by the unfavourable distribution of these impurities, which exacerbated stress concentration and promoted crack initiation in this valley.
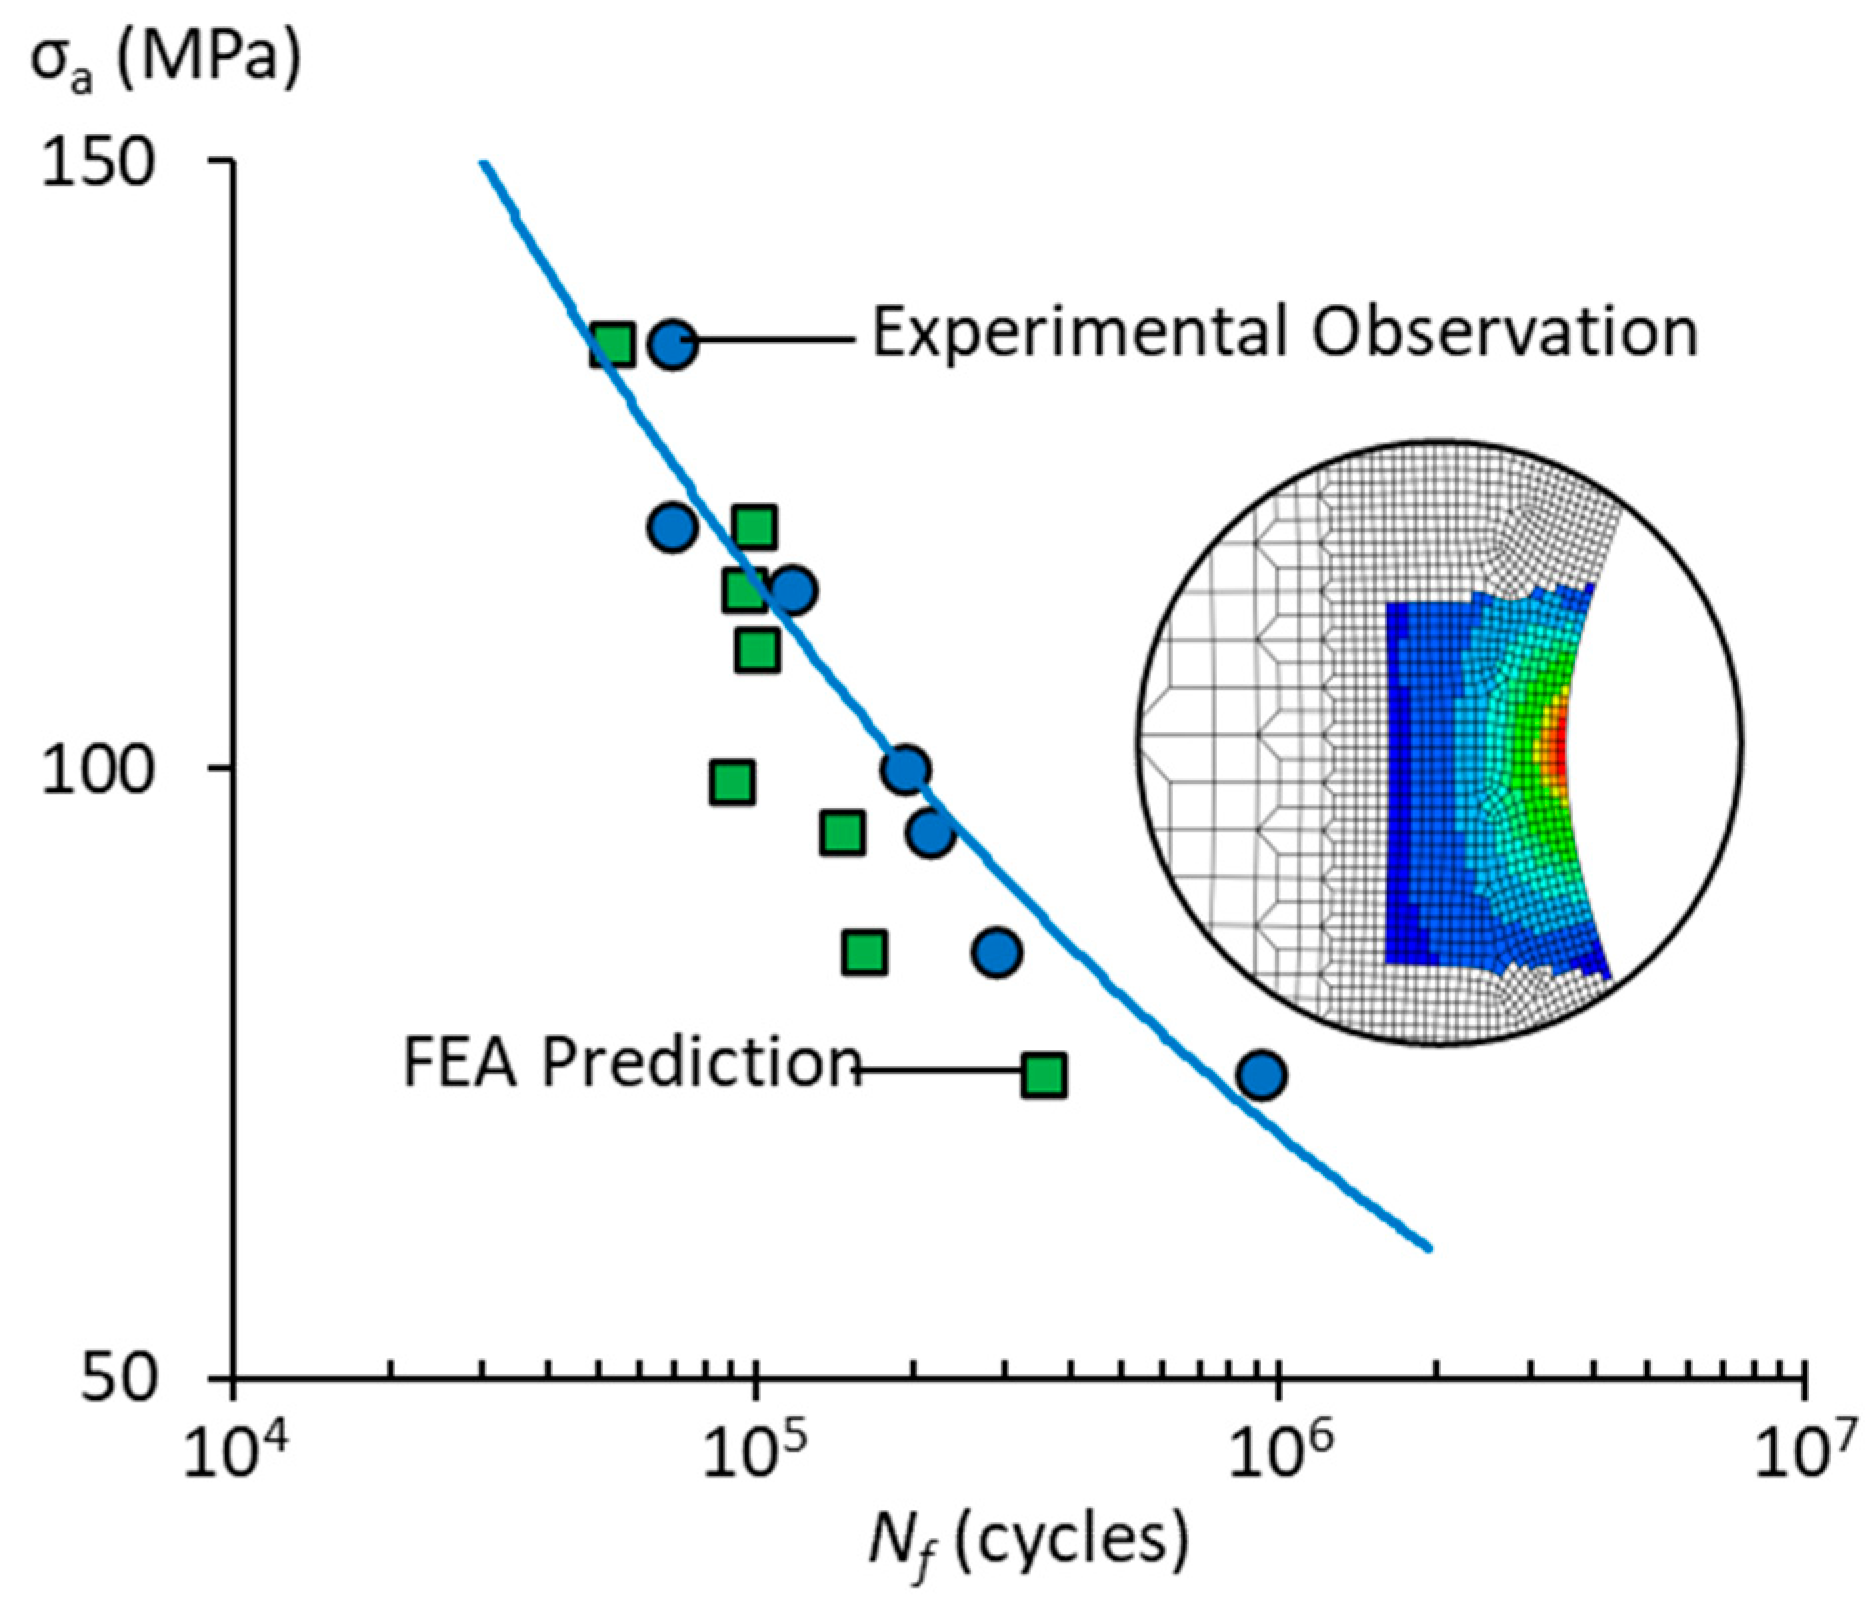
Figure 16 presents the applied stress amplitude versus fatigue life for the tested specimens and estimated lifetimes using FE simulations. It is worth noting that only seven fatigue specimens were used for fatigue life estimation, as the remaining samples fractured outside the regions covered by the extracted 2D profiles from the 3D scanned parts which were used for 2D FE simulations. A comparison of the fitted S-N curves reveals a marginally steeper slope in the estimated dataset compared to the observed experimental data, suggesting a slightly higher sensitivity to stress amplitude variations. While the simulations tend to increasingly underestimate fatigue life at lower stress levels, the overall agreement remains reasonable, with an average prediction error of 36%. It should be noted that the FE models in this study only account for crack initiation life (up to a 1 mm crack length) and do not incorporate crack propagation. This is also evident in Figure 13, where the fatigue crack propagation lengths at low stress levels are longer than those observed at high stress levels. This simplification may contribute to the conservative life estimates, as the total fatigue life (initiation + propagation) is typically longer than initiation life alone. Despite this assumption, the FE predictions remain on the conservative side, making them suitable for preliminary design assessments.
It is important to note that in additively manufactured parts, multiple factors, including increased surface roughness, surface and subsurface defects, and residual stresses, can strongly affect the initiation and propagation of fatigue cracks, and thereby the overall structural integrity. However, under as-built surface conditions, as shown in this study and consistently reported in previous works [22,23], the fatigue behaviour is predominantly governed by the stress concentrations induced by the rough surface topography. For this reason, our finite element modelling primarily focused on surface irregularities as the governing factor. While the experimentally obtained lifetimes inherently reflect the combined influence of surface roughness, defects, and residual stresses, the numerical simulations were designed to isolate and assess the specific role of surface morphology.

5. Conclusions

The novelty of this study lies in the direct integration of high-resolution 3D surface topography into finite element modelling for fatigue life prediction of as-built WAAM components. Unlike conventional approaches that rely on idealized geometries or empirical roughness parameters, the present methodology incorporates the actual as-built surface morphology into both 2D and 3D FE models, thereby capturing the true stress concentration effects at the surface. This integration bridges experimental characterization with predictive modelling, advancing the state-of-the-art in fatigue assessment of additively manufactured components.
The key findings can be summarized as follows:
  • Surface waviness and subsurface porosities were confirmed as the primary drivers of fatigue crack initiation and early propagation, consistent with fractographic observations.
  • 3D FE models generated from 3D-scanned geometries showed strong agreement with experimental results, validating their accuracy in predicting stress concentration factors and identifying failure-prone locations. Simplified 2D mid-contour models, while less detailed, proved to be an efficient alternative for preliminary fatigue evaluations.
  • The integrated experimental–computational framework achieved a prediction accuracy with an average error of 36% when compared to measured fatigue lives. Although the FE models tended to underestimate life at lower stress levels, their conservative nature makes them suitable for engineering safety assessments.
  • Statistical post-processing of fatigue data indicated a FAT class of 111 MPa with an inverse slope of 5, positioning the proposed approach as robust and comparable to, if not more representative than, state-of-the-art fatigue design methodologies for AM structures.
In conclusion, this work establishes a validated pathway for incorporating as-built surface topography into fatigue modelling of WAAM components. By quantitatively linking experimental surface characterization, numerical simulations, and fatigue life predictions, it provides a more realistic and predictive framework than conventional roughness-based corrections. This methodological advance not only enhances the reliability of fatigue design for WAAM structures but also sets the foundation for future developments in topography-informed fatigue assessment of additively manufactured materials.

Author Contributions

Conceptualization, S.G. and R.T.; Methodology, S.G., S.B., B.R. and R.T.; Software, S.G., S.B. and R.T.; Validation, S.G., S.B. and R.T.; Formal analysis, S.G., S.B. and R.T.; Investigation, S.G., S.B., B.R. and R.T.; Resources, R.T.; Data curation, R.T.; Writing—original draft, S.G. and S.B.; Writing—review & editing, B.R. and R.T.; Visualization, R.T.; Supervision, S.G., B.R. and R.T.; Project administration, R.T.; Funding acquisition, R.T. All authors have read and agreed to the published version of the manuscript.

Funding

This research was funded by KU Leuven (grant number CELSA/23/026#57631873).

Institutional Review Board Statement

Not applicable.

Informed Consent Statement

Not applicable.

Data Availability Statement

The data presented in this study are available on request from the corresponding author. The data are not publicly available due to their involvement in an ongoing study and the fact that further analyses are being conducted.

Conflicts of Interest

The authors declare no conflict of interest.

References

  1. Blakey-Milner, B.; Gradl, P.; Snedden, G.; Brooks, M.; Pitot, J.; Lopez, E.; Leary, M.; Berto, F.; Plessis, A.D. Metal additive manufacturing in aerospace: A review. Mater. Des. 2021, 209, 110008. [Google Scholar] [CrossRef]
  2. Prakash, K.S.; Nancharaih, T.; Rao, V.V.S. Additive Manufacturing Techniques in Manufacturing—An Overview. Mater. Today Proc. 2018, 5, 3873–3882. [Google Scholar] [CrossRef]
  3. Vasco, J.C. Additive manufacturing for the automotive industry. In Additive Manufacturing; Elsevier: Amsterdam, The Netherlands, 2021; pp. 505–530. [Google Scholar] [CrossRef]
  4. Bhattacharya, A.; Paul, S.K.; Sharma, A. Unraveling the failure mechanism of wire arc additive manufactured low carbon steel under tensile and high cycle fatigue loading. Eng. Fail. Anal. 2023, 150, 107347. [Google Scholar] [CrossRef]
  5. Evans, S.I.; Wang, J.; Qin, J.; He, Y.; Shepherd, P.; Ding, J. A review of WAAM for steel construction--manufacturing, material and geometric properties, design, and future directions. Structures 2022, 44, 1506–1522. [Google Scholar] [CrossRef]
  6. Smismans, T.; Chernovol, N.; Lauwers, B.; Van Rymenant, P.; Talemi, R. Influence of post-heat treatments on fatigue response of low-alloyed carbon-manganese steel material manufactured by Direct Energy Deposition-Arc technique. Mater. Lett. 2021, 302, 130465. [Google Scholar] [CrossRef]
  7. Wu, B.; Pan, Z.; Ding, D.; Cuiuri, D.; Li, H.; Xu, J.; Norrish, J. A review of the wire arc additive manufacturing of metals: Properties, defects and quality improvement. J. Manuf. Process. 2018, 35, 127–139. [Google Scholar] [CrossRef]
  8. EN ISO 14341; Welding Consumables–Wire Electrodes and Weld Deposits for Gas Shielded Metal Arc Welding of non Alloy and Fine Grain Steels-Classification. International Organization for Standardization: Geneva, Switzerland, 2020.
  9. Ozaner, O.C.; Talemi, R.; Tjahjowidodo, T.; Sharma, A. The influence of the wire and arc additive manufacturing parameters on the surface irregularities. J. Micromanuf. 2025, 8, 22–31. [Google Scholar] [CrossRef]
  10. Ozaner, O.C.; Klobčar, D.; Sharma, A. Machining strategy determination for single-and multi-material wire and arc additive manufactured thin-walled parts. Materials 2023, 16, 2055. [Google Scholar] [CrossRef] [PubMed]
  11. EN ISO 4288; Geometrical Product Specifications (GPS)-Surface Texture: Profile Method-Rules and Procedures for the Assessment of Surface Texture. ISO: Geneva, Switzerland, 1996; pp. 1–8.
  12. EN ISO 16610-21; Geometrical Product Specifications (GPS)—Filtration—Part 21: Linear Profile Filters: Gaussian Filters. ISO: Geneva, Switzerland, 2025.
  13. Al-Badrawi, M.H.; Liang, Y.; Seger, K.D.; Foster, C.M.; Kirsch, N.J. Caller ID for Risso’s and Pacific White-sided dolphins. Sci. Rep. 2022, 12, 4510. [Google Scholar] [CrossRef] [PubMed]
  14. Hobbacher, A.F. The new IIW recommendations for fatigue assessment of welded joints and components—A comprehensive code recently updated. Int. J. Fatigue 2009, 31, 50–58. [Google Scholar] [CrossRef]
  15. Raeymaekers, B. Design of Mechanical Elements: A Concise Introduction to Mechanical Design Considerations and Calculations; John Wiley & Sons: Hoboken, NJ, USA, 2022. [Google Scholar]
  16. Smith, K. A stress-strain function for the fatigue of metals. J. Mater. 1970, 5, 767–778. [Google Scholar]
  17. Gothivarekar, S.; Coppieters, S.; Talemi, R.; Debruyne, D. Effect of bending process on the fatigue behaviour of high strength steel. J. Constr. Steel Res. 2021, 182, 106662. [Google Scholar] [CrossRef]
  18. Mendez-Morales, M.; Branco, R.; Tankova, T.; Rebelo, C. Assessment of cyclic deformation behaviour of wire arc additively manufactured carbon steel. Int. J. Fatigue 2024, 184, 108307. [Google Scholar] [CrossRef]
  19. Huang, C.; Li, L.; Pichler, N.; Ghafoori, E.; Susmel, L.; Gardner, L. Fatigue testing and analysis of steel plates manufactured by wire-arc directed energy deposition. Addit. Manuf. 2023, 73, 103696. [Google Scholar] [CrossRef]
  20. Bartsch, H.; Kühne, R.; Citarelli, S.; Schaffrath, S.; Feldmann, M. Fatigue analysis of wire arc additive manufactured (3D printed) components with unmilled surface. Structures 2021, 31, 576–589. [Google Scholar] [CrossRef]
  21. Talemi, R. A numerical study on effects of randomly distributed subsurface hydrogen pores on fretting fatigue behaviour of aluminium AlSi10Mg. Tribol. Int. 2020, 142, 105997. [Google Scholar] [CrossRef]
  22. Hou, Y.; Kench, S.; Wauters, T.; Talemi, R. Numerical framework for predicting fatigue scatter in additively manufactured parts. Int. J. Mech. Sci. 2024, 281, 109562. [Google Scholar] [CrossRef]
  23. Hou, Y.; Hu, Z.; Wauters, T.; Talemi, R. Combined effect of random porosity and surface defect on fatigue lifetime of additively manufactured micro-sized Ti6Al4V components: An investigation based on numerical analysis and machine learning approach. Theor. Appl. Fract. Mech. 2024, 131, 104451. [Google Scholar] [CrossRef]
Figure 1. WAAM setup (a) and deposited WAAM wall (385 × 175 × 14 mm) on a steel substrate (b) and Micrograph of as-welded G1Si3 near the middle of the wall (c).
Applsci 15 10936 g001
Figure 2. Dimensional overview of the as-built wall structure and schematic representation of tensile and fatigue specimen locations and orientations within the wall. All dimensions are in mm.
Applsci 15 10936 g002
Figure 3. Geometrical analysis of the cross-section and deviation of the cross-sectional centroid, with profile data extracted at 1 mm intervals using equally spaced planes for illustration. Surface texture characterization: (a) Methodology for profile extraction along the specimen edge; (b) Quantified surface waviness parameters with schematic representation of key profile features.
Applsci 15 10936 g003
Figure 4. 100 kN servo-hydraulic fatigue testing system (ZwickRoell HA 100) configured for evaluating as-built WAAM specimens under uniaxial cyclic loading.
Applsci 15 10936 g004
Figure 5. FE modelling strategies: (a) 3D representation with surface topography-adaptive C3D10 elements at irregular edges (0.3 mm seed) transitioning to C3D8R elements in the bulk region, showing fixed support and tensile fatigue stress and (b) Corresponding 2D plane stress implementation with a minimum mesh size of 25 μm and equivalent boundary/loading conditions for computational efficiency comparison.
Applsci 15 10936 g005
Figure 6. Development of a NURBS-based model from a 3D-scanned fatigue specimen: (a) raw scanned sample, (b) part with irregular triangular mesh, (c) mesh reduced for processing, and (d) quad-mesh-based NURBS model.
Applsci 15 10936 g006
Figure 7. (a) Engineering and true stress–strain curves obtained from DIC tensile test results, (b) Global strain field (ɛyy) at Point 1 and (c) Global strain field (ɛyy) at Point 2.
Applsci 15 10936 g007
Figure 8. S-N (stress-life) curve derived from experimental fatigue tests, with results benchmarked against the reported fatigue performance of as-built G3Si1 material from literature [19,20].
Applsci 15 10936 g008
Figure 9. Pairwise correlation matrix showing the relationships between surface topography parameters, both roughness and waviness, and fatigue variables (Δσ, σm, N).
Applsci 15 10936 g009
Figure 10. Optical microscopy analysis of fractured fatigue test specimens: (a) FTS-11, (b) FTS-10, (c) FTS-3, and (d) FTS-6.
Applsci 15 10936 g010
Figure 11. Detailed SEM images of the fracture surface of specimen FTS-11.
Applsci 15 10936 g011
Figure 12. Correlation between surface topography, FE-predicted stress distribution, and fatigue crack initiation. (a) Rendered 3D surface scan of the specimen, (b) point-by-point valley map based on inverse prominence, (c) contour plot of the surface profile, and (d) von Mises stress distribution from the 3D FE model highlighting the critical stress location.
Applsci 15 10936 g012
Figure 13. (a) PMS from 3D model showing peak stress at a surface valley for FTS10 specimen, (b) PMS from 2D model with slightly higher stress at the same location, (c) PEEQ indicating localized plasticity, (d) Comparison of stress contours at top, middle, and bottom surfaces confirming the validity of the 2D mid-plane approximation.
Applsci 15 10936 g013
Figure 14. Comparison of experimental crack initiation sites with 2D FE-predicted locations of maximum SWT damage for (a) FTS-10 and (b) FTS-11, showing strong agreement.
Applsci 15 10936 g014
Figure 15. (a) Observed vs. predicted failure location in FTS-3. (b) Fracture surface showing crack initiation from surface defects, with local stresses exceeding FE-predicted values due to stress concentrations caused by near surface internal defects.
Applsci 15 10936 g015
Figure 16. Applied stress amplitude versus experimental and simulated fatigue life, comparing tested specimens with FE-predicted lifetimes.
Applsci 15 10936 g016
Table 1. WAAM Wall process parameters.
Travel Speed [m/min]Voltage [V]Gas Flow [l/min]Shielding GasCTWD [mm]
0.341915Argon15
Table 2. Chemical composition [wt.%] of G3Si1 wire and S235 substrate.
MaterialsCSiMnPSCu
Wire (G3Si1)0.0880.9001.5100.0120.0120.190
Substrate (S235) 0.22 0.05 1.6 0.050 0.050-
Table 3. Mechanical properties of G3Si1 wire and S235 substrate.
MaterialsYield Strength [MPa]Tensile Strength [MPa]Elongation [-]
Wire (G3Si1)420500–640 0.20
Substrate (S235)235360-
Table 4. Surface topography parameters for all fatigue samples.
Specimen No.Wa [mm]Wz [mm]Wq [mm]
FTS-10.0550.3190.076
FTS-20.0770.3770.095
FTS-30.0790.3330.094
FTS-40.1280.5250.147
FTS-50.1100.6160.145
FTS-60.0860.5670.118
FTS-70.0850.4340.099
FTS-80.0640.3120.082
FTS-90.1080.4730.130
FTS-100.1260.5540.148
FTS-110.1410.7670.182
Table 5. Summary of tensile properties of as-built WAAM specimen.
Young’s Modulus [GPa]Yield Strength [MPa]Ultimate Strength [MPa]Fracture Strain [-]
1833234340.13
Table 6. Summary of fatigue test results for as-built WAAM specimens.
Specimen No.Δσ [MPa]σm [MPa] N f , e x p [Cycles]
FTS-1270165.041,751
FTS-2200122.2191,018
FTS-3190116.1213,771
FTS-4230140.6116,035
FTS-5220134.4120,225
FTS-6250152.848,746
FTS-7260158.935,726
FTS-8240146.769,075
FTS-9270165.069,072
FTS-1015091.7921,175
FTS-11170103.9285,862
Disclaimer/Publisher’s Note: The statements, opinions and data contained in all publications are solely those of the individual author(s) and contributor(s) and not of MDPI and/or the editor(s). MDPI and/or the editor(s) disclaim responsibility for any injury to people or property resulting from any ideas, methods, instructions or products referred to in the content.