Abstract
Logistics and warehouse operations experience an increasing pressure to adopt sustainable practices. The logistics industry generates substantial material waste, with cardboard being the primary packaging material. Adopting Circular Economy (CE) principles to control this waste is important for enhancing sustainability. However, there is a lack of studies on transforming warehouses into more sustainable operations. This paper studies the ability to transform the linear supply chain of a distribution warehouse into a circular supply chain by applying lean manufacturing principles to eliminate cardboard waste. A structured framework is presented to outline the project’s methodology and illustrate the steps taken to apply the concept of CE. The paper also tests the capability to simulate warehouse operations with engineering software using limited available data to generate various scenarios. This study contributes by showing how discrete-event simulation combined with VSM and 6R principles can provide operational insights under data-constrained conditions. Bridging the gap between theory and practice. Multiple operational scenarios were modelled and run, including peak and off-peak demand periods, as well as a sensitivity analysis for recycling durations. A comparative evaluation is shown to demonstrate the effectiveness of each alternative and determine the most feasible solution. Results indicate that introducing recycling activities created some bottlenecks in the system and reduced its efficiency. Furthermore, suggestions for future improvements are presented, ensuring that on-site actions are grounded in a simulation that reflects reality.
1. Introduction
In today’s fast-changing world, logistics and transport companies must prioritise sustainability and find practical ways to adopt greener practices in their warehouses [1]. Warehouses, as critical nodes in supply chains, play a central role in resource use, waste generation, and operational efficiency, making them key targets for sustainability improvements [2,3]. This study provides practical approaches to reduce waste and improve sustainability by converting warehouse operations into a circular, closed-loop system. Shifting toward greener solutions is an important first step in contributing to the broader aim of a circular economy. While the circular economy (CE) has been widely promoted as a strategy to reduce waste and improve sustainability, its practical implementation at the warehouse level remains limited. Existing studies often focus on conceptual models or generalised frameworks, leaving a gap in data-driven, operational evaluations of circular strategies in real warehouse settings [4]. This project explores the implementation of circular economy principles in the warehouse through discrete-event simulation (DES). The simulation model, built using WITNESS Process Management Software V25 by Lanner, relies on data provided by the company. Multiple scenarios are evaluated to identify the most effective design for achieving sustainability objectives. The study focuses on identifying practical interventions that enhance sustainability while maintaining operational efficiency. A sensitivity test is performed to evaluate the robustness of the built model. For the simulation development, Lean manufacturing principles are incorporated, alongside the VSM and 6R concepts.
Creating a fully closed-loop system requires consideration of many factors across various industries, such as stakeholders, warehouses, recycling partners, and uncontrollable elements like customer behaviour. This study concentrates on a specific part of the process rather than the entire supply chain. During warehouse observations, several types of waste were identified. Due to time and resource limitations, this study focuses specifically on cardboard waste, though the methodology could be extended to other materials.
The aim of this study is to assess the current state of the warehouse and explore practical ideas for turning it into a fully circular supply chain. This study contributes to the literature by providing a real-world, operational-level evaluation of CE strategies in warehouses, addressing a critical gap between theory and practice.
The study’s three main key contributions are shown as follows. First, it proposes a methodological framework integrating VSM and 6R principles with DES under data-constrained conditions, allowing operational evaluation with limited datasets. Second, it compares on-site versus outsourced recycling strategies. Highlighting their impact on warehouse efficiency and circularity. Finally, it demonstrates how DES can generate actionable insights in constrained contexts, providing both practical and methodological value for circular supply chain management.
It will also consider how other waste materials can be modified or improved to implement this new concept. To achieve its aim, this project is carried out through defined objectives: identifying solutions to reduce the observed types of waste, understanding the industries involved in facilitating the circular economy (CE) transition, developing strategies to secure the long-term sustainability of the closed-loop supply chain model, and proposing improvements for future development.
The structure of this paper is organised as follows: Section 1 introduces the objectives and scope of the study. Section 2 reviews the background and literature, outlining key concepts and highlighting research gaps. Section 3 explains the methodology used to transform the linear supply chain into a circular model. Section 4 presents the simulation model and scenarios. Section 5 shows the outcomes obtained from the simulation. Section 6 discusses and analyses the findings in detail. Section 7 concludes the study.
2. Background and Literature Review
2.1. Overview of the Environmental Impact of Logistics Operations
Environmental sustainability is influenced by logistics operations both directly and indirectly through pollution and resource consumption [2]. This serves as a primary motivation for logistics companies to pursue change [3]. Moving toward greener logistics practices significantly enhances the sustainability of supply chain functions [4]. Consequently, the greener the operations, the greater the reduction in environmental impact, making it essential for logistics companies to integrate environmental sustainability into their practices [5]. The definition of ecological sustainability is the environment’s ability to function correctly, continuously and for an indefinite period. Ecological sustainability circles around the purpose of minimising the harm to the environment and countering the process that led to harming the environment. To accomplish this goal, a change initiative should be planned, engaging multiple stakeholders from both the private and public sectors [6].
2.2. The Concept and Importance of the Circular Economy in Enhancing Warehouse Operations
As noted by [7], organisations are placing greater emphasis on environmental management. In this setting, companies are expected to show stakeholders the sustainability principles they uphold and the strategies to maintain them. According to [8], adopting a circular economy can be an effective approach, particularly for sectors aiming for more sustainable growth [9]. This circular economy framework seeks to reduce waste and pollution by reusing, recycling, refurbishing, and repairing existing systems that are environmentally inefficient [10].
Recent studies, such as [11] have highlighted how circular economy frameworks are now being applied to warehouse fulfilment centres, though practical implementation still faces several operational and digital barriers. Another paper also points out the theoretical and technological gaps businesses face when trying to shift to circular models, especially in supply chain logistics, where integration with Industry 4.0 technologies remains incomplete [12].
Given the environmental impact of logistics, particularly in goods transportation, various sectors are working together to limit greenhouse gas emissions [5]. Integrating logistics into management decisions has become increasingly important. The circular economy model offers a practical approach for sustainable business development. Many stakeholders seek clearer explanations of how circular economy practices apply to their business models, as these practices directly affect them [13].
Moreover, a study underlines the importance of digital readiness and process coordination in circular logistics [14], noting that barriers such as limited digital adoption, data fragmentation, and unclear cost–benefit justifications can slow CE integration at the warehouse and network level. As noted by [15], one of the key enablers of circular transition in logistics is an effective reverse logistics infrastructure. Their study identifies a range of organisational and operational barriers that must be addressed to make circular strategies viable in real-time logistics environments.
Warehouse operations are important for supply chain logistics strategies. It influences performance, operational costs, and productivity [16]. To achieve improvements in sustainable performance, warehouses must adapt to evolving economic trends in their planning and strategic decisions [17]. Implementing these changes also involves evaluating their environmental and economic value to the company [18].
2.3. Lean Manufacturing Tools and Their Importance in Improving the Sustainability of Warehouse Operations
One of the concepts used in this paper is the Lean manufacturing process, which utilises value stream mapping (VSM) to identify waste. A value stream map collects all value-added and non-value-added activities, starting from raw materials and extending to end retailers or customers, to identify and eliminate waste activities from the process [19]. The integration of VSMs and related concepts has been carried out to enhance their capabilities. For example, VSM emerged with supply chain product development methodologies and agent-based systems. Integrated 6R into the VSM makes activities with the potential to reduce, redesign, reuse, recycle, recover, and remanufacture more easily identified. Companies are integrating lean and 6R concepts to analyse waste and reduce resources in a circular economy [20]. This integration is further advanced through the development of Sustainable VSM (SusVSM), which incorporates real-time simulation and environmental metrics to support continuous improvement in lean supply chains, particularly in manufacturing warehouses [21].
Training and education play a crucial role in ensuring sustainable value creation and promoting social well-being. The circular economy approach is effective as it seeks to minimise costs and waste while maximising resource efficiency through the 6R principles: reuse, reduce, recycle, recover, redesign, and reprocess [22]. It is important to note that, in practice, the 6R method is often applied in a limited form, focusing on only 3R strategies for certain products [23]. Recent case studies demonstrate how lean implementation has significantly optimised warehouse picking and packing operations, leading to reduced material waste and enhanced CE alignment [24]. Furthermore, the use of hybrid VSM and discrete-event simulation in Industry 4.0 settings provides real-time visibility for operational improvements in lean warehouses [25]. Additionally, survey-based approaches and structural equation modelling studies support this integration, demonstrating its ability to enhance operational sustainability and resource efficiency [26].
However, there is a strong interaction between lean and circular economy (CE) principles, which can bring substantial benefits to the industrial sector. Thus, their integration arises naturally. The CE approach proposes an optimum solution to the current shortage of natural resources and environmental challenges while enabling a closed-loop economic system [27]. Meanwhile, lean methodologies focus on waste reduction and value creation, enhancing both operational efficiency and financial performance [20]. Additionally, expanding VSM frameworks with social and environmental dimensions is becoming common in sustainable logistics planning, aligning warehouse practices with broader CE targets [28,29].
2.4. Discrete Event Simulation in Circular Logistics
Discrete Event Simulation (DES) is used to study how changes in a system affect its performance. It is also useful for modelling logistics environments where timing, queues, and resource limitations are important. In the context of the circular economy, DES has been utilised to investigate how materials can be more efficiently circulated through closed-loop systems.
For example, [30] used DES to study several reverse logistics options in remanufacturing. Their results helped compare different setups by measuring both environmental and economic outcomes. In addition, [31] shows how DES supports reverse logistics decision-making by examining and comparing the financial and environmental impact of utilising remanufactured spare parts versus new parts.
In other work, [32] applied DES to improve internal production and logistics processes. Their findings show that simulation can help identify inefficient areas and improve them without disrupting the real operations. Reference [33] also emphasised that DES can align with circular principles like reduce, reuse, and recycle. Mainly when planning a sustainable production system.
In general, Discrete Event Simulation has been applied only to a limited extent in modelling warehouse operations within the context of the circular economy. As a result, many studies in this area rely on limited or hypothetical data, which makes them difficult to apply in real-world settings.
2.5. Challenges and Gaps in Current Research on Circular Supply Chain Implementation
The circular economy (CE) is growing rapidly across the industrial sector. While warehouse operation implementations remain behind. Several studies have shown that CE enablers are still in their early stage and lack integration into operational logistics [4]. Many existing studies focus on the conceptual models or the manufacturing systems in general. On the other hand, few studies provide detailed insights into how these ideas can be applied at the operational level.
Warehouse operations are complex, and one of the main issues is the lack of real-world data. However, much of the current research relies on assumptions or simplified case studies. The lack of actual data will limit the effectiveness of the models in actual decision-making. There is also a noticeable gap in simulation work that targets warehouse systems as they transition from linear to circular models.
Due to these limitations, there is still a need for studies that incorporate CE strategies directly into warehouse operations using realistic data-driven tools. Research that focuses on real case studies can offer practical solutions that help bridge this gap.
3. Methodology
This section outlines the methodology for transforming warehouse operations into a circular supply chain, focusing on cardboard flow. The methodology includes collecting data to gain an understanding of warehouse operations, setting parameters based on various resources, and making some necessary operational assumptions to address the missing or unclear operational details. Finally, based on the previous inputs, the current model is built.
This study is a simulation-based experimental study. Aim to evaluate circular economy strategies in warehouse operations. A discrete-event simulation (DES) approach was employed to model the system, supported by Lean manufacturing tools (VSM and 6R) and Multi-Criteria Decision Analysis (MCDA) for performance evaluation. The simulation model was developed using operational data provided by the warehouse, including process times, inventory flows, machine utilisation, and blockage levels. These data were organised and used to calibrate the model parameters. In this study, the term “experiment” refers to simulation-based experiments, where different scenarios were defined (original model vs. no-recycling model, under peak and off-peak demand conditions). Each scenario was run in WITNESS under controlled settings, and performance indicators such as utilisation, blockage level, and circularity index were collected to support comparative analysis. The next section presents a diagram to illustrate the study’s methodology in more detail.
3.1. Framework Construction
Several steps are essential to construct the model, as outlined in Figure 1. The process begins with understanding the current operations of the warehouse to detect key parameters and identify sources of waste. This understanding will be developed by applying a flow map of the process, which helps visualise how materials move through the system. Once the current operations are clear, the next step involves reviewing and defining the parameters that will shape the model. After that, a set of assumptions is introduced to address any missing or unclear data. This is followed by an analysis of the current model’s outcomes to identify areas for improvement. These improvements are important for transitioning the model from a traditional process to a closed-loop, circular system. The final step is to propose the enhanced model based on all previous points.
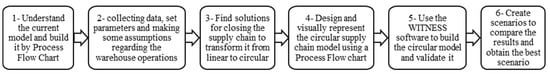
Figure 1.
The proposed framework.
3.2. Detailed Explanation of the Current Warehouse Operations
3.2.1. Data Collection
The needed numerical data were provided by the company expert, such as estimated process durations, the number of staff, and the number of packages arriving daily. These data are collected through structured interviews and a review of the company’s annual reports. Additionally, an online review of case studies and academic literature was conducted to identify common warehouse layouts and operation patterns in similar settings. Based on the insights gained, a detailed workflow model was developed, and approximate figures were proposed. These values were then reviewed and validated by the company’s logistics expert to ensure accuracy and operational relevance. Furthermore, where parameter uncertainty existed, sensitivity analyses were performed to evaluate the potential impact on the simulation outcomes.
3.2.2. Parameters
The selection of the parameters was performed by a comprehensive review of existing literature, primarily by examining studies that addressed warehouse operations and logistics systems. While there are only a limited studies specifically on the circular economy in warehousing or logistics, several related articles have been identified and analysed [34,35,36,37]. A preliminary parameter matrix was constructed to outline potentially significant variables based on both literature findings and operational insights from the company’s meeting. This matrix was then cross-referenced with the current process flow diagram to determine which parameters were most relevant to the modelled system. These parameters were selected for their direct impact on system efficiency, resource allocation, and capacity planning. These operational parameters are identified in Table 1.

Table 1.
The parameters required for building the model.
3.2.3. Assumptions
After analysing the entire process flow, some variables remained unknown or could not be directly measured. Therefore, several assumptions were made to facilitate the development of a functional simulation model. These assumptions are set based on a combination of expert input, common practices in warehouse operations, and relevant literature. The assumptions used in the model are as follows:
- Cardboard boxes’ dimensions are standardised to 30 × 30 × 30 cm.
- The daily delivery trucks are ten trucks. Each one transports a maximum of fifteen pallets containing eighty boxes.
- The barcodes containing parcel information are printed directly onto the boxes.
- Packaging operations are performed within the warehouse.
- The warehouse operates continuously 24 h per day using rotating shifts.
- Idle times and machine maintenance are not considered.
These assumptions are designed to support the simulation without affecting its relevance to real-world warehouse processes.
3.2.4. The Current Model: Process Flow Map
The process flow map presented in this section is intended to depict the main cardboard handling processes. It is important to note that no directly comparable work was found in the literature. Consequently, the map was developed based on related studies and observations of warehouse operations. Figure 2 illustrates the current module, showing cardboard operations from arrival at the warehouse through to dispatch.
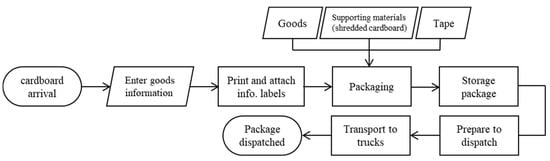
Figure 2.
The warehouse operations’ current model.
3.3. Technical Approach
Starting a fully circular economy process in the initial phases is unrealistic. In order to achieve full circularity, the wasted cardboard in the existing model should be brought back into the system. Several factors contribute to this challenge. This includes cardboard waste that comes from consumers (businesses and individuals) whose behaviour cannot be managed or forced to support the company’s orientation. Some of the returned cardboard cannot be recycled and needs to be treated as scrap. Based on this, a number of recommendations are proposed to simplify the process and encourage customers to collaborate.
The first proposed solution targets business customers, who are generally more open to collaboration. Contractual agreements can be established by the company that aim to encourage users to cooperate in returning the cardboard packages in exchange for faster deliveries and special pricing. Additionally, a loyalty programme can be introduced to further promote sustainable behaviour by offering tangible benefits. Supported by previous papers [38], this cost-effective approach can increase awareness of environmental responsibility. Customers would earn reward points for returning the cardboard to the warehouse. These points could be redeemed for exclusive promotions, discounts, or partner vouchers. As a result, it will foster community engagement and highlight the personal and social rewards of sustainability.
Additionally, the company should monitor cardboard within its operations before it leaves the warehouse, instead of treating it as waste. As illustrated in Figure 3, this tracking process follows dispatched and returned cardboard and helps identify cooperating businesses or customers. Given the prohibitive cost of advanced digital solutions such as IoT or blockchain, a more viable option is to implement barcoded or QR-coded labels on each shipment. These can be scanned at dispatch and upon return, providing a low-cost yet effective method for tracking cardboard flow. Integration with existing warehouse or inventory systems enables the company to analyse return rates, identify high-performing customers, and reward them with further incentives.

Figure 3.
The process of cardboard tracking.
Recycling or refurbishing the cardboard is the final proposed solution. Choosing between the two processes is based on the cardboard condition. To assess its condition, the returned cardboard goes through a quality inspection. If the cardboard has minimal issues, such as scratches or small tears, the most efficient and cost-effective solution would be refurbishing. However, if the condition of the cardboard is bad, it will be recycled. It is worth noting that recycling forms the basis for establishing a circular economy, particularly in this study. Returning the cardboard back into the system by converting waste into new raw materials will extend the lifecycle of materials. To further increase engagement, especially among individual consumers (B2C), the company can introduce simplified drop-off options or coordinate pick-up with deliveries to increase convenience. Clear signage or app-based reminders can be integrated to streamline the returns process. In parallel, educational campaigns showcasing the environmental impact of returned materials, such as estimated CO2 savings or landfill reduction, can reinforce pro-environmental behaviours. Finally, the design of cardboard packaging should be taken into consideration. Incorporating easy-to-fold designs, reusable inserts, or printed return instructions can make it easier for customers to handle and return used packaging. These design modifications will support refurbishment efforts and reduce logistical inefficiencies.
The Circular Model: Process Flow Map
The linear supply chain is converted into a circular and more sustainable system to minimise waste and improve resource efficiency. All the proposed solutions in the previous sections—such as contract-based returns, loyalty incentives, condition-based refurbishment or recycling, and low-cost tracking—are integrated to improve the circular model. This new model was built by applying the flow map concept, which provides a clear and comprehensive visual representation of the entire lifecycle of cardboard, as illustrated in Figure 4.
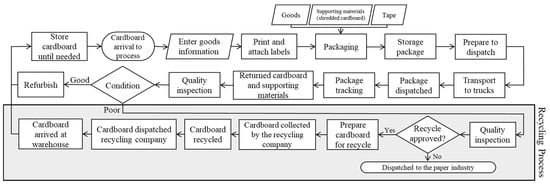
Figure 4.
The process flow map of the circular supply chain.
This structured approach supports sustainability goals and streamlines operational efficiency by reducing unnecessary material loss and enabling strategic reuse. The process begins with packaging and labelling, followed by usage, collection, quality assessment, and either refurbishment or recycling. Cardboard that fails quality checks is redirected to the paper industry, ensuring minimal waste disposal. This closed-loop system aligns with established circular economy principles, which emphasise the extension of product lifecycles and minimisation of raw material consumption [9,39]. By applying these principles to the supply chain, the warehouse significantly improves its environmental performance, while also aligning with regulatory and consumer expectations for sustainability.
4. Simulation
Digital modelling and simulation can aid decision-making in remaking operations. The Discrete Event Simulation (DES) method enables data-driven analysis to simulate reprocessing systems, although its application in this specific context—particularly in packaging remanufacturing—is still underexplored [39]. While DES has been applied in construction remanufacturing, automotive, logistics, and electronics, there is a need for more robust and domain-specific simulations that reflect the complexities of circular economy frameworks.
At this phase, the preparation of data involved mapping all individual processes, identifying their periods, configuring machinery based on process types, setting inter-arrival times for returned parts, calculating buffer capacities, and assigning labour resources based on task requirements. To monitor performance across the simulation, variables were introduced as counters, allowing for quantitative analysis of system behaviour and bottleneck identification.
The Experiment
The simulation software (WITNESS) can build a model using numerous elements, such as parts, machinery, operators, and buffers. In the software, A simulation model was constructed and tested based on the previously illustrated circular model flow map. The results from running the model showed the existence of several bottlenecks, indicating that some aspects of the system require improvement.
Value Stream Mapping (VSM) was systematically integrated into the simulation process to identify and eliminate non-value-adding activities. As shown in Figure 5, a detailed VSM was manually constructed to analyse each process. All aspects of the system were considered, from the arrival of materials into the system to the final recycling stage. Time, resource usage, and queue durations were assessed for each element in the model. The map was reviewed to identify areas that need improvement. These potential areas have been highlighted with a KanBan burst symbol, indicating the need for a thorough assessment to determine more effective and efficient implementation strategies.
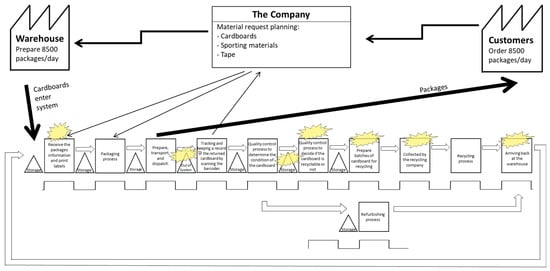
Figure 5.
The Value Stream Mapping (VSM).
After completing the VSM analysis, several adjustments were applied to the simulation. First, the two quality control stations were combined into one quality control process to increase the system’s efficiency. Multiple unnecessary storage areas were eliminated to enhance process flow. The whole recycling steps were integrated into one process within the simulation to facilitate time control and support effective sensitivity testing. Labour utilisation was optimised based on process demands and peak operating times. These improvements help in reducing wait times and blockages within the simulation.
The refined simulation in Figure 6 shows the enhanced model that incorporates all proposed circularity strategies. After confirming the model’s accuracy and functionality, it was presented and validated by a warehouse operation expert to ensure its feasibility and realism.
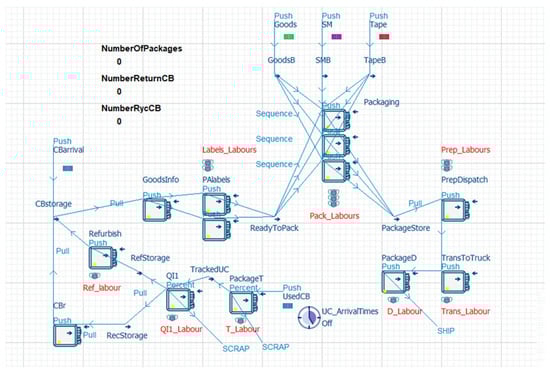
Figure 6.
The simulation model with the recycling process (peak demand).
Based on this, several scenarios were developed to explore potential improvements in the performance of the warehouse. These scenarios are summarised in Table 2. As shown in Figure 7, two models were considered: one with recycling operations and the other without, where recycling is managed by an external company. Seasonal changes in demand were also considered, with off-peak seasons handling an average of 6000 packages per day and peak seasons handling an average of 10,000 packages per day. In the early testing, shorter timeframes like one shift or one week were also tested. However, the one-month simulation was chosen because it gave clearer results for comparing different scenarios and operating conditions.
Table 2.
The model scenarios.
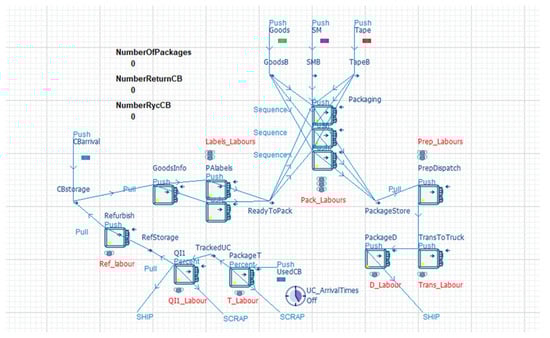
Figure 7.
The simulation model without the recycling process (peak demand).
5. Results
This section presents a detailed analysis of the results from each scenario, providing insights into their outcomes and performance. Each scenario was assessed based on key indicators, including processing time, utilisation, blockage levels, and efficiency. The outcomes were evaluated and compared to determine the most effective alternatives to be adopted by the warehouse. Taking into consideration both operational efficiency and alignment with circular economy principles. The results were represented in a visual format, presenting the statistical outputs. These diagrams offer a clear and informative summary of the outcomes and performance associated with each scenario. For this study, running the model assumes continuous operations and does not include equipment maintenance or downtime. These simplifications were made to focus on process flow comparisons.
5.1. The Original Model and the No-Recycling Model in Off-Peak Demands (Scenarios 1 and 3)
Scenario 1 (S1) used the original model with the internal recycling process (as shown in Figure 8). Scenario S7 used a lean model without recycling. Both ran under off-peak demand for one month. In S1, some processes, such as PackageT (scanning barcodes and tracking returned cardboard) and QI1 (cardboard quality control), showed high levels of cycle wait labour. This indicated blocking and delays in the system. Several machines also had more idle time, which reduced overall utilisation. The recycling loop introduced extra complexity, and some stations waited for resources to become available. In contrast, S3 showed better flow across the entire system (as shown in Figure 9). All stations were active with no signs of blocking or cycle wait. Machines like GoodsInfo, Packaging, and TransToTruck had high utilisation. Process times were shorter and more consistent. The system smoothly transitioned items from one step to the next. The Refurbish station stayed idle in S3 since recycling was not included. This confirmed that it was no longer needed in the lean setup. Overall, the lean model in S3 worked more efficiently under low demand. It reduced idle time, avoided delays, and simplified process flow.
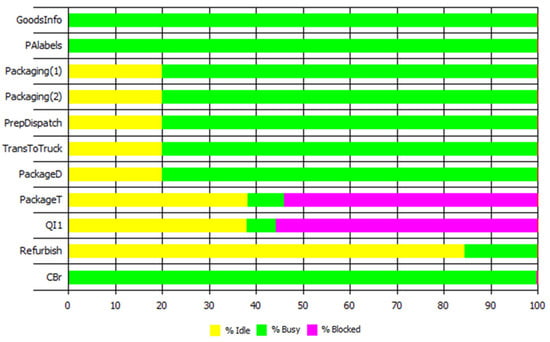
Figure 8.
The original model (off-peak demand).
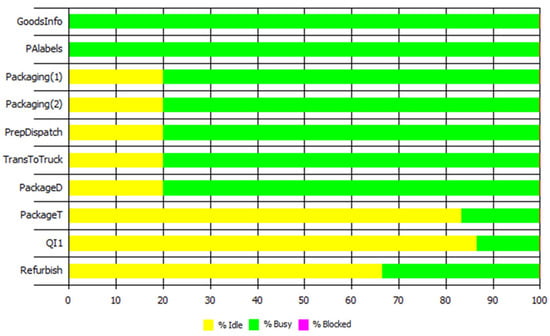
Figure 9.
The no-recycling model (off-peak demand).
5.2. The Original Model and the No-Recycling Model in Peak Demands (Scenarios 2 and 4)
Scenario S2 used the original circular model with internal recycling (as shown in Figure 10). Scenario S4 used a lean model without recycling (as shown in Figure 11). Both scenarios ran under peak demand for one month. To handle the high load, additional resources were added in both models. These included extra packaging stations and labelling units. In S2, stations such as PackageT and QI1 showed high levels of blockages, indicating delays in the system. Even with extra resources, the recycling loop caused waiting at certain points. Some machines were overused while others had idle time, leading to uneven utilisation and longer process times. On the other hand, S4 showed smoother performance. There were no signs of blocking or cycle wait. All stations, including the newly added ones, were well utilised. Process times were more stable and consistent across the system. The Refurbish station remained idle in S4, since recycling was not included. The lean setup enabled the system to respond more effectively to peak demand without delays. Overall, the lean model in S4 handled high demand more efficiently than the original model in S2. It maintained high utilisation, avoided delays, and made better use of added resources.
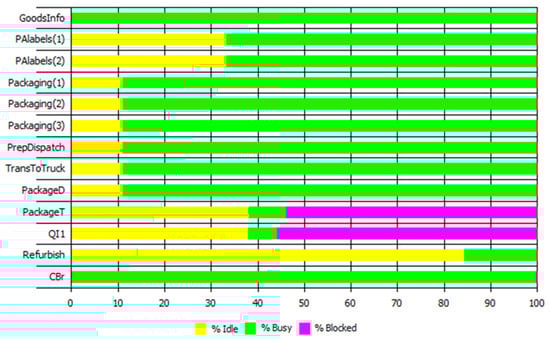
Figure 10.
The original model (peak demand).
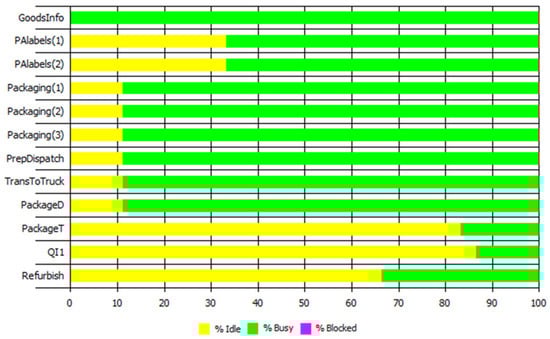
Figure 11.
The no-recycling model (peak demand).
5.3. The Sensitivity Test (Scenarios 5 and 6)
A sensitivity analysis was conducted to test how changes in recycling time affect system performance. The original scenario was compared with two alternatives: a faster and a slower recycling duration. These scenarios represent a ±20% variation. These percentages were chosen based on common practice in simulation studies. ±10–20% variation is used to assess model stability [40]. Scenario 5 (faster recycling time, see Figure 12 resulted in improved system flow slightly, reduced idle times, and greater consistency in processing durations. Although some bottlenecks exist, the overall system performance has been enhanced. On the other hand, Scenario 6 (slower recycling time, see Figure 13 led to increased idle times in upstream processes and more variability in machine utilisation. However, the system continued to function acceptably under these conditions. Although the graphs do not initially show significant differences, these changes will have a greater impact as the system continues to operate over time. An additional analysis is carried out with a wider ±30% variation. The −30% case showed no further improvements and slightly raised idle times. In comparison, the +30% introduced more delays and disrupted the system’s flow. These findings confirmed that a ±20% variation offered a suitable range for sensitivity testing. It provides meaningful performance insights without compromising overall system stability.

Figure 12.
The Sensitivity test result (Scenarios 5).

Figure 13.
The Sensitivity test result (Scenarios 6).
6. Discussion
An analysis was carried out to compare the results based on the simulation outcomes presented in the previous section. This analysis examines the percentage of utilisation of the various outputs, which is directly related to the circularity index, with higher rates indicating greater process efficiency. Another key parameter considered is the level of blockage within each process. The assessment criteria are defined as follows: blockages below 20% are classified as ‘low,’ those between 20% and 50% as ‘moderate,’ and those above 50% as ‘high.’ To summarise these comparisons clearly, the results are presented in Table 3.
Table 3.
The scenarios’ utilisation rate and blockage level.
This analysis is structured according to the type of the model. Enables systematic comparison between recycling inside the warehouse and the outsourced recycling process. The percentages of process utilisation are commonly lower in off-peak seasons than in peak seasons. Moreover, the level of blockages varies based on the demand fluctuations. In the model with no recycling processes, utilisation percentages are considered reasonable, suggesting ideal process flow and potential for developed resource effectiveness. By contrast, the original model shows increasing blockage over time, emphasising the system’s responsiveness and sensitivity to external influences and fluctuating demand. The model with no recycling process shows minimum blockages during peak and off-peak periods, indicating an increase in operations efficiency [12,14,15]. Efficiency during off-peak periods can be improved through adjustments like labour allocation or shift scheduling. The optimal scenario is determined using a weighting system that classifies blockage levels as very low, low, moderate, high, and very high, assigned factors of 5, 4, 3, 2, and 1, respectively. The circularity score is calculated by multiplying utilisation with the blockage factor, where a higher score indicates a more efficient simulation outcome, as shown in Table 4.
Table 4.
The Circularity Index.
To obtain a better evaluation of the scenario’s performance, a Multi-Criteria Decision Analysis (MCDA) was employed. MCDA is widely used in supply chain and logistics research to support structured decision-making [41,42]. This method was chosen because it allows the comparison of multiple performance indicators. These main indicators are the idle time, machine utilisation, blockage level, and circularity index. These indicators reflect both operational efficiency and sustainability, which are central to the aim of this study.
After a comprehensive comparison of all scenarios and calculation of the Circularity Factor (2.9 for the original model and 6.25 for the no-recycling model), it is clear that the inclusion of on-site recycling leads to consistently higher blockage levels, indicating operational bottlenecks [10,13,27]. The observed bottlenecks can be attributed to several structural factors within the recycling process. The system showed insufficient buffer capacity, which limited the flow of materials when demand increased. In addition, unbalanced workstation cycle times between recycling and other warehouse activities created waiting periods and inefficiencies. These issues align with the Lean manufacturing concerns. Some improvements can be applied by using Lean and 6R tools. These improvements include balancing workstation cycle times through workload reallocation, expanding buffer capacity to absorb demand fluctuations, and redesigning recycling tasks to reduce waiting. Such measures would support smoother flow and reduce the system’s sensitivity to demand variability.
The no-recycling model achieves a higher score compared to the original model. Given that the warehouse has an agreement with an external recycling company, on-site recycling is not required at this point. Outsourcing the recycling process guarantees a smooth flow. This allows the circular system to run more efficiently without struggling with blockages [4,30,33]. Furthermore, by outsourcing recycling, the warehouse can focus more on optimising its circular transformation. This creates an opportunity to improve internal efficiency by reducing idle times and eliminating residual blockages through better resource allocation and process control.
Beyond operational insights, this study also provides theoretical contributions to the academic field and managerial implications for practitioners. Table 5 summarises how the research responds to existing gaps and highlights future research directions.
Table 5.
The summary of research existing gaps and future directions.
7. Conclusions
In recent years, as the focus on sustainability and technological advancements is rapidly increasing, logistics supply chains are connected systems that manage substantial resources. This level of complexity allows the opportunity for researchers to investigate solutions to reduce waste and emphasise continuous improvement. As businesses increasingly focus on sustainability and implement innovative technologies, improving logistics operations is crucial for achieving both environmental responsibility and operational efficiency.
This study successfully achieved its overall goal by gaining a comprehensive understanding of the warehouse’s operations. Also, the ability to identify the opportunities for developing a circular supply chain. The model was developed and validated using Discrete Event Simulation software. Starting with default data and subsequently refined through lean manufacturing approaches, including Value Stream Mapping. This iterative refinement ensured both the accuracy and practical relevance of the model.
The final circular model, validated with more accurate data, captures the complexities of warehouse operations and provides practical insights for performance improvement while supporting circular supply chain principles. Material flows were analysed across peak and off-peak seasons, producing different scenario outcomes. Notably, under the operating conditions considered in this study, the model without on-site recycling presents greater efficiency and flexibility, indicating that outsourcing recycling to external providers can be more beneficial. This approach enhances system flow and facilitates the reintegration of recycled materials, aligning with circular supply chain objectives. The suggestions for future work include extending the methodology to other materials, such as supporting materials and stretch wrapping foil, considering environmental and economic indicators, and further analysing bottlenecks like buffer capacities and cycle-time imbalances. Expanding sensitivity analysis and integrating customer collaboration strategies in a phased roadmap would also enhance the practical and academic value of the framework. Future research could explore a more comprehensive comparison using multi-objective optimisation or Pareto frontier analysis, incorporating efficiency, cost, and environmental impacts.
Author Contributions
Conceptualisation, M.P.; methodology, L.A., M.P., Y.L. and X.G.; software, L.A.; validation, L.A. and M.P.; formal analysis, L.A.; writing—original draft preparation, L.A.; writing—review and editing, M.P., Y.L. and X.G.; visualisation, L.A.; supervision, Y.L. All authors have read and agreed to the published version of the manuscript.
Funding
This research received no external funding.
Institutional Review Board Statement
Not applicable.
Informed Consent Statement
Not applicable.
Data Availability Statement
Some restrictions apply to the availability of the data used in this study. All other data and simulation models generated or analysed during the current study are included in this article.
Conflicts of Interest
The authors declare no conflicts of interest.
Abbreviations
The following abbreviations are used in this manuscript:
| CE | Circular Economy |
| DES | Discrete Event Simulation |
| 6R | Reduction, reuse, recycling, recovery, redesign, and reprocessing |
| VSM | Value Stream Mapping |
| CB | Cardboard |
| MCDA | Multi-Criteria Decision Analysis |
References
- Alasmari, L.; Packianather, M.; Tuthill, P.; Liu, Y.; Guo, X. Assessing the Circular Transformation of Warehouse Operations through Simulation. In Proceedings of the 2024 6th International Conference on Industry 4.0 and Smart Manufacturing, Prague, Czech Republic, 20–22 November 2024; pp. 1124–1133. [Google Scholar]
- Chen, H.; Liu, S.-C.; Su, T.-S. The Study for Refurbishing Process of Packaging Material in E-Commerce Logistics. In Proceedings of the 2018 IEEE International Conference on Service Operations and Logistics, and Informatics (SOLI), Singapore, 31 July–2 August 2018; IEEE: Singapore, 2018; pp. 80–84. [Google Scholar]
- DSV Accelerating Our Ambitions Towards a More Sustainable Future. 2022. Available online: https://docs.dsv.com/group/group-compliance/corporate-sustainability-report-2022/corporate-sustainability-report-2022/?page=1 (accessed on 8 October 2024).
- Ali, S.S.; Kaur, R.; Khan, S. Evaluating Sustainability Initiatives in Warehouse for Measuring Sustainability Performance: An Emerging Economy Perspective. Ann. Oper. Res. 2023, 324, 461–500. [Google Scholar] [CrossRef]
- Vidová, H.; Babčanová, D.; Witkowski, K.; Saniuk, S. Logistics and Its Environmental Impacts. In Proceedings of the 7th International Scientific Conference “Business and Management 2012”, Vilnius, Lithuania, 10–11 May 2012; Selected Papers. Vilnius Gediminas Technical University Publishing House Technika: Vilnius, Lithuania, 2012; pp. 1007–1014. [Google Scholar]
- Van Buren, N.; Demmers, M.; Van Der Heijden, R.; Witlox, F. Towards a Circular Economy: The Role of Dutch Logistics Industries and Governments. Sustainability 2016, 8, 647. [Google Scholar] [CrossRef]
- Barros, M.V.; Salvador, R.; Do Prado, G.F.; De Francisco, A.C.; Piekarski, C.M. Circular Economy as a Driver to Sustainable Businesses. Clean. Environ. Syst. 2021, 2, 100006. [Google Scholar] [CrossRef]
- Lahti, T.; Wincent, J.; Parida, V. A Definition and Theoretical Review of the Circular Economy, Value Creation, and Sustainable Business Models: Where Are We Now and Where Should Research Move in the Future? Sustainability 2018, 10, 2799. [Google Scholar] [CrossRef]
- Geissdoerfer, M.; Morioka, S.N.; De Carvalho, M.M.; Evans, S. Business Models and Supply Chains for the Circular Economy. J. Clean. Prod. 2018, 190, 712–721. [Google Scholar] [CrossRef]
- Kristensen, H.S.; Mosgaard, M.A. A Review of Micro Level Indicators for a Circular Economy—Moving Away from the Three Dimensions of Sustainability? J. Clean. Prod. 2020, 243, 118531. [Google Scholar] [CrossRef]
- Suresh, J.; Agarwal, V.; Janardhanan, M.; Saikouk, T. Unlocking Sustainability: Overcoming Barriers to Circular Economy Implementation in Warehouse Fulfilment Centers. J. Clean. Prod. 2024, 485, 144391. [Google Scholar] [CrossRef]
- Taddei, E.; Sassanelli, C.; Rosa, P.; Terzi, S. Circular Supply Chains Theoretical Gaps and Practical Barriers: A Model to Support Approaching Firms in the Era of Industry 4.0. Comput. Ind. Eng. 2024, 190, 110049. [Google Scholar] [CrossRef]
- Batista, L.; Bourlakis, M.; Liu, Y.; Smart, P.; Sohal, A. Supply Chain Operations for a Circular Economy. Prod. Plan. Control 2018, 29, 419–424. [Google Scholar] [CrossRef]
- Kandasamy, J.; Venkat, V.; Mani, R.S. Barriers to the Adoption of Digital Technologies in a Functional Circular Economy Network. Oper. Manag. Res. 2023, 16, 1541–1561. [Google Scholar] [CrossRef]
- Sonar, H.; Dey Sarkar, B.; Joshi, P.; Ghag, N.; Choubey, V.; Jagtap, S. Navigating Barriers to Reverse Logistics Adoption in Circular Economy: An Integrated Approach for Sustainable Development. Clean. Logist. Supply Chain. 2024, 12, 100165. [Google Scholar] [CrossRef]
- Centobelli, P.; Cerchione, R.; Esposito, E. Developing the WH 2 Framework for Environmental Sustainability in Logistics Service Providers: A Taxonomy of Green Initiatives. J. Clean. Prod. 2017, 165, 1063–1077. [Google Scholar] [CrossRef]
- Meneghetti, A.; Monti, L. Greening the Food Supply Chain: An Optimisation Model for Sustainable Design of Refrigerated Automated Warehouses. Int. J. Prod. Res. 2015, 53, 6567–6587. [Google Scholar] [CrossRef]
- Yakavenka, V.; Mallidis, I.; Vlachos, D.; Iakovou, E.; Eleni, Z. Development of a Multi-Objective Model for the Design of Sustainable Supply Chains: The Case of Perishable Food Products. Ann. Oper. Res. 2020, 294, 593–621. [Google Scholar] [CrossRef]
- Forno, A.J.D.; Pereira, F.A.; Forcellini, F.A.; Kipper, L.M. Value Stream Mapping: A Study about the Problems and Challenges Found in the Literature from the Past 15 Years about Application of Lean Tools. Int. J. Adv. Manuf. Technol. 2014, 72, 779–790. [Google Scholar] [CrossRef]
- Hartini, S.; Wicaksono, P.A.; Rizal, A.M.D.; Hamdi, M. Integration Lean Manufacturing and 6R to Reduce Wood Waste in Furniture Company toward Circular Economy. IOP Conf. Ser. Mater. Sci. Eng. 2021, 1072, 012067. [Google Scholar] [CrossRef]
- Pierli, G. Development of an Integrated Analysis Methodology for Lean Manufacturing and Sustainable Development in the Mechanical Engineering Industry; University of Urbino Carlo Bo: Urbino, Italy, 2024. [Google Scholar]
- Jawahir, I.S.; Bradley, R. Technological Elements of Circular Economy and the Principles of 6R-Based Closed-Loop Material Flow in Sustainable Manufacturing. Procedia CIRP 2016, 40, 103–108. [Google Scholar] [CrossRef]
- Huang, B.; Wang, X.; Kua, H.; Geng, Y.; Bleischwitz, R.; Ren, J. Construction and Demolition Waste Management in China through the 3R Principle. Resour. Conserv. Recycl. 2018, 129, 36–44. [Google Scholar] [CrossRef]
- Fares, N.; Lloret, J.; Kumar, V.; Frederico, G.F.; Kamach, O.; Garza-Reyes, J.A. Lean Implementation Case Study for Manual Order Picking and Packing in Warehousing Operations. IJLSS 2025. [Google Scholar] [CrossRef]
- Liu, M.; Sun, M.; Zhang, X.; Ge, M.; Hu, J. Real-Time Shop Floor Operations Improvement Based on Dynamic Value Stream Mapping and Hybrid Simulation in Industry 4.0: An Economic Perspective. Int. J. Prod. Res. 2025, 63, 6776–6800. [Google Scholar] [CrossRef]
- Ghaithan, A.M.; Alshammakhi, Y.; Mohammed, A.; Mazher, K.M. Integrated Impact of Circular Economy, Industry 4.0, and Lean Manufacturing on Sustainability Performance of Manufacturing Firms. Int. J. Environ. Res. Public Health 2023, 20, 5119. [Google Scholar] [CrossRef] [PubMed]
- Nadeem, S.P.; Garza-Reyes, J.A.; Anosike, A.I.; Kumar, V. Coalescing the Lean and Circular Economy. In Proceedings of the International Conference on Industrial Engineering and Operations Management, Bangkok, Thailand, 5–7 March 2019. [Google Scholar]
- Ivanova, U. Enhancing Last-Mile Delivery Efficiency: A Lean-Based Framework for Sustainable Logistics in the Helsinki Metropolitan Area. Bachelor’s Thesis, Haaga-Helia University of Applied Sciences, Haaga, The Netherlands, 2025. [Google Scholar]
- Hedlund, C.; Stenmark, P.; Noaksson, E.; Lilja, J. More Value from Fewer Resources: How to Expand Value Stream Mapping with Ideas from Circular Economy. Int. J. Qual. Serv. Sci. 2020, 12, 447–459. [Google Scholar] [CrossRef]
- Ravichandran, M.; Vimal, K.E.K.; Kumar, V.; Kulkarni, O.; Govindaswamy, S.; Kandasamy, J. Environment and Economic Analysis of Reverse Supply Chain Scenarios for Remanufacturing Using Discrete-Event Simulation Approach. Env. Dev. Sustain. 2023, 26, 10183–10224. [Google Scholar] [CrossRef] [PubMed]
- Tryggvadottir, T. A Simulation-Based Decision Support for Reverse Logistics of Spare Parts. Master’s Thesis, KTH, School of Industrial Engineering and Management (ITM), Stockholm, Sweden, 2023. [Google Scholar]
- Intini, F.; Merla, P.; Pagliara, R.; Partipilo, M.; Stigliano, G.; Veneto, D. Discrete Event Simulation for the Analysis and Re-Engineering of Production and Logistics Cycles: The Case of Master Italy Company. In Proceedings of the Information Systems and Technologies; Rocha, A., Adeli, H., Dzemyda, G., Moreira, F., Colla, V., Eds.; Springer Nature: Cham, Switzerland, 2024; pp. 361–370. [Google Scholar]
- Khan, A.A.; Abonyi, J. Simulation of Sustainable Manufacturing Solutions: Tools for Enabling Circular Economy. Sustainability 2022, 14, 9796. [Google Scholar] [CrossRef]
- Accorsi, R.; Baruffaldi, G.; Manzini, R. A Closed-Loop Packaging Network Design Model to Foster Infinitely Reusable and Recyclable Containers in Food Industry. Sustain. Prod. Consum. 2020, 24, 48–61. [Google Scholar] [CrossRef]
- Charnley, F.; Tiwari, D.; Hutabarat, W.; Moreno, M.; Okorie, O.; Tiwari, A. Simulation to Enable a Data-Driven Circular Economy. Sustainability 2019, 11, 3379. [Google Scholar] [CrossRef]
- Moreno, M.; Court, R.; Wright, M.; Charnley, F. Opportunities for Redistributed Manufacturing and Digital Intelligence as Enablers of a Circular Economy. Int. J. Sustain. Eng. 2019, 12, 77–94. [Google Scholar] [CrossRef]
- Detty, R.B.; Yingling, J.C. Quantifying Benefits of Conversion to Lean Manufacturing with Discrete Event Simulation: A Case Study. Int. J. Prod. Res. 2000, 38, 429–445. [Google Scholar] [CrossRef]
- Kang, J.; Alejandro, T.B.; Groza, M.D. Customer–Company Identification and the Effectiveness of Loyalty Programs. J. Bus. Res. 2015, 68, 464–471. [Google Scholar] [CrossRef]
- Tako, A.A.; Robinson, S. The Application of Discrete Event Simulation and System Dynamics in the Logistics and Supply Chain Context. Decis. Support. Syst. 2012, 52, 802–815. [Google Scholar] [CrossRef]
- Law, A. Simulation Modeling and Analysis, 5th ed.; McGraw-Hill Education: New York, NY, USA, 2015; ISBN 978-0-07-340132-4. [Google Scholar]
- Rehman, T.; Khan, S.A.; Kusi-Sarpong, S.; Hassan, S.M. Supply Chain Performance Measurement and Improvement System: A MCDA-DMAIC Methodology. J. Model. Manag. 2018, 13, 522–549. [Google Scholar] [CrossRef]
- Barasin, A.M.; Alqahtani, A.Y.; Makki, A.A. Performance Evaluation of Retail Warehouses: A Combined MCDM Approach Using G-BWM and RATMI. Logistics 2024, 8, 10. [Google Scholar] [CrossRef]
Disclaimer/Publisher’s Note: The statements, opinions and data contained in all publications are solely those of the individual author(s) and contributor(s) and not of MDPI and/or the editor(s). MDPI and/or the editor(s) disclaim responsibility for any injury to people or property resulting from any ideas, methods, instructions or products referred to in the content. |
© 2025 by the authors. Licensee MDPI, Basel, Switzerland. This article is an open access article distributed under the terms and conditions of the Creative Commons Attribution (CC BY) license (https://creativecommons.org/licenses/by/4.0/).