1. Introduction
Hip Osteoarthritis (HOA) is a chronic hip disease that progressively degenerates the cartilage holding the joint together and eventually leads to its dysfunction [
1]. The subsequent pain, experienced commonly, causes lateral trunk bending that overloads other parts of the musculoskeletal system for compensation; thus, treatment is generally required [
2]. Total Hip Arthroplasty (THA) is commonly considered as an important option that alleviates pain and restores functionality in most subjects. However, the literature reveals that post-THA improvements do not completely reduce pain nor return the quality of life to that of healthy individuals [
3]. This is due to muscle weaknesses responsible for gait adaptations after THA [
4] affecting even the non-operated limb.
The accepted standard in assessing hip functionality before and after THA is through the Harris Hip Score (HHS), which is a validated clinical tool. It focuses on pain, function, and range of motion. The HHS is conducted in questionnaire form. The main drawback is its subjectivity [
5], and this is where our DL model could be helpful as an additional tool. Our DL methodology is an objective tool. Alternatively, an objective measure is through radiograph images that depict hip structure anomalies, but still, it has its static nature and does not capture motion features [
6].
A more suitable alternative measurement is based on gait, which is defined as a manner of walking. Gait is meticulously studied in several areas such as security, sports, and biomedical applications [
7]. The gait features are known to have discriminating abilities. Its non-invasive utilization provides us with an understanding of the wellbeing of athletes as well as biometric authentication for remote and mobile devices [
8,
9]. Prominently, the use of gait analysis, in clinical settings, is extensively investigated, focusing on gait abnormalities due to pathological diseases such as multiple sclerosis, Parkinson’s Disease [
10], and other neuro-muscular diseases.
The analysis of gait is the systematic examination of human walking via the observation of an expert with the help of data acquisition (DAQ) devices to measure kinematics, kinetics, and spatio-temporal parameters (STP) [
2]. Kinematic parameters describe motion without reference to the force, while kinetics is the study of force, moments, and acceleration without orientation.
In the context of HOA research, vision-based clinical gait analysis (CGA) systems are the most popular. They are focused on relevant kinematic angle detection that can classify HOA gaits and predict severity. Constantinou et al. [
11] devised a case study to characterize hip joint kinematics during gait for mild-to-moderate HOA. It was found that the sagittal and transverse hip angles are significantly different from healthy subjects, and the net hip joint loading is altered in HOA, suggesting a progression of the disease. Consequently, Leigh et al. [
12] investigated the lower limb’s gait kinematics of HOA subjects and found out that the sagittal and transverse angles of the pelvis, as well as the front angle of the hip, are discriminative for HOA subjects.
Similarly, extensive studies were conducted on gait-related differences before and after THA. Dindorf et al. [
13] utilized the overall gait waveform cycle to detect relevant kinematic parameters to describe asymmetrical gaits in patients after THA. Frontal and sagittal angles of the knee and the sagittal angle of the hip are found to be the most discriminating kinematic parameters with a reported accuracy of 91%. Subsequently, Longworth et al. [
14] hypothesized that inter-joint coordination information can be used to characterize healthy, HOA, and post-THA gaits through cyclogram analysis. Knee and ankle angles were found to have discriminating patterns for the different classes. Additionally, Fujii et al. [
15] developed a model to predict pelvic sagittal angle five years after THA utilizing gait information one year after surgery with 91% accuracy.
These discriminating kinematic parameters for HOA and after THA are critical in the selection for classification model inputs among several hundreds of kinematic trajectories produced by CGA. Still, there is a lack of consensus on which of these kinematic outcomes provide the best result in the diagnosis and follow up in patients. Gait modifications could already be subtly manifested before the onset of functional infirmities; thus, discriminating information for HOA is important. The results have potential implications for proper treatment and rehabilitation efforts after THA surgery from different severity levels.
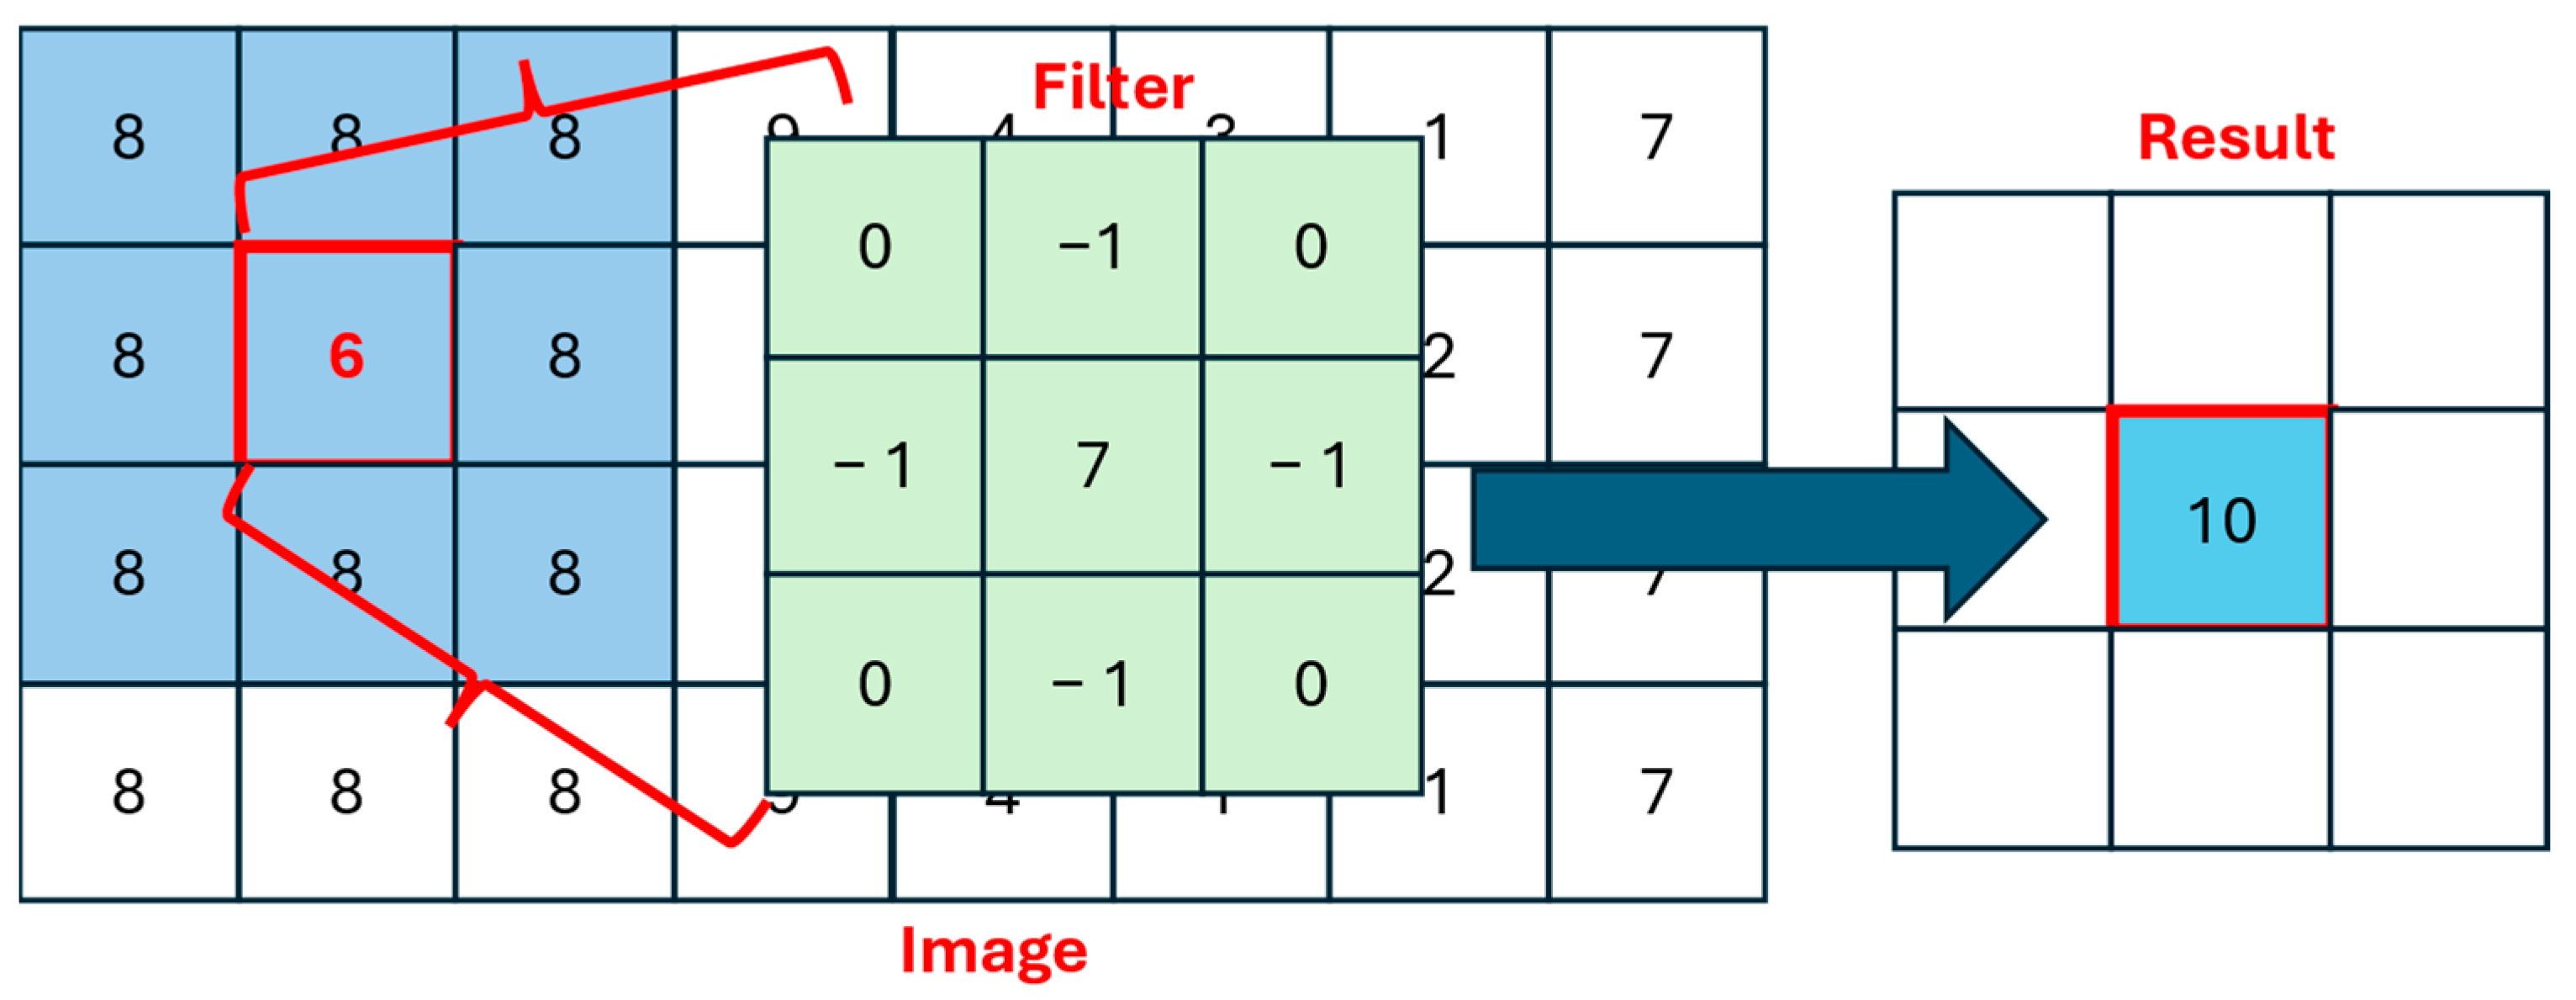
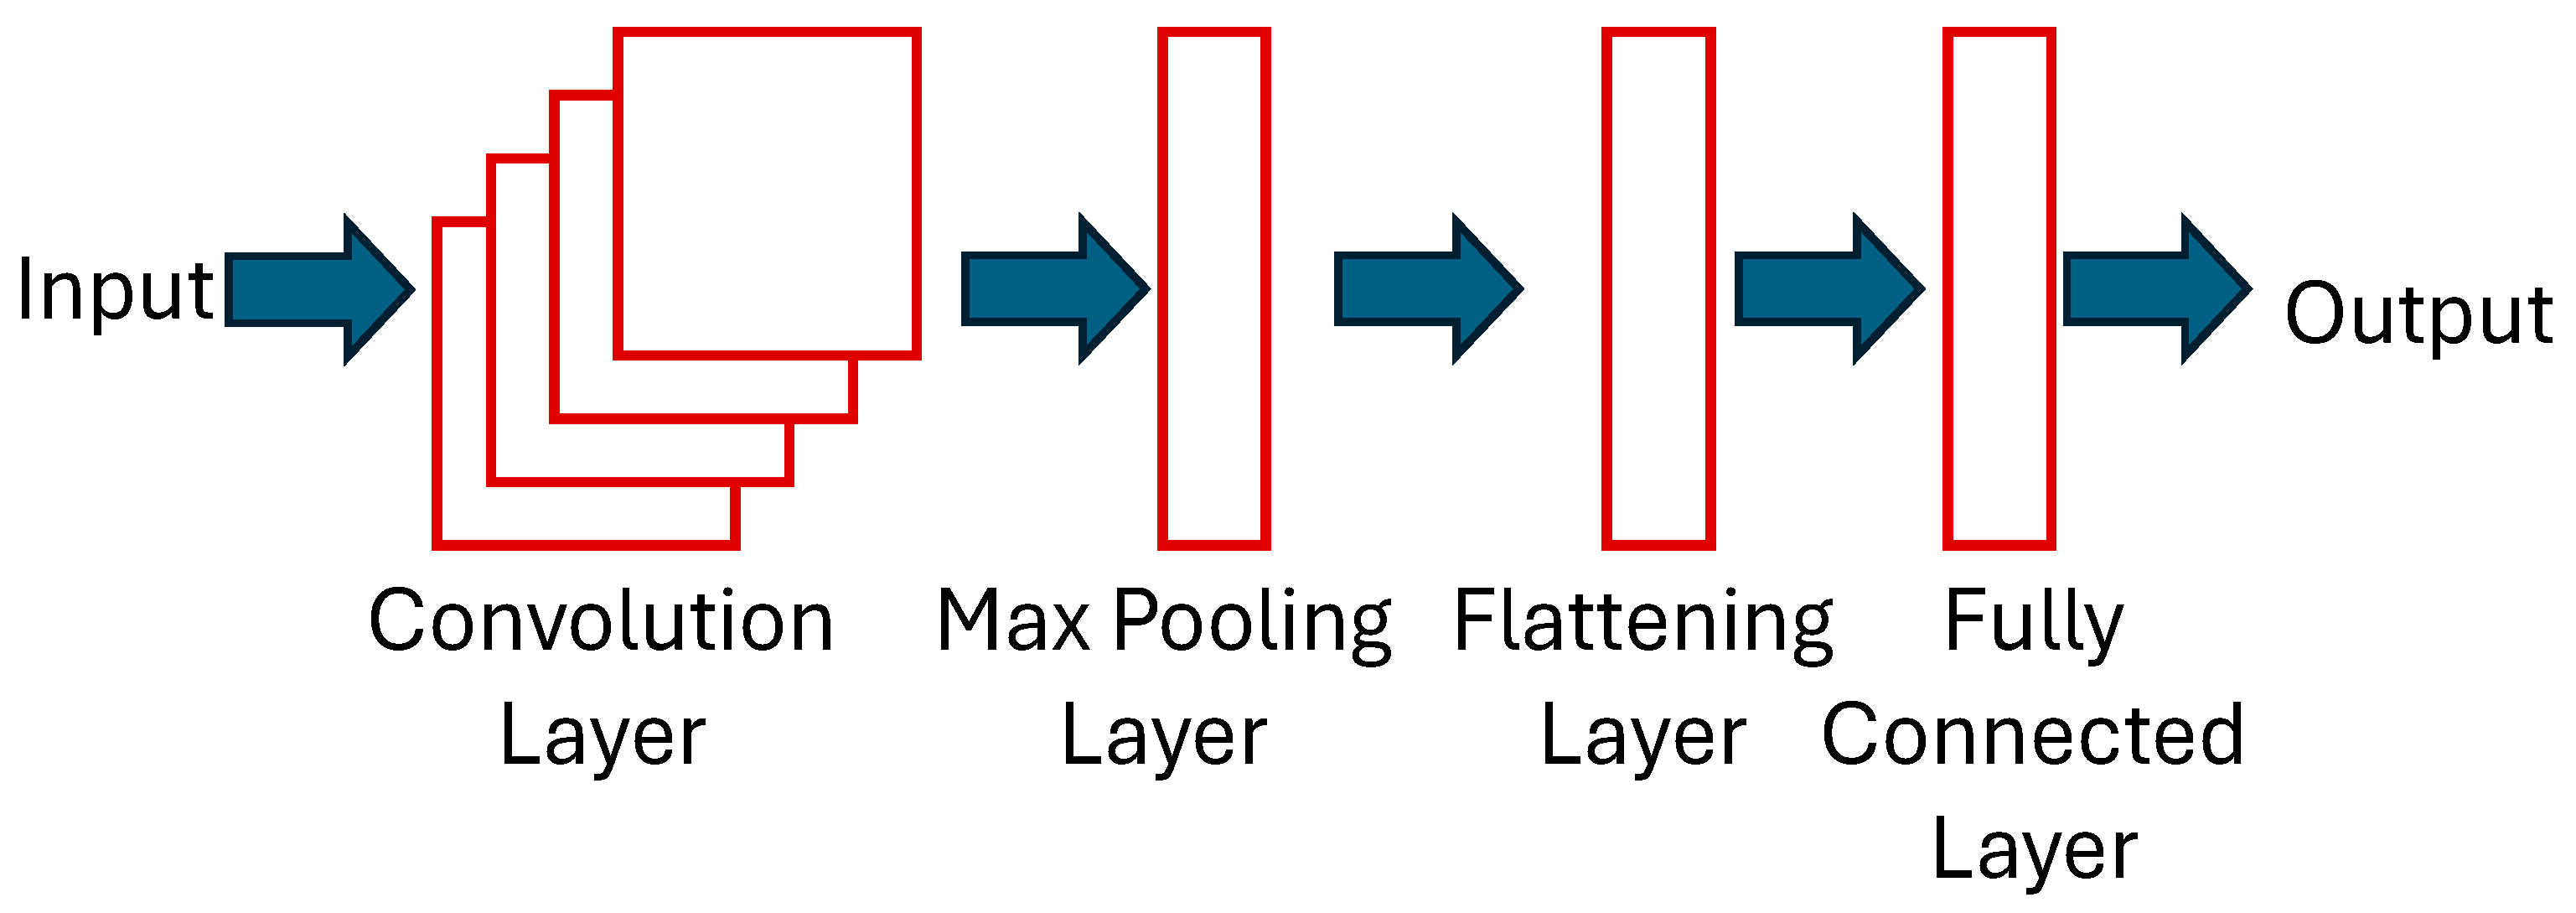
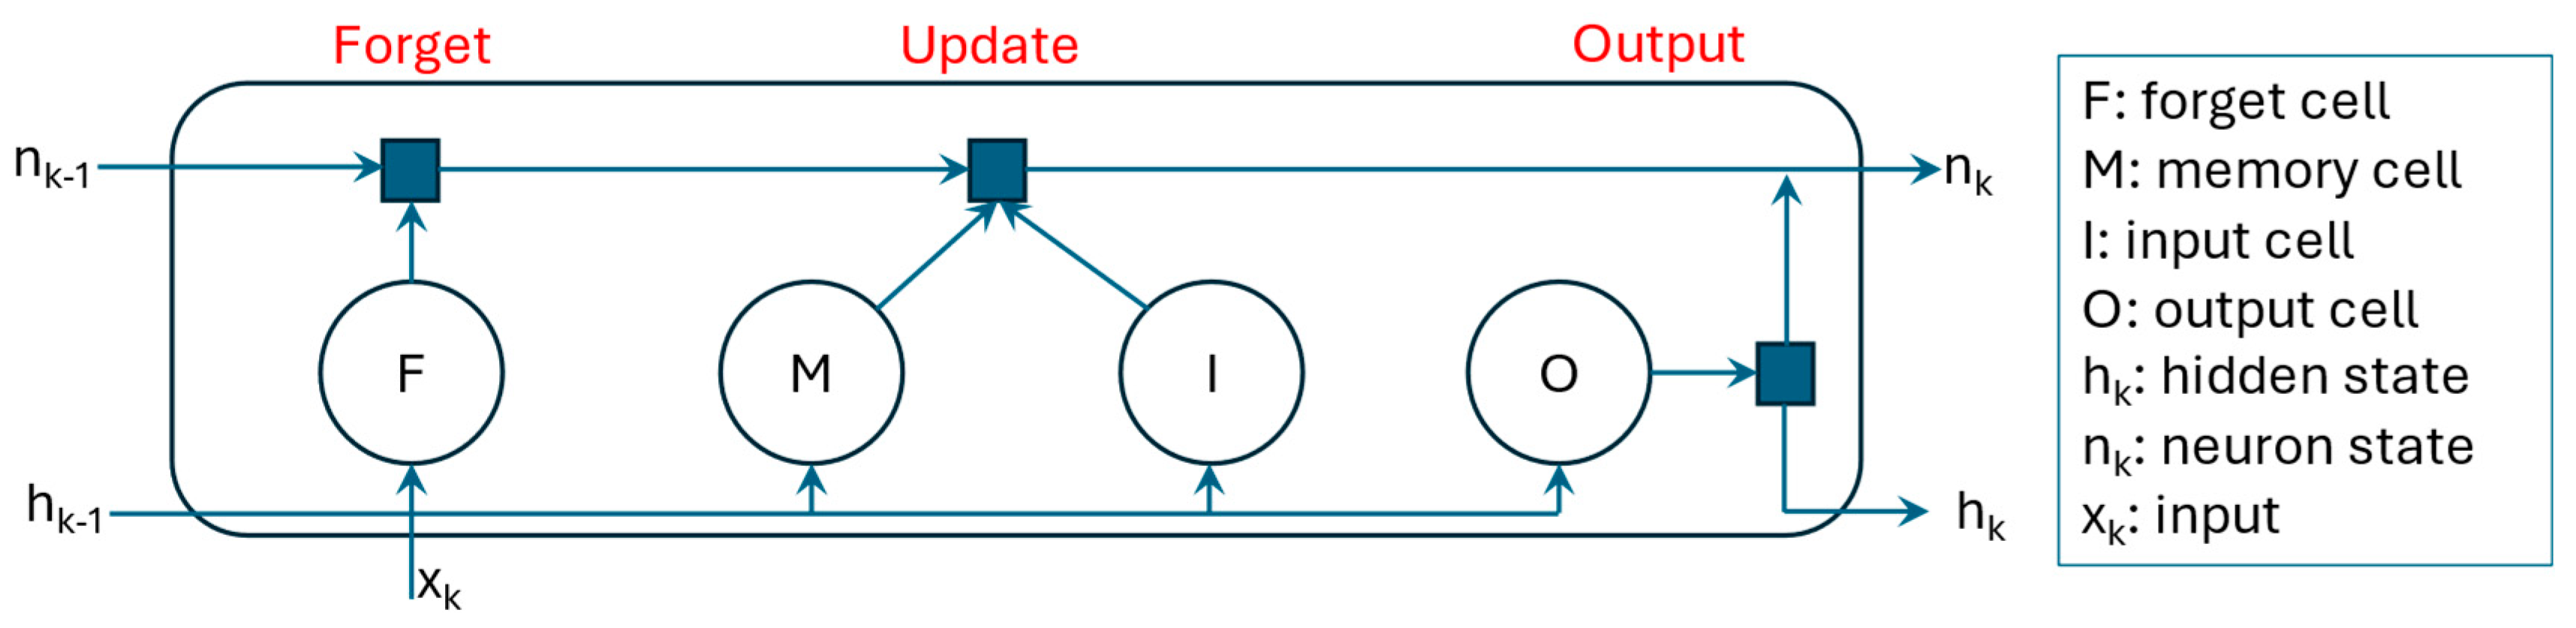
There are several methods to make accurate classifications and predictions utilizing gait patterns. Recently, the development of Deep Learning (DL), a subset of machine learning (ML) methods, has seen increasing advances in the field of computer science. Specifically, convolutional neural networks (CNNs) and long short-term memory (LSTM) have exhibited outstanding information extraction and modeling capabilities in different gait-related applications. The former is known for its excellent feature extraction capabilities, and the latter has strength in detecting time step dependencies from long sequential data.
Quite recently, a CNN model was employed to extract STP in a single gait cycle [
16]. A publicly available eGAIT dataset, based on inertial measurements, was used as input. Two DL models were considered, namely multi-classification and ensemble models. Decent results were achieved, but the authors emphasized the need for a larger dataset to improve DL performance. Additionally, a related study was conducted to predict different STP for knee osteoarthritis and total knee arthroplasty subjects through a CNN model [
17] with inertial measurements as inputs. The architecture is not particularly deep with only two convolutional layers involved. Conversely, LSTM networks were designed to classify alterations or abnormalities of gait using wearable sensors [
18,
19]. Results were achieved with accuracy above 80% in both LSTM studies. It should be noted that hybrid LSTM-CNN (HLSTM-CNN) architectures have not been considered in the analysis of gait, but have shown promising results from other areas such as text classification [
20], heart beat classification [
21], and power flow prediction [
22].
The rest of this paper is organized as follows: work related to ML-based HOA gait classification is given in
Section 2, a brief description of the DL model is provided in
Section 3, the proposed methodology and dataset description is presented in
Section 4, and the results and discussion are presented in
Section 5. Finally, conclusions of the research and future directions are summarized in
Section 6 and
Section 7, respectively.
2. Related Works
Very few scientific studies have been published in the field of HOA gait classification using ML techniques. Laroche et al. [
23] extensively investigated ML applications utilizing HOA gait information. A Support Vector Machine (SVM) with a linear kernel was applied on kinematic trajectories to differentiate gaits between healthy and HOA patients. The overall reported accuracy is at 88%, with the sagittal hip angle providing the highest discriminating result at 85%, while the rest of the considered kinematic trajectories, from the knees and feet, were registered below 80%. Like other shallow networks, considerable work is completed with feature extraction that includes manual handcrafting. This is considered to be the traditional ML model’s major disadvantage.
A decade after the publication of the first study in this field, Pantonial et al. [
24] designed a DL architecture through the transfer learning method on kinematic trajectories for the classification of HOA and healthy gaits. Transfer learning is a DL methodology that utilizes a pre-trained network from a different domain that is re-used for faster training but maintains performance. In the presented investigation, a state-of-the-art image-based CNN was used and re-purposed for the gait classification problem. A novel tiling method is also employed to exploit both the operated and non-operated limb in one image. The result showed a 97% G-Mean score using the sagittal hip angle, while the rest of the considered kinematic parameters are upward of 90% in accuracy. An additional step is required to transform the gait cycle into an image via a continuous wavelet transform scalogram. Thus, the method requires more computational resources.
Teufl et al. [
25] used IMU sensors to acquire gait kinematics and STP for an SVM model with a Gaussian RBF Kernel to discriminate impaired and non-impaired gaits after THA. Healthy and post-THA subjects were used for the classification and, conspicuously, without HOA gait information. It was found by their study that kinematic parameters are more significant with 97% validation accuracy as compared to STP with 87%.
Overall, there is a clear research gap in the investigation of healthy, HOA, and post-THA gaits in one protocol as a multi-classification problem.
Table 1 summarizes the related research on HOA gait analysis based on ML techniques. Whilst exploratory CNN work has been recently conducted by Pantonial et al. [
24], there is a research gap in the comprehensive investigation of HOA and THA research utilizing DL methodologies.
Generally, the contribution of this paper is as follows:
HLSTM-CNN model is presented and tested for the multi-classification of healthy, HOA, and post-THA gaits.
Investigation of the most relevant kinematic parameters that can best discriminate the multi-class problem.
Performance evaluation and comparison of the proposed HLSTM-CNN model with methodologies published in the literature.
Examination of the multi-classification model and its applicability in determining the success and failure of THA operation.
4. Methodology
The proposed methodology can be divided into four distinct tasks: (1) dataset and kinematic parameter selection, (2) data pre-processing, (3) development of HLSTM-CNN model, and (4) evaluation of design. This is aptly summarized in
Figure 5.
4.1. Dataset Description and Kinematic Parameter Selection
Several papers have emphasized the necessity of a large and publicly available dataset to improve valuable metrics in gait research [
1,
7,
24]. The motivation is for seamless performance comparison among developed algorithms; thus, benchmarking can easily be conducted and an agreement on significant parameters can be accelerated. With this in mind, a recently published gait analysis dataset [
30] of 80 healthy and 106 subjects before and 6 months after THA is utilized in this research. HOA identification is based on American College of Rheumatology Criteria and verified with radiological assessment.
Three-dimensional gait trajectories are captured via reflective markers and a vision-based system with eight optoelectronic cameras and floor-based sensors with two force plates utilized for the synchronized measurements. Thus, both kinematic and kinematic parameters are captured in the protocol. Ten trials are performed by each participant on a 6 m walkway. For brevity, demographic information of the volunteers is summarized in
Table 2.
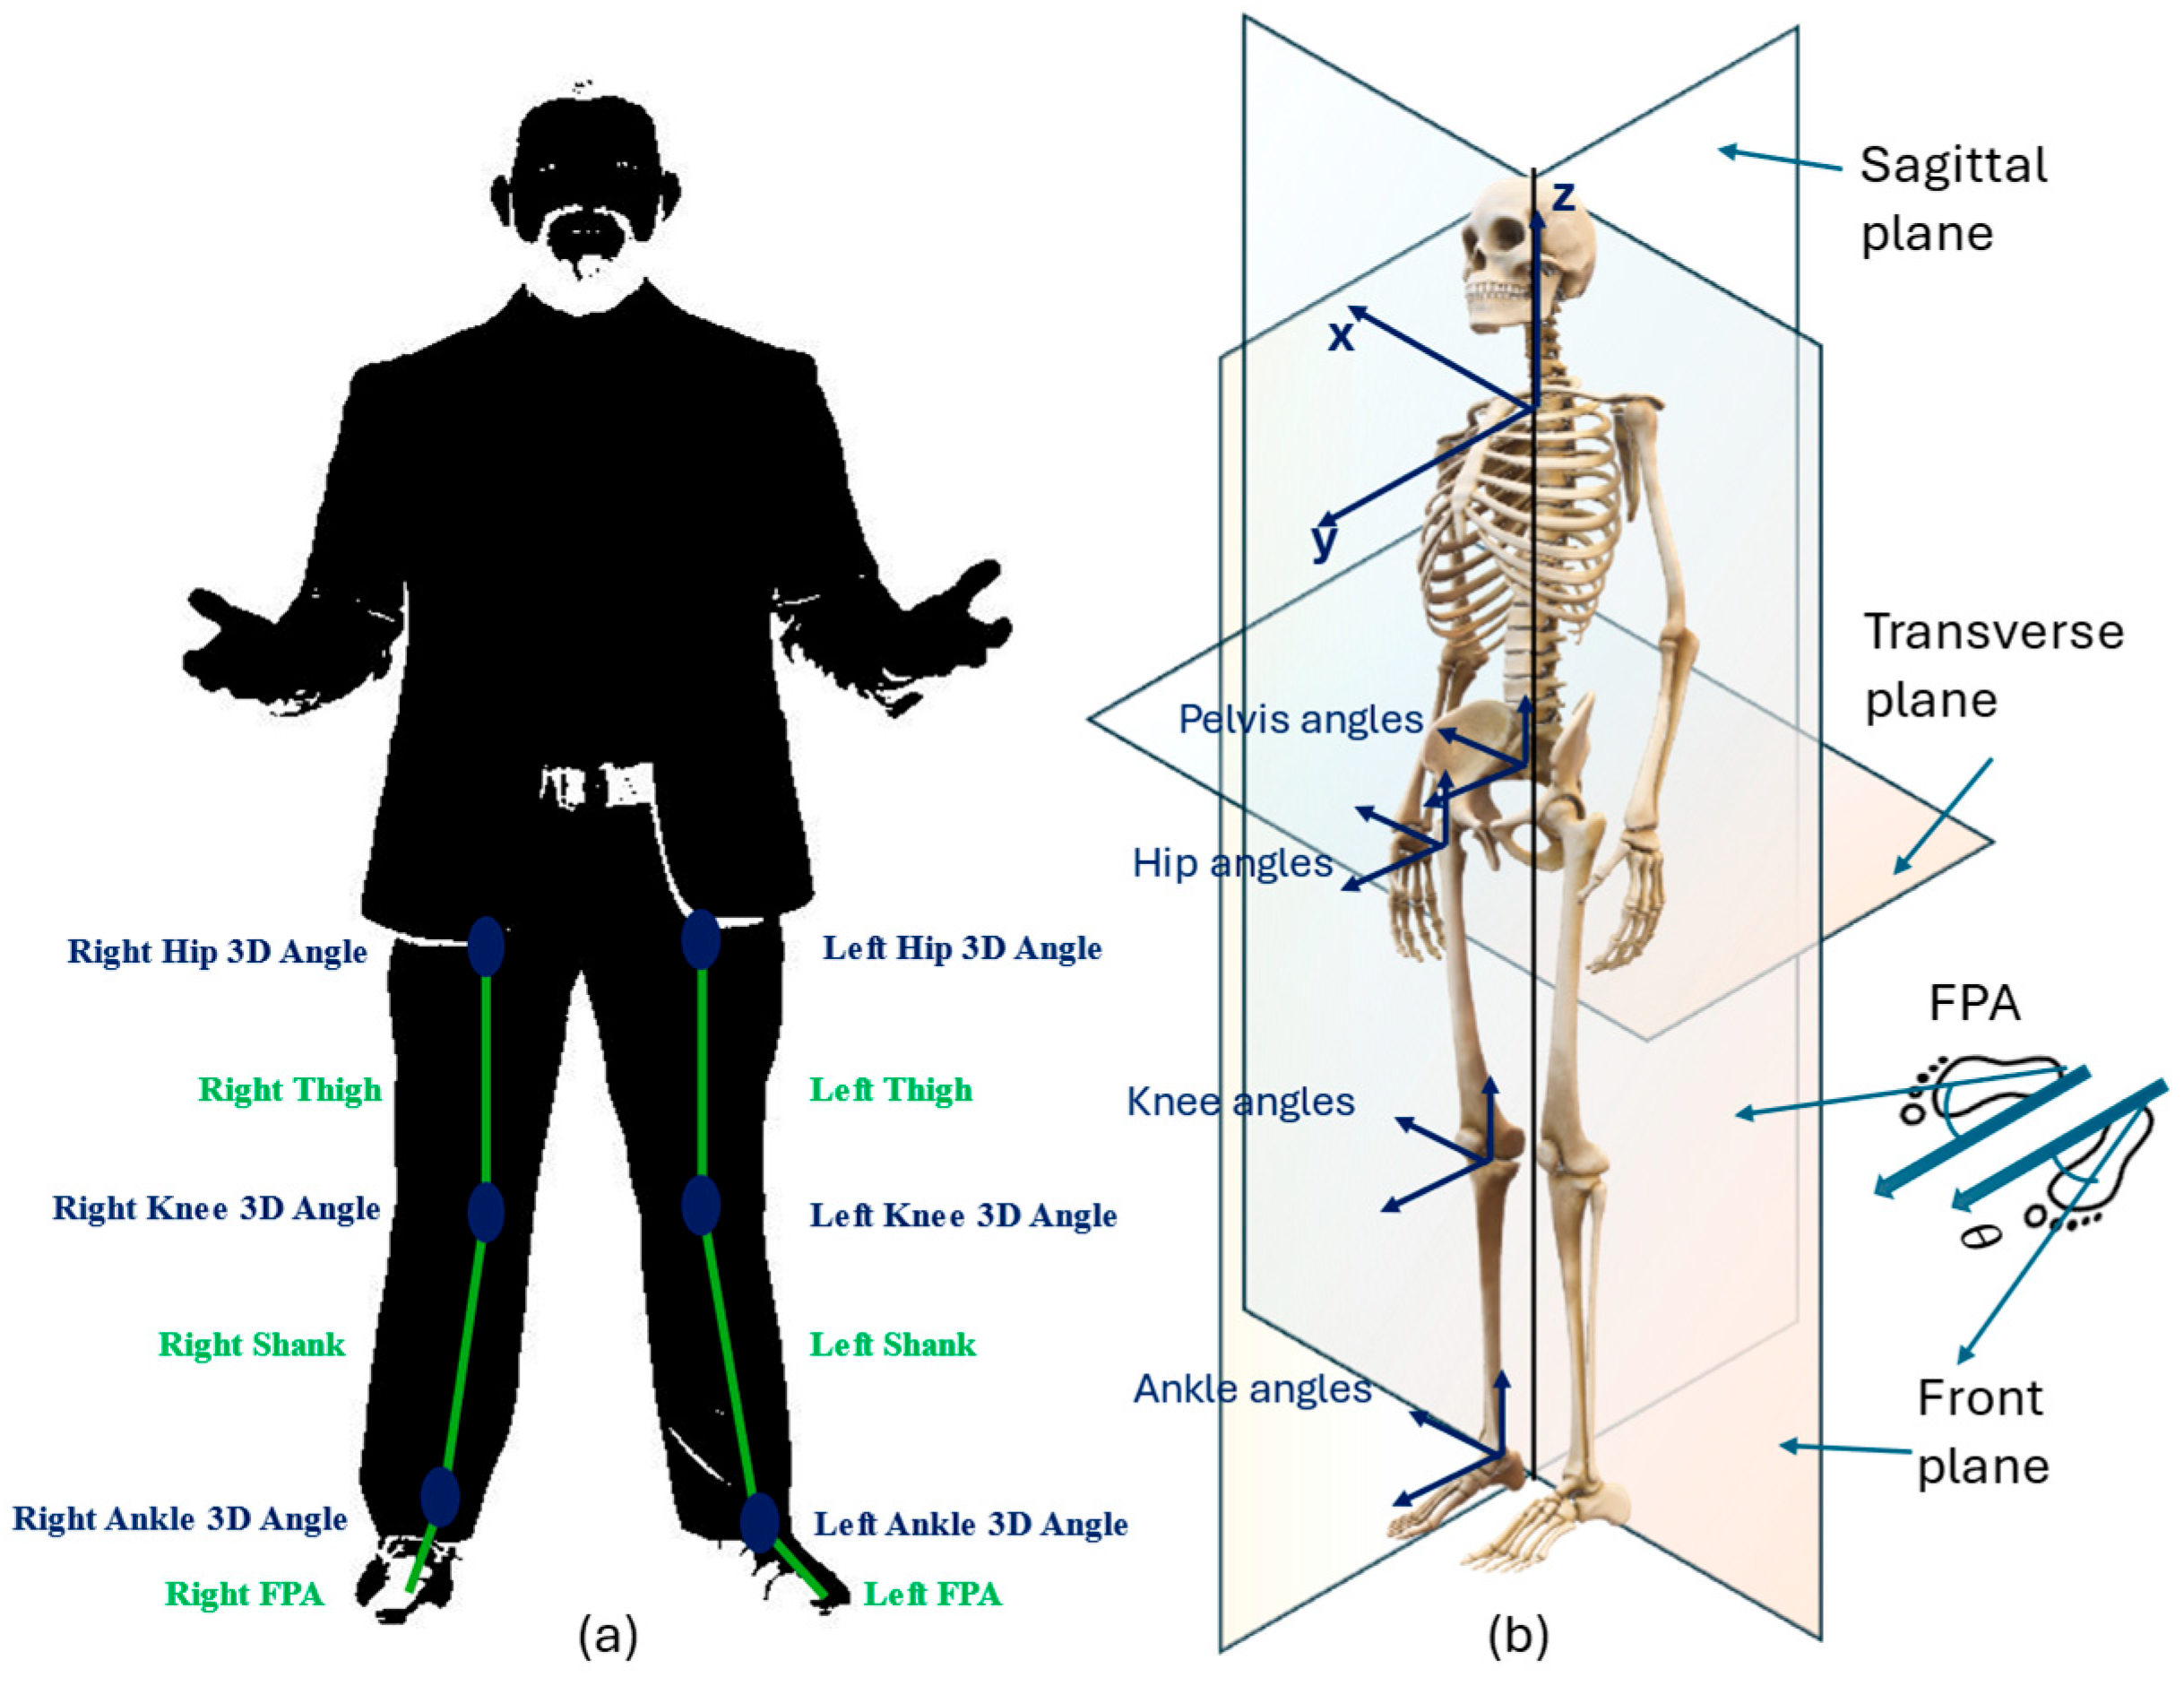
In this study, trajectories from the reflective markers on the lower limbs are considered as shown
Figure 6a. Different planar views, as shown in
Figure 6b, of the computed kinematic trajectories are used, namely sagittal (x-axis), frontal/coronal (y-axis), and transverse (z-axis).
Explicitly, the relevant joint angles are the ankle, hip, knee, pelvis, and the foot progression angle (FPA). By definition, the FPA is the angle of the foot with respect to the walking direction. Following results from gait analysis on HOA [
23,
24,
25] and after THA operation [
13,
15,
31], the following kinematic angles are used in this study to provide sufficient discrimination related to gait dysfunctionalities:
Pelvis: Transverse and Front Angles
Hip: Sagittal and Front Angles
Knee: Sagittal and Front Angles
Ankle: Sagittal and Front Angles
FPA: Sagittal and Front Angles
4.2. Data Pre-Processing and Representation
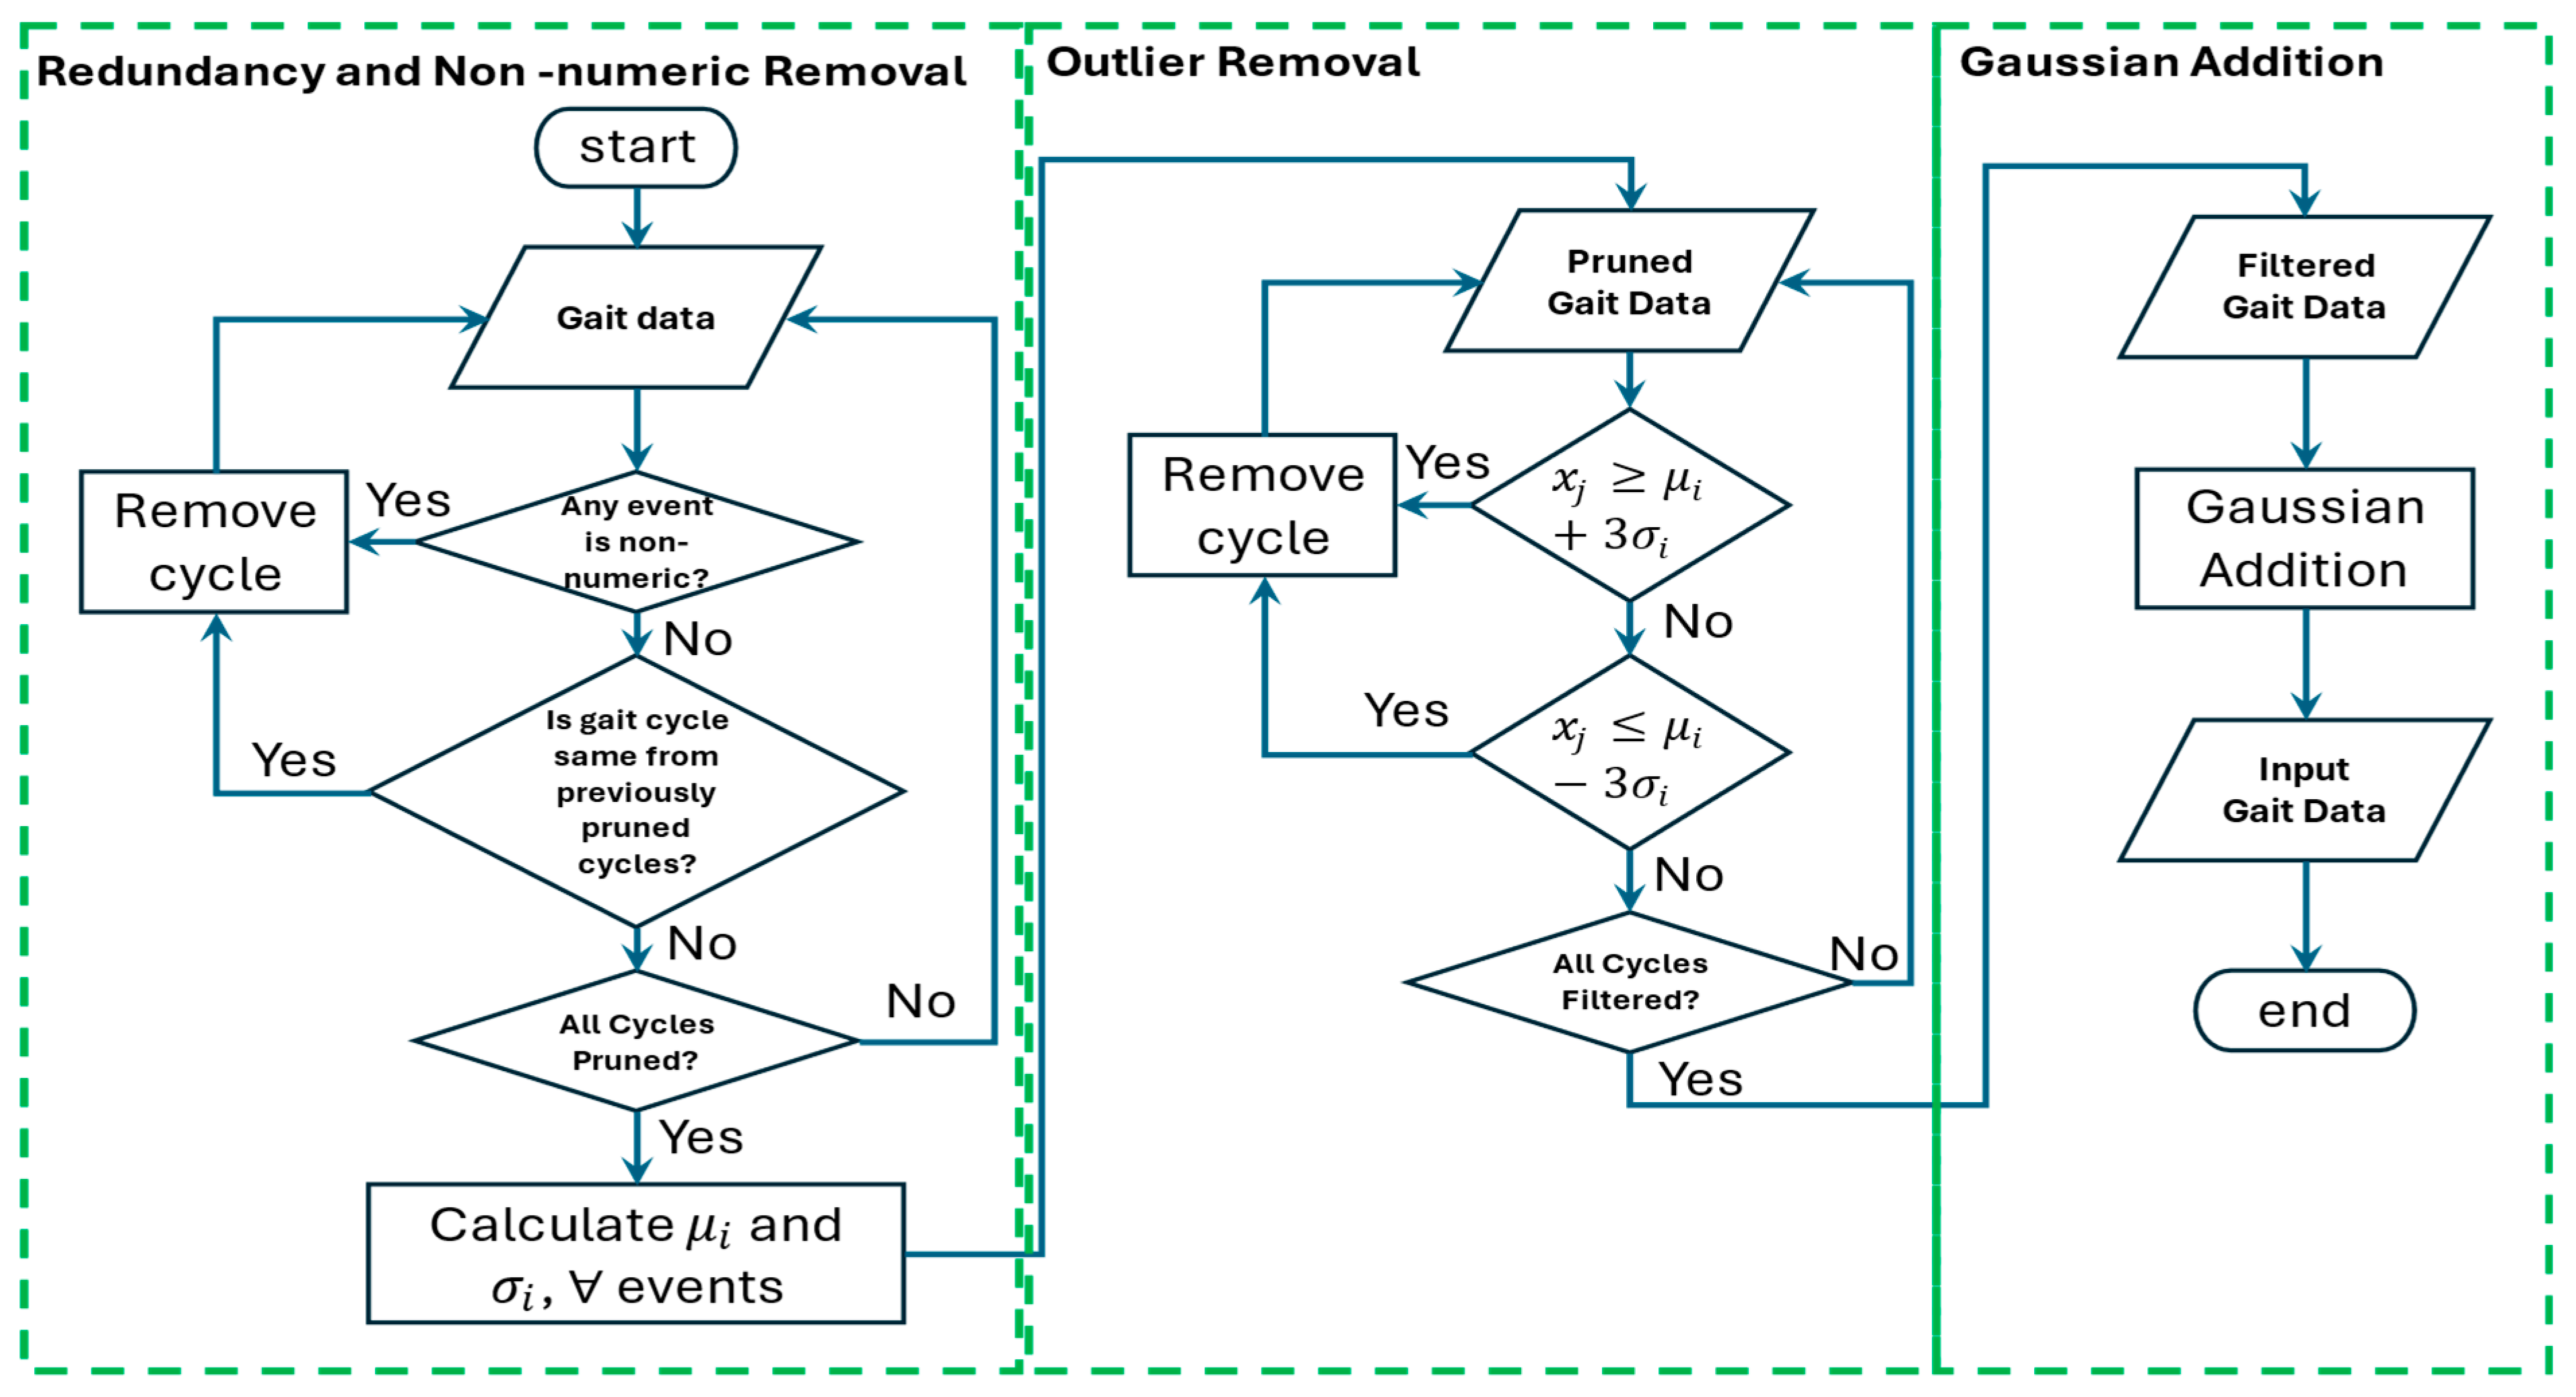
Pre-processing is implemented to improve feature extraction and remove unnecessary information. Upon closer scrutiny of the raw data, redundant and non-numeric information is found across all kinematic angles. Thus, this is automatically removed from the dataset. Then, outliers are removed using a standard deviation method by taking the mean
and standard deviation
for each event of the gait sequence as described below:
where
is the length of the gait cycle, which, in this dataset, involves one hundred points or events, and
is the size of the dataset for healthy, HOA, and 6 months post-THA gaits, respectively. Measured gaits with a value greater than
in any of the events are automatically removed from the dataset. The resulting aggregated datasets are shown in
Figure 7 with black, red, and blue strands as HOA, healthy, and 6 months post-THA gaits, respectively.
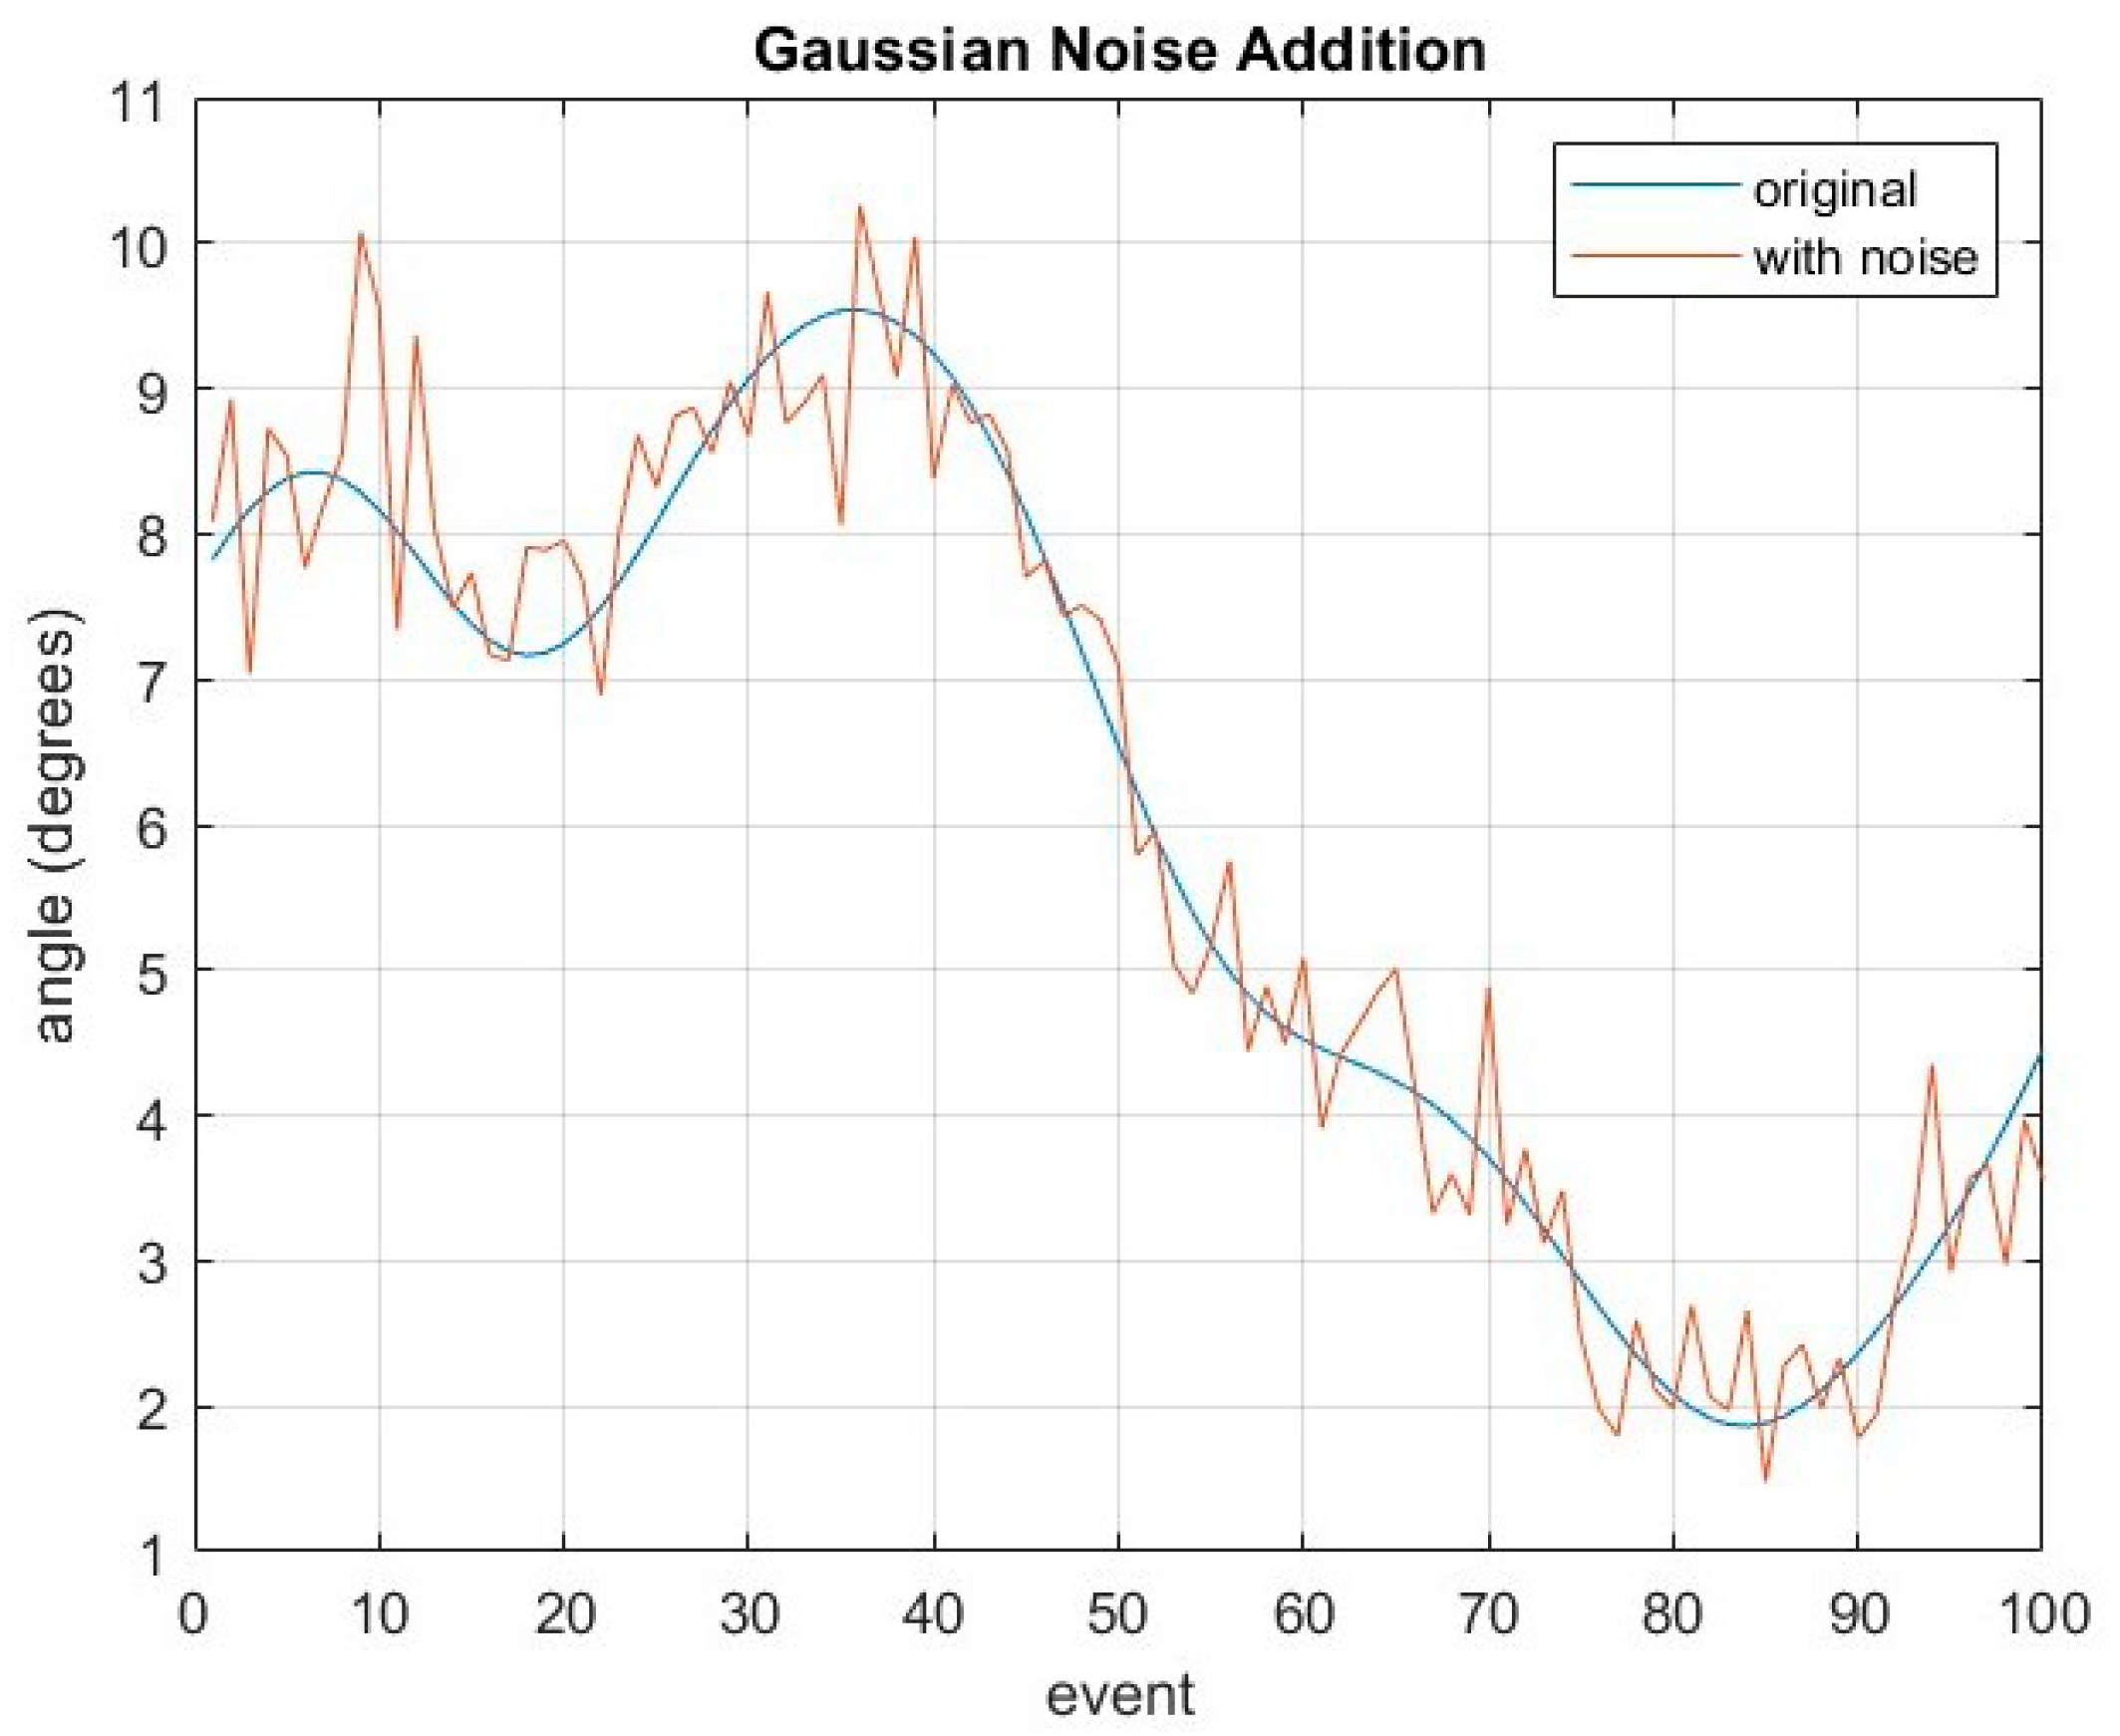
Through visual observations, HOA-afflicted gaits have larger variance compared to healthy gaits, with THA showing some variations as well. Subsequently, data augmentation strategies are considered to improve generalization by increasing the size of the dataset. Essentially, artificial data are generated to be included in the training process. Popular data augmentation strategies from the literature include translation, shifting, rotation, and noise addition. Closer inspection reveals that Gaussian noise addition is the only strategy applicable for gait sequences which can be explained by Equation (10) given below:
where
is the Gaussian noise added for every event of the gait cycle. An example is shown in
Figure 8, where
is added on a randomly selected kinematic gait cycle from the dataset.
For clarity, the overall pre-processing flow chart is shown in
Figure 9. This is composed of three stages resulting in an input gait dataset that will be used for the DL model.
In contrast to the method chosen by a recent study [
24] that transforms gait into images, the proposed method utilizes the 1D gait sequence as input for the DL model. As a consequence, the DL model is designed from scratch and the training procedure is treated carefully given that there is no pre-trained network that can be used as a baseline.
4.3. Deep Learning Design
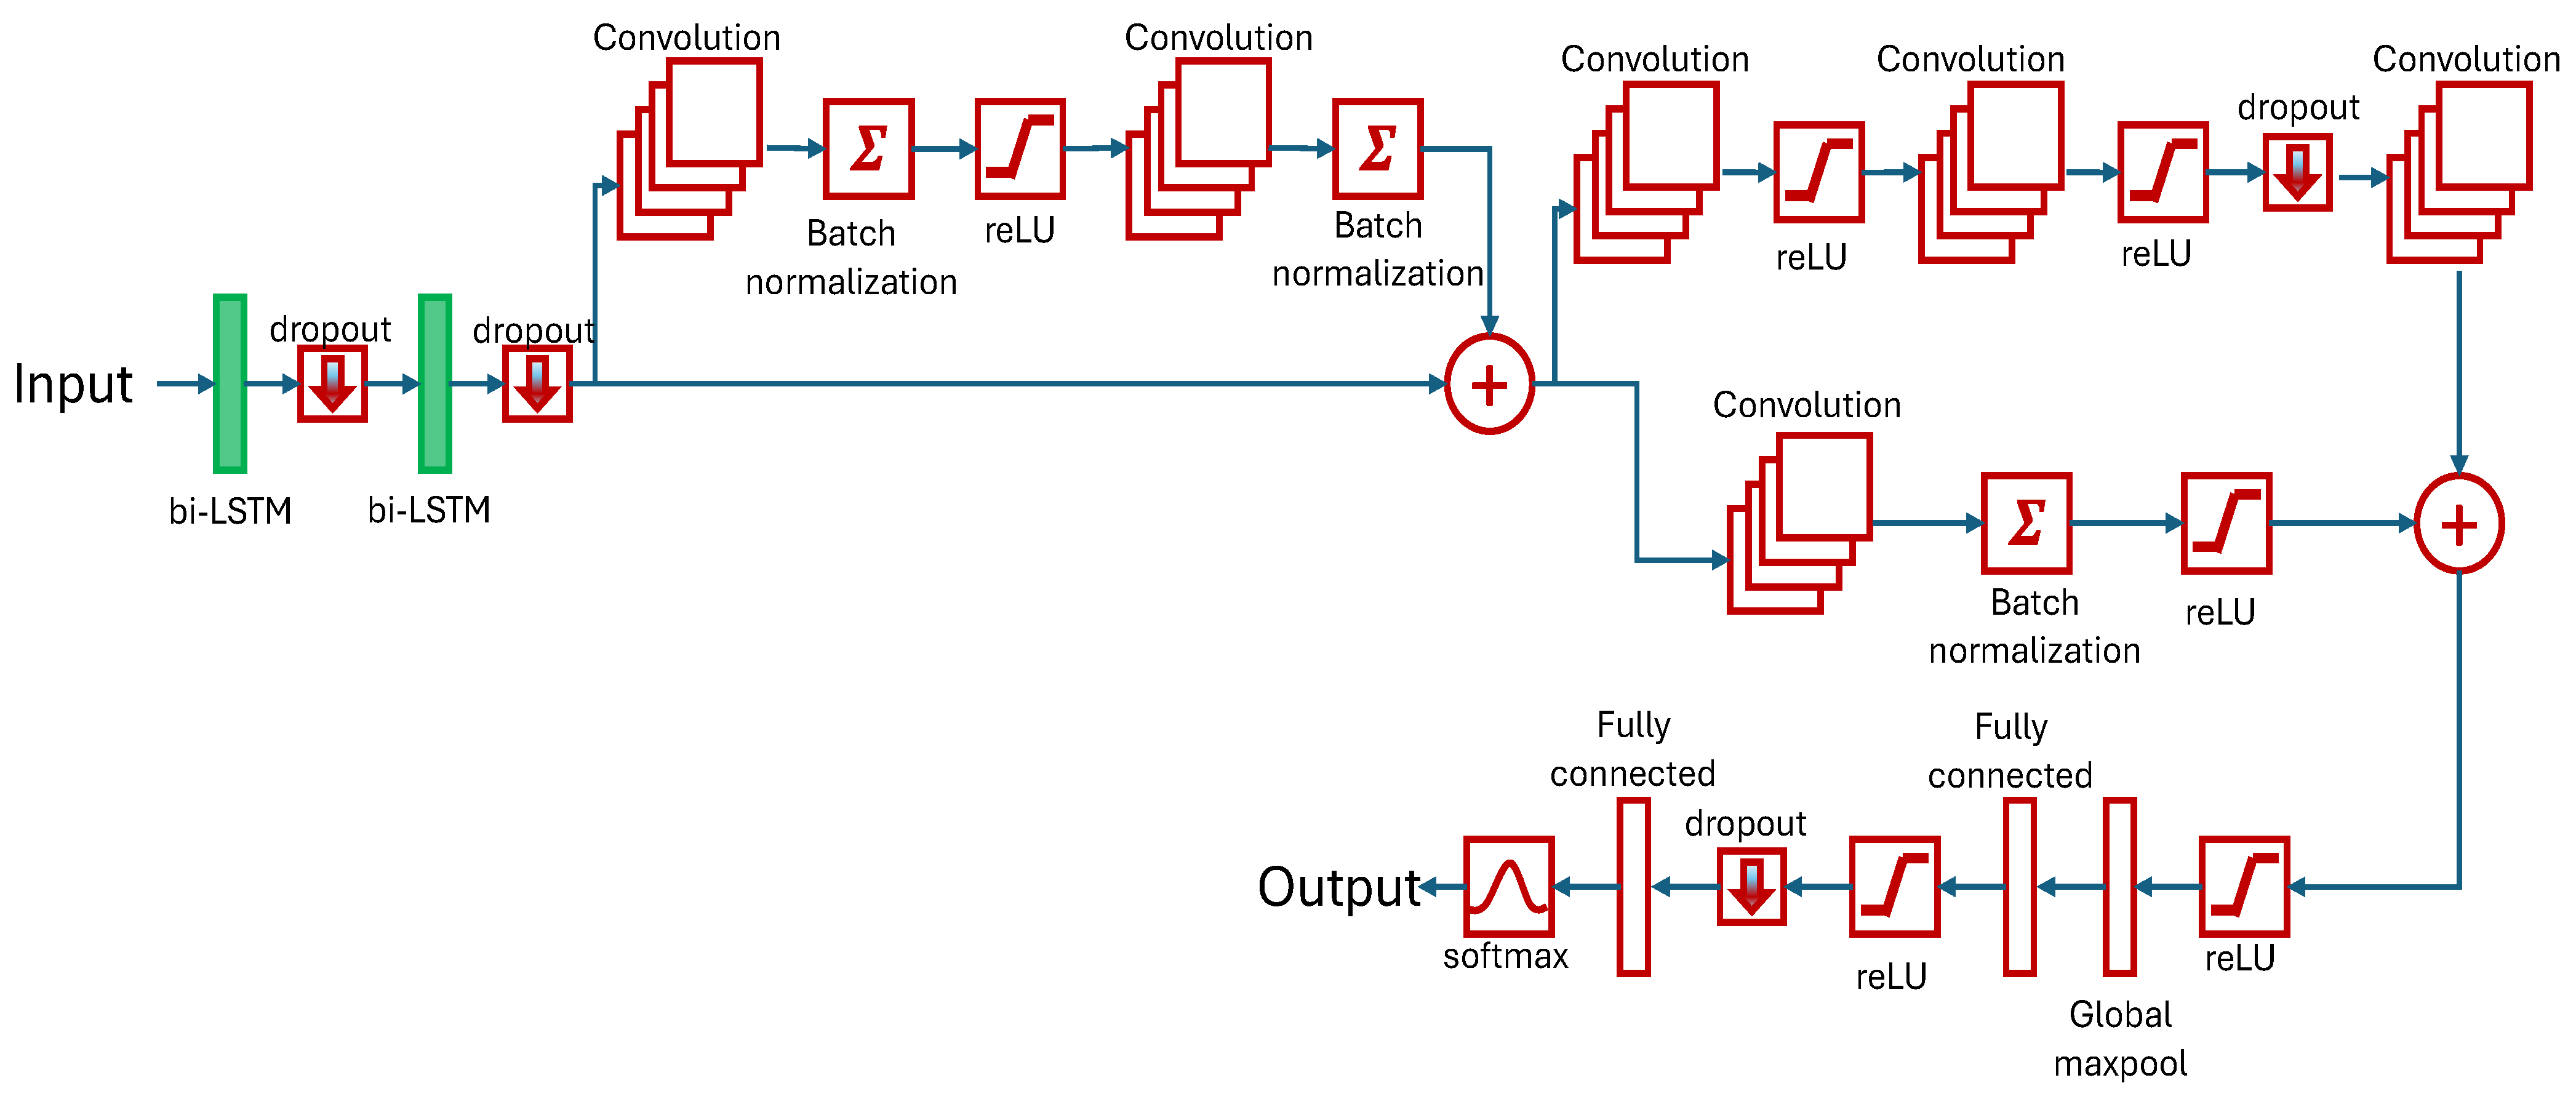
The focus of our research is the classification of kinematic gait parameters among healthy, HOA, and 6 months post-THA gaits using DL methods. A novel hybrid LSTM-CNN, stacking two bi-LSTM and six convolutional layers, is developed and tested.
The bi-LSTM network is a two-LSTM model with the first taking input in the forward direction, and the second is for the backward direction. Effectively, available information is increased for training and can improve the contextualization of the algorithm. By design, 62% and 12% memory windows are utilized to track sequence dependencies based on the period for stance phase and double limb support, respectively. This ensures that the learning is achieved within the selected length.
The first two convolution layers, in parallel with the skipped connection, have 38 and 12 filter sizes. This is based on the period of the swing phase and double limb support, respectively. Succeeding convolution layers have filter sizes of five to further improve feature extraction. The rest of the model parameters are summarized in
Table 3.
Hyperparameter selection is crucial in the training reliability of the design model. Given that the model is designed grounds-up, a relatively small initial learning rate is selected, and this is steadily increased. The mini-batch size is set to an arbitrarily small value of 20 for improved generalization and convergence. The maximum epoch is set as relatively large for extensive training. The list of relevant hyperparameters is shown in
Table 4.
The experimental research in this study was conducted on a DELL G15 5520 laptop with the following specifications:
Memory: 16 GB DDR3 RAM
GPU: NVIDIA GeForce RTX 3050 Ti
CPU: 12 Gen Intel Core i7-12700H, 2300 MHz,14 Cores, 20 Logical Processors
Software for the model, training, and evaluation was developed in Matlab® 2023b with statistics, machine learning, and Deep Learning Toolboxes.
The dataset was divided into training (70%), validation (20%), and test (10%) subsets. Artificial data were added into the training dataset to improve performance. The training subset is used for model training, and after each end of the epoch, the validation subset is used to examine training accuracy. The test subset is only used at the end of training to verify the performance of the final model.
4.4. Model Evaluation
The evaluation of a DL model is an important step in assessing its performance and accuracy. The proposed HLSTM-CNN model was tested using the metric scores from the resulting confusion matrix. The final test accuracy is calculated for each kinematic parameter, which is the overall correct classification of the subjects. Obtained information should be treated carefully as the classification of THA gaits can provide knowledge about the success of the surgical operation and post-surgery physical therapy rehabilitation. Thus, metric scores are computed for each class, and misclassification is analyzed.
Three other metric scores are frequently used in the bio-medical field, namely sensitivity, specificity, and
. Sensitivity determines the correct prediction of a class, while specificity determines the ability to correctly identify negative results.
is, then, the measure to balance the results of the different classes. These metric scores are given by the following:
where
and
refer to right classification, and
and
to the misclassification of subjects.
5. Results and Discussion
5.1. Performance Metric Results on Selected Kinematic Parameters for Healthy and HOA Gaits
This subsection presents experimental results. The proposed HLSTM-CNN model is evaluated on the selected kinematic parameters’ test dataset, specifically, to distinguish between healthy and HOA gaits, as described in
Table 5. The test dataset is randomly chosen and was never used during the training procedure. The sagittal angles of the knee 14 and the hip provide the best performance results with G-Mean scores of 97.6% and 97.8%, respectively. Apart from its concurrence with other published reports [
23,
24] as the most discriminating kinematic parameters, the outstanding performance results highlight DL superiority over traditional ML algorithms. Notably, healthy gaits of these kinematic parameters are not misclassified as HOA gaits, which is reflected in its sensitivity result of 100%. The next two best performing kinematic parameters are the font angles of the knee and FPA with G-Mean scores of 96.5% and 94.9%, respectively. This result well-aligned with those published in the literature.
On the other hand, the worst performing kinematic parameters are the sagittal angles of ankle and FPA and the transverse angle of the pelvis with G-Mean scores below 90%. Particularly, the sagittal angle of the FPA is the only kinematic parameter that registers below 80% accuracy and G-Mean score. Put in context, its accuracy of 75% is already comparable with traditional ML algorithms and agrees with prior studies as the least discriminating kinematic parameter.
5.2. Comparative Analysis
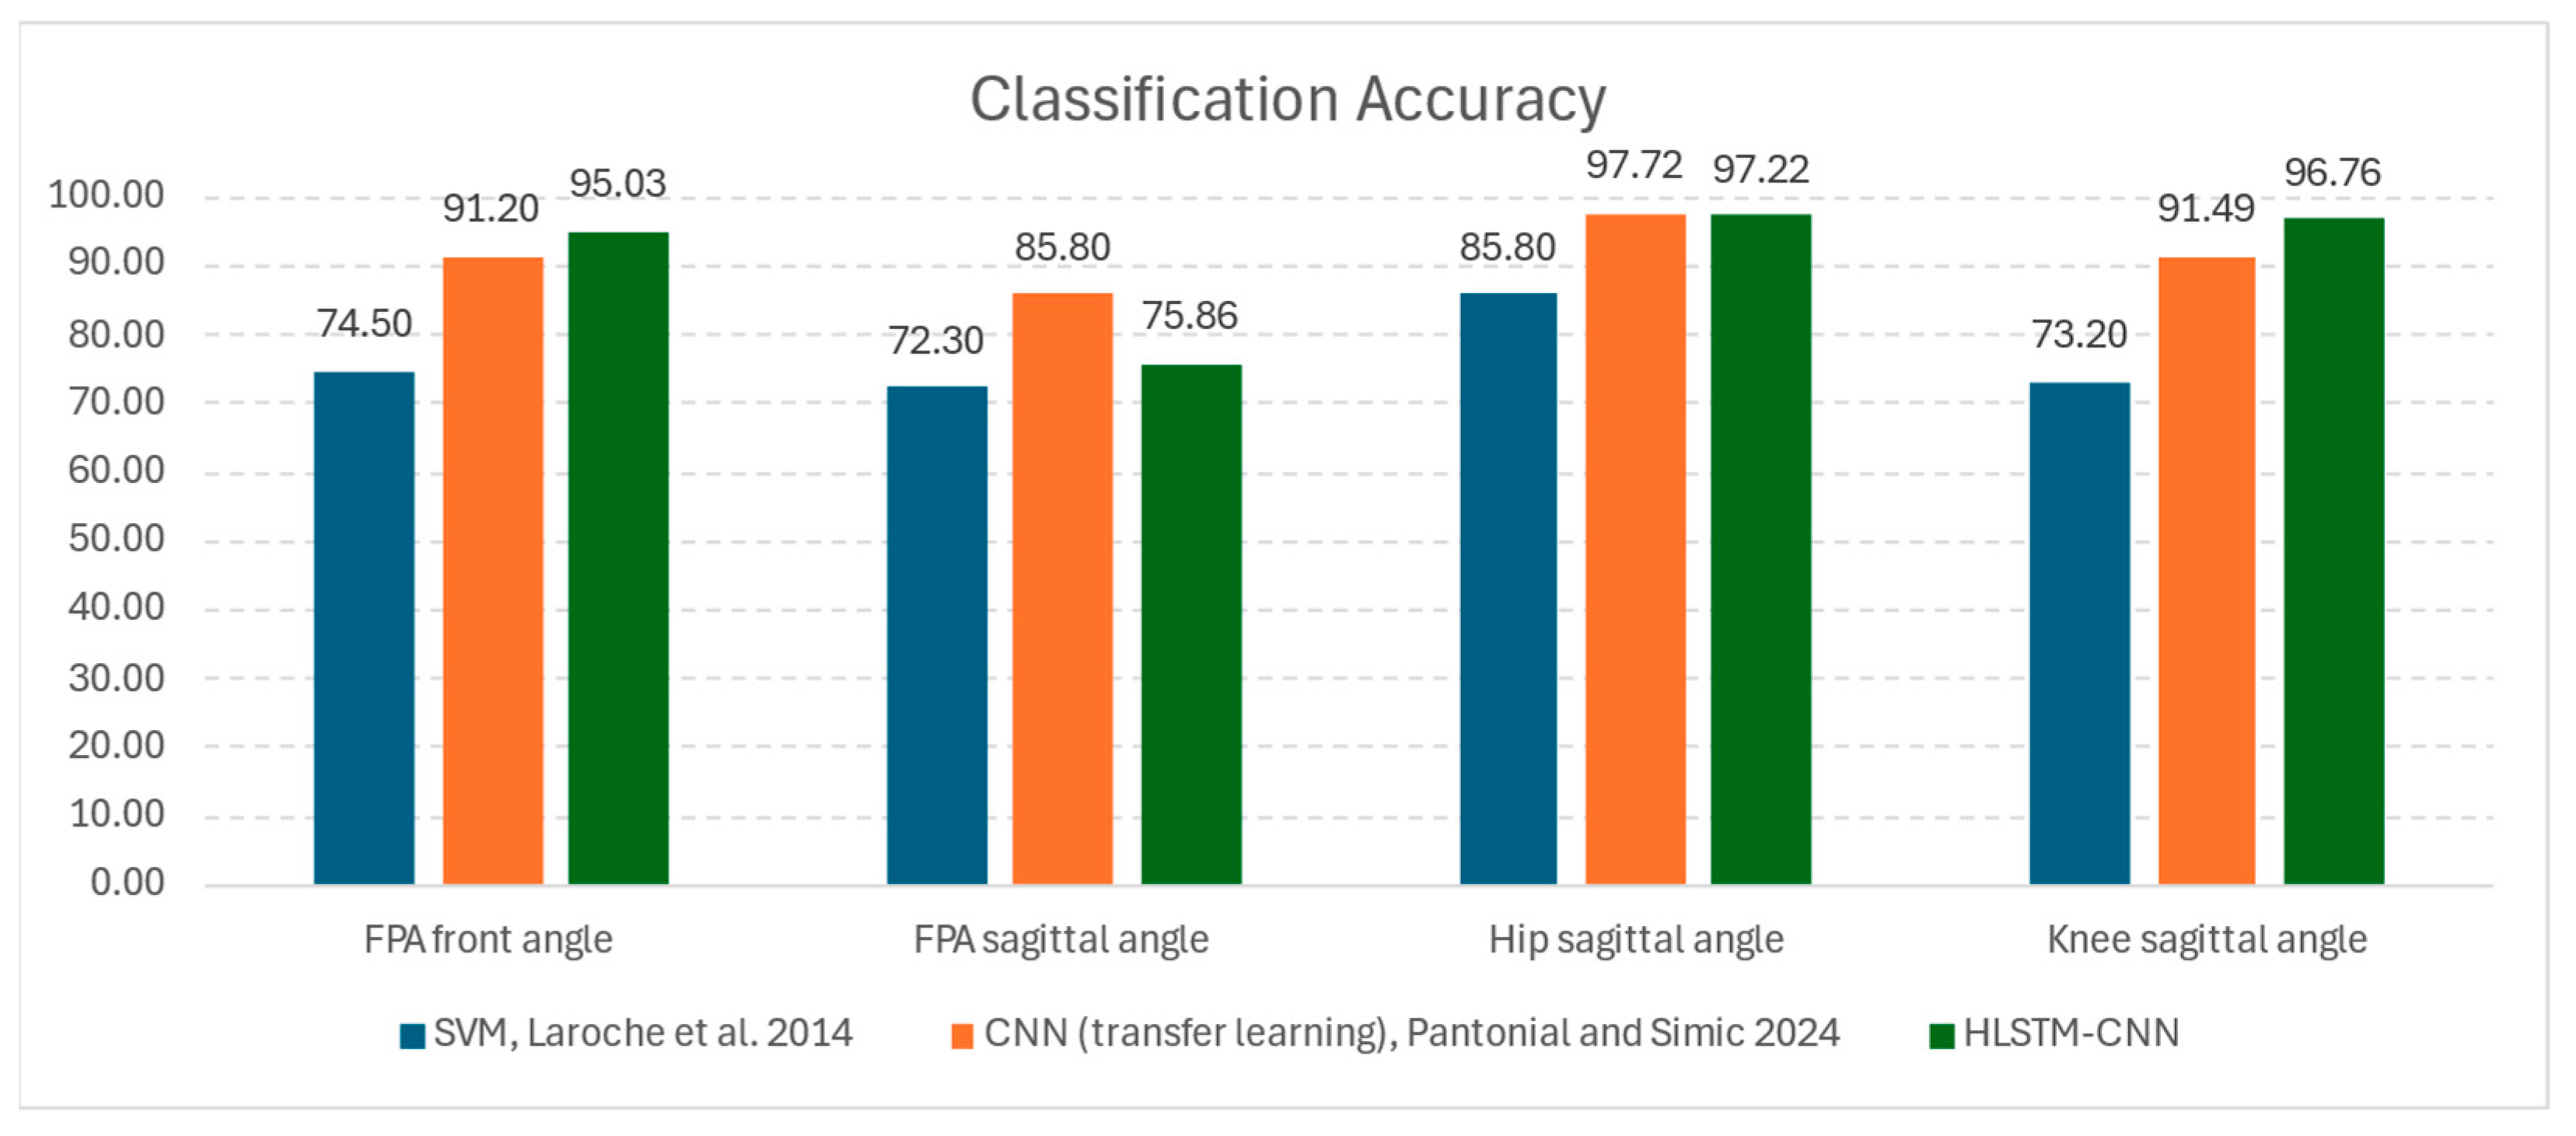
Regarding research on HOA classification through ML techniques, two other related studies’ reports were compared to the results of the proposed architecture: (1) SVM classifier by Laroche et al. [
23] and (2) image-based CNN classifier via transfer learning method by Pantonial et al. [
24]. While both investigations acquired datasets from the same laboratory, the former utilized a smaller and unpublished dataset, while the latter used the same published dataset.
Figure 10 shows the results of the common kinematic parameters from these studies, and it is notable that the proposed HLSTM-CNN is in agreement that the hip sagittal angle is the most discriminating parameter for HOA classification. Both the image-based CNN and the HLSTM-CNN models recorded an outstanding 97% accuracy on this kinematic parameter, while the SVM model only recorded 85% accuracy. The results of the SVM model for the other kinematic parameters are decent for ML standards, which are slightly below 75%.
With the proposed architecture, for knee sagittal and FPA front angles, there is a considerable uptick in accuracy with improvements of 3.8% and 5.2%, respectively, as compared to the image-based CNN model. Even with the use of raw gaits as inputs to a model, there is no reduction in the performance, and has even improved results. Thus, computationally expensive scalogram image transformation is avoided without noticeable disadvantages.
The ranking of importance for the kinematic parameters is similar as with the previous studies, with the sagittal angle of the FPA as the least discriminatory in the gait classification problem. The accuracy of HLSTM-CNN stands at 75.8%, which is a relatively low result, but the sagittal angle of the FPA has not been considered in the literature for HOA classification.
Additionally, DL methods, both image-based CNN and HLSTM-CNN, are exceptionally superior to the SVM, giving results with at least a 12% accuracy improvement on the hip and knee sagittal angles. Besides this advantage, the manual handcrafting of data for feature extraction is eliminated in the process; thus, automation for classification is a possibility with less intervention from users.
On the other hand, Teufl et al. [
25] differentiated gaits between healthy patients and patients 2 weeks after THA operation utilizing IMU sensors. It is an important distinction from this study’s dataset of using gaits 6 months after THA. It is shown that the resulting kinematic accuracy is 97%. Thus, there is a discriminating feature between healthy and THA subjects. Misclassification could provide information into the effects of the surgery itself that can lead to better rehabilitation.
5.3. Results on Best Performing Kinematic Parameters on the Multi-Classification Problem
This subsection presents the results, based on a confusion matrix, when the proposed HLSTM-CNN model is evaluated on the top four performing kinematic parameters based on their classification G-Mean score:
Hip Sagittal Angle
Knee Sagittal Angle
Knee Front Angle
FPA Front Angle
For clarity, the diagonal and off-diagonal blocks of a confusion matrix indicate the correct and incorrect predictions of the true values, respectively.
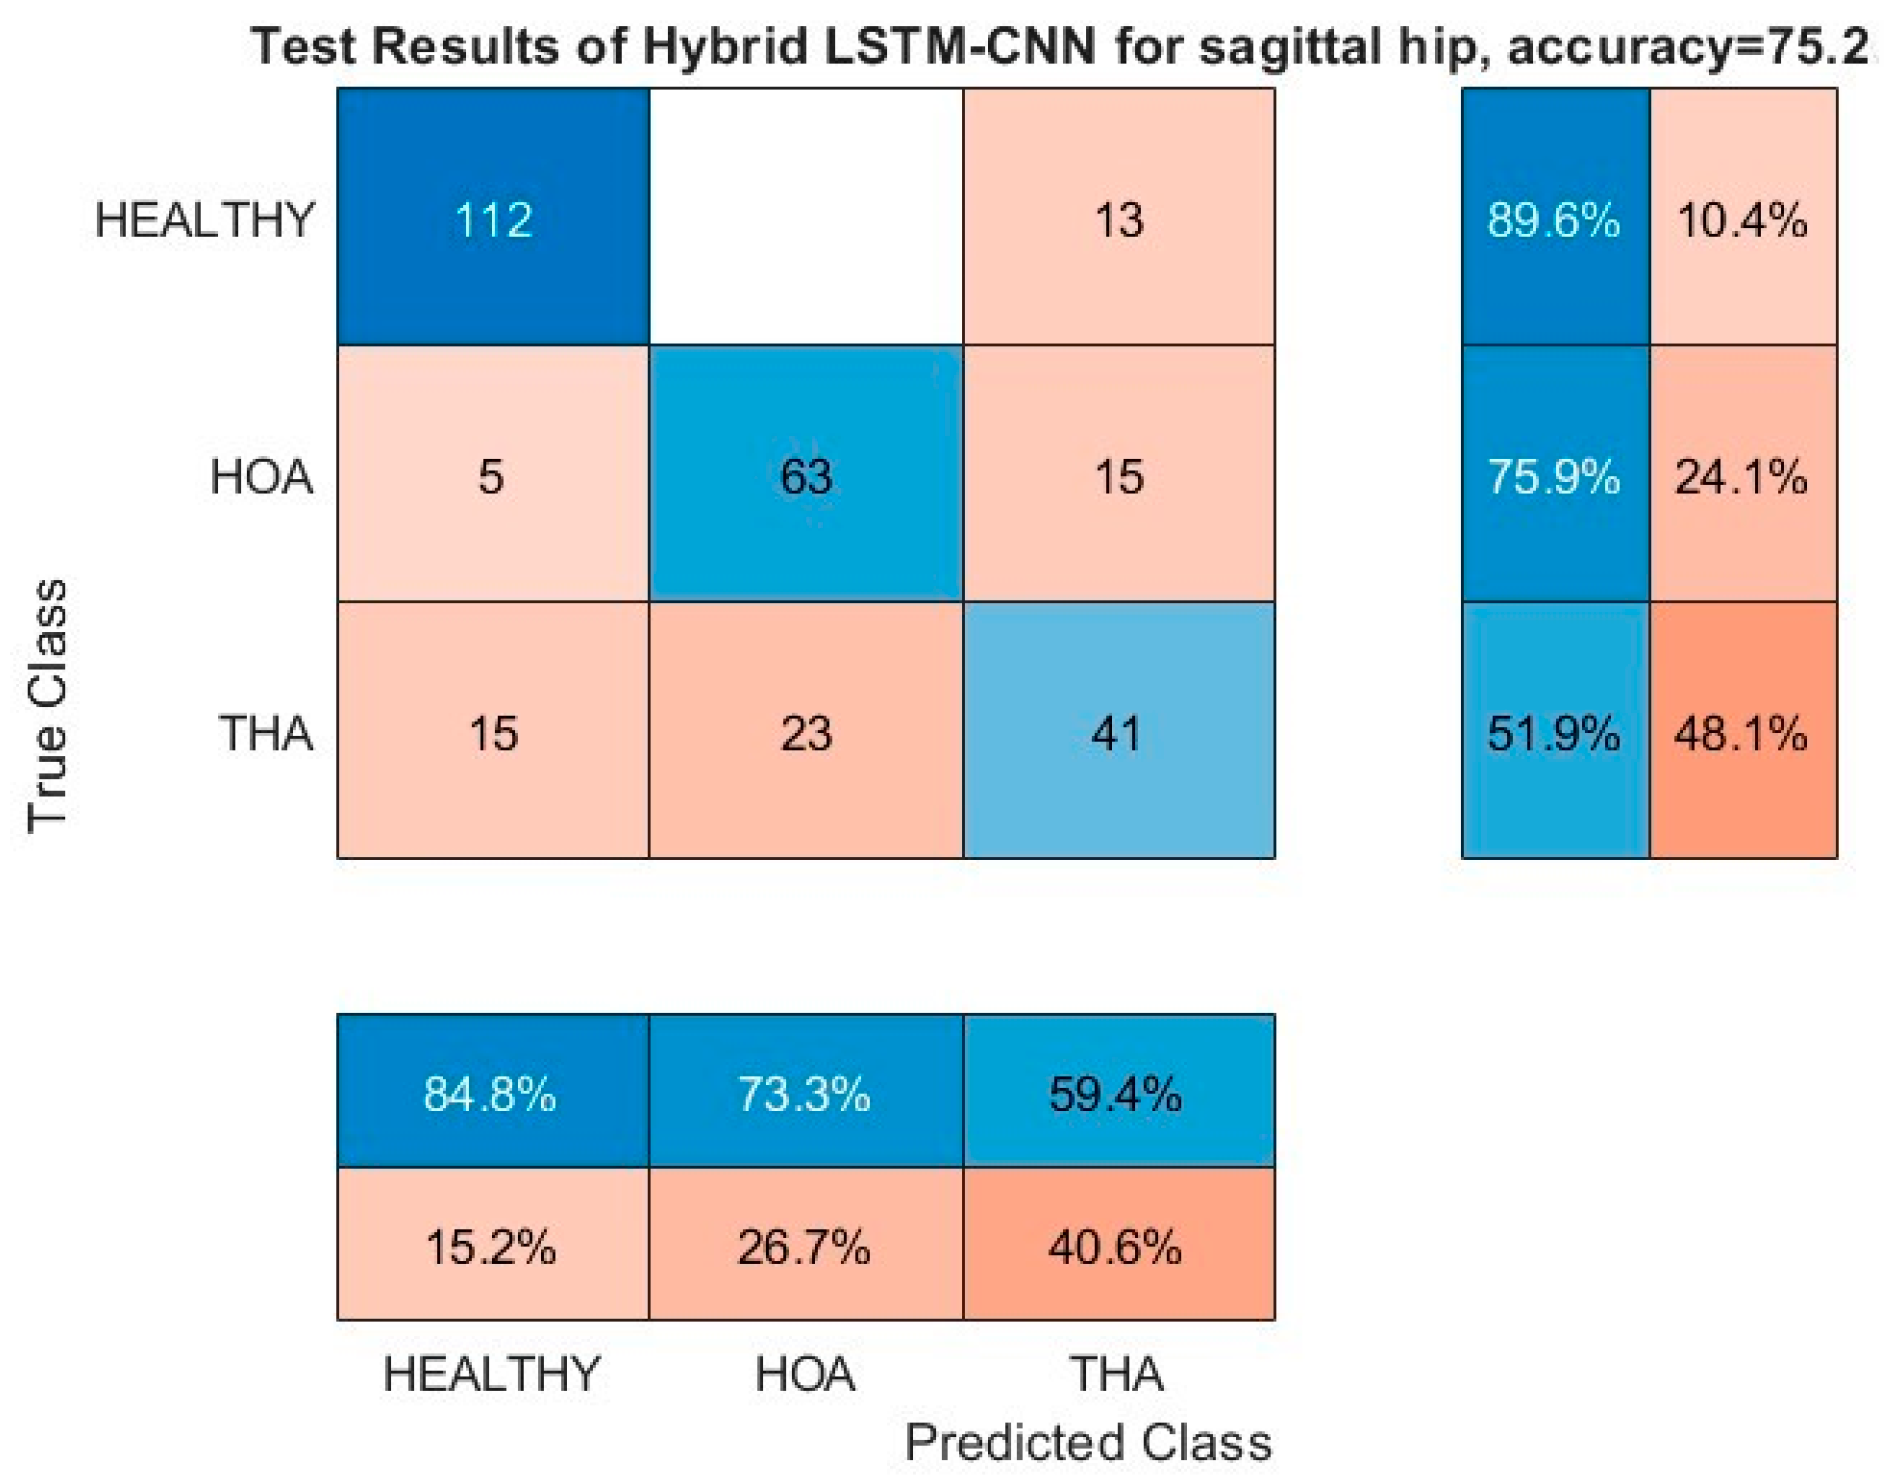
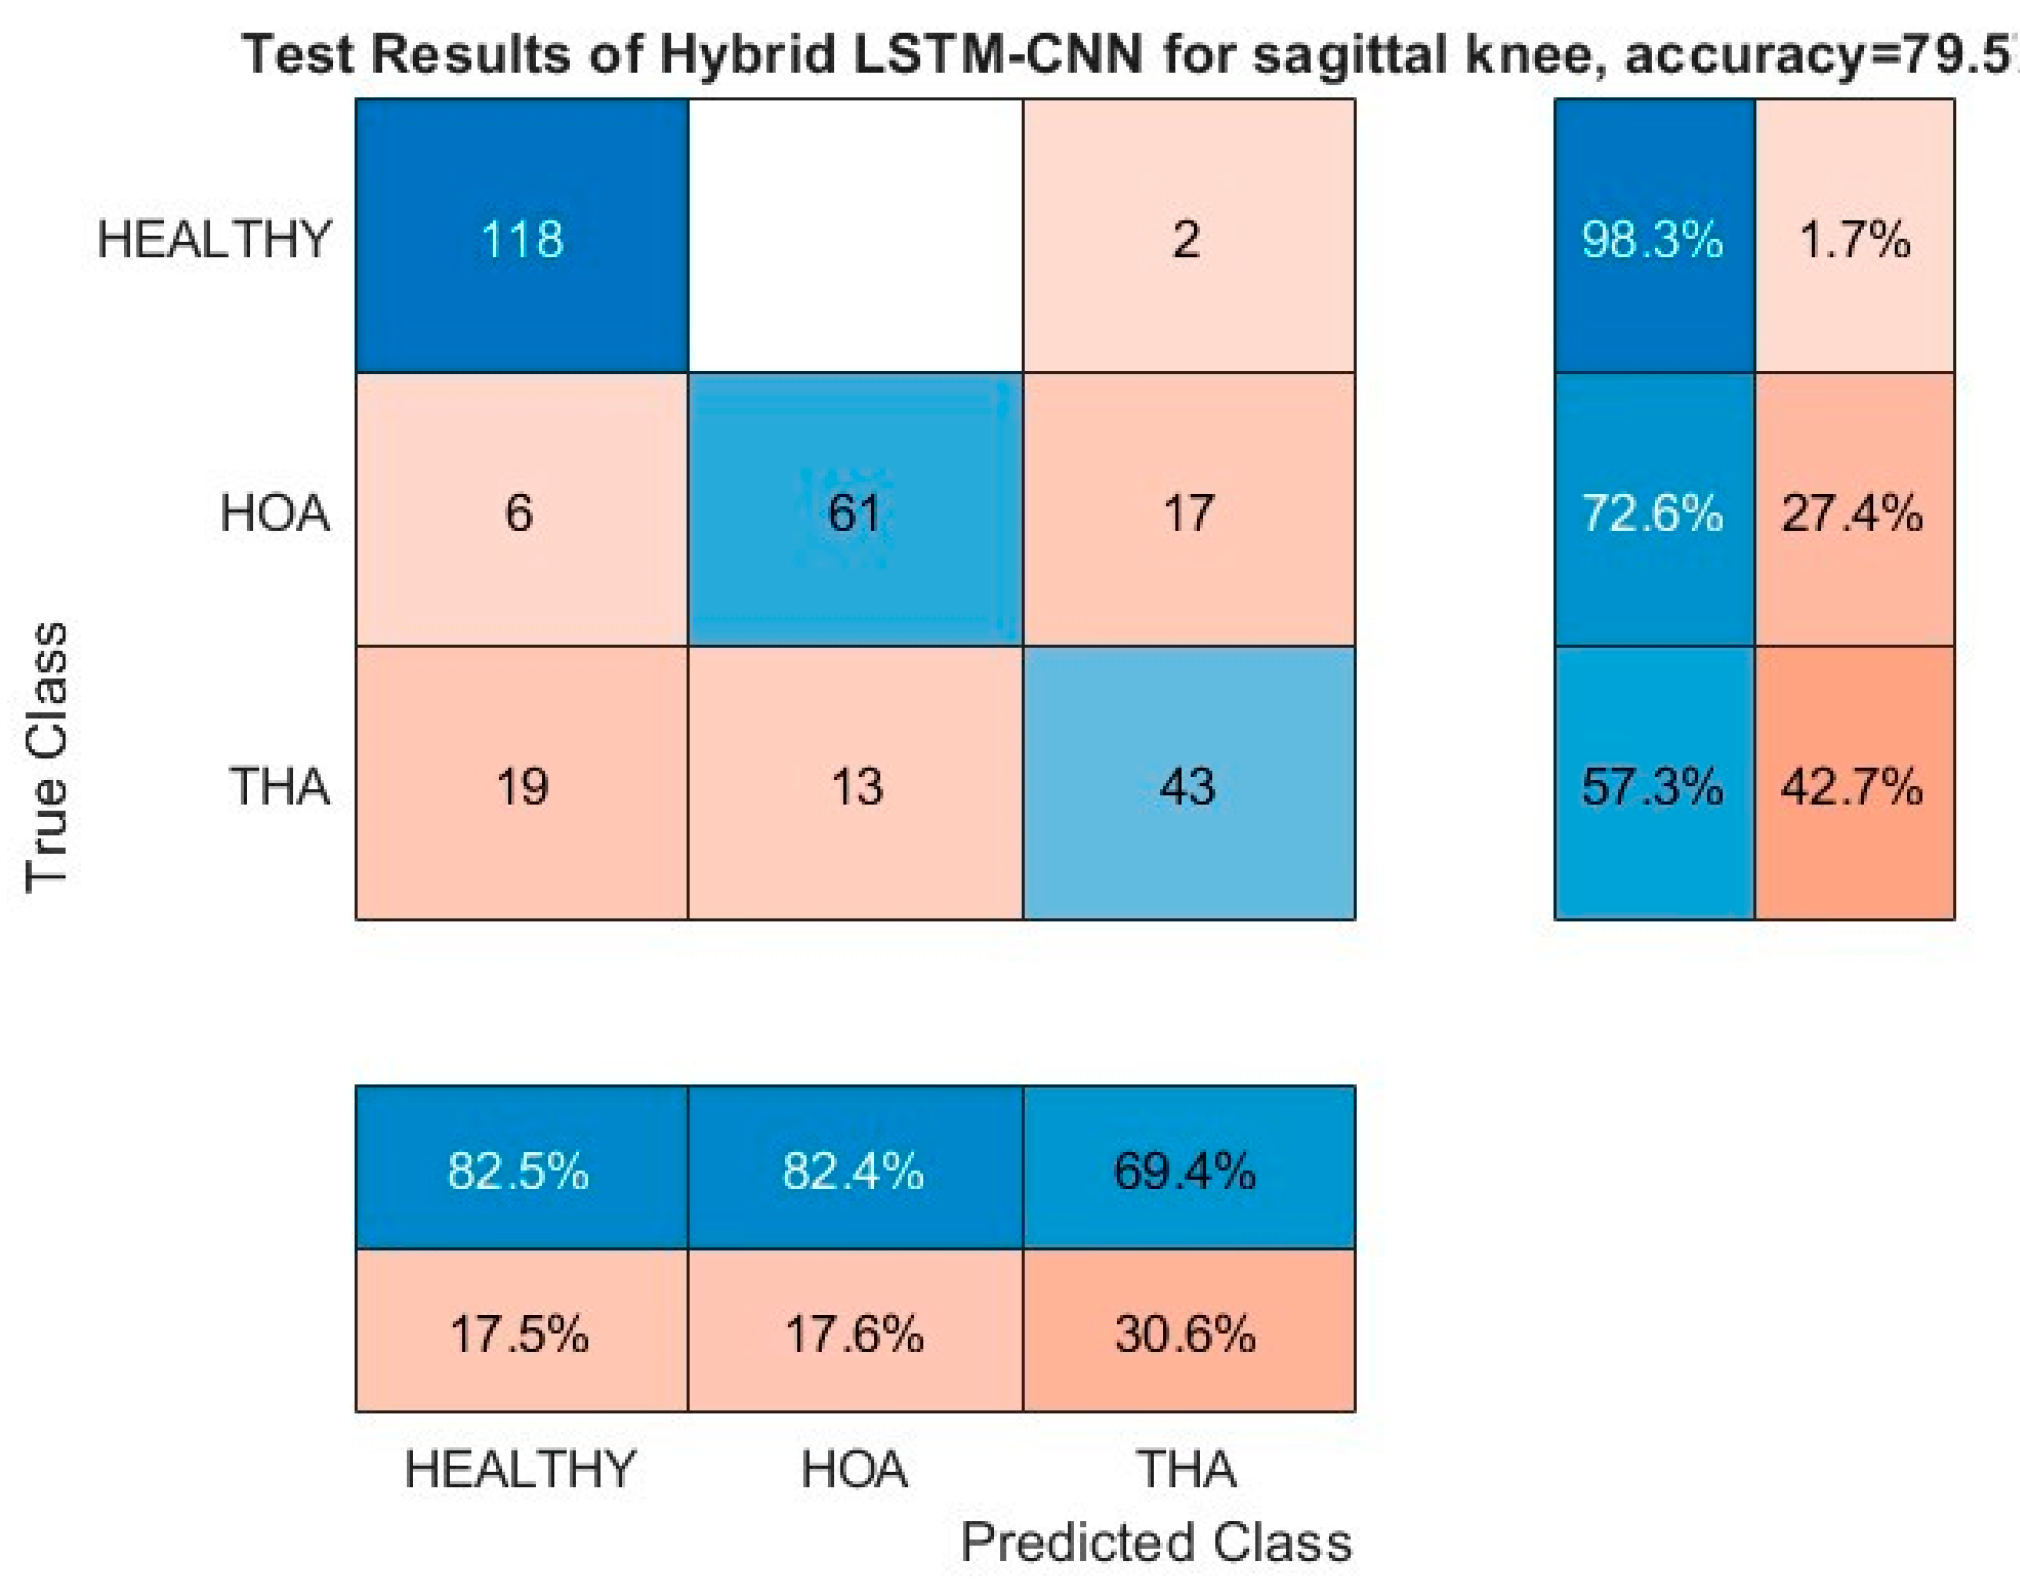
Figure 11 and
Figure 12 show the resulting confusion matrices of the sagittal angles of hip and knee, respectively. Both of these kinematic parameters registered a more than 97% G-Mean score on the HOA classification problem with no misclassification of healthy gaits as HOA, and the opposite was kept at a low value as well. Moreover, the bulk of the misclassification is on the THA gait being misclassified as either healthy or HOA (third row). In addition, both healthy and HOA gaits are misclassified as THA gaits with high incidence as well. Based on these results, it is evident that there is a clear distinction between the features of healthy and HOA gaits for these kinematic parameters. Common features may be present on the THA gait that are seen on either healthy or HOA gaits.
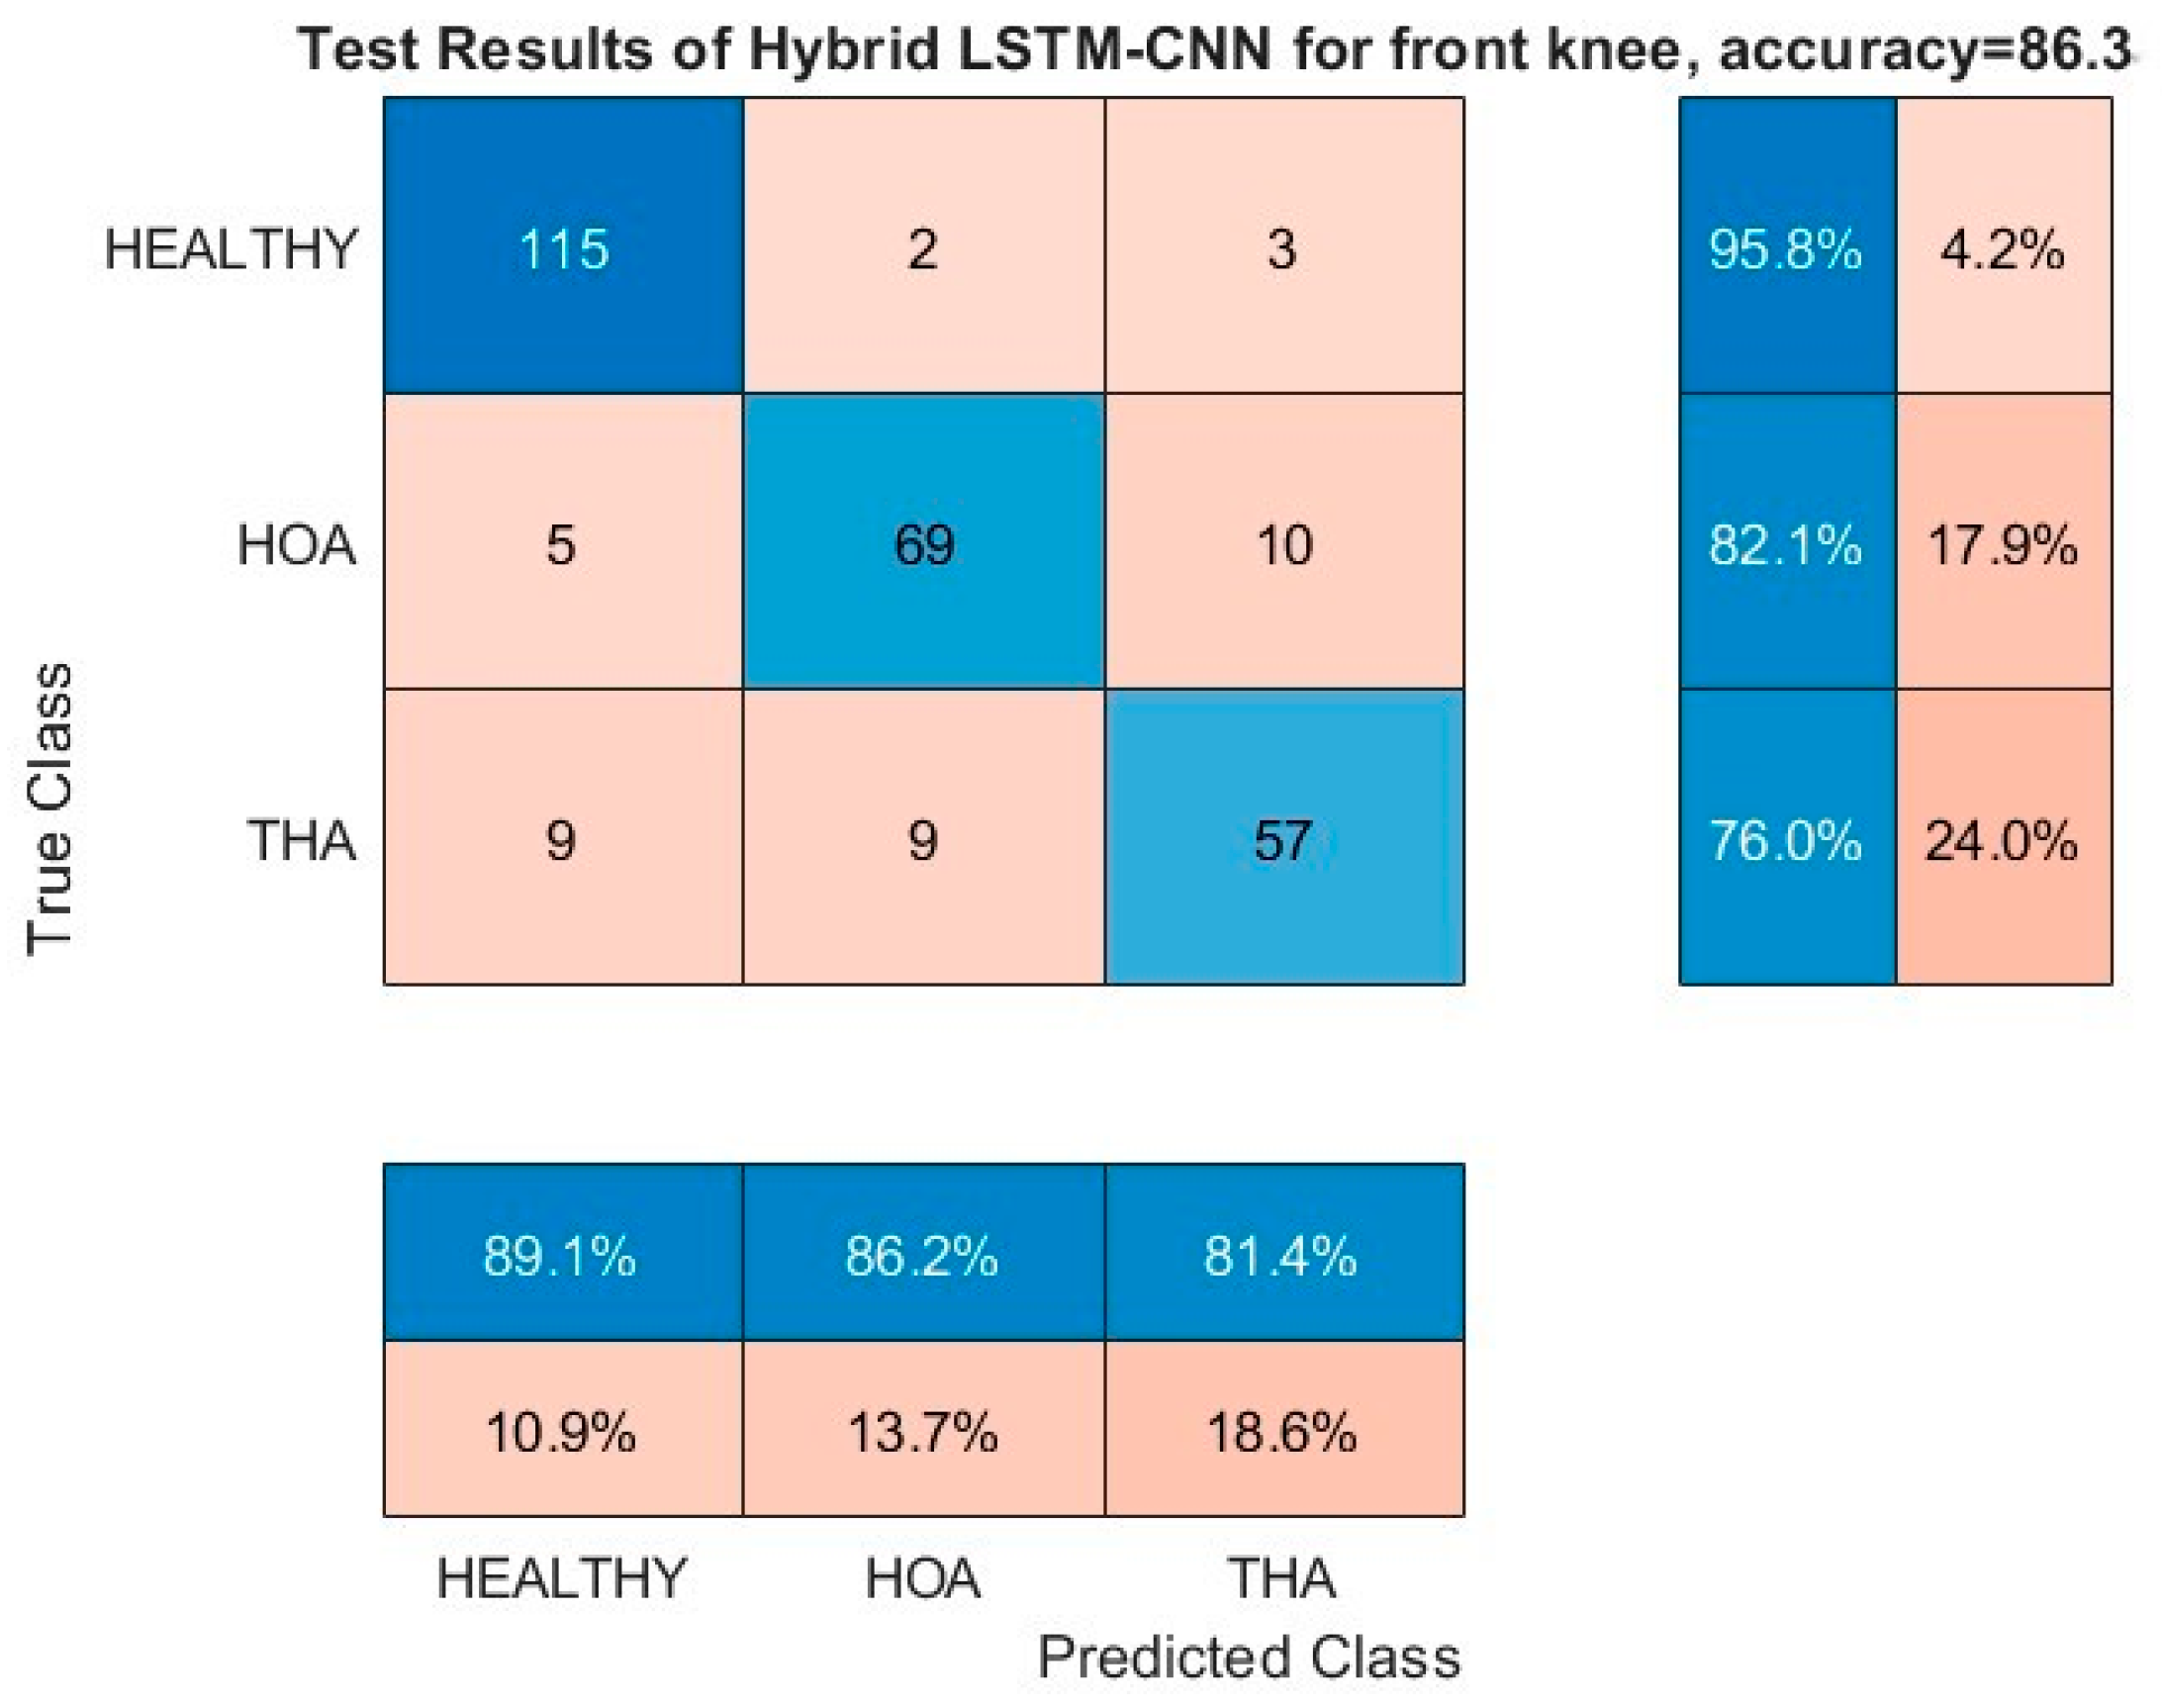
Similar observations can be realized on the confusion matrices of the front angles of FPA and knee as shown in
Figure 13 and
Figure 14, respectively. Misclassification between healthy and HOA gaits is kept to minimum values, and the bulk of the misclassification is on THA gait prediction (third row and column). In particular, the front angle of the FPA has a significant misclassification of healthy and HOA gaits as THA, thus pulling its performance down.
Further investigation is needed into the THA misclassifications. It could still provide information on patient satisfaction with the operation. Explicitly, if a THA kinematic parameter is misclassified as healthy, this could be indicative of functional improvements and gait returning to normal, while, if it is predicted as HOA, then gait impairments are still present. With more discriminating kinematic parameters, as predicted by the DL model, agreeing on the results, higher confidence can be attributed to the model’s results. This premise is extensively explored in the next section. Finally, regardless of classification outcomes, if a patient reports pain relief, improved mobility, and functionality, the THA could still be considered successful. In the future, we will include patient satisfaction as another THA verification parameter. Surgeons already use longitudinal surveys to track patient satisfaction and THA success. Time periods usually start just after the surgery, then three months and six months, and they continue for years. Our method could be one additional monitoring tool that could be used by surgeons and clinicians to track and improve THA success.
5.4. Analysis of Misclassification of THA Gaits
Building upon the results of the previous subsection, the top two most discriminating kinematic parameters, namely the sagittal angles of hip and knee, are further investigated, particularly for subjects with THA gaits. The subject’s gait prediction is classified between the three classes as shown in
Table 6. For clarity, the subjects have identification numbers, which are tabulated in the table. The subject’s identification number, which is not common in both test datasets of the hip and knee sagittal angles, is removed for simplicity. Moreover, there are multiple gait data that are available for each subject, but only a single piece of data is retained that scores above 50% in the softmax layer. Remarkably, there is no cross-prediction between healthy and HOA for the THA gaits. Explicitly, if a gait of the hip sagittal angle is misclassified as healthy, it can either be healthy or THA on the knee sagittal angle prediction, and vice versa. This is also true for HOA gait misclassification.
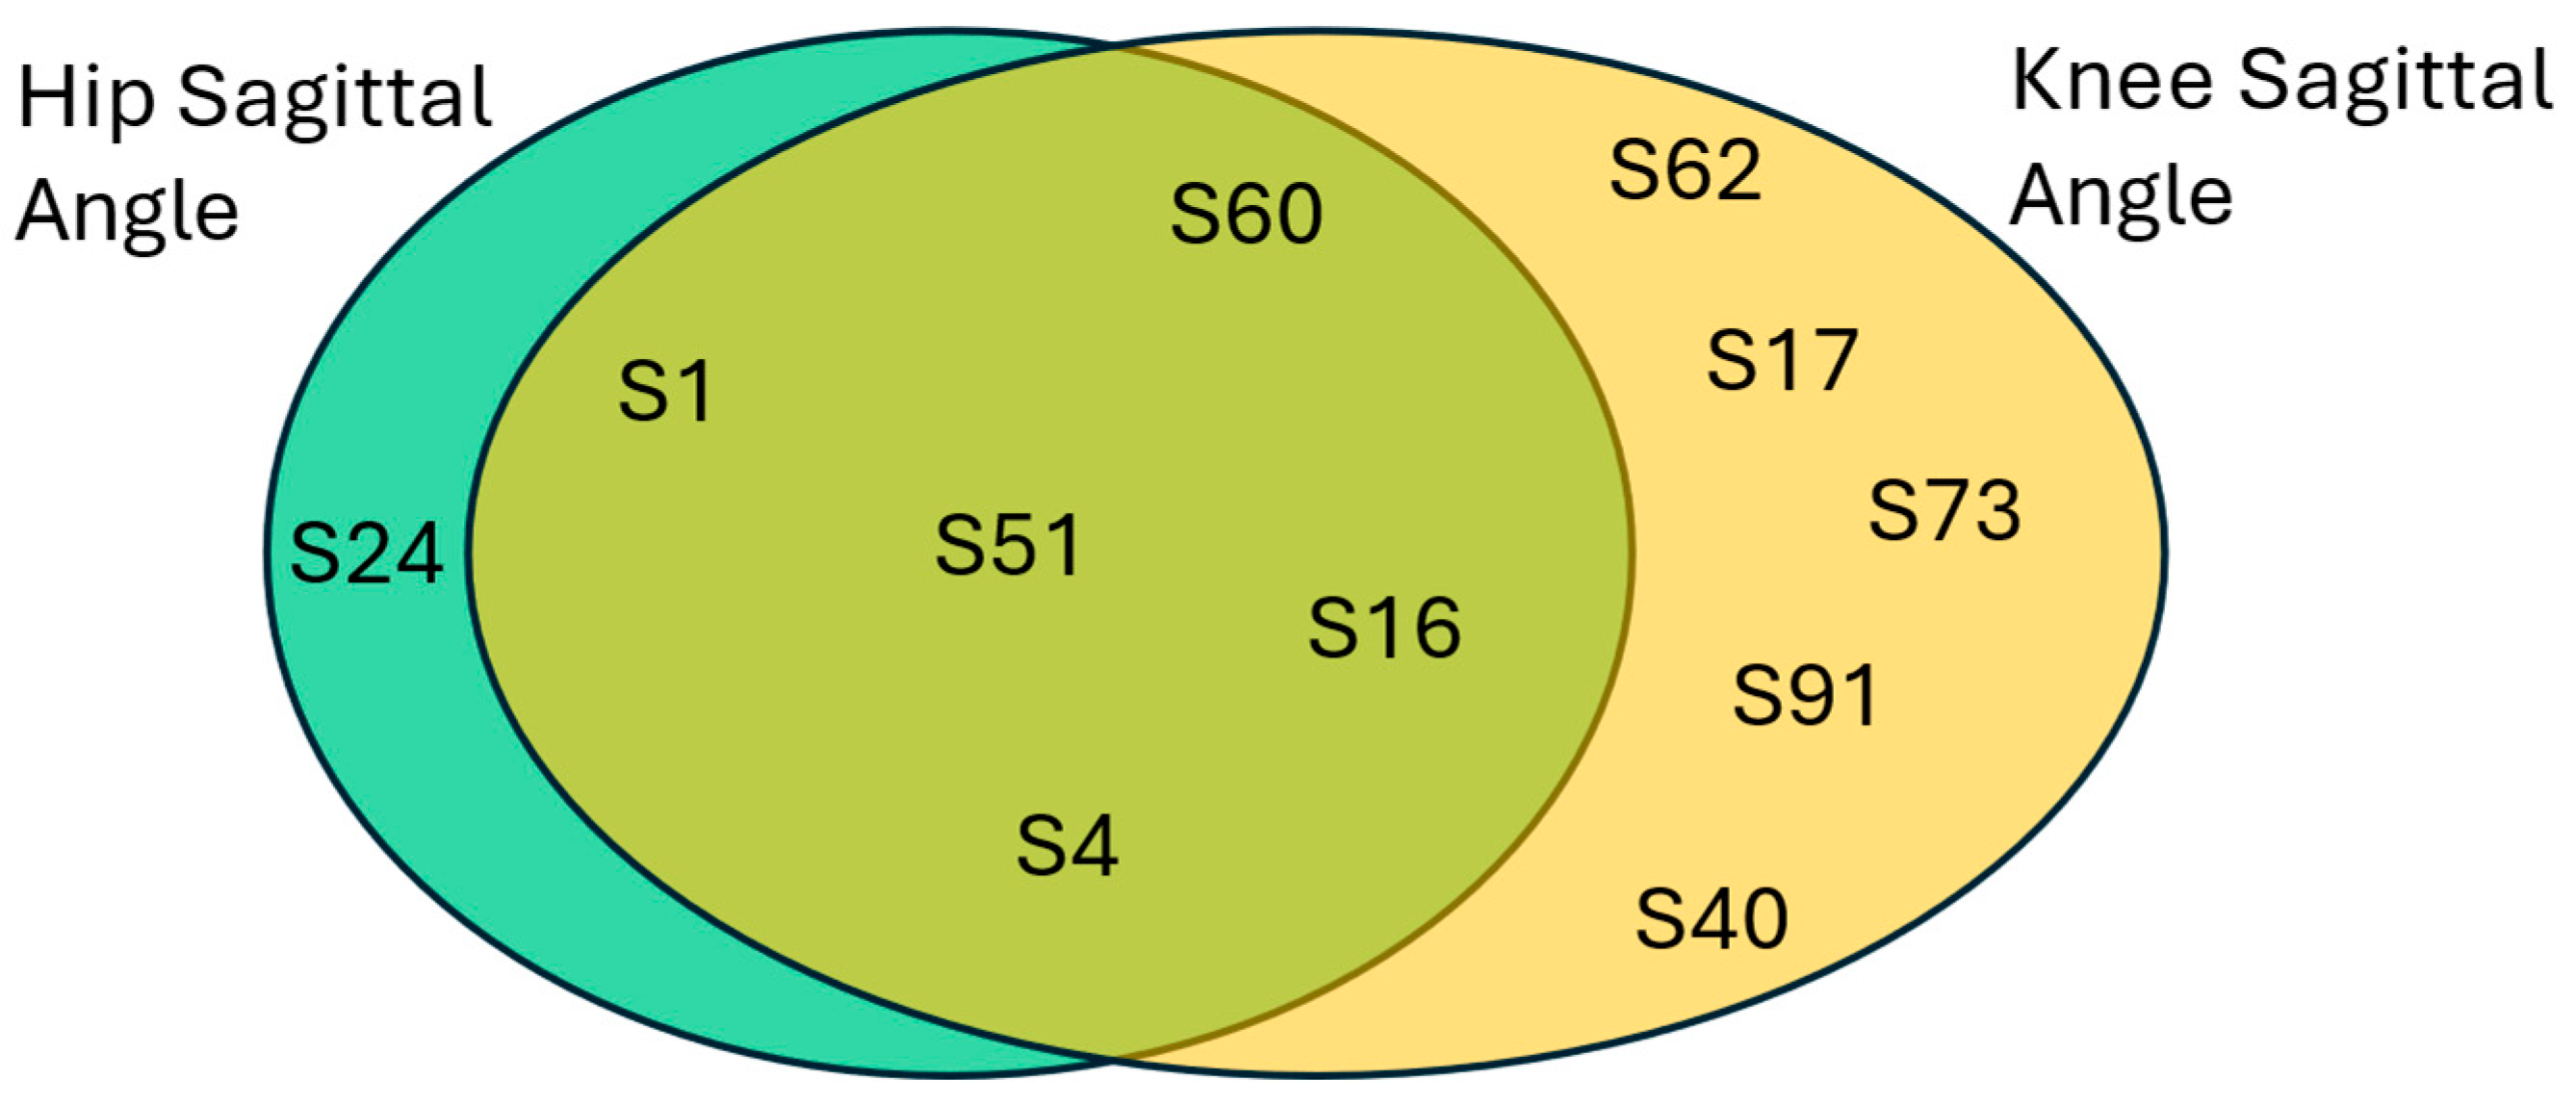
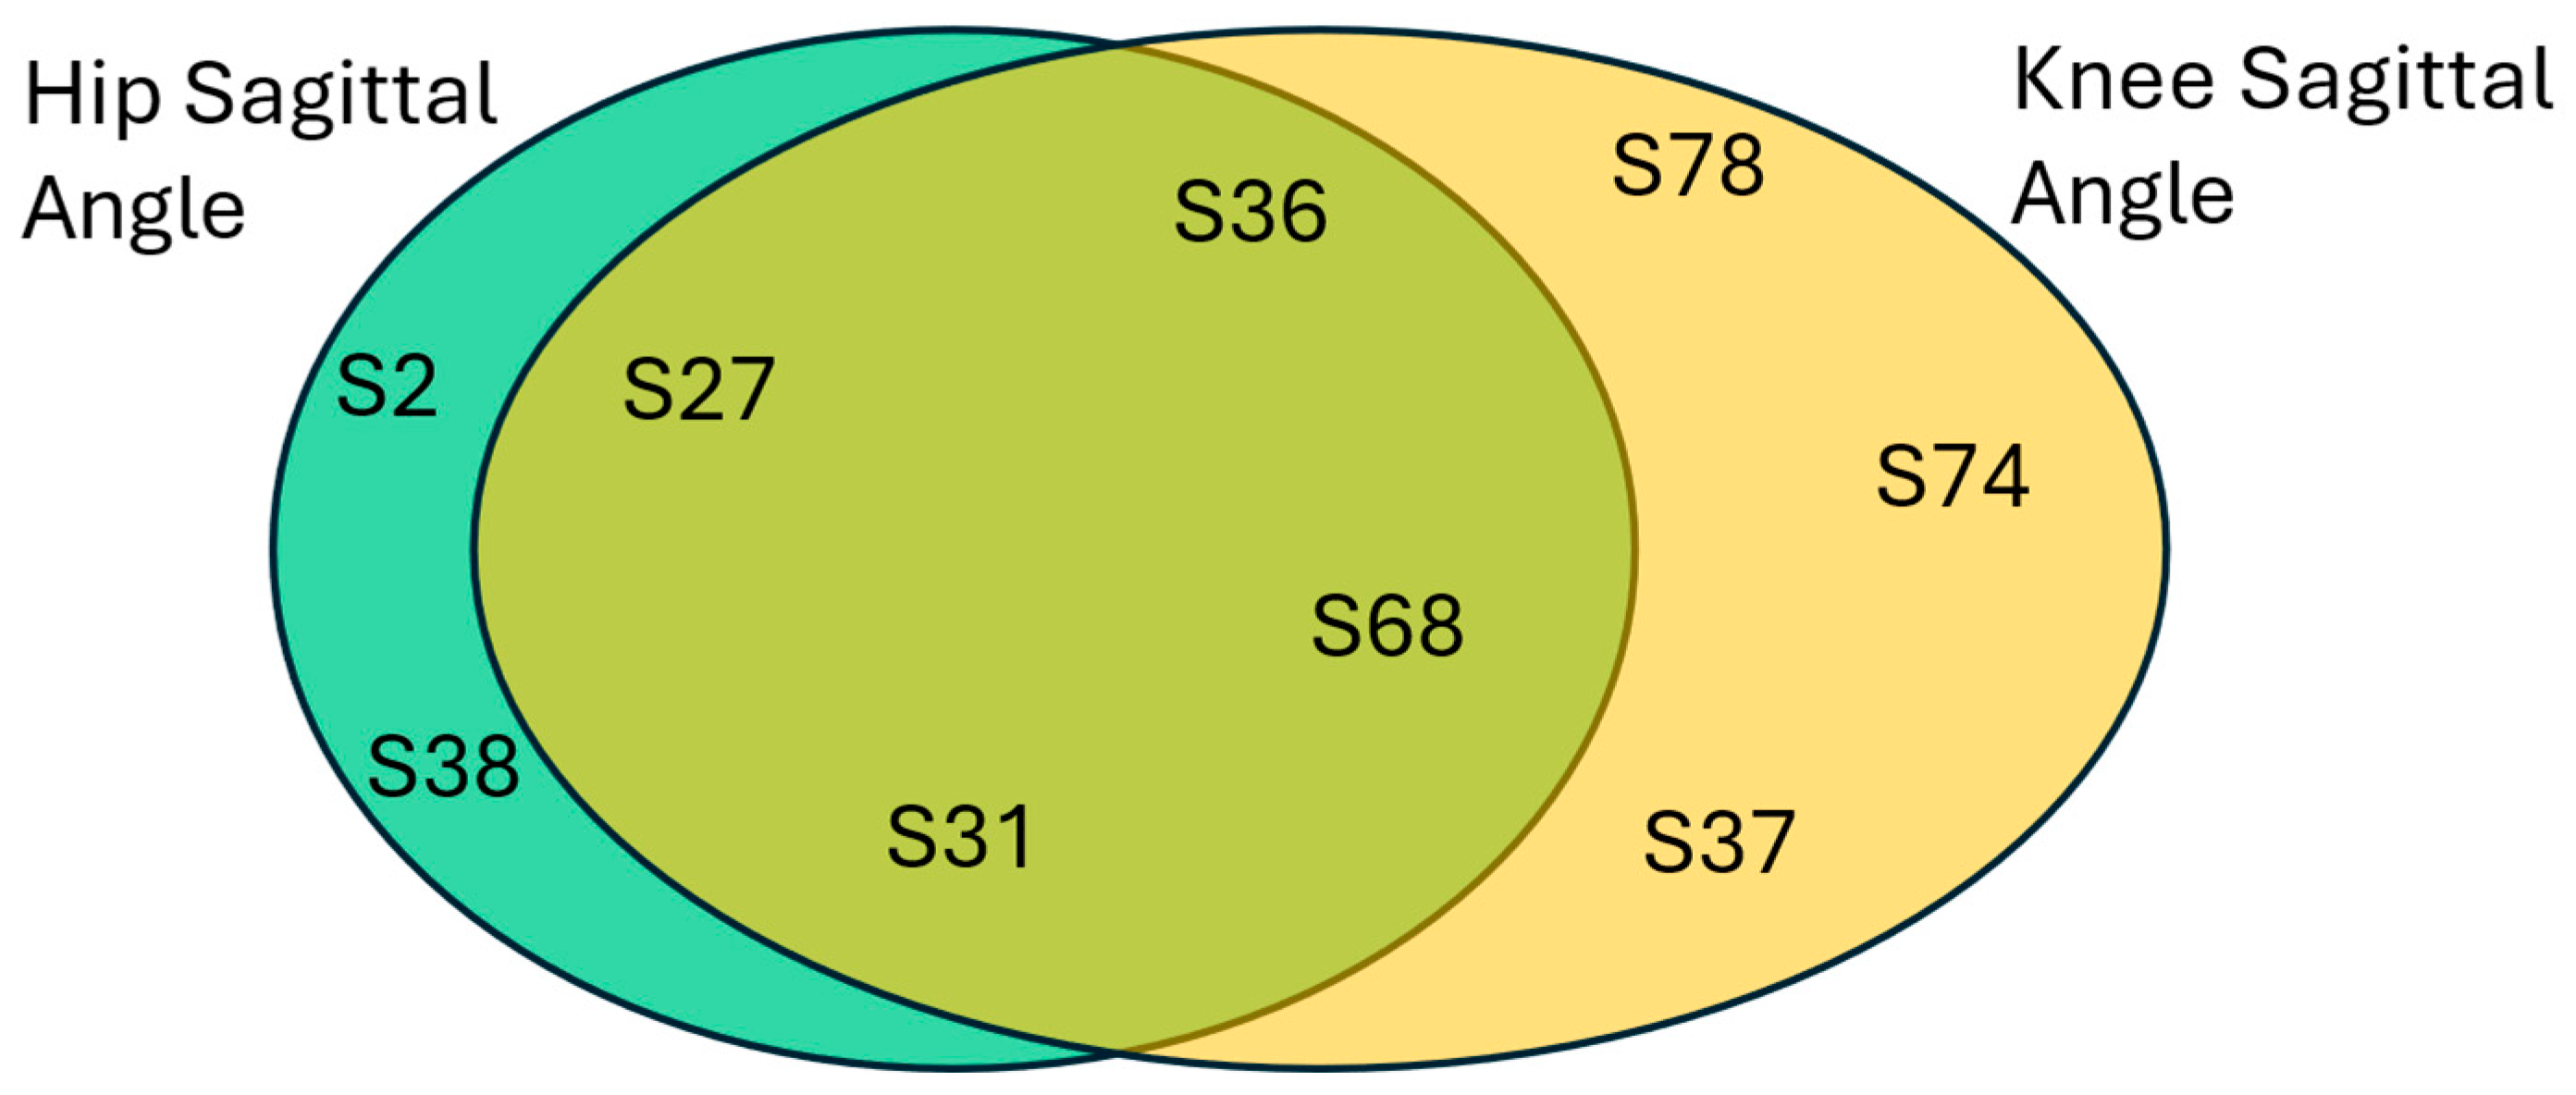
To better understand the relationship between the misclassification of the knee and hip sagittal angles, a close inspection of the conditional probabilities is crucial. Both healthy and HOA misclassifications are utilized, and Venn diagrams of the subjects are plotted to show the relationship between the two best performing kinematic parameters.
First, healthy classifications are analyzed, and the results are shown in
Figure 15. As a nomenclature,
in the figure signifies the subject’s identification number in the dataset. Interestingly, there are common subjects that were predicted as healthy between the two best performing kinematic parameters. This would increase our confidence in the success of the THA operations in these subjects. Evidently, the hip sagittal angle provides a reliable prediction on the healthy class with
, while the knee sagittal angle resulted in a conditional probability of
. Simply, when a patient’s hip sagittal angle is predicted as healthy, there is a better chance that it has returned to a healthy state.
Next, HOA predictions are analyzed, and the results are plotted in
Figure 16. Similar to healthy predictions, there is also a significant number of common subjects that are predicted as HOA. When two best performing kinematic parameters are giving the same HOA results, this should be analyzed by medical diagnostic experts. This could mean a failure in the THA operation. Also, the hip sagittal angle provides a slightly better prediction for the HOA class with
, while the knee sagittal angle resulted in a conditional probability of
.
6. Conclusions
The determination of the best discriminating kinematic parameters for HOA and THA classification is a crucial step in the accurate diagnosis of the disease. DL is a promising methodology used in solving different classification problems, and it has been proved to be a reliable approach. In this research, a hybrid of LSTM and CNN is proposed to classify gaits as healthy, gaits with HOA, and gaits 6 months after THA. The LSTM model exploits temporal dependencies of the gait sequential data, while the CNN model is employed to detect local gait features. Specifically, two bi-directional LSTMs and six CNNs are stacked to form the network with a skipping structure to improve fitting. To evaluate the design and benchmarked with the literature, the discrimination between healthy and HOA gaits is tested. It is shown that the sagittal angles of the hip and knee are the top two most discriminating kinematic parameters with G-Mean scores of 97.8% and 97.6%, respectively. This is followed by the front angles of the knee and FPA with G-Mean scores of 96.5% and 94.9%, respectively. Overall, the performance of the selected kinematic parameters is above 80%, except for the sagittal angle of the FPA, which has a G-Mean score of 78.2%. The proposed model performs significantly better compared to SVM-based models [
23] with a more than 10% higher margin, having similar results with image-based CNN models [
24].
A different perspective is used in the analysis of THA gaits, with an in-depth investigation conducted on the misclassification results. This approach can provide a glimpse into the success or failure of THA surgery. It was noted that the highest proportion of errors came from the misclassification of THA. For the top four most discriminating parameters, healthy and HOA gaits resulted in 10–25% and 10–30% misclassifications, respectively. In a broader sense, these percentages signify kinematic outcomes returning to normal with healthy prediction, while functional impairments can still be present with HOA prediction for the true THA class. Hence, further examination was conducted on the misclassified gaits of subjects after THA using the best two kinematics, namely the sagittal angles of the hip and the knee. The subjects were tabulated according to healthy and HOA misclassification, and it was found that there was no cross-misclassification between the top kinematic parameters. This means that there are no common features between healthy and HOA gaits on these parameters, but there are some common features with the THA gait. Indeed, there is a class of THA gait that requires a rehabilitation effort to closely align with healthy features. Additionally, more than 50% of the misclassification results are common to both hip and knee sagittal angles, thus boosting confidence into the success or failure determination of THA operation. These findings are promising, and our novel DL methodology could be used in medical diagnostic systems. Finally, misclassifications are driving us to keep improving our methodology.


