Article

Evaluation of Two-Stage Backwashing on Membrane Bioreactor Biofouling Using cis-2-Decenoic Acid and Sodium Hypochlorite

1
Department of Environmental Engineering, Konkuk University, Seoul 05029, Republic of Korea
2
The Academy of Applied Science and Technology, Konkuk University, Seoul 05029, Republic of Korea
*
Author to whom correspondence should be addressed.
Appl. Sci. 2025, 15(2), 874; https://doi.org/10.3390/app15020874
Submission received: 4 December 2024 / Revised: 13 January 2025 / Accepted: 15 January 2025 / Published: 17 January 2025
(This article belongs to the Special Issue Environmental Pollution and Wastewater Treatment Strategies)

Abstract

:
Biofouling in the membrane bioreactor (MBR) is a bottleneck in operation. This study explores the use of cis-2-decenoic acid (CDA) to mitigate biofouling. CDA is a signaling molecule known to disperse biofilms, which is reported to reduce the extracellular polymeric substances (EPS) of biofilms and make them less chemically resistant. In our experiments, CDA 300 nM was used for the backwashing biofouling in MBR, and backwashing with CDA followed by 0 to 500 mg/L sodium hypochlorite (NaOCl) was also performed. The synergistic effect of CDA and NaOCl in alleviating biofouling was observed at CDA 300 nM and 100 mg/L NaOCl. However, controversial phenomena occurred under other conditions. An increase in biofilm removal efficiency with higher concentrations of NaOCl was not observed. Instead, the fouling rate increased at a 200 mg/L NaOCl condition compared to the control condition (i.e., DW washing). This phenomenon is hypothesized to result from the antagonistic interaction between the dispersion induction by CDA and the stress induced by NaOCl. This study specifically demonstrated the efficiency of two-stage backwashing with CDA and NaOCl in various aspects. The results of this study are expected to be utilized for optimizing MBR backwashing protocols.

1. Introduction

Due to the increase in land uses and anthropogenic activities, available water sources are gradually decreasing, while the demand for clean water is increasing. Accordingly, membrane technology has been implemented in water treatment to enhance the quality and increase the quantity of available water [1,2]. MBR, a wastewater treatment technology that uses membranes, has advantages such as superior effluent quality, low sludge generation, and a small land footprint. The MBR market was valued at USD 3.35 billion in 2022 and is expected to grow at a compound annual growth rate (CAGR) of 7% by 2030 [3]. A major problem in the MBR operation is fouling. When fouling occurs, flux decreases at constant pressure or TMP increases to maintain a certain flux, which increases the operating costs [4,5]. The types of fouling include particulate fouling, organic fouling, inorganic fouling, and biofouling, and the main cause of membrane fouling is known as biofouling [6,7]. Biofouling refers to the adhesion and accumulation of microorganisms accompanied by biofilm development on membranes [8]. Biofilm is a microbial community in an extracellular polymeric substances (EPS) matrix secreted by microorganisms. EPS are composed of polysaccharides, proteins, nucleic acids, and humic substances. EPS play a role in providing nutrients, sharing genes, and defending against external threats such as toxins, antibiotics, and predators [9]. There are inactive cells inside biofilms, called persisted cells. They are resistant to malnutrition and antibiotics and can revert to their normal metabolic functions and replication rate after a harsh condition passes. For these reasons, biofilms are difficult to remove and regenerate easily, even if only a few microbes survive [10]. In MBR, membrane fouling is mainly controlled by physico-chemical cleaning called chemical enhanced backwashing (CEB). Typically, CEB can be carried out daily with sodium hypochlorite (NaOCl) [11]. NaOCl is a powerful oxidant that can kill microorganisms and remove organic matter from surfaces [12]. CEB has the advantage of being cost-effective, easy to apply, and versatile in dealing with different fouling types. However, the overuse of CEB can lead to membrane damage, by-product generation, and poor effluent quality [13,14,15]. Typically, the PVDF membrane recommends 500,000–1,000,000 mg/L·has the max lifetime exposure to NaOCl depending on the manufacturer [16]. Wang et al. (2010) reported that 24 h of soaking of the PVDF membrane in NaOCl with a concentration of 330 mg/L at 4–7-day intervals for 4, 5, 6, 10, and 12 repetitions during the MBR operation resulted in 44.1, 52.2, 63.9, 67.9, and 75.9% reductions in clean water flux, respectively, and up to a maximum of a 16.5% reduction in tensile strength with repetition compared to the virgin membrane [17]. In addition, depending on the chemical concentration of CEB, biofilm generation can be accelerated [18,19].
Therefore, research on biological methods related to quorum sensing is underway to complement chemical cleaning. Quorum sensing is a cell-to-cell communication mechanism in microbial communities. This mechanism relies on the production, detection, and response to diffusible signal molecules in a cell density-dependent manner [20]. Through this mechanism, microbes monitor their population density and show multicellular behaviors such as symbiosis, toxin production, antibiotic production, motility regulation, and biofilm formation [21,22]. The strategies related to quorum sensing control biofilm formation by dealing with diffusible signal molecules to regulate them or make them unrecognizable. These strategies are less efficient to clean the membranes clogged by dead cells and organic–inorganic complexes. In summary, biological methods are friendly to the membrane and environment, but they are more expensive than several chemical cleaning methods and it is difficult to design a universal cleaning strategy [11,23,24]. Meanwhile, cis-2-decenoic acid (CDA) has been studied in various fields as a promising substance for biofilm reduction [25,26,27,28]. CDA is a signal molecule associated with the diffusible signal factor signaling system and is known to induce biofilm dispersion [29]. CDA can have inter-species and inter-kingdom effects, and biofilms dispersed by CDA have a vulnerable structure due to the escape of microbes by creating pores, making them more susceptible to external threats like antibiotics or oxidants [26,30]. Therefore, a cleaning strategy using CDA can be compatible with conventional cleaning strategies and can be used as a versatile biological method for MBR systems.
Previous studies have demonstrated the biofilm dispersion effect of CDA on single strains and examined the synergistic effect of CDA and disinfectants [27,31]. Sepehr et al. (2014) have confirmed the synergistic effect of CDA 310 nM and hydrogen peroxide 120 ppm or peracetic acid 70 ppm in a 1 h reaction for single-species biofilms [26]. However, there are only a few studies on the application of CDA in the cleaning process of MBR and the interaction of CDA with NaOCl. This study tested a two-stage backwashing protocol using CDA and NaOCl and evaluated its backwashing performance. The expected advantages and limitations of the backwashing protocols are compared in Table 1. Backwashing performance was analyzed based on operating extension, EPS removal, and surface coverage. Through the analysis, a comprehensive understanding of the backwashing mechanism was achieved.

2. Materials and Methods

2.1. Lab-Scale MBR Operation for Evaluating Permeability by Two-Stage Backwashing

Lab-scale MBR was operated to evaluate the two-stage backwashing protocol. MBR sludge was sampled from a local wastewater treatment plant. The initial mixed liquor suspended solid (MLSS) of the MBR sludge was 5900 mg/L. After the sludge adapted to synthetic wastewater for over 30 days, the MLSS of the sludge was approximately 6200 mg/L. The composition of the synthetic wastewater is shown in Table 2. A hollow fiber membrane module, composed of PVDF and manufactured by Toray, Japan, was reassembled to fabricate a lab-scale module. The detailed specifications of the membrane are as follows: a pore size of 0.01 µm, a maximum transmembrane pressure of 100 kPa, and a maximum NaOCl exposure as Cl2 of 1,000,000 mg/L·h. The nominal surface area of the lab-scale membrane module was 87.96 cm2. Two modules were submerged in each reactor (i.e., total membrane surface area in each reactor was 175.92 cm2) and permeation pumps were operated under a constant flux condition of 20 L/m2/h. The nominal volume of the MBR tank was 3 L, and the operating conditions of MBR were HRT 8.38 h, temperature 24 °C ± 1, SRT 30 days, and aeration 1 L/min, respectively. The transmembrane pressure (TMP) of each module was monitored by a digital pressure gauge, and the module was withdrawn when the TMP reached 80 kPa. Two-stage backwashing with various concentrations of NaOCl was performed on the withdrawn module. A 1000 mg/L CDA stock (in 10% ethanol carrier) was diluted to 300 nM with distilled water (DW). Sodium hypochlorite was diluted to each concentration with DW after the concentration of sodium hypochlorite stock solution was confirmed by DPD-free chlorine reagent (Hach, USA). Each withdrawn module was immersed in 1700 mL of DW, and backwashing was performed by CDA 300 nM solution at a flux of 30 L/m2/h for 30 min. The optimal concentration and contact time of CDA were based on previous studies [27,28,31]. After the CDA backwashing had finished, NaOCl backwashing was performed at the same flux and duration. The concentration range of NaOCl is determined based on dosages of applications on membrane bioreactors in practice and literature reviews [11]. The concentration of NaOCl was 0 (i.e., DW), 100, 200, 300, 400, 500 mg/L, respectively. Each backwashed membrane module was gently rinsed with DW and returned to the bioreactor. When the TMP of the membrane module reached 80 kPa five times, the operation was terminated.

2.2. Lab-Scale MBR Operation for Evaluation of Foulants

Lab-scale MBR was operated to evaluate the foulant removal of the two-stage backwashing protocol. MBR sludge was collected at the same local wastewater treatment plant. The initial MLSS of the MBR sludge was 8350 mg/L. After the sludge adapted to synthetic wastewater for over 30 days, the MLSS of the sludge was approximately 6500 mg/L. The hollow fiber membrane module was reassembled to produce a lab-scale size. The nominal surface area of the lab-scale membrane module was 43.98 cm2. Two modules were paired in one peristaltic pump, assuming that identical fouling would occur in the paired modules. Two pairs of modules were submerged in each reactor (i.e., total membrane surface area in each reactor was 175.92 cm2). The other operating conditions were the same as previously described. Paired modules were withdrawn when TMP reached 80 kPa. Withdrawn paired modules were disassembled, and each membrane module was rinsed with 20 mL of 0.9% NaCl solution. One of the rinsed membrane modules was cut into approximately 2 cm length, immersed in 40 mL of phosphate-buffered saline (PBS), and stored at 4 °C. The other module underwent backwashing protocol, immersed in 850 mL of DW. The backwashed membrane module was gently rinsed with DW and stored under the same conditions.

2.3. EPS’ Extraction and Analysis

To evaluate the quantity of biofilm residue, EPS were extracted from the membranes. The membranes immersed in PBSs were vortexed for 5 min and sonicated for 1 h. After sonication, the membranes were removed from the solution. The solution was centrifuged at 12,000× g, 4 °C for 15 min, and 30 mL of supernatant was filtered through a 0.45 µm filter. Filtered supernatant was defined as soluble EPS (SEPS) [32]. An additional 30 mL of PBS was added to compensate for the removed supernatant. Residual solution was stirred with a cation exchange resin (CER 5 g/60–80 cm2) at 900 RPM, 4 °C, for 90 min [33,34]. After stirring, the resin was removed from the solution. The solution was centrifuged, and the supernatant was filtered by the same procedure. The filtered supernatant was defined as bound EPS (BEPS) [28,33]. The following analysis is based on total EPS, which are the sum of SEPS and BEPS. Extracted EPS samples were characterized by polysaccharide, protein, DNA, and three-dimensional fluorescence excitation emission matrix (EEM). Polysaccharide was analyzed by the phenol–sulfuric acid method using glucose as standard [35,36]. Protein was analyzed by the Bradford assay using bovine serum albumin as standard [28,36,37]. DNA was analyzed by the Burton assay using low-molecular-weight DNA from salmon sperm as standard [38,39]. EEM spectra were obtained by a spectro-fluoro-photometer (RF-5301, Shimadzu, Kyoto, Japan). Excitation was scanned from 220 to 400 nm with a 10 mm increment, and emission was scanned for each excitation wavelength from 280 nm to 600 nm with a 1 nm increment. To avoid the inner filter effect, each sample was diluted to DOC below 1 mg/L before scanning. The scanned intensity was normalized by dividing the DOC concentration and multiplying the dilution factor.

2.4. Biofilm Analysis

The terminated modules for evaluating permeability were finally backwashed, and the remaining biofilm was analyzed using confocal laser scanning microscopy to understand the morphological changes in biofilm during the backwashing. A confocal laser scanning microscope (CLSM; LSM 710, Zeiss, Oberkochen, Germany) can visually observe biofilm formation on the membrane surface and characterize biofilm structure. The hollow fiber membrane specimens from the MBR operation were stained using LIVE/DEAD™ BacLight™ Bacterial viability kits (Thermo Fisher, Waltham, MA, USA) [40]. The staining labeled dead and live cells on the biofilm, and the CLSM images showed dead cells as red and live cells as green. CLSM analysis was performed with a z-stack thickness of 0.94 µm and 50 slices. The size of analyzed area is 559.43 µm × 559.43 µm. The CLSM analysis was repeated with at least five different points for all conditions, and three representative images were selected for quantification. CLSM image quantification was performed using COMSTAT software (https://www.comstat.dk/, accessed on 17 May 2024) analyzing thickness distribution, biomass, surface-to-biovolume ratio, and roughness coefficient [41].

3. Results

3.1. Effect of Two-Stage Backwash on MBR Permeability

The variation in TMP during the MBR operation was evaluated as shown in Figure 1. After the TMP reached 80 kPa, backwashing was performed. CDA 300 nM was applied for all conditions, and the graph titles indicate the concentration of NaOCl applied. Four backwashes during the operation extended the operating time by 234, 387, 162, 350, 341, and 369 h at NaOCl concentrations of 0, 100, 200, 300, 400, and 500 mg/L, respectively. It is remarkable that for 200 mg/L, the operating time was shorter than for 0 mg/L. This indicates that the residual biofilm regenerated rapidly due to chlorine oxidizing stress after backwashing.
It is generally accepted that sublethal concentrations of NaOCl stimulate microorganisms to increase the production of EPS and chlorine resistance, which has a negative impact on membrane fouling control [42]. Li et al. (2022) reported that Ideonella and Pseudomonas, which were isolated from the fouled MBR membrane, produced excessive EPS when exposed to NaOCl (300 mg/L effective chlorine, 30 min), resulting in an approximately 50% increase in TOC content [36]. Lin et al. (2017) suggested that a sublethal dosage of NaOCl causes the biofilm to divide into smaller clusters, leading to higher cultivability [43]. Strempel et al. (2017) found that a sublethal concentration of HOCl induces biofilm formation in Pseudomonas aeruginosa by increasing the levels of bis-(3′−5′)-cyclic dimeric guanosine monophosphate (c-di-GMP), which is an intracellular signaling molecule involved in biofilm formation [44,45]. This reaction can conflict with the CDA mechanism, which is related to the reduced intracellular level of c-di-GMP [31].
However, the less negative effects at 100 mg/L compared to 200 mg/L are suspected to be the result of the appropriate application of NaOCl to the dispersed biofilm. It is suspected that moderate concentrations of NaOCl weaken the binding force of the dispersed biofilm matrix, making it easier to remove by backwashing before microbes can acutely respond [46]. Therefore, the 100 mg/L case demonstrated a synergistic effect of CDA and NaOCl. On the other hand, the shorter operating time at 200 mg/L compared to 0 mg/L indicates that the effect of NaOCl on biofilm was dominant during two-stage backwashing at a higher NaOCl concentration. Higher concentrations of NaOCl increase stress reactions or cell lysis, leading to the generation of additional foulants [47]. Nevertheless, experiments conducted at NaOCl concentrations of 300, 400, and 500 mg/L similarly extended operating times when compared to the concentration of 100 mg/L NaOCl. This suggests that the increase in foulant due to stress reaction and cell lysis is balanced by the foulant removal capacity of NaOCl.

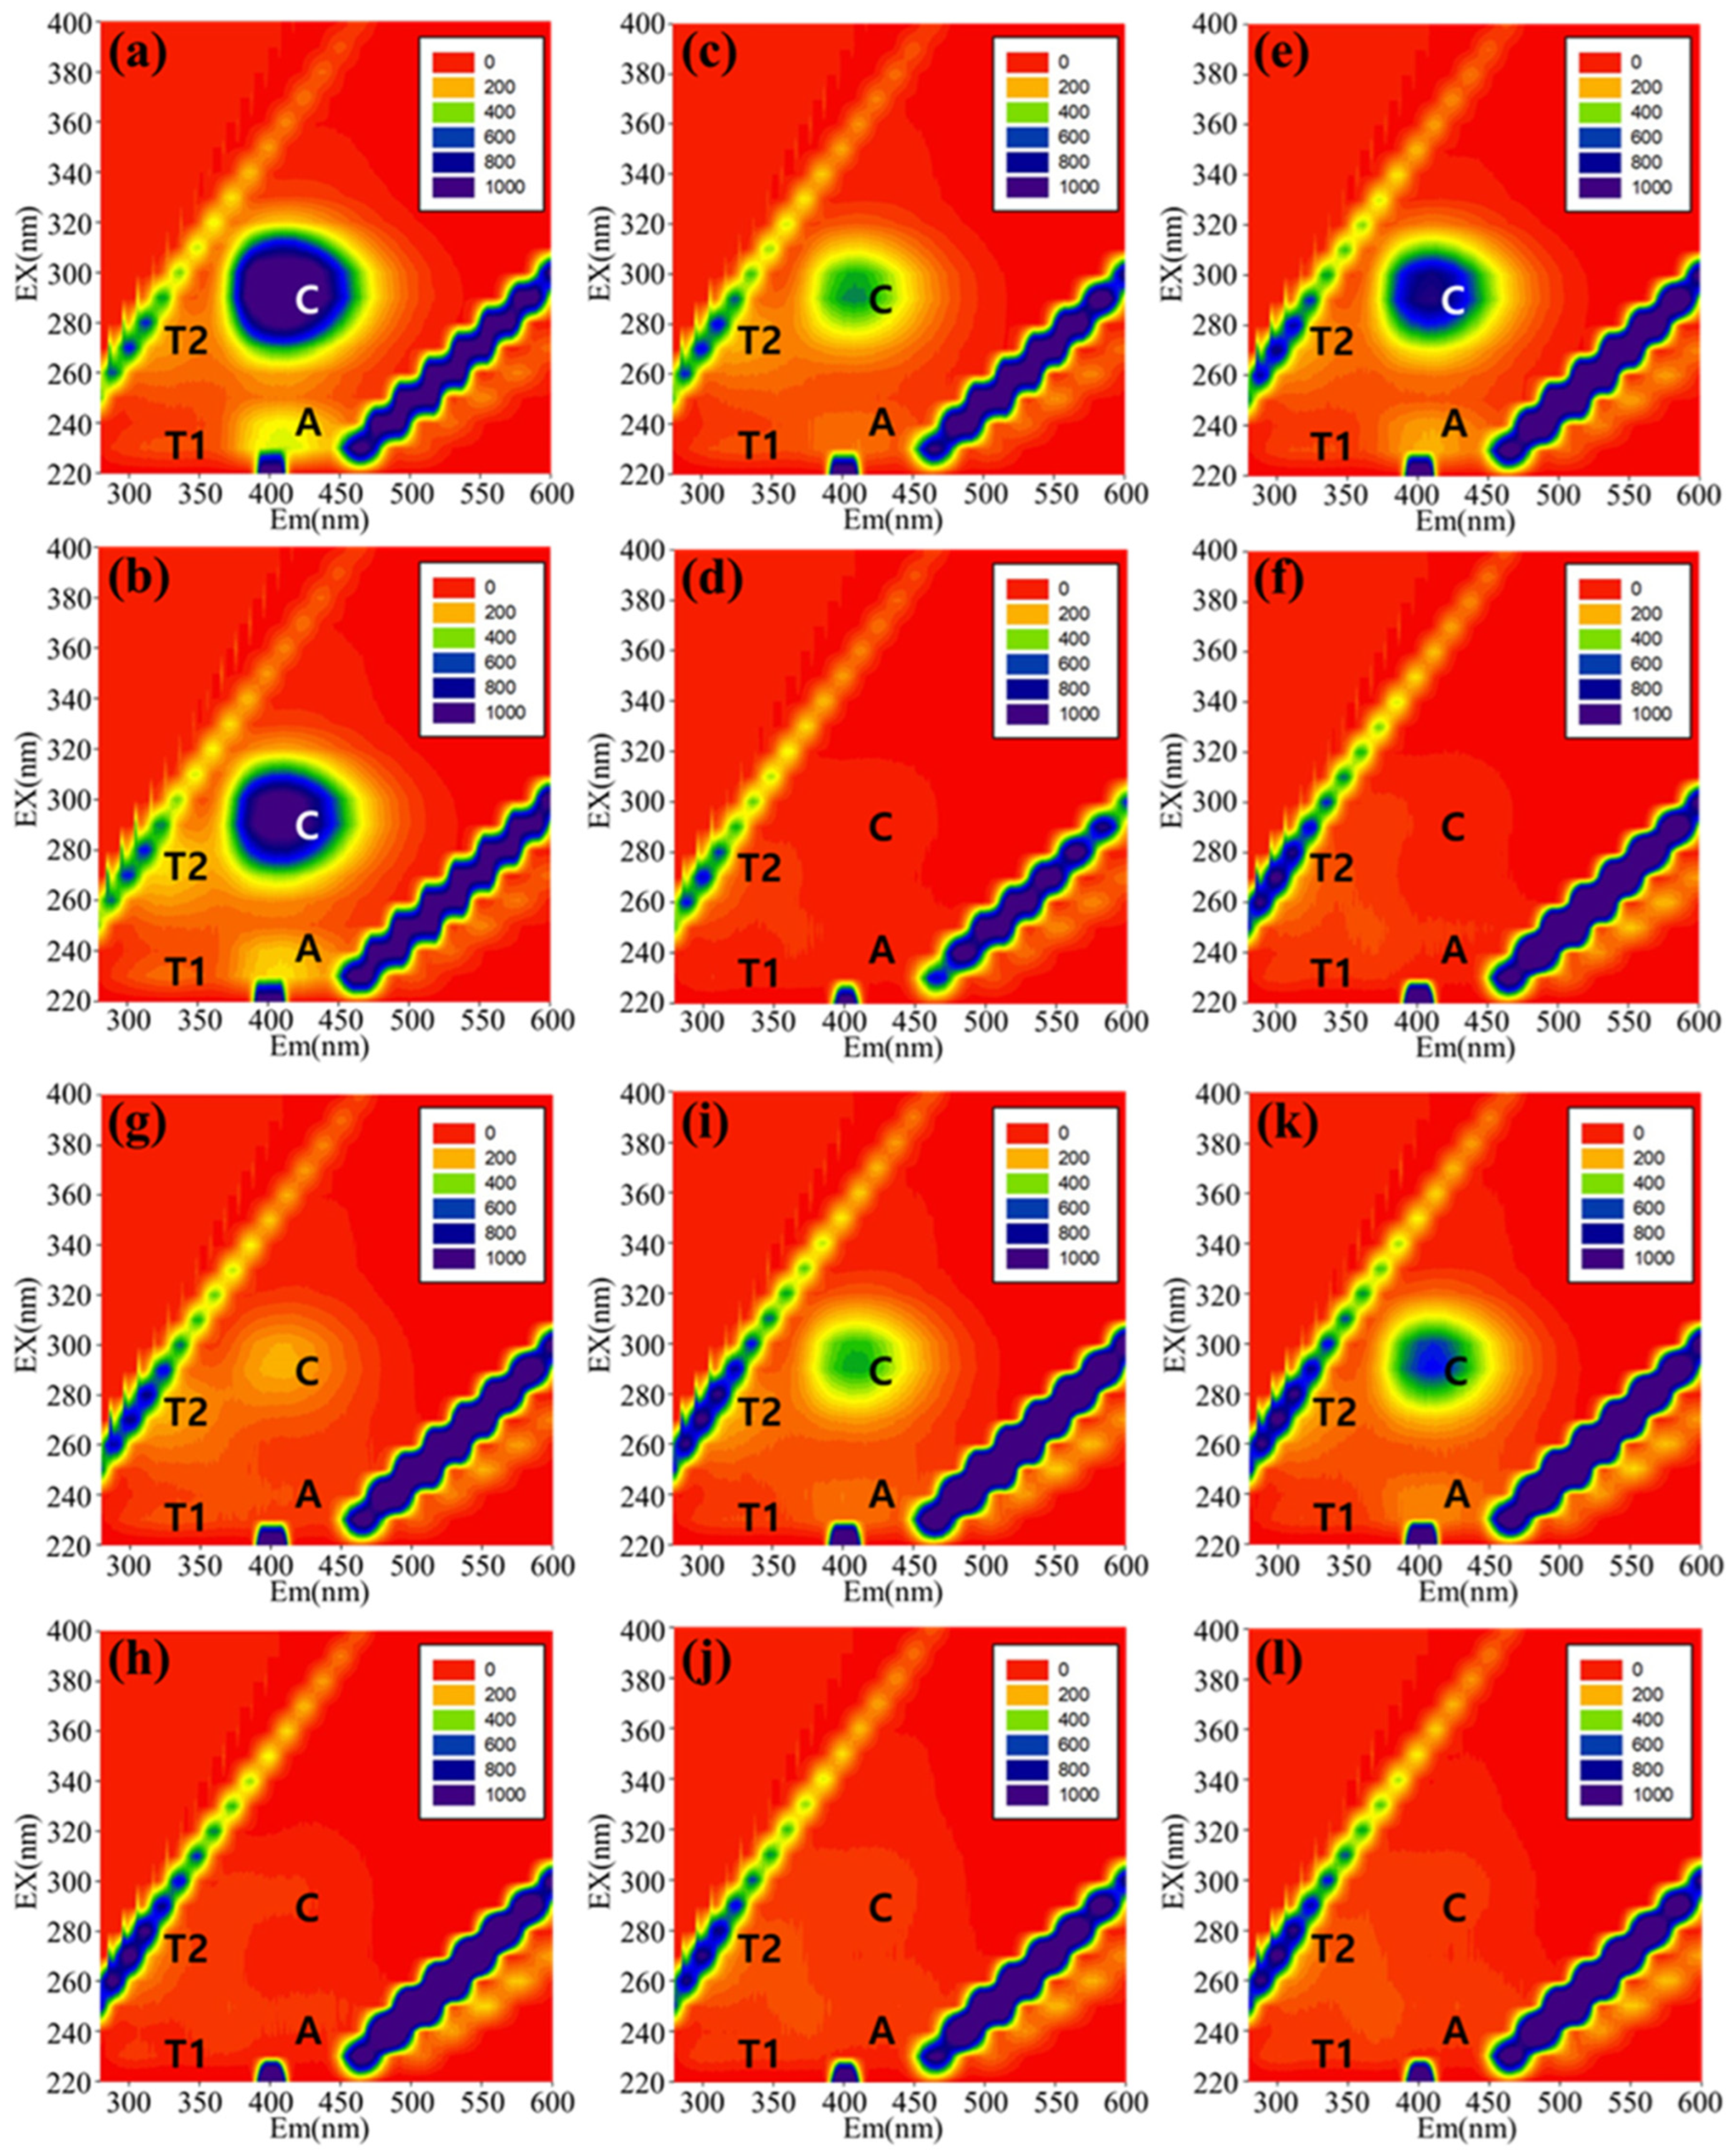
3.2. EEM Peak Composition by Backwashing

EEM analysis can characterize organic matter in EPS samples and indicate microbial behavior during the backwashing process. Approximate wavelengths of specific peak areas of organic matter are as follows: tyrosine-like substances [T1 peak; Ex/Em = 220–240/330–360 nm], fulvic acid-like substances [A peak; Ex/Em = 230–260/400–450 nm], tryptophan-like substances [T2 peak; Ex/Em = 270–280/330–360], and humic acid-like molecules [C peak; Ex/Em = 300–340/400–450 nm]. The intensity changes in the T1 and T2 peaks infer a microbial activity change in the biofilm. The C peak indicates ready-made EPS, which are composed of higher-molecular-weight substances, while the A peak indicates relatively lower-molecular-weight substances [48,49,50]. The contour plots of EEM are presented in Figure 2. As shown in Figure 2, the backwashing process significantly flattened each peak in the presence of NaOCl, despite normalization by DOC [51,52]. This suggests that NaOCl can damage functional groups of organic matter and reduce fluorescence. The fluorescence regional integration (FRI) analysis was applied to perform a quantitative comparison of EEM data, analyzing the microbial reaction and behavior of the backwashing process [48]. The average emission intensity of each area is defined as the peak intensity, and the sum of the peak intensity of SEPS and BEPS is analyzed. The reduction in peak intensity is compared in Figure 3, and the fraction change tendency is compared in Figure 4.
In the CDA with the DW case of Figure 3, the T1 and T2 peaks increase, and the A and C peaks decrease. This indicates that biofilm dispersion occurred as a result of gene expression triggered by the application of CDA. As the microbials inside the biofilm changed their lifestyle from sessile to planktonic, microbial activity increased and fulvic acid and humic acid, which are components of the biofilm, degenerated. On the other hand, a significant decrease in all peaks can be observed with the application of NaOCl. It is also interesting that peak reduction decreases with increments of the NaOCl concentration. Despite the increase in the oxidizing capacity with the increment in NaOCl, the decrease in peak reduction indicates the unwanted effect with the NaOCl application. The most significant peak reduction at 100 mg/L suggests that it most effectively weakened the biofilm matrix.
The normalized percent fluorescence response (Pi,n) distribution is shown in Figure 4a, and the variation in each distribution is organized in Figure 4b. In Figure 4b, the sum of each variation is always zero. The variation in the distribution can define the characteristics of the EPS that changed from before to after the backwashing, and this reveals the backwashing behavior. For the C peak, the distribution decreases in the presence of NaOCl, which means that larger molecules are primarily decomposed by the sacrifice reaction [36,53,54]. Accordingly, the increase in the distribution of the T2 peak with an increment in the NaOCl concentration is related to the decomposition of macromolecules into small hydrophilic molecules and a shift from the C peak to the T2 peak [55]. The T1 peak and T2 peak represent an increase in microbial activity and leakage of intracellular substances by cell lysis [49,55]. Therefore, it can be assumed that the T1 and T2 distributions increase at low concentrations of NaOCl due to microbial activity, and the distribution increases at high concentrations of NaOCl due to cell lysis.

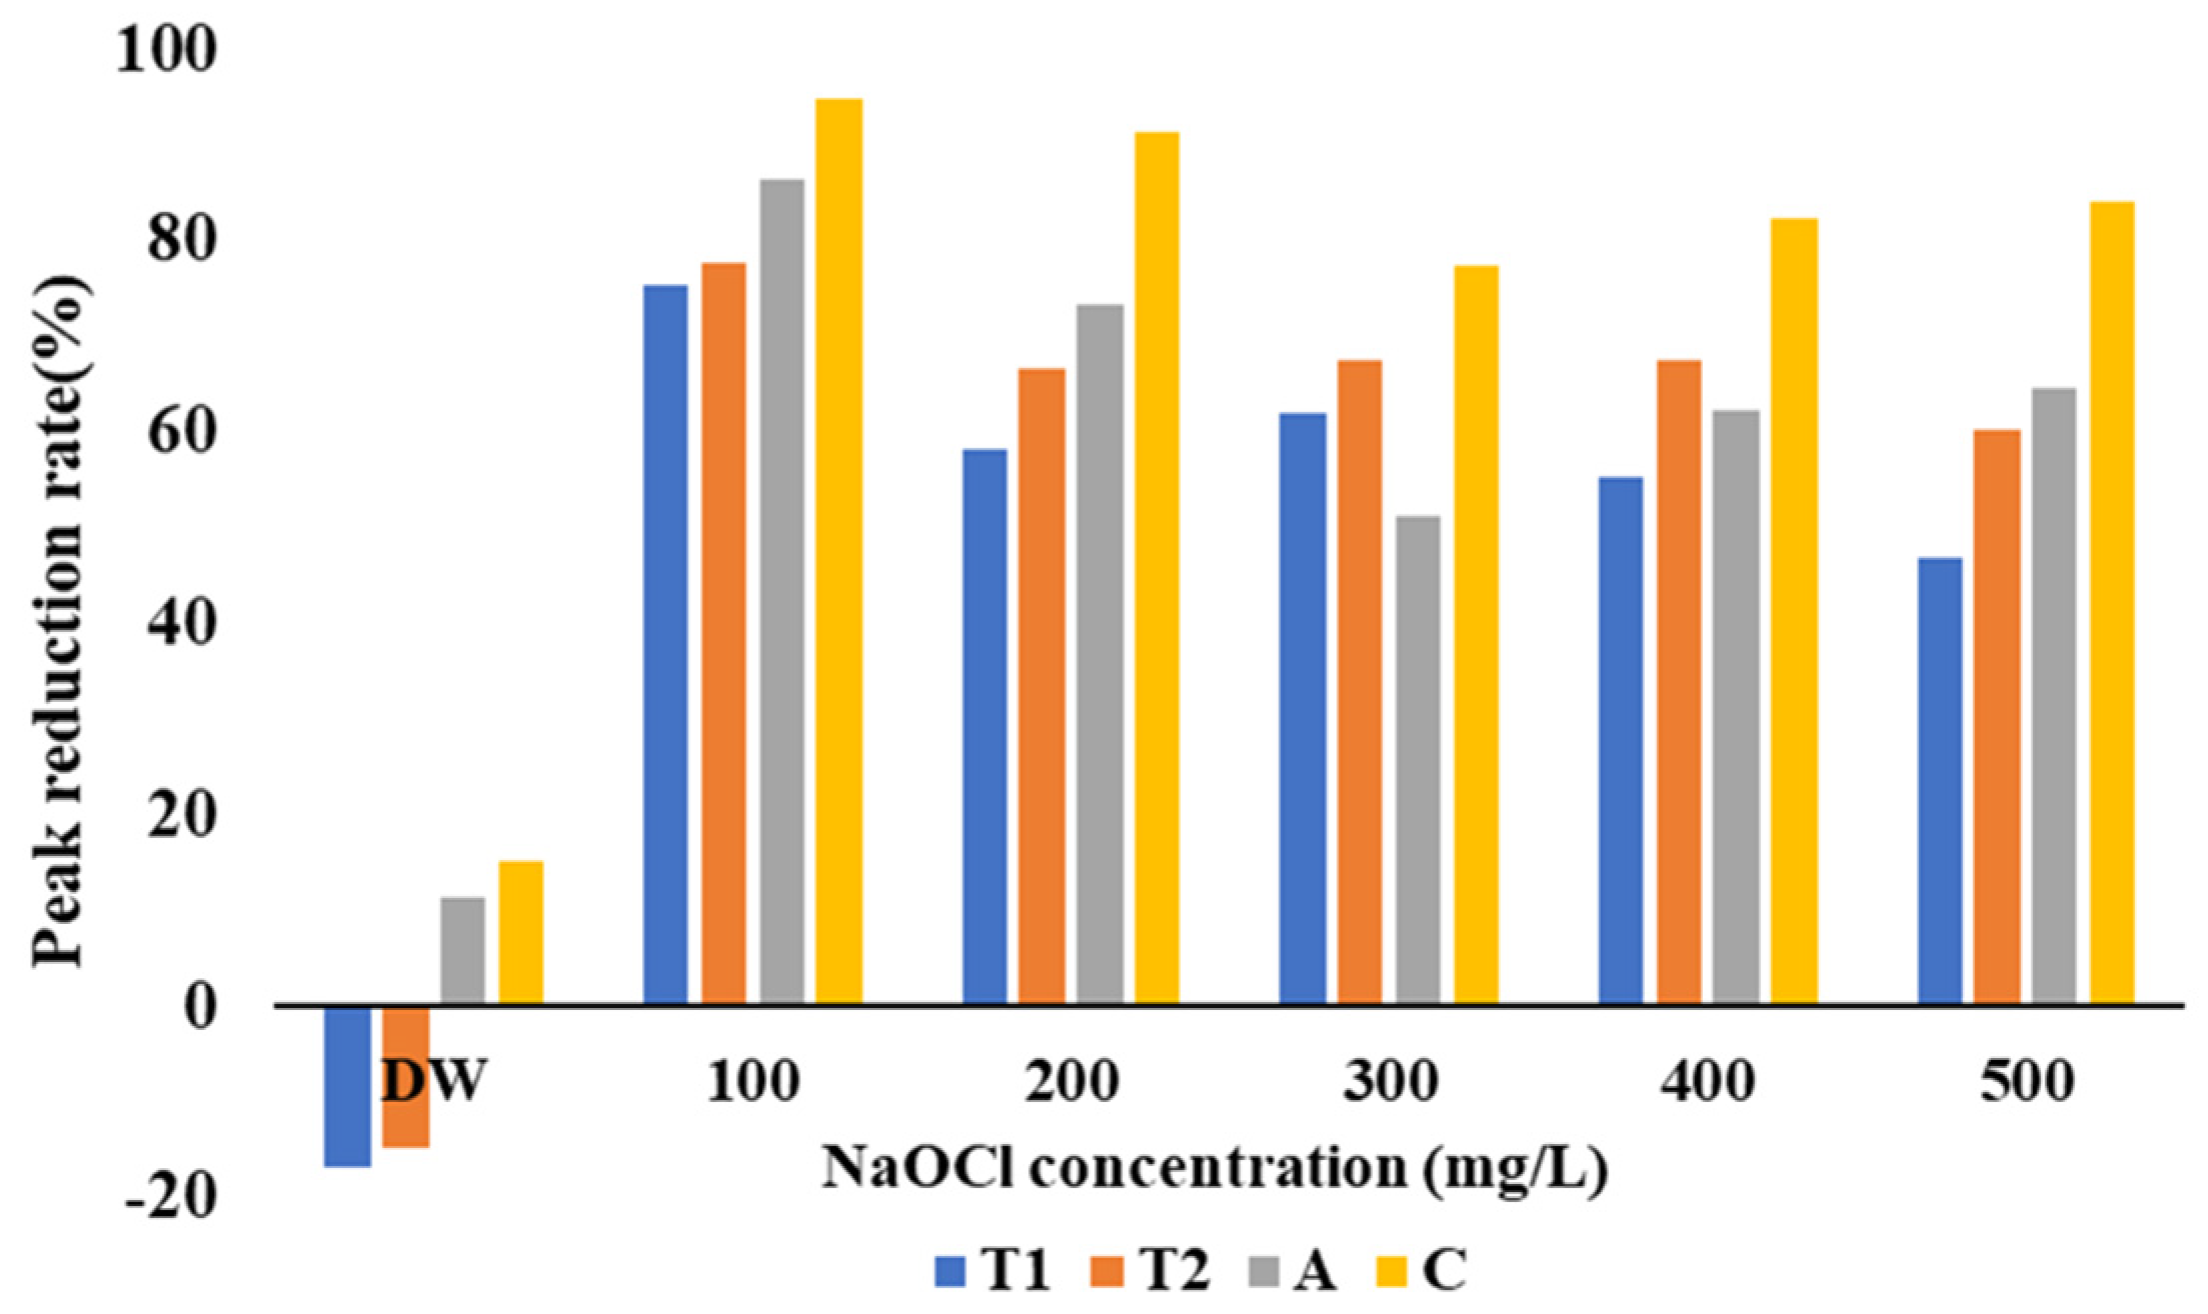
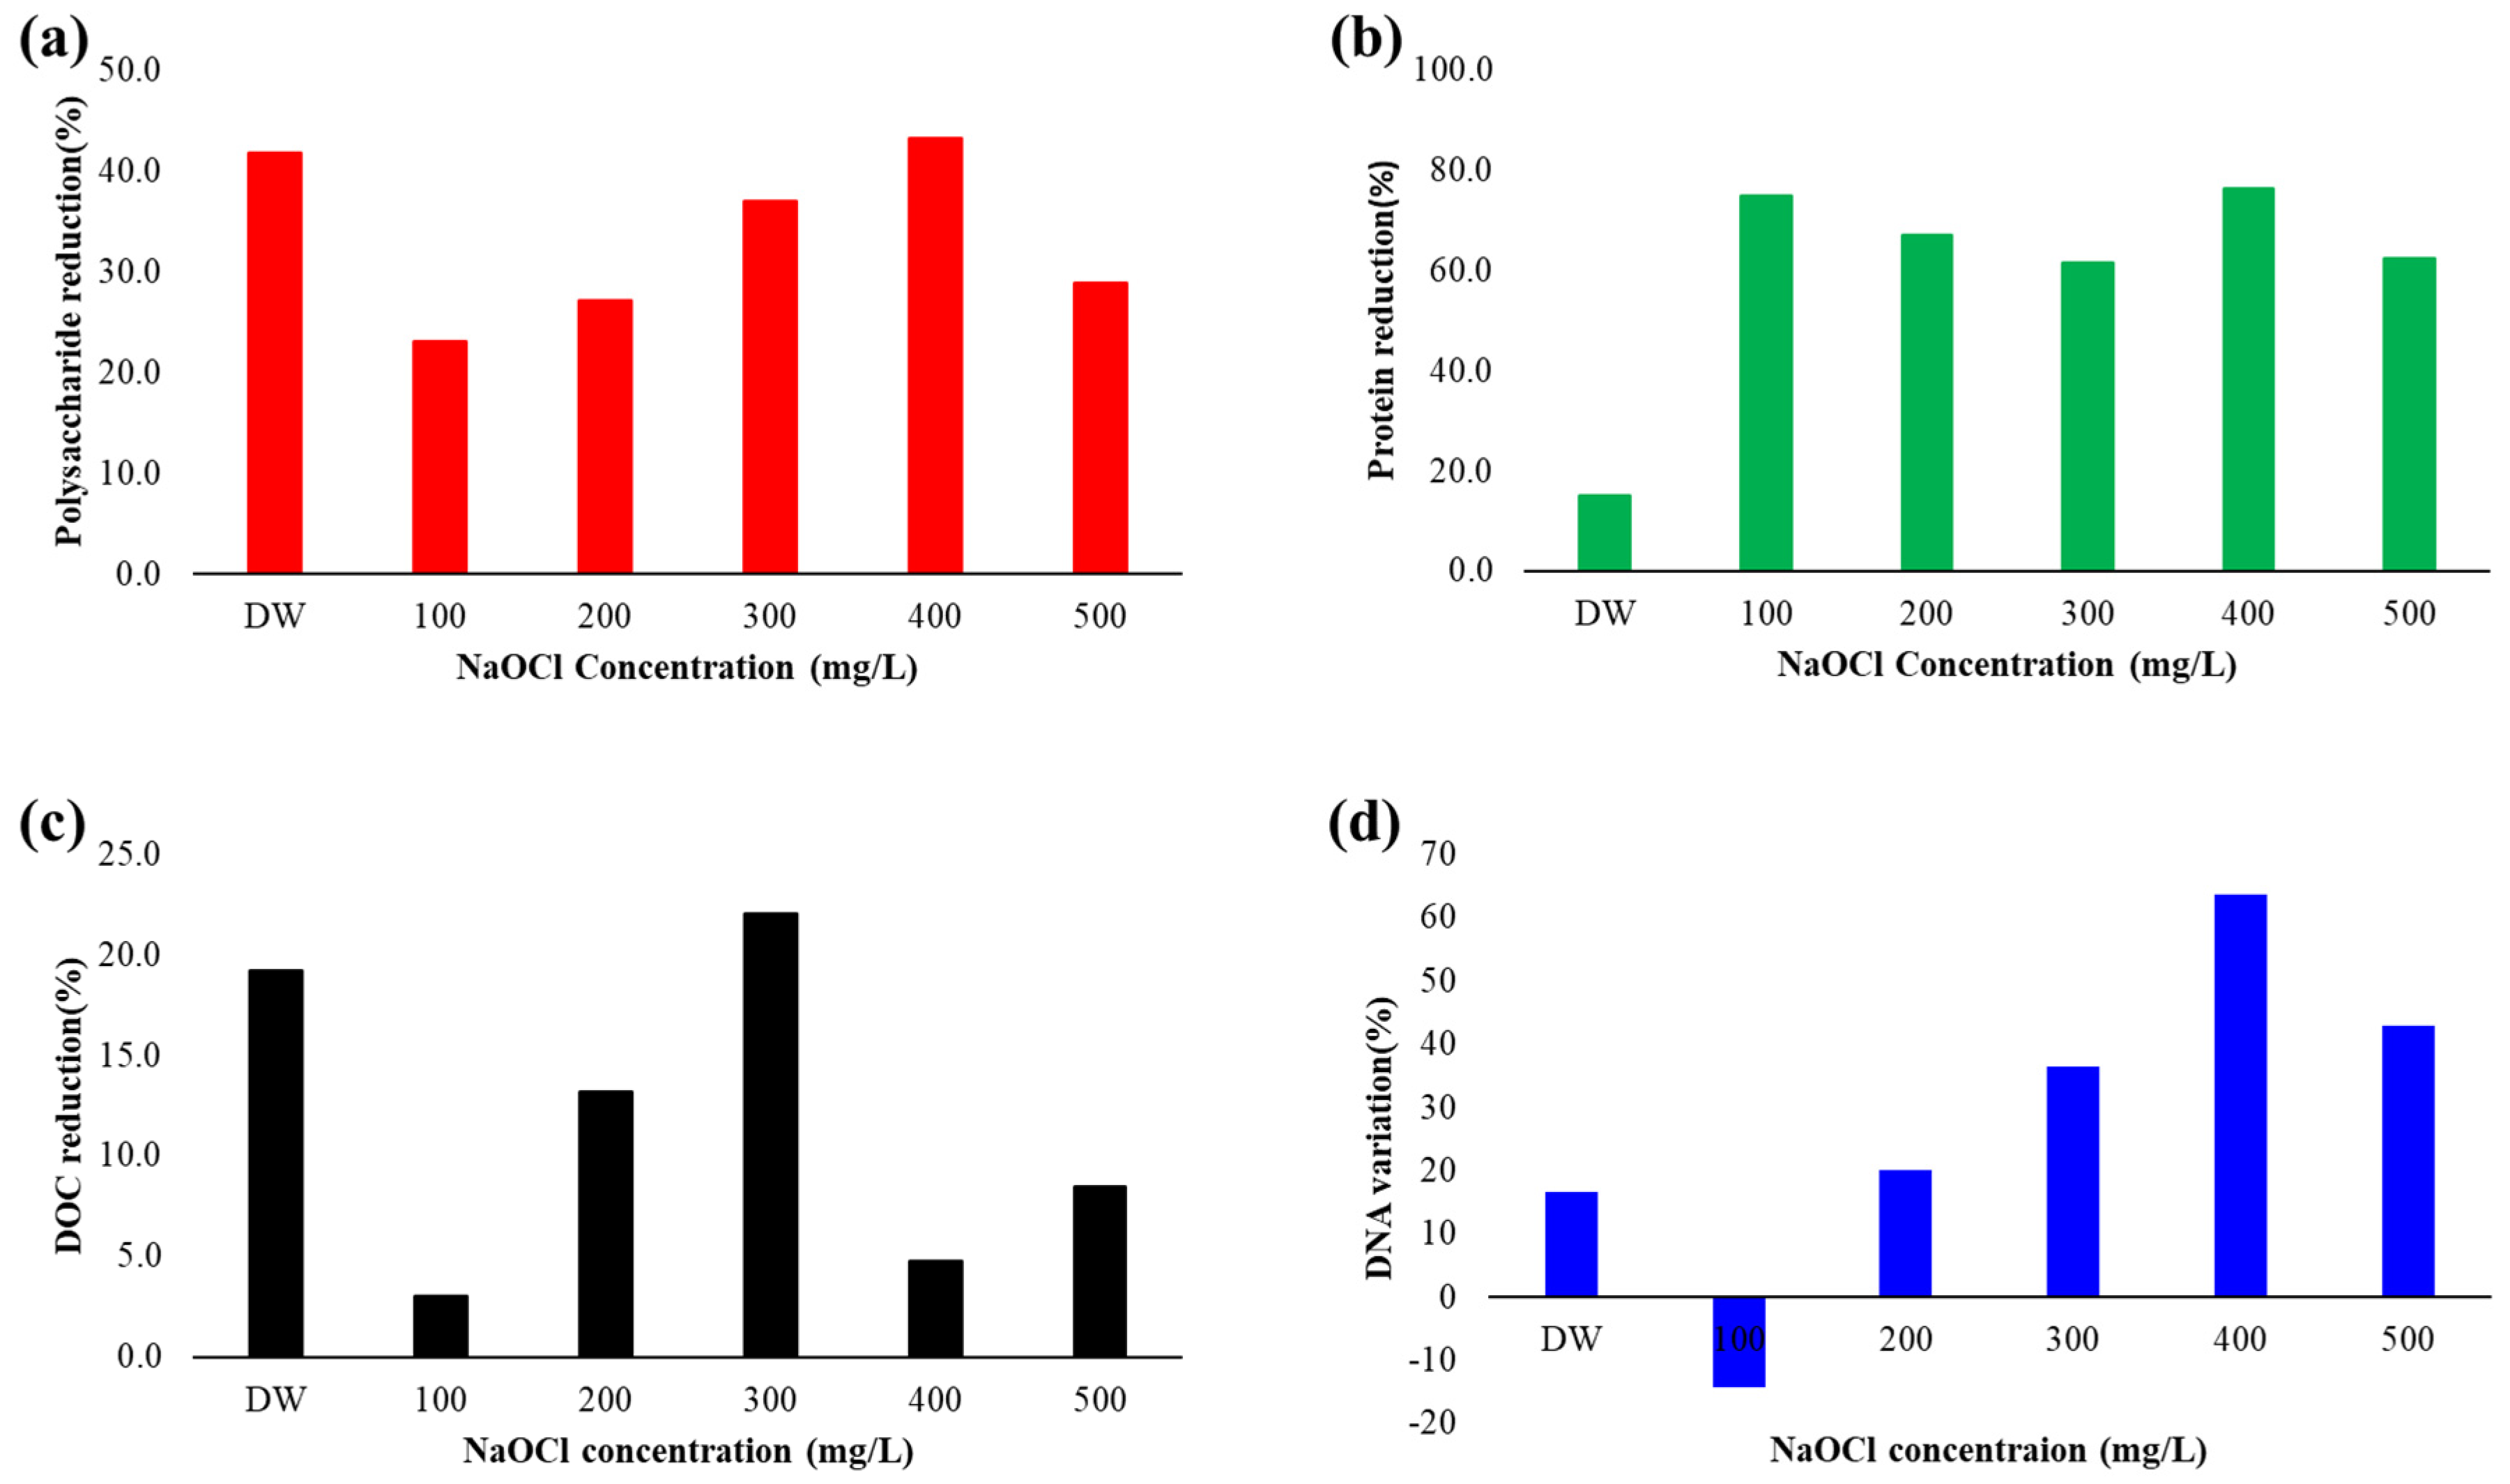
3.3. Biofouling Reduction by CDA and NaOCl

The total EPS extracted from the membrane modules before and after backwashing are compared in Figure 5. As shown in Figure 5a, CDA with DW reduced 41.7% of the polysaccharide, and the addition of NaOCl generally had a negative effect on the polysaccharide reduction. This result is hypothesized to be due to a conflict between the mechanism of CDA and the microbial response to NaOCl [31,44,45]. The highest polysaccharide reduction rate was 43.3% at 400 mg/L. However, for protein reduction, the addition of NaOCl significantly improved efficiency. The highest protein reduction rate was 76.4% of 400 mg/L (Figure 5b). This result can be attributed to the protein denaturation effect of NaOCl [56]. Interestingly, Li et al. (2022) reported that exposure to NaOCl increased the protein-to-TOC ratio in the EPS of NaOCl-resistant microbes and polysaccharide is preferentially degraded by NaOCl to protect microbes from reactive oxygen species (ROS). However, our results suggest that the addition of NaOCl, compared to CDA alone, significantly improved the removal of protein and generally had a negative impact on the removal of polysaccharides. Polysaccharide reduction by CDA is expected to counteract the preferential degradation of polysaccharides in the EPS by NaOCl. It is interpreted that the delayed response of microbes to oxidative stress caused an initial failure to prevent the denaturation of biofilm proteins [36].
As shown in Figure 5c, DOC reduction was comparatively lower than polysaccharide and protein reduction. For example, the reduction in DOC at 400 mg/L was 4.8%. This result indicates that backwashing with NaOCl at the experimental conditions degrades biomass into intermediate products but does not remove it from the membrane surface. On the other hand, the higher DOC reduction by CDA with DW than other samples suggests that the partial degradation of organic matter may have a negative impact on foulant removal from the membrane surface.
The changes in the DNA content in EPS are shown in Figure 5d. In the sample, the EPS concentrations were compared before and after backwashing. The concentrations of components such as protein and polysaccharide were reduced in samples after backwashing, indicating that the contents in the EPS were lower in the backwashed sample, which can be expected. In the case of DNA, however, an increase in the DNA content was observed in the sample treated with a NaOCl concentration of 200 mg/L, which is assumed to result from cell lysis caused by NaOCl during backwashing. The intracellular molecules released during cell lysis can serve as an additional foulant, and the released DNA can be utilized by the microbial community as extracellular DNA (eDNA). The eDNA can contribute to horizontal gene transfer in the biofilm community and subsequently contribute to chlorine resistance, including biofilm production [57,58,59].
In summary, two-stage backwashing with CDA and DW was effective in reducing polysaccharide and DOC, but not in reducing protein. This suggests that CDA is effective in weakening the slime structure of the biofilm [60]. However, in the case of two-stage backwashing with CDA and NaOCl, the reduction in polysaccharide and DOC was not as high as that of DW, but the reduction in protein was significantly improved. It is estimated that the reduction in protein impaired the integrity of the biofilm, which had a positive effect on fouling control. The increase in DNA in EPS with an increment in the NaOCl concentration indicates cell lysis, and this suggests that an increase in oxidation capacity and additional foulant may lead to conflict; thus, no improvement in operational efficiency was observed.
However, uncertainties remain, including the mechanism of NaOCl dependence on pH, the antagonistic interaction between CDA and NaOCl, and the efficiency dependence on backwashing flux under CDA two-stage conditions. The measurement of the c-di-GMP concentrations can be used to assess the effects of NaOCl-induced chlorine stress and CDA on the molecular-level response. A fluorescence-based assay using the unstable GFP reporter [PcdrA::gfp(ASV)] can be considered to measure c-di-GMP [31].

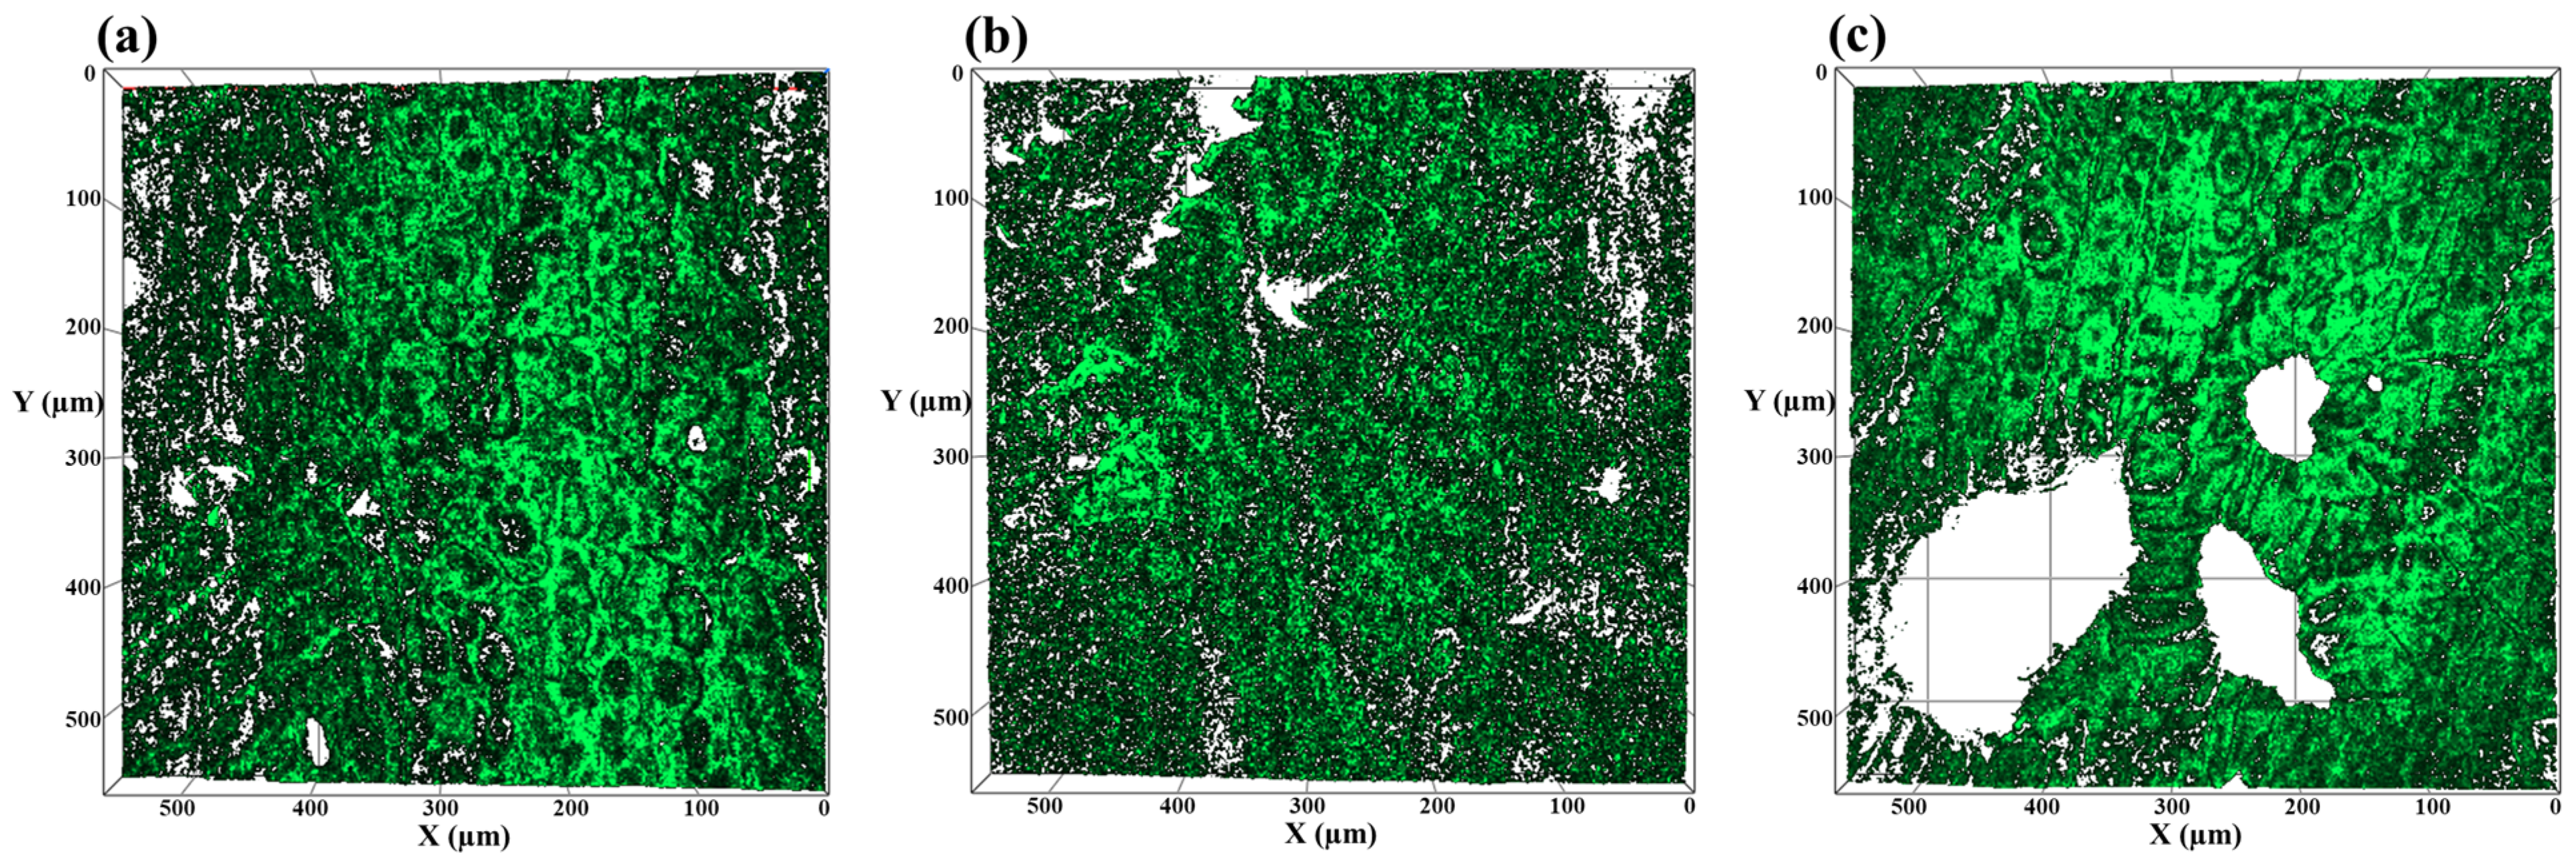
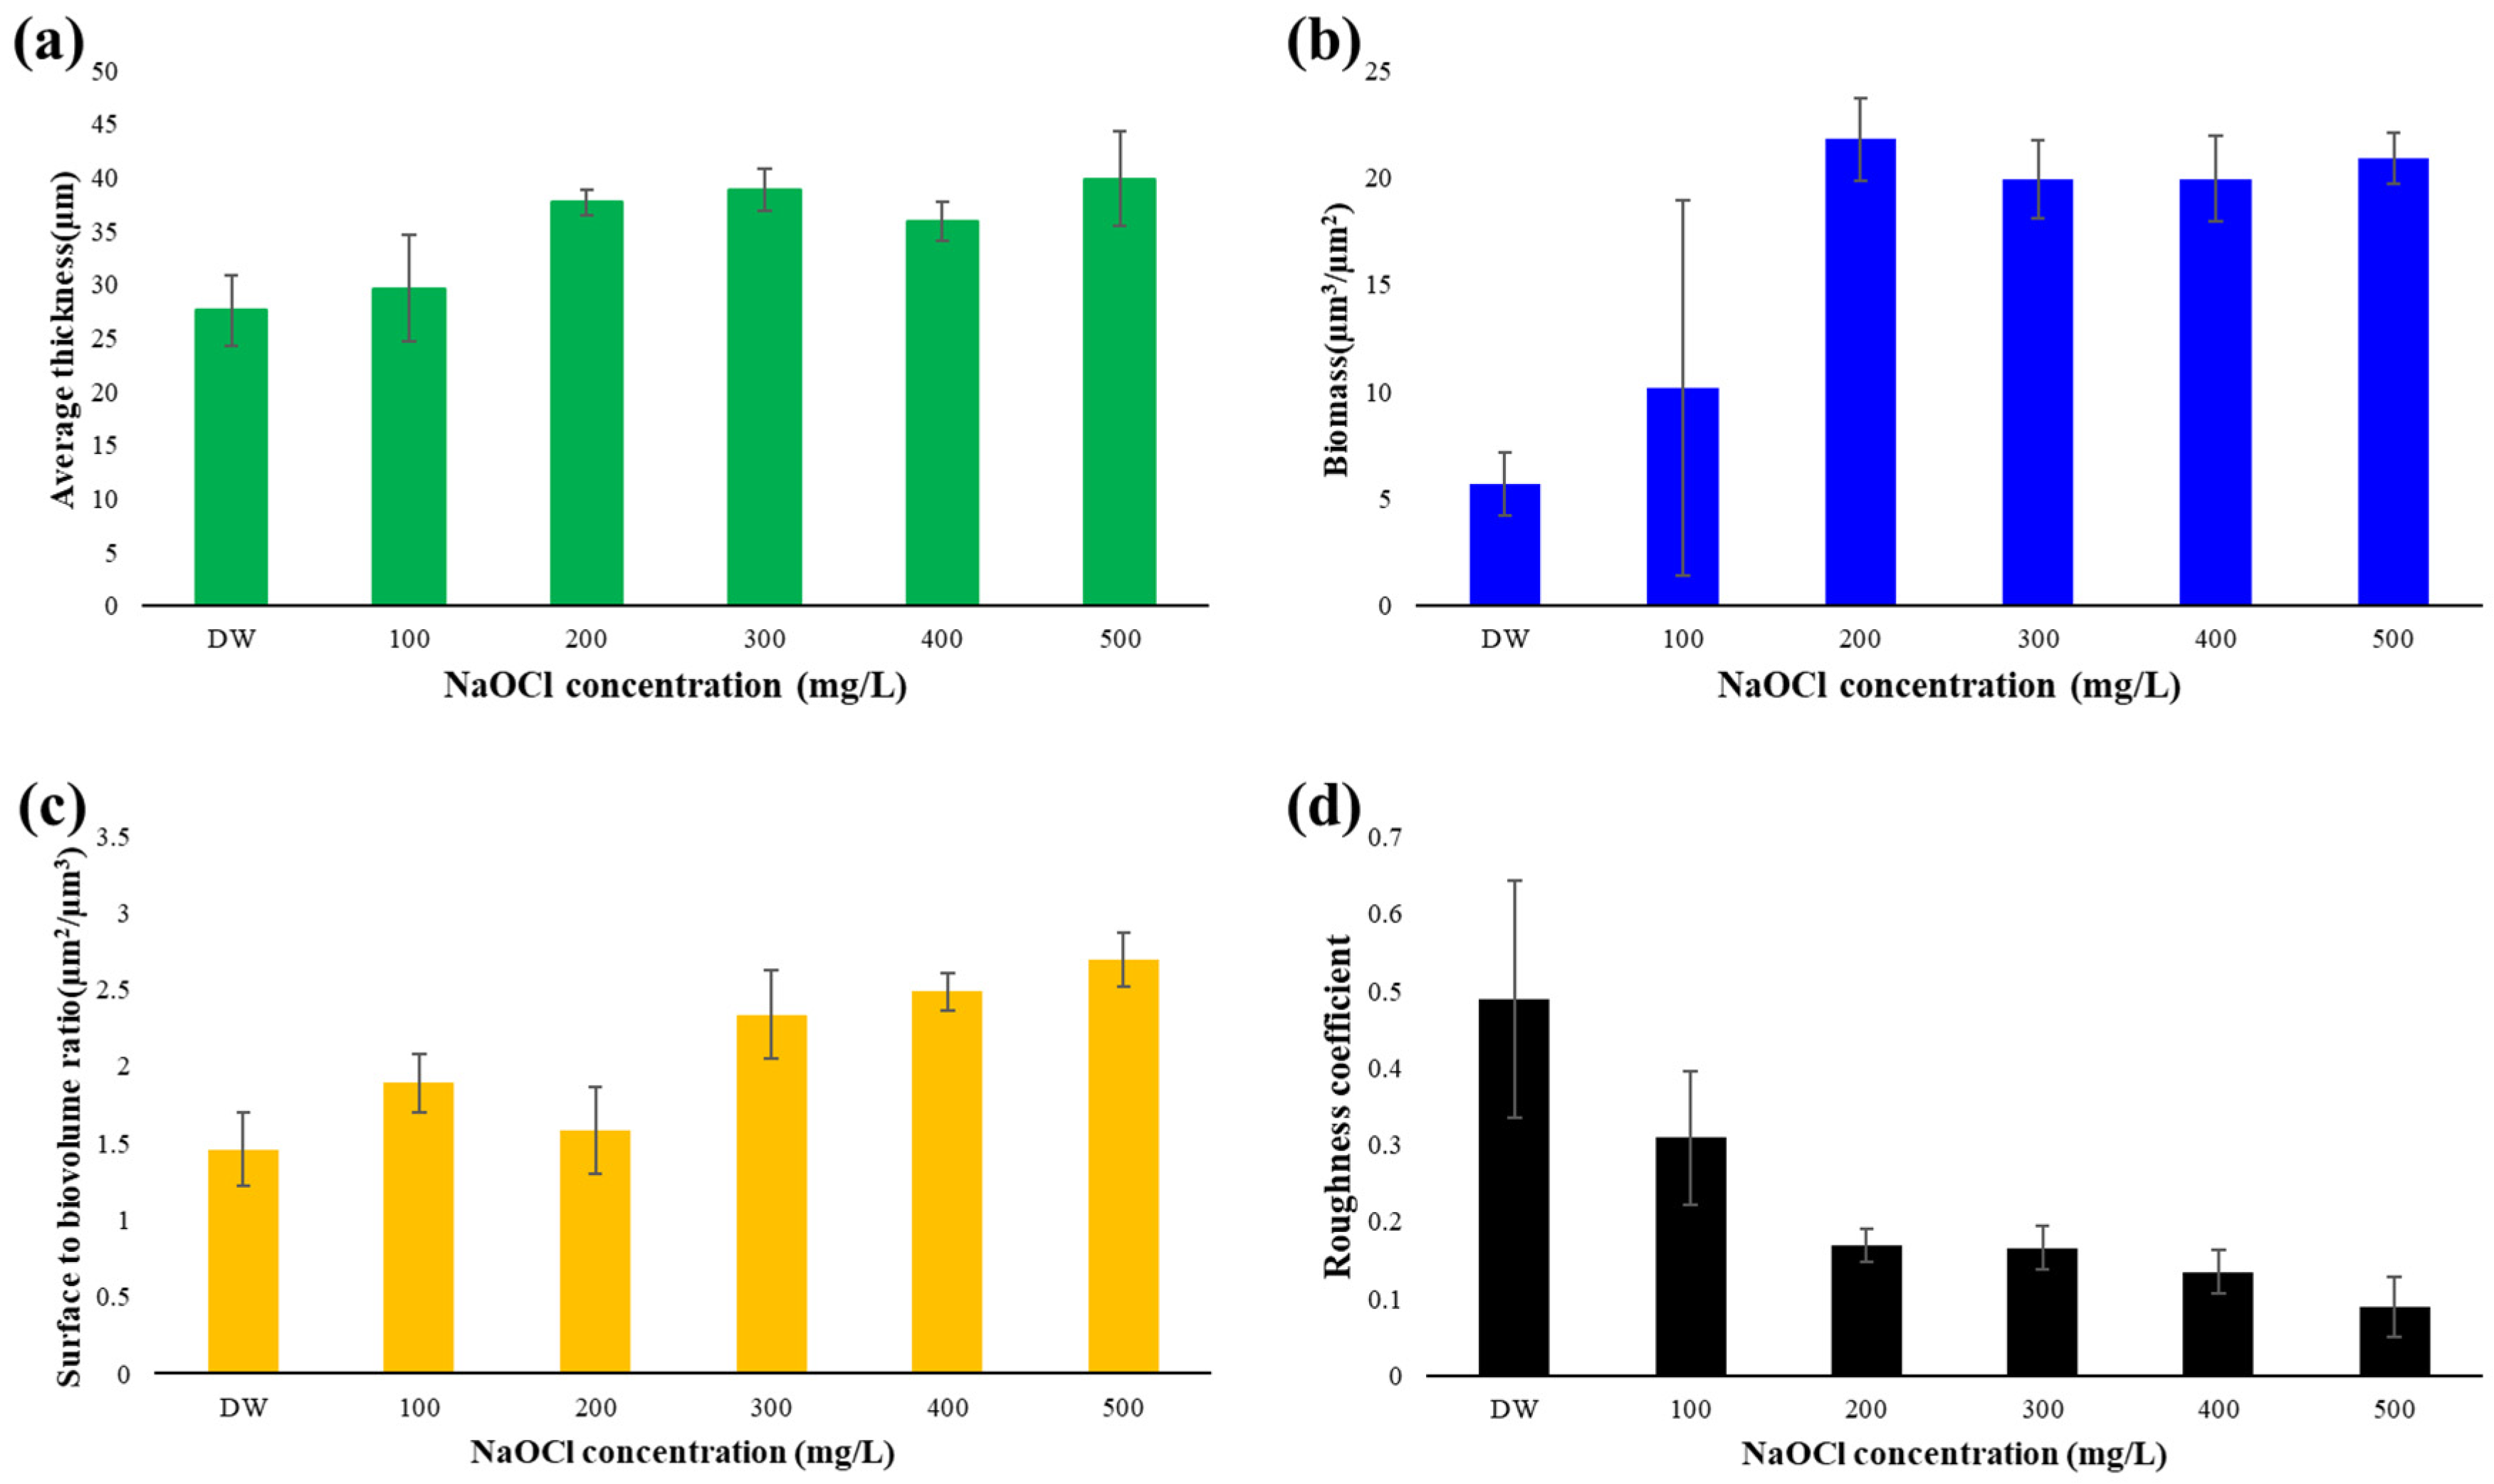
3.4. Surface Coverage Analysis

The images of CDA with DW and 100 and 200 mg/L NaOCl specimens are shown in Figure 6, and the COMSTAT analysis result for all conditions is shown in Figure 7. Dead and live cells were observed in the areas of the membranes that are presumed to be directly affected by backwashing. However, the variations in the regions influenced by backwashing were too diverse to be adequately quantified. Therefore, we prioritize areas outside the direct influence of backwashing to analyze the aggregate impact of microbes distributed on the membrane surface. The selected area presented a very low intensity of dead cell dye in all conditions, resulting in a noise level, so the COMSTAT analysis of the CLSM images was conducted for live cells only.
The black voids in the green biofilm structure in Figure 6a may indicate that microbes exit the biofilm as they disperse, creating pores in the biofilm [31]. In Figure 6b, the voids in Figure 6a were not observed, instead showing an irregular pattern throughout. On the other hand, in Figure 6c, the voids in Figure 6a and the detached biofilm can be observed simultaneously. This may indicate the mechanism of the two-stage backwashing with CDA and NaOCl. At 100 mg/L, NaOCl spread evenly in the CDA-weakened biofilm and no dispersed marks were visible, but at 200 mg/L, the higher NaOCl concentration caused the biofilm to detach and NaOCl preferentially flowed through the already formed channels, making CEB less effective.
The increase in average thickness and biomass with an increment in the NaOCl concentration is shown in Figure 7a,b. This suggests that the NaOCl that passed through the membrane in the backwash spread in the reservoir and acted as oxidation stress. As shown in Figure 7c, the surface-to-biovolume ratio increased with the increment in the NaOCl concentration. The surface-to-biovolume ratio is the proportion of biomass to external contact area, and a larger surface-to-biovolume ratio means more efficient nutrient intake. In nutrient-limited environments, biofilms can morph to increase their surface-to-biovolume ratio. In this research, the increasing surface-to-biovolume ratio in Figure 7c is assumed to be a reaction to recover biofilm after backwashing. The roughness coefficient is represented by a value between 0 and 2 depending on the gap in element thickness compared to the average thickness. As shown in Figure 7d, the roughness coefficient decreased with the increment in the NaOCl concentration. It has been reported that the application of CDA increases the roughness coefficient of biofilm, but the influence of CDA seems to be neutralized by the increasing NaOCl concentration. The decrease in the roughness coefficient indicates a simplification of the biofilm structure. The decrease in the roughness coefficient and the increase in the surface-to-biovolume ratio may suggest that the remaining biofilm is structurally optimized. The structural stabilization and large surface area may be the mechanisms underlying the rapid regeneration of the biofilm after backwashing [27,41].
The cleaning efficiency might be affected by the pH of the solution. The pH of the backwashing reservoir was observed to range from 7.2 to 8.8, corresponding to NaOCl concentrations varying from 100 to 500 mg/L. These pHs were near to the pKa of HOCl, which is 7.53, where the ratio of HOCl to OCl is equal. Outside of this pKa, the ratio changes significantly. It is widely accepted that HOCl is superior to OCl in terms of germicide. Due to its non-polar structure, HOCl can penetrate the cell membrane of microorganisms and attack cells from the inside and outside, resulting in a low CT value for planktonic microbial organisms. The effectiveness of hypochlorous acid (HOCl) and hypochlorous ion (OCl) in the removal of biofilms is controversial. From a cleaning agent perspective, OCl may be more effective. The OCl becomes the dominant species at pH 7.5 and above. Under alkaline conditions, hydroxide ion can dissolve organic foulants and help the mass transfer of OCl, creating a synergistic effect. It has been reported that HOCl is not effective in the removal of organic fouling, while OCl showed a higher removal efficiency for organic matter and P. fluorescens cells attached to Al2O3 solid surfaces at the same free chlorine concentration. Therefore, Fukuzaki (2006) also suggested that the repeated use of HOCl under weak acid conditions and OCl under alkaline conditions would be effective for biofilm control [12].

4. Discussion

In two-stage backwashing, a proportional increase in backwashing efficiency to the increment concentration of NaOCl was not observed, which is due to the complex interaction between factors in the experimental conditions. External stress for the microorganism can interfere with the induction of the dispersion of CDA. Song (2021) showed biofouling inhibition by adding 300 nM CDA and 125 mg/L vanillin as a quorum sensing inhibitor to the influent of MBR. However, adding 2% NaCl to the influent caused salinity stress to the microorganisms, reducing the biofouling inhibition effect from 11.8% to 9% [61]. The increment in the NaOCl dosage was expected to enhance the oxidizing capacity and increase oxidative stress on the microorganisms, which could lead to cell lysis at higher concentrations. Additionally, an increase in pH, resulting from a higher NaOCl dosage, could lead to a greater proportion of hypochlorous ions, affecting the behavior of chlorine. While it can be expected that oxidizing capacity, oxidative stress, and cell lysis can antagonize each other and cause backwash efficiency to fluctuate, the effect of pH is not as simple.
Under the condition with 100 mg/L NaOCl, where the lowest pH was expected, the longest extension of operating time was observed. The biofilm, already dispersed by CDA, reduces EPS, making microorganisms planktonic and susceptible to HOCl. The synergetic effect of CDA and antibiotics indicates that germicidal action alone is sufficient to remove biofilm [26]. Compared to HOCl, OCl, which cannot penetrate cell membranes, may have given planktonic microorganisms more time to respond against oxidizing stress. As the concentration of NaOCl increased, the pH also rose, potentially causing fluctuations in the effectiveness of biofouling reduction. Therefore, when introducing two-stage backwashing for biofouling control, it is expected to be more efficient to perform it under weak acid conditions. The pH variation could be critical for the efficiency of NaOCl backwashing; however, its impact on biofilm dispersion by CDA is likely minimal when the pH level does not interfere with the biological treatment process. This is attributed to the relatively low external stress caused by pH change, which allows CDA to disperse biofilm effectively.
It is notable that the DOC reduction at 300 mg/L is high, which may be attributed to the longer run time during the fifth cycle at 300 mg/L, as shown in Figure 1. This result suggests that organic fouling plays a significant role in membrane fouling under long-term operation, highlighting the importance of organic matter removal over extended periods. Therefore, it is likely that the optimal NaOCl concentration with CDA may vary throughout the operating period.
This study aimed to introduce and evaluate MBR two-stage backwashing using CDA. The cleaning process utilizing CDA is effective in reducing NaOCl consumption, thereby mitigating the risk of membrane damage and minimizing adverse effects on microorganisms. This approach is expected to extend membrane lifespan and ensure stable water quality. Although the current application of CDA is more costly than the NaOCl-based method, the cost is likely to decrease in the future as commercial products are developed for industrial use.

Author Contributions

Conceptualization, S.P. and W.S.; methodology, S.P. and W.S.; investigation, S.P., C.K., Z.J. and J.H.; data curation, S.P.; writing—original draft preparation, S.P.; writing—review and editing, S.P. and J.K.; visualization, S.P.; supervision, J.K. All authors have read and agreed to the published version of the manuscript.

Funding

This work was supported by the National Research Foundation of Korea (NRF) grant funded by the Korea government (MSIT) (No. NRF-2021R1A2C2014255). This research was supported by the Carbon Neutrality Specialized Graduate Program through the Korea Environmental Industry & Technology Institute (KEITI) funded by the Ministry of Environment (MOE) (No. 202401260001).

Institutional Review Board Statement

Not applicable.

Informed Consent Statement

Not applicable.

Data Availability Statement

The data presented in this study are available from the corresponding author upon reasonable request.

Conflicts of Interest

The authors declare no conflicts of interest.

References

  1. Obotey Ezugbe, E.; Rathilal, S. Membrane technologies in wastewater treatment: A review. Membranes 2020, 10, 89. [Google Scholar] [CrossRef] [PubMed]
  2. Turner, S.W.; Rice, J.S.; Nelson, K.D.; Vernon, C.R.; McManamay, R.; Dickson, K.; Marston, L. Comparison of potential drinking water source contamination across one hundred US cities. Nat. Commun. 2021, 12, 7254. [Google Scholar] [CrossRef] [PubMed]
  3. Rahman, T.U.; Roy, H.; Islam, M.R.; Tahmid, M.; Fariha, A.; Mazumder, A.; Tasnim, N.; Pervez, M.N.; Cai, Y.; Naddeo, V. The advancement in membrane bioreactor (MBR) technology toward sustainable industrial wastewater management. Membranes 2023, 13, 181. [Google Scholar] [CrossRef] [PubMed]
  4. Guo, W.; Ngo, H.-H.; Li, J. A mini-review on membrane fouling. Bioresour. Technol. 2012, 122, 27–34. [Google Scholar] [CrossRef] [PubMed]
  5. Nthunya, L.N.; Bopape, M.F.; Mahlangu, O.T.; Mamba, B.B.; Van der Bruggen, B.; Quist-Jensen, C.A.; Richards, H. Fouling, performance and cost analysis of membrane-based water desalination technologies: A critical review. J. Environ. Manag. 2022, 301, 113922. [Google Scholar] [CrossRef] [PubMed]
  6. Komlenic, R. Rethinking the causes of membrane biofouling. Filtr. Sep. 2010, 47, 26–28. [Google Scholar] [CrossRef]
  7. Nguyen, T.; Roddick, F.A.; Fan, L. Biofouling of water treatment membranes: A review of the underlying causes, monitoring techniques and control measures. Membranes 2012, 2, 804–840. [Google Scholar] [CrossRef]
  8. AlSawaftah, N.; Abuwatfa, W.; Darwish, N.; Husseini, G. A comprehensive review on membrane fouling: Mathematical modelling, prediction, diagnosis, and mitigation. Water 2021, 13, 1327. [Google Scholar] [CrossRef]
  9. Shree, P.; Singh, C.K.; Sodhi, K.K.; Surya, J.N.; Singh, D.K. Biofilms: Understanding the structure and contribution towards bacterial resistance in antibiotics. Med. Microecol. 2023, 16, 100084. [Google Scholar] [CrossRef]
  10. Goswami, A.G.; Basu, S.; Banerjee, T.; Shukla, V.K. Biofilm and wound healing: From bench to bedside. Eur. J. Med. Res. 2023, 28, 157. [Google Scholar] [CrossRef]
  11. Wang, Z.; Ma, J.; Tang, C.Y.; Kimura, K.; Wang, Q.; Han, X. Membrane cleaning in membrane bioreactors: A review. J. Membr. Sci. 2014, 468, 276–307. [Google Scholar] [CrossRef]
  12. Fukuzaki, S. Mechanisms of actions of sodium hypochlorite in cleaning and disinfection processes. Biocontrol Sci. 2006, 11, 147–157. [Google Scholar] [CrossRef] [PubMed]
  13. Kimura, K.; Uchida, H. Intensive membrane cleaning for MBRs equipped with flat-sheet ceramic membranes: Controlling negative effects of chemical reagents used for membrane cleaning. Water Res. 2019, 150, 21–28. [Google Scholar] [CrossRef]
  14. Wang, S.; Chew, J.W.; Liu, Y. An environmentally sustainable approach for online chemical cleaning of MBR with activated peroxymonosulfate. J. Membr. Sci. 2020, 600, 117872. [Google Scholar] [CrossRef]
  15. Sedlak, D.L.; von Gunten, U. The chlorine dilemma. Science 2011, 331, 42–43. [Google Scholar] [CrossRef]
  16. Abdullah, S.Z.; Bérubé, P.R. Assessing the effects of sodium hypochlorite exposure on the characteristics of PVDF based membranes. Water Res. 2013, 47, 5392–5399. [Google Scholar] [CrossRef]
  17. Wang, P.; Wang, Z.; Wu, Z.; Zhou, Q.; Yang, D. Effect of hypochlorite cleaning on the physiochemical characteristics of polyvinylidene fluoride membranes. Chem. Eng. J. 2010, 162, 1050–1056. [Google Scholar] [CrossRef]
  18. Kekeç, Ö.; Gökalsın, B.; Karaltı, İ.; Kayhan, F.E.; Sesal, N.C. Effects of chlorine stress on Pseudomonas aeruginosa biofilm and analysis of related gene expressions. Curr. Microbiol. 2016, 73, 228–235. [Google Scholar] [CrossRef]
  19. Lee, E.-J.; Kwon, J.-S.; Park, H.-S.; Ji, W.H.; Kim, H.-S.; Jang, A. Influence of sodium hypochlorite used for chemical enhanced backwashing on biophysical treatment in MBR. Desalination 2013, 316, 104–109. [Google Scholar] [CrossRef]
  20. Deng, Y.; Wu, J.E.; Tao, F.; Zhang, L.-H. Listening to a new language: DSF-based quorum sensing in Gram-negative bacteria. Chem. Rev. 2011, 111, 160–173. [Google Scholar] [CrossRef]
  21. Grandclément, C.; Tannières, M.; Moréra, S.; Dessaux, Y.; Faure, D. Quorum quenching: Role in nature and applied developments. FEMS Microbiol. Rev. 2016, 40, 86–116. [Google Scholar] [CrossRef] [PubMed]
  22. Miller, M.B.; Bassler, B.L. Quorum sensing in bacteria. Annu. Rev. Microbiol. 2001, 55, 165–199. [Google Scholar] [CrossRef] [PubMed]
  23. Bachosz, K.; Vu, M.T.; Nghiem, L.D.; Zdarta, J.; Nguyen, L.N.; Jesionowski, T. Enzyme-based control of membrane biofouling for water and wastewater purification: A comprehensive review. Environ. Technol. Innov. 2022, 25, 102106. [Google Scholar] [CrossRef]
  24. Oh, H.-S.; Lee, C.-H. Origin and evolution of quorum quenching technology for biofouling control in MBRs for wastewater treatment. J. Membr. Sci. 2018, 554, 331–345. [Google Scholar] [CrossRef]
  25. Wells, C.M.; Coleman, E.C.; Yeasmin, R.; Harrison, Z.L.; Kurakula, M.; Baker, D.L.; Bumgardner, J.D.; Fujiwara, T.; Jennings, J.A. Synthesis and characterization of 2-decenoic acid modified chitosan for infection prevention and tissue engineering. Mar. Drugs 2021, 19, 556. [Google Scholar] [CrossRef]
  26. Sepehr, S.; Rahmani-Badi, A.; Babaie-Naiej, H.; Soudi, M.R. Unsaturated fatty acid, cis-2-decenoic acid, in combination with disinfectants or antibiotics removes pre-established biofilms formed by food-related bacteria. PLoS ONE 2014, 9, e101677. [Google Scholar] [CrossRef]
  27. Song, W.; Ryu, J.; Jung, J.; Yu, Y.; Choi, S.; Kweon, J. Dispersive biofilm from membrane bioreactor strains: Effects of diffusible signal factor addition and characterization by dispersion index. Front. Microbiol. 2023, 14, 1211761. [Google Scholar] [CrossRef]
  28. Song, W.; Kim, C.; Lee, J.; Han, J.; Jiang, Z.; Kim, J.; An, S.; Park, Y.; Kweon, J. Low-biofouling membrane bioreactor: Effects of cis-2-Decenoic acid addition on EPS and biofouling mitigation. Chemosphere 2024, 358, 142110. [Google Scholar] [CrossRef]
  29. Fleming, D.; Rumbaugh, K.P. Approaches to dispersing medical biofilms. Microorganisms 2017, 5, 15. [Google Scholar] [CrossRef]
  30. Clinton, A.; Rumbaugh, K.P. Interspecies and interkingdom signaling via quorum signals. Isr. J. Chem. 2016, 56, 265–272. [Google Scholar] [CrossRef]
  31. Kalia, M.; Amari, D.; Davies, D.G.; Sauer, K. cis-DA-dependent dispersion by Pseudomonas aeruginosa biofilm and identification of cis-DA-sensory protein DspS. mBio 2023, 14, e02570-23. [Google Scholar] [CrossRef] [PubMed]
  32. Kunacheva, C.; Stuckey, D.C. Analytical methods for soluble microbial products (SMP) and extracellular polymers (ECP) in wastewater treatment systems: A review. Water Res. 2014, 61, 1–18. [Google Scholar] [CrossRef] [PubMed]
  33. Al-Halbouni, D.; Traber, J.; Lyko, S.; Wintgens, T.; Melin, T.; Tacke, D.; Janot, A.; Dott, W.; Hollender, J. Correlation of EPS content in activated sludge at different sludge retention times with membrane fouling phenomena. Water Res. 2008, 42, 1475–1488. [Google Scholar] [CrossRef] [PubMed]
  34. Frølund, B.; Palmgren, R.; Keiding, K.; Nielsen, P.H. Extraction of extracellular polymers from activated sludge using a cation exchange resin. Water Res. 1996, 30, 1749–1758. [Google Scholar] [CrossRef]
  35. DuBois, M.; Gilles, K.A.; Hamilton, J.K.; Rebers, P.T.; Smith, F. Colorimetric method for determination of sugars and related substances. Anal. Chem. 1956, 28, 350–356. [Google Scholar] [CrossRef]
  36. Li, Y.; Wang, H.; Xu, C.; Sun, S.-H.; Xiao, K.; Huang, X. Two strategies of stubborn biofouling strains surviving from NaClO membrane cleaning: EPS shielding and/or quorum sensing. Sci. Total Environ. 2022, 838, 156421. [Google Scholar] [CrossRef]
  37. Bradford, M.M. A rapid and sensitive method for the quantitation of microgram quantities of protein utilizing the principle of protein-dye binding. Anal. Biochem. 1976, 72, 248–254. [Google Scholar] [CrossRef]
  38. Burton, K. [105] Determination of DNA concentration with diphenylamine. In Methods in Enzymology; Elsevier: Amsterdam, The Netherlands, 1968; Volume 12, pp. 163–166. [Google Scholar]
  39. Sun, M.; Li, W.-W.; Yu, H.-Q.; Harada, H. A novel integrated approach to quantitatively evaluate the efficiency of extracellular polymeric substances (EPS) extraction process. Appl. Microbiol. Biotechnol. 2012, 96, 1577–1585. [Google Scholar] [CrossRef]
  40. Stiefel, P.; Schmidt-Emrich, S.; Maniura-Weber, K.; Ren, Q. Critical aspects of using bacterial cell viability assays with the fluorophores SYTO9 and propidium iodide. BMC Microbiol. 2015, 15, 1–9. [Google Scholar] [CrossRef]
  41. Heydorn, A.; Nielsen, A.T.; Hentzer, M.; Sternberg, C.; Givskov, M.; Ersbøll, B.K.; Molin, S. Quantification of biofilm structures by the novel computer program COMSTAT. Microbiology 2000, 146, 2395–2407. [Google Scholar] [CrossRef]
  42. da Cruz Nizer, W.S.; Inkovskiy, V.; Overhage, J. Surviving reactive chlorine stress: Responses of gram-negative bacteria to hypochlorous acid. Microorganisms 2020, 8, 1220. [Google Scholar] [CrossRef]
  43. Lin, H.; Zhu, X.; Wang, Y.; Yu, X. Effect of sodium hypochlorite on typical biofilms formed in drinking water distribution systems. J. Water Health 2017, 15, 218–227. [Google Scholar] [CrossRef] [PubMed]
  44. Strempel, N.; Nusser, M.; Neidig, A.; Brenner-Weiss, G.; Overhage, J. The oxidative stress agent hypochlorite stimulates c-di-GMP synthesis and biofilm formation in Pseudomonas aeruginosa. Front. Microbiol. 2017, 8, 2311. [Google Scholar] [CrossRef]
  45. Jenal, U.; Reinders, A.; Lori, C. Cyclic di-GMP: Second messenger extraordinaire. Nat. Rev. Microbiol. 2017, 15, 271–284. [Google Scholar] [CrossRef] [PubMed]
  46. Han, X.; Wang, Z.; Chen, M.; Zhang, X.; Tang, C.Y.; Wu, Z. Acute responses of microorganisms from membrane bioreactors in the presence of NaOCl: Protective mechanisms of extracellular polymeric substances. Environ. Sci. Technol. 2017, 51, 3233–3241. [Google Scholar] [CrossRef] [PubMed]
  47. Cai, W.; Han, J.; Zhang, X.; Liu, Y. Formation mechanisms of emerging organic contaminants during on-line membrane cleaning with NaOCl in MBR. J. Hazard. Mater. 2020, 386, 121966. [Google Scholar] [CrossRef]
  48. Chen, W.; Westerhoff, P.; Leenheer, J.A.; Booksh, K. Fluorescence excitation− emission matrix regional integration to quantify spectra for dissolved organic matter. Environ. Sci. Technol. 2003, 37, 5701–5710. [Google Scholar] [CrossRef]
  49. Jacquin, C.; Lesage, G.; Traber, J.; Pronk, W.; Heran, M. Three-dimensional excitation and emission matrix fluorescence (3DEEM) for quick and pseudo-quantitative determination of protein-and humic-like substances in full-scale membrane bioreactor (MBR). Water Res. 2017, 118, 82–92. [Google Scholar] [CrossRef]
  50. Fellman, J.B.; Hood, E.; Spencer, R.G. Fluorescence spectroscopy opens new windows into dissolved organic matter dynamics in freshwater ecosystems: A review. Limnol. Oceanogr. 2010, 55, 2452–2462. [Google Scholar] [CrossRef]
  51. Nilusha, R.T.; Wei, Y. New insights into the microbial diversity of cake layer in yttria composite ceramic tubular membrane in an anaerobic membrane bioreactor (AnMBR). Membranes 2021, 11, 108. [Google Scholar] [CrossRef]
  52. Thejani Nilusha, R.; Wang, T.; Wang, H.; Yu, D.; Zhang, J.; Wei, Y. Optimization of in situ backwashing frequency for stable operation of anaerobic ceramic membrane bioreactor. Processes 2020, 8, 545. [Google Scholar] [CrossRef]
  53. Yoo, S.S.; Chu, K.H.; Choi, I.-H.; Mang, J.S.; Ko, K.B. Operating cost reduction of UF membrane filtration process for drinking water treatment attributed to chemical cleaning optimization. J. Environ. Manag. 2018, 206, 1126–1134. [Google Scholar] [CrossRef] [PubMed]
  54. Yang, X.; Guo, W.; Lee, W. Formation of disinfection byproducts upon chlorine dioxide preoxidation followed by chlorination or chloramination of natural organic matter. Chemosphere 2013, 91, 1477–1485. [Google Scholar] [CrossRef] [PubMed]
  55. Lin, J.-L.; Huang, C.; Wang, W. Effect of cell integrity on algal destabilization by oxidation-assisted coagulation. Sep. Purif. Technol. 2015, 151, 262–268. [Google Scholar] [CrossRef]
  56. Jiang, C.-K.; Tang, X.; Tan, H.; Feng, F.; Xu, Z.-M.; Mahmood, Q.; Zeng, W.; Min, X.-B.; Tang, C.-J. Effect of scrubbing by NaClO backwashing on membrane fouling in anammox MBR. Sci. Total Environ. 2019, 670, 149–157. [Google Scholar] [CrossRef] [PubMed]
  57. Lander, S.M.; Fisher, G.; Everett, B.A.; Tran, P.; Prindle, A. Secreted nucleases reclaim extracellular DNA during biofilm development. npj Biofilms Microbiomes 2024, 10, 103. [Google Scholar] [CrossRef]
  58. Mahto, K.U.; Priyadarshanee, M.; Samantaray, D.P.; Das, S. Bacterial biofilm and extracellular polymeric substances in the treatment of environmental pollutants: Beyond the protective role in survivability. J. Clean. Prod. 2022, 379, 134759. [Google Scholar] [CrossRef]
  59. Flemming, H.-C. EPS—Then and now. Microorganisms 2016, 4, 41. [Google Scholar] [CrossRef]
  60. Flemming, H.-C.; Wingender, J. The biofilm matrix. Nat. Rev. Microbiol. 2010, 8, 623–633. [Google Scholar] [CrossRef]
  61. Song, W. Evaluation of Cis-2-Decenoic Acid and Vanillin as Quorum Sensing Compounds for Biofouling Reduction in Membrane Bioreactor Process. Ph.D. Thesis, Konkuk University, Seoul, Republic of Korea, 2021. [Google Scholar]
Figure 1. Time TMP graph for each two-stage backwashing condition.
Applsci 15 00874 g001
Figure 2. Contour image of F-EEM analysis of bound EPS. The EEM peaks are identified as T1 (tyrosine-like substances), T2 (tryptophan-like substances), A (fulvic acid-like substances), and C (humic acid-like substances). (a) before washing with CDA and DW, (b) after washing with CDA and DW, (c) before washing with CDA and 100 mg/L NaOCl, (d) after washing with CDA and 100 mg/L NaOCl, (e) before washing with CDA and 200 mg/L NaOCl, (f) after washing with CDA and 200 mg/L NaOCl, (g) before washing with CDA and 300 mg/L NaOCl, (h) after washing with CDA and 300 mg/L NaOCl, (i) before washing with CDA and 400 mg/L NaOCl, (j) after washing with CDA and 400 mg/L NaOCl, (k) before washing with CDA and 500 mg/L NaOCl, and (l) after washing with CDA and 500 mg/L NaOCl.
Applsci 15 00874 g002
Figure 3. Reduction in peak intensity in F-EEM analysis.
Applsci 15 00874 g003
Figure 4. F-EEM FRI analysis. (a) The normalized percent fluorescence response distribution (Pi,n) of EEM spectra; (b) variation in Pi,n by two-stage backwashing.
Applsci 15 00874 g004
Figure 5. Comparison of EPS’ extraction from before and after backwashing membrane: (a) polysaccharide reduction rate; (b) protein reduction rate; (c) DOC reduction rate; (d) changes in DNA contents in EPS.
Applsci 15 00874 g005
Figure 6. CLSM images of two-stage backwashed membrane with CDA 300 nM, (a) DW, (b) 100 mg/L NaOCl, and (c) 200 mg/L NaOCl.
Applsci 15 00874 g006
Figure 7. COMSTAT analysis of CLSM image: (a) average thickness, (b) biomass, (c) surface-to-biovolume ratio, and (d) roughness coefficient.
Applsci 15 00874 g007
Table 1. Comparison of advantages and limitations of various backwashing protocols.
ProtocolsAdvantagesLimitations
Hydraulic backwashingLow cost, easy to apply, chemical-freeCannot remove irreversible fouling
Chemical enhanced backwashingLow cost, superior cleaning efficiencyCan cause damage to membrane and microorganism
Two-stage backwashingSuperior cleaning efficiency, reduced dosage of NaOCl, more sustainableComplex to apply, additional cost
Table 2. Composition of synthetic wastewater.
SubstanceConcentration(g/L)
Glucose0.4000
Yeast extract0.0140
BactoTM peptone0.1150
(NH4)2SO40.1048
KH2PO40.0218
MgSO4·7H2O0.0320
FeCl3·6H2O0.0001
CaCl2·2H2O0.0033
MnSO4·5H2O0.0029
NaHCO30.2555
Disclaimer/Publisher’s Note: The statements, opinions and data contained in all publications are solely those of the individual author(s) and contributor(s) and not of MDPI and/or the editor(s). MDPI and/or the editor(s) disclaim responsibility for any injury to people or property resulting from any ideas, methods, instructions or products referred to in the content.

