Featured Application
Through-vial impedance spectroscopy (TVIS) offers a promising process analytical technology (PAT) for industrial freeze-drying. By enabling non-invasive, real-time detection of ice nucleation and solidification dynamics within vials, TVIS can support optimization of cycle design, enhance process robustness, and reduce manufacturing costs in pharmaceutical production. The method is compatible with standard vial arrays and could be implemented at scale to monitor and control critical freezing parameters without disrupting existing workflows.
Abstract
Ice nucleation temperatures and associated ice growth rates are critical parameters in defining the initial ice morphology template, which governs dry layer resistance during sublimation and therefore impacts primary drying kinetics and overall process time. In this study, we developed a through-vial impedance spectroscopy (TVIS) method to determine both ice nucleation temperature and average ice growth rate, from which future estimation of average ice crystal size may be possible. Whereas previous TVIS applications were limited to solutions containing simple, uncharged solutes such as sugars, our adapted approach enables the analysis of conductive solutions (5% sucrose with 0%, 0.26%, and 0.55% NaCl), covering osmolarities below and above isotonicity. We established that the real part capacitance at low and high frequencies—either side of the dielectric relaxation of ice—provides the following: (i) a temperature-sensitive parameter for detecting the onset of ice formation, and (ii) a temperature-insensitive parameter for determining the end of the ice growth phase (unaffected by temperature changes in the frozen solution). This expanded capability demonstrates the potential of TVIS as a process analytical technology (PAT) for non-invasive, in situ monitoring of freezing dynamics in pharmaceutical freeze-drying.
1. Introduction
Over the past few decades, there has been a significant positive trend in the growth of biopharmaceutical products. Many of these products are intrinsically unstable in aqueous solution and are therefore freeze-dried (lyophilized) to deliver an acceptable shelf life. Despite its benefits, freeze-drying is known to have high manufacturing costs in terms of the energy consumed by the process and by the HVAC system servicing the GMP footprint for the dryer. The freeze-drying process involves a series of interconnected steps. It begins with freezing (optionally followed by annealing) and then the primary drying stage, where ice is sublimated under partial vacuum at sub-zero temperatures. Finally, in the secondary drying stage, water from the non-ice fraction is desorbed under reduced pressure but at moderate temperatures, typically above room temperature.
It is the primary drying stage that is the most energy-intensive and prolonged, owing to (i) the low temperatures employed for ice sublimation, which reduce the driving force for sublimation, and (ii) the resistance imposed by the porous dry layer that forms above the ice: Water vapor must diffuse through this layer before it can exit the vial, further contributing to the slow rate of sublimation.
This resistance to vapor flow (associated with the dry layer porosity) is largely defined in the freezing stage, whereby ice formation at low temperatures is expected to result in the formation of small ice crystals and hence provide a reduced dry layer porosity and therefore a high resistance to vapor flow. The exact relationships between the freezing process and the subsequent drying behavior have been reported in several publications [1,2,3], while a number of controlled nucleation approaches have emerged, which attempt to modulate/reduce the dry layer resistance [4,5,6]. Despite these developments, thermocouples are still commonly used to measure nucleation temperature. However, it is well known that their presence alters ice formation by introducing additional nucleation sites, from which ice crystals develop. Although ice nucleation is a stochastic process, the vial containing the temperature sensor generally nucleates at a higher temperature compared to the vial having the sensor on the external surface of the vial [7]. It is well documented that vials equipped with thermocouples tend to nucleate at higher temperatures, indicating a lower degree of supercooling compared to sensor-free vials. The reason is that higher nucleation temperatures reduce the thermodynamic driving force for nucleation and result in fewer stable nuclei. However, once nucleation occurs, the growth of these nuclei is primarily limited by the diffusion of water molecules toward the ice front. Because diffusion is faster at higher temperatures, these fewer nuclei can grow more extensively, producing fewer but larger ice crystals.
Fewer, larger ice crystals result in a more porous dried matrix and thus reduced resistance to water vapor flow, and as a result, such vials generally dry more quickly. This potential bias affects experimental studies that rely on thermocouples, as the sensors may inadvertently alter the very process they aim to monitor [8].
For this reason, several in-line non-invasive techniques have been developed for monitoring the product temperature during the freeze-drying cycle. One of the earlier examples was a thin film of thermocouple metal sputtered on the outside surface of the glass vial to infer the product temperature, including the nucleation temperature [9,10]. More recently, a method for predicting average ice crystal sizes has been developed based on a thermal imaging camera for tracking the growth rate of the ice layer and the temperature distribution across the ice mass [11]. However, this technology requires a line of sight to the side of the glass vial and so is only applicable to edge vials and cannot be applied to most vials without disturbing the vial array. Finally, through-vial impedance spectroscopy (TVIS) might be another promising technology that could assist in the development process by measuring the in situ behavior of the product formulation [12].
The application of TVIS for determining the characteristics of the ice formation process was first described in [13]. This TVIS approach is based on the transition between two dielectric mechanisms as the liquid changes to a solid. The dielectric process observed for the liquid state is a Maxwell–Wagner (MW) process in which the glass wall of the vial is charged through the solution resistance, whereas the dielectric process observed in the frozen state is due to the relaxation of ice. Those TVIS studies undertaken to date, for the determination of ice formation, have been restricted to water and simple solutions of solutes that have relatively low electrolytic conductivities [14,15,16,17,18]. In the more conductive solutions that would be typically encountered in real product formulations, one would expect the peak of the Maxwell–Wagner process to be on the high frequency side of the experimental frequency range provided by the current TVIS technology (i.e., >1 MHz) and hence ‘out of view’. The determination of the onset of ice nucleation from changes in the dielectric loss peak frequency and/or peak amplitude of the Maxwell–Wagner process ( and , respectively) would not be possible. Instead, there might be opportunities to determine the nucleation onset temperature from tracking the real part capacitance at frequencies on either side of the dielectric relaxation of ice, e.g., 10 Hz and 100 kHz. Our nomenclature for these latter two parameters is and . There is an indication from our previous publication [13] that the high-frequency real part capacitance is useful for the determination of the end of ice formation, given the relative insensitivity of the dielectric permittivity of ice to temperature at these frequencies. Conversely, the low-frequency side of the ice relaxation will be sensitive to temperature changes and hence might prove useful for the determination of the onset of ice formation.
The aim of this work is to further develop the TVIS approach so that it is possible to characterize the ice formation process in solutions with conductivities that are representative of those one might encounter in an isotonic solution. Three solutions were selected to span a range of osmolarities from below to the upper end of the isotonic range (270–328 mOsm L−1, according to Nema and Ludwig [19]). These were (1) 5% w/v sucrose (139 mOsm L−1); (2) 5% w/v sucrose with 0.26% w/v NaCl (227 mOsm L−1); and (3) 5% w/v sucrose with 0.55% w/v NaCl (327 mOsm L−1). This study aims to determine which of the four TVIS parameters (, , or ) are best suited for the determination of (a) ice nucleation and (b) solidification endpoint, and then use those parameters to estimate the in-vial nucleation temperature and the ice solidification time (and hence, average ice growth rate).
The study reports, for the first time, an additional TVIS process arising from the relaxation of the interfacial capacitance mediated by ion charge transfer across the glass–solution interface. Whereas the Maxwell–Wagner relaxation arises from field-driven accumulation of mobile ions at the solution-glass interface—without any net charge transfer—the newly observed interfacial capacitance relaxation likely stems from slower, resistive ion exchange or adsorption processes involving sodium ions and the negatively charged glass surface. This introduces a distinct time constant governed by the product of interfacial capacitance and charge transfer resistance, which differs mechanistically and spectrally from the MW process.
The limited observations made on 0.26% and 0.55% NaCl suggest that for solutions with moderate to low conductivity, the peak of this IC relaxation will occur at frequencies below the lower limit of the current TVIS instrumentation; therefore, this new process does not offer an alternative to the characterization of the ice formation process in conductive solutions. For salt-containing solutions, we again observed the parameter increases at ice onset, but our new observation is that does not immediately change. This is likely because the MW remains dominant at high frequencies during this phase, masking the dielectric contribution of the growing ice phase. Only as the MW relaxation shifts to lower frequencies—when cooling resumes—does begin to decrease. Our proposal is that the increase in may be used as a universal indicator of ice onset, and that the point when reaches a plateau may be used as a universal indicator of the end of ice solidification.
Although the current study focused on NaCl as a model salt, we recognize that in real-world formulations, sugars like sucrose are frequently combined with additional excipients such as calcium chloride, sodium sulfate, or phosphate buffers. These combinations not only influence freezing point depression but also affect the glass transition temperature () of the freeze-concentrated matrix, which has critical implications for drying protocol design. In addition, salts with higher van ’t Hoff factors (e.g., CaCl2, Na3PO4) can lead to complex non-ideal behavior, in which no longer follows linear trends with solute molality. TVIS offers a valuable tool to investigate such effects in future studies, particularly for formulations approaching the operational limits of commercial freeze-dryers.
2. Materials and Methods
2.1. Preparations
Sucrose (Sigma-Aldrich, St. Louis, MO, USA) and sodium chloride (Fisher Scientific, Waltham, MA, USA) were accurately weighed and dissolved in ultrapure water (which is water that has a resistivity at source of 18.2 MΩ cm) to obtain the solutions having sugar to total solid weight ratios of 1.00, 0.95, and 0.90 (Table 1).

Table 1.
Codes for the three solution compositions.
2.2. Vial Filling and Loading the Freeze-Dryer
First, 3.6 g aliquots of each solution (S-1, S-2, and S-3, Table 1) were transferred to three Type 1 clear glass tubing vials (1096936, Schott AG, Mainz, Germany supplied as VC010-20C, Adelphi-HP) and three TVIS vials. The TVIS vials were the same Type 1 clear glass tubing vials but modified with a pair of copper electrodes (formed from copper adhesive tape 1181 3MTM) attached to the external surface of the vial. The electrodes have height-by-width dimensions of 10 × 19 mm and were positioned opposite one another and at a height of 3 mm above the base of the vial (Figure 1). The fill weight of 3.6 g gives a solution meniscus height of 7 mm from the lower edge of the electrode, which corresponds to a fill factor () of 0.7, where is defined as the relative height of the sample solution within the electrode region to the height of the electrode, as shown in Figure 1.
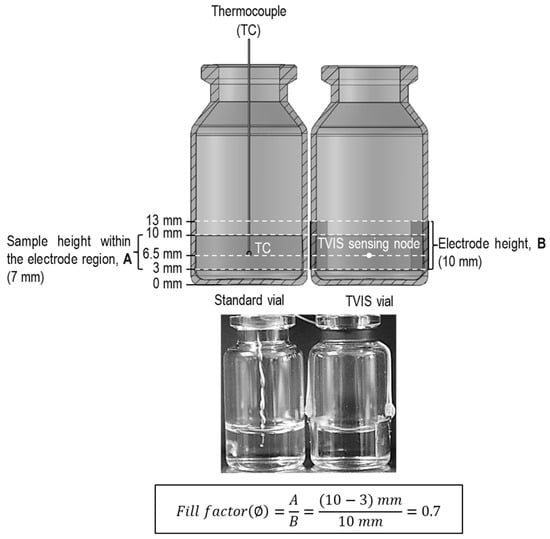
Figure 1.
Schematic vertical cross-section (top image) and photographs (bottom image) of two vials containing 3.6 g of sucrose–salt solution. Right: A modified TVIS vial attached with a pair of copper electrodes (19 × 10 mm), positioned at 3 mm from the external base of the vial (≈2 mm from the internal base of the vial). Left: A standard vial (10 mL nominal capacity) with a type-T thermocouple inserted into the solution. The fill factor (∅) shown here is 0.7, which means that the sample height in the electrode region is 7 mm for an electrode height of 10 mm.
The vials themselves had a nominal external diameter of 24 mm, with a manufacturer-specified tolerance of ±0.2 mm. Liquid fill weights were controlled to 3.60 g ± 0.01 g, corresponding to a consistent meniscus height of ~7 mm within the electrode region, giving a fill factor of 0.70 ± 0.01. Given the direct proportionality between the measured capacitance and the liquid height within the electrode gap, the expected variation in the capacitance signal attributable to fill height was estimated at ±1.7%. However, the absolute magnitude of capacitance is not the focus of this study. Unlike conventional dielectric spectroscopy—which aims to extract dielectric permittivity via division by a known cell constant—TVIS is used here to detect qualitative features in the signal over time, such as inflections and transitions. These temporal features are used to identify phase changes and are interpreted in conjunction with synchronized temperature data from the nearest-neighbor thermocouple vials under conditions where both vials remain in the same physical state (either liquid or frozen).
The thermocouple sensor bead was positioned at a height corresponding to that of the TVIS sensing node (or simply the TVIS node), i.e., where the mean TVIS-derived temperature is determined. In this case, the TVIS node is at a height of 6.5 mm from the external base of the vial, with its position being calculated from half the 7 mm sample height that extends into the electrode region (7/2 = 3.5 mm) plus the height of the position of the lower edge of the electrode (3 mm). The unmodified nearest vial (left) is used to infer/predict the product temperature in the neighboring TVIS vial.
Each nearest-neighbor vial containing the sample solution had a T-type thermocouple wire (28 AWG) inserted through the drilled rubber stopper to measure the temperature of each sample. The sensor tip was positioned at the midpoint of the sample within the electrode region, corresponding to the height of the TVIS sensing node, as shown in Figure 1. The position of the thermocouple tip was manipulated and adjusted carefully by eye.
The temperature correlation relies on the assumption that the thermocouple in the adjacent vial measures a representative temperature of the liquid mass probed by the TVIS electrodes. As the sensor tip was positioned at the midpoint of the electrode height (6.5 mm above the vial base), it is expected to approximate the average temperature of the monitored volume. Previous work in modeling the equivalent circuit behavior of sub-segments of the frozen mass within the electrode region suggests that the peak frequency of the ice relaxation is indeed a function of the average temperature of the frozen mass [20].
Another 154 vials were filled with 3.6 g of 18.2 MΩ·cm water, and then all 160 vials, including the 6 solution-filled vials, were arranged on the loading tray according to the layout in Figure 2a. These were then partly closed with 20 mm 4023/50 grey bromobutyl rubber stoppers (FDW20RTS, West Pharmaceutical Services Singapore Pte. Ltd., Singapore) before being loaded into a VirTis Advantage Plus XL benchtop freeze-dryer (SP Scientific, Warminster, PA, USA).
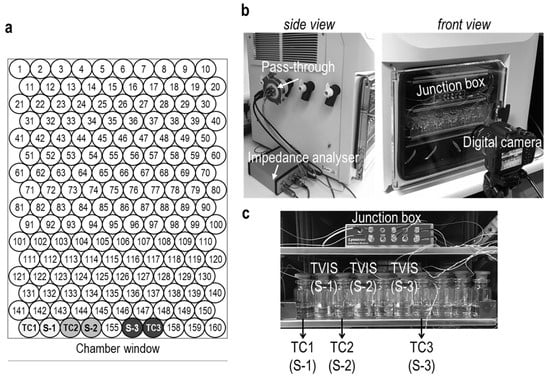
Figure 2.
(a) Arrangement of vials on the shelf of the Virtis Advantage Plus XL benchtop freeze-dryer. Three thermocouple-containing vials (labelled TC1, TC2, and TC3) and the three TVIS vials (labelled S-1, S-2, and S-3) were placed in the first row adjacent to the chamber window. The other vials with the numbered position on the shelf were filled with ultrapure water. (b) The Virtis Advantage Plus freeze-dryer equipped with a TVIS system comprises a five-channel TVIS junction box inside the freeze-dryer and an impedance analyzer outside the freeze-dryer. The signal from the junction box is sent and received via the pass-through installed on the manifold hose of the Virtis Advantage Plus XL freeze-dryer. A digital camera was set to observe the nucleation event of the sample-filled vials. (c) The image demonstrates the position of thermocouple vials and TVIS vials containing each sample solution positioned on the freeze-dryer shelf.
2.3. Freezing Protocol
All vials were equilibrated at a shelf temperature of 20 °C for 30 min before cooling to −45 °C at a rate of 0.5 °C·min−1. Once the shelf temperature had reached −45 °C, the shelf was held at −45 °C for 2 h (Table 2).

Table 2.
Freezing protocol.
2.4. Image Analysis
Photographs were taken every 2 min by a digital camera (Canon E550D connected to a laptop, Canon, Tokyo, Japan) using the time-lapse function provided by the Canon EOS utility software v3. The 2 min measurement interval means that each image is synchronized with the start of the sequence of the TVIS measurements on the three sucrose solutions. We assume that one photographic image relates to all three spectra and hence, there is a maximum time lag of up to 30 s (i.e., 3 × 10 s) between when the image is acquired and the last spectrum in the sequence is recorded. Each image was then analyzed using a Java-based image processing software (ImageJ software v152r) as described in the Results Section 3.2.
2.5. Through-Vial Impedance Spectroscopy
A multichannel impedance analyzer developed by De Montfort University was used to measure the impedance spectra of the three TVIS vials containing 5% sucrose and either 0%, 0.26%, or 0.55% sodium chloride. Each TVIS vial was connected to a bespoke 5-channel impedance analyzer located outside the freeze-dryer, via a junction box placed on the shelf inside the freeze-dryer, and an electrical pass-through attached to one of the manifold ports on the side of the dryer (Figure 2).
More detail on the TVIS measurement system is provided by Smith and Polygalov [12]. The electrical capacitance spectra of each sample were measured within the TVIS vials over the frequency range of 10 Hz to 1 MHz, with a scan interval of 2 min. Each TVIS spectrum takes 10 s to acquire, and there are three spectra recorded in a sequence (starting with the TVIS vial containing the 5% sucrose solution and ending with the TVIS vial containing the 5% sucrose solution containing 0.55% NaCl).
3. Results
Before analyzing the spectra acquired by the TVIS system, the following sections address the information provided by the photographic evidence (including the image analysis of the solidification process) and the data recorded by the thermocouple probes.
3.1. Ice Nucleation
Visual inspection of the photographic images, contrasting the TC vials and the TVIS vials, demonstrates unequivocally that ice nucleation started earlier in the TC-containing vial for all three solutions (Figure 3). This result was anticipated, as the sensor introduces additional sites for the nucleation of ice.
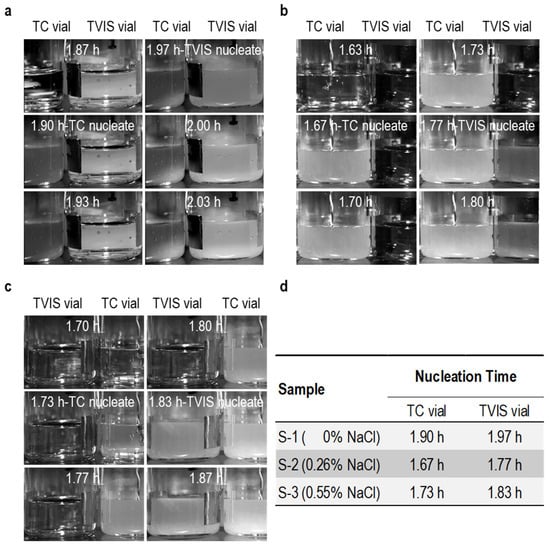
Figure 3.
Visual evidence of nucleation in sucrose–salt solution captured by time-lapse photography, (a) 5% sucrose solution, (b) 5% sucrose with 0.26% NaCl, (c) 5% sucrose with 0.55% NaCl (d) Table providing the nucleation times for the three solutions, as recorded by visual observations and observations of the inflections in TVIS parameters.
The visual observation of the onset of ice formation in the TC-containing vials is also synchronized with the spike in the temperature recorded by the thermocouple in each vial (Figure 4). This well-known, dramatic rise in temperature is a result of the rapid release of the latent heat of crystallization coupled to poor dissipation of heat resulting from the restrictions on heat flow through the base of the vial. For a short period of time, the temperature stabilizes at some maximum temperature () that is just below the freezing point of the original solution. This elevated temperature then continues, while the rate of heat generated from the exothermic process of ice formation exceeds the rate of heat transfer out of the vial and to the shelf. We refer to this period as , which decreases from 18 min to 8 min and then 6 min as the salt concentration is increased from 0% to 0.26% and 0.55%.
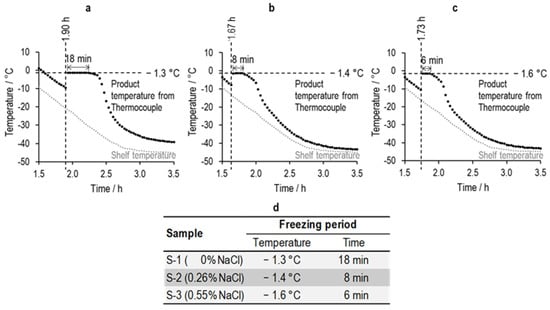
Figure 4.
(a–c) The shelf temperature profile plotted alongside the individual profiles of thermocouples in the nearest-neighbor vials to the corresponding TVIS vial during the freezing of sucrose–salt solutions; (d) the time duration during which the thermocouple temperature reaches a maximum.
As the rate of ice formation, and therefore the rate at which heat is generated, slows down, the temperature in the vial has a chance to start cooling once more and reach thermal equilibrium with the shelf. The result is that the temperature in the vial has a time profile that gets closer to, but never touches or crosses, the profile of the shelf temperature. The reason why it never achieves the same temperature as the shelf is that the vial is insulated, in part, from the shelf by the air gap (cavity) beneath the vial (owing to its concave base) and so will always be a few degrees higher than the temperature of the shelf. Moreover, the time it takes for the temperature to come to an equilibrium with the shelf and its surroundings is a function of the amount of heat that is released and, therefore, the amount of ice that forms.
3.2. Image Analysis
We used two methods to analyze the images acquired by the digital camera. The first method was developed to assess the onset and endpoint of ice solidification, and the second was to determine the height of the frozen mass at the end of the solidification process.
3.2.1. Method 1—Onset and Endpoint of Ice Formation
To quantify the onset and progression of ice formation, images were analyzed by transforming pixel data into numerical intensity values. The region of interest (ROI), excluding the electrode, was selected to encompass the frozen mass (Figure 5). For each image, the average pixel intensity was calculated along vertical pixel lines at each horizontal position across the ROI. Since ice appears more opaque than the liquid solution, it produces higher pixel intensity values.

Figure 5.
Illustration of the ROI region of interest (area within the rectangle) for each sample: (a) 5% w/v sucrose solution (S-1), (b) 5% w/v sucrose with 0.26% w/v NaCl (S-2), (c) 5% w/v sucrose with 0.55% w/v NaCl (S-3).
ImageJ software was used to extract these intensity values, allowing the construction of plots showing the mean vertical intensity across the width of the ROI for three samples (the intensity value for the middle line on the ROI was also determined). The first set of intensity profiles is shown for the time period up to the onset of ice formation (Figure 6). Before ice nucleation, the profiles are erratic with multiple spikes (largely due to specular reflections from the glass surface), then at the point of ice nucleation, when the image becomes translucent as ice nuclei are seeded across the entire liquid volume, the profile jumps to higher intensity values that become more consistent across the image.
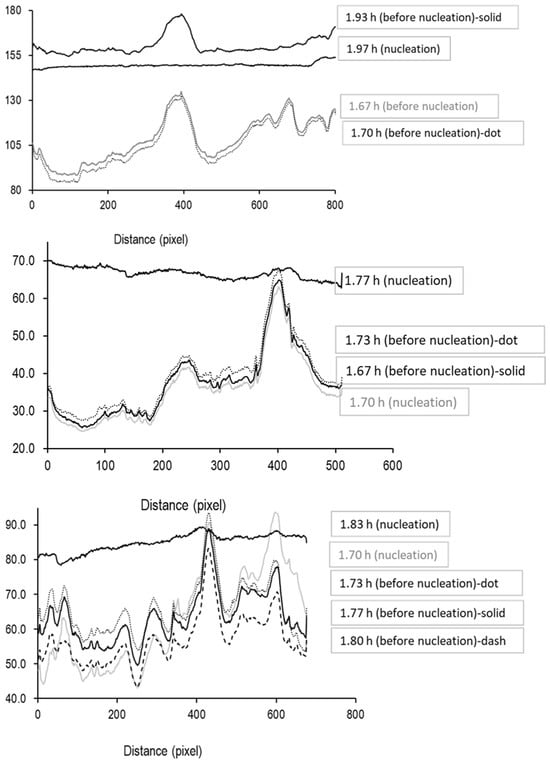
Figure 6.
Profiles of average pixel intensity in the vertical direction (arbitrary units) across the region of interest highlighted in Figure 5, with the x-axis showing the pixel number in the horizontal direction.
An ice layer then develops in the coldest region (i.e., at the bottom), which then grows up the liquid, causing the intensity values to increase as the area becomes less translucent (see Figure 7, Figure 8 and Figure 9). Then, at some point, the values plateau, indicating the endpoint of ice formation. Any changes in temperature beyond this point are unlikely to have any impact, as the image is largely defined by the refractive index of the material, which has very little temperature dependency.
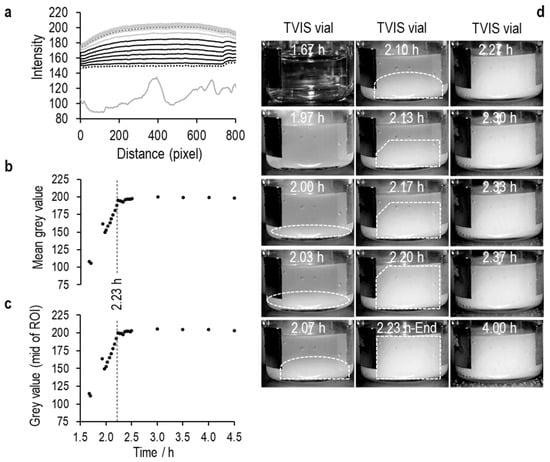
Figure 7.
Solidification of 5% sucrose.
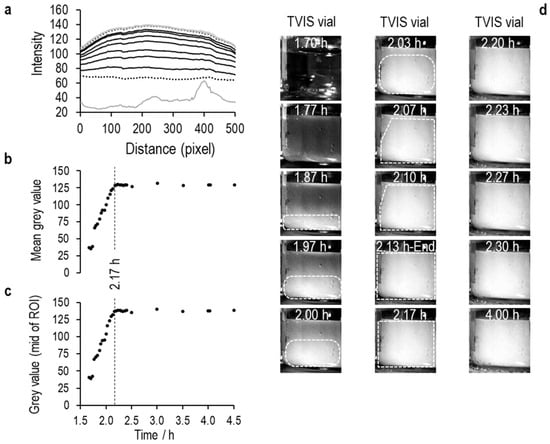
Figure 8.
Solidification of 5% w/v sucrose with 0.26% w/v NaCl.
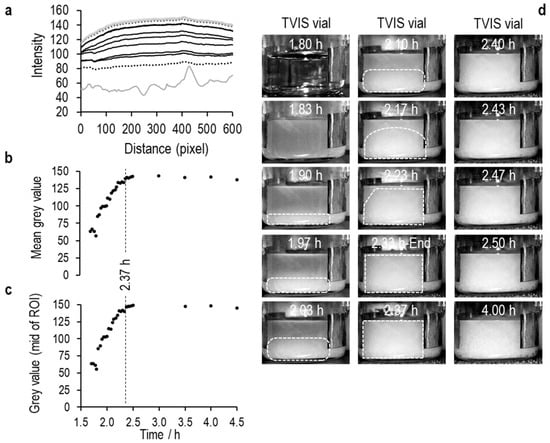
Figure 9.
Solidification of 5% w/v sucrose with 0.55% w/v NaCl.
The endpoints of ice formation for each of the three solutions are marked by the vertical dotted lines on Figure 7b,c, Figure 8b,c, and Figure 9b,c. These values, along with those for the onset of ice nucleation, are given in Table 3.

Table 3.
Ice nucleation time and ice solidification endpoint determined by image analysis.
In the Figure 7, Figure 8 and Figure 9 that follow, (a) is the average pixel intensity in the vertical direction of the image plotted on the y-scale as a function of x-scale position across the image. Each line represents a new image acquired at each point in time during the freezing of ice. The lowest solid grey line is in the liquid state, the lowest black dotted line in the first image in which the opacity from ice nucleation characterizes the image, and thereafter, the black lines follow the increase in pixel intensity as the ice front moves up the vials, until the next grey line marks the end of ice solidification, with the highest dotted line being the end of the image acquisition period; (b) Is the average value for each line as a function of time; (c) Is the middle value of the pixel intensity as a function of time, and (d) are a selection of images every 2 min through the ice formation process.
3.2.2. Method 2—Height of the Frozen Mass at the End of the Freezing Stage
The second image analysis method was to determine the thickness of the frozen mass at the end of the freezing stage, according to the following method. Here, those images from the three TVIS vials at 4 h into the process (i.e., late in the freezing stage) were selected; a scale was set using a known length given by the electrode height of 10 mm and then a measurement at five different positions was taken for each image (Figure 10), and the results of five measurements were averaged to give the estimated frozen thickness (in mm).
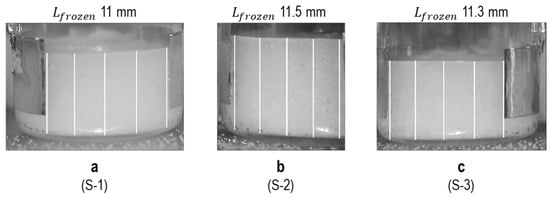
Figure 10.
Example images demonstrating the selection of 5 equally spaced lines on the images acquired at 4 h into the freezing process: (a) 5% w/v sucrose solution (S-1), (b) 5% w/v sucrose with 0.26% w/v NaCl (S-2), (c) 5% w/v sucrose with 0.55% w/v NaCl (S-3).
3.3. TVIS Results
The TVIS system measures the composite impedance of the TVIS vial and its contents across the frequency range 10 Hz to 1 MHz and displays it in the format of the real part capacitance (dielectric permittivity) spectrum and the imaginary part capacitance (dielectric loss) spectrum. Example spectra are shown in Figure 11 for all three solutions at two temperatures, +20 °C and −20 °C, in order to illustrate the various dielectric processes that are observed in the liquid and frozen states.
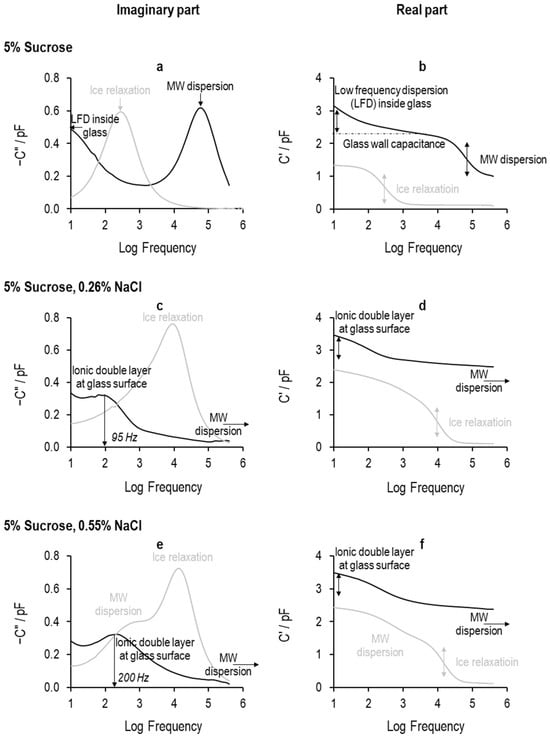
Figure 11.
The TVIS response (real part and imaginary part capacitance) of 5% sucrose with different salt concentrations at +20 °C (liquid state: black line) and −40 °C (frozen state: grey line): (a,b) 0% NaCl, (c,d) 0.26% NaCl, (e,f) 0.55% NaCl.
3.4. Qualitative Analysis of the TVIS Spectra
Before developing a method for quantifying the principal attributes of the ice formation process, and largely for the benefit of those who are unfamiliar with the principles of impedance/dielectric spectroscopy, we shall make some statements on the general observations that can be made concerning the characteristics of the TVIS spectrum as a function of the following:
- (i)
- The solution conductivity, i.e., whether the sucrose solution has salt added (in concentrations of 0.26% and 0.55%) or not;
- (ii)
- The physical state of the solution, i.e., whether the solution is in a stable liquid state or is transitioning to the frozen state.
To this end, we selected example spectra for the TVIS vial containing either the 5% sucrose solution or the 5% sucrose solution containing 0.26% and 0.55% NaCl, which have been acquired at two temperatures: +20 °C when the temperature is constant and the solution is a stable liquid state (see spectra in black), and −20 °C as the temperature changes during the ramp down and the solution is in the process of freezing (see spectra in grey) (Figure 11). Any relaxation process observable in this range is witnessed by a peak in the imaginary part capacitance spectrum (see graphs to the left side of the figure) and a step in the real part capacitance (see graphs to the right side of the figure).
The response from the TVIS vial containing 5% sucrose in the liquid state appears to be quite different from that when the salt is added to the solution; compare the spectra marked by black lines in each real and imaginary plot in Figure 11 (Figure 11a,b are for the pure 5% sucrose solution, and Figure 11c–f are for the 5% sucrose solution with 0.25% and 0.5%). The 5% sucrose solution has a large peak towards the high-frequency end of the imaginary part spectrum and in what appears to be part of another process at the low-frequency end of the spectrum (Figure 11a). The peak in the imaginary part spectrum is mirrored by the step in the real part spectrum (Figure 11b), whereas the salt-loaded solutions have a smaller peak at low frequency that is partially merging with another process at the very low frequency side of this relaxation. These differences are simply because the various relaxation processes occur at different frequencies depending on the physical state and composition of the solutions, as we shall now discuss.
3.5. The Maxwell–Wagner Process of Solutions in the Liquid State
For the 5% sucrose solution, the observable relaxation between 10 kHz and 1 MHz (i.e., log frequency between 4 and 6; Figure 11a,b) is attributed to interfacial polarization, also known as Maxwell–Wagner or space-charge polarization. In this process, mobile ions in the conductive solution accumulate at the interface with the insulating glass wall, forming a charge separation across the interface. Depending on the solution composition, these mobile charges may originate from the sodium and chloride ions from the added salt, any trace ionic impurities from the sucrose powder, and the proton transfer between water molecules that is responsible for the conductivity of ultrapure water. Clearly, the overall conductivity is due to the dominant species, such that the conductivity of the sucrose–salt solutions is largely attributed to the added salt, the conductivity of the sucrose solution is largely due to impurities in sucrose, and the conductivity of pure water is due to the Grotthus mechanism. However, in reality, even nanopure water inside the glass TVIS vial will soak up ions from the glass, so its conductivity will, in effect, be dominated by these ionic impurities.
The rate of polarization is governed by the resistance of the solution and the effective interfacial capacitance, with the time constant for this process ( in seconds) and hence the relaxation frequency ( in units of hertz) being given by
where and are the electrical resistance and capacitance of the solution, and is the capacitance of the glass wall of the vial () in a series combination with the interfacial capacitance ) that results from the build-up of ionic charge. The relaxation frequency is the frequency at which the imaginary part of the impedance (or the phase shift) peaks.
While the solution is cooled, it is the electrical resistance that changes (increases) to a larger degree than any change in the electrical capacitance, and hence, the relaxation frequency decreases as the temperature of the solution is lowered.
Summary: The description of MW relaxation aligns with prior studies in which we have demonstrated the temperature dependence and frequency position of the MW process in aqueous sucrose systems [12,14]. Here, we extend this understanding by comparing these features across a range of solution conductivities.
3.6. Interfacial Capacitance (IC) at the Glass Surface
The higher conductivity of the 5% sucrose solution (containing either 0.26% or 0.55% NaCl) causes a dramatic increase in the relaxation frequency of the Maxwell–Wagner process such that the peak in the imaginary capacitance and the step in the real capacitance are positioned out of range of the instrument bandwidth of 10 Hz to 1 MHz. Hence, the Maxwell–Wagner process could not be detected by the TVIS system, as indicated by the black horizontal arrow pointing to higher frequencies in Figure 11c–f.
Instead, a new process is observed at low frequencies for the salt-loaded solutions. The relaxation frequency of this process approximately doubles (from 95 Hz to 200 Hz) as the salt concentration is increased from 0.26% to 0.55%. However, there is not any appreciable change in the amplitude of the process (as judged from the relative heights of the dielectric loss peak in the imaginary part spectra (Figure 11c,e)); therefore, this indicates this is also an interfacial process. A more in-depth study of this additional process is outside the scope of the study, but our initial guess is that it probably results from a layer of charge that is created by sodium ions adsorbing to the negatively charged glass surface, which gives rise to a capacitance in series with the glass wall on one side and the solution in the other, whereas the ion exchange between this layer and the glass gives rise to a charge transfer resistance. The time constant () of the process is defined by the product of the charge transfer resistance across the interface () and capacitance of the interfacial layer ().
Summary: This newly observed low-frequency process is distinct from the MW relaxation and is hypothesized to arise from ion-specific interactions at the glass interface. A full mechanistic model is beyond the scope of this work, but it will be explored in future studies.
3.7. TVIS Parameters for Characterization of Liquid–Solid Phase Transition
During the freezing of each solution, the MW process shifts towards lower frequencies and reduces in magnitude as the ice forms from the bottom of the vial to replace the liquid phase with a solid fraction. This transition is more clearly observed for the TVIS containing 5% sucrose (without salt), as both the MW (for the liquid state) and the dielectric relaxation of ice (for the solid state) are clearly evident within the experimental frequency window of the TVIS instrument. For the conductive sucrose solutions containing 0.26% and 0.55% NaCl, one cannot see the MW process in the liquid state, but with the ongoing formation of ice, the dielectric relaxation of the ice mass itself appears in place of the interfacial polarization process (Figure 11, grey lines). In other words, the measurement window of the TVIS system (frequency range of 10 Hz to 1 MHz) captures the dielectric relaxation of ice in the frozen phase instead of the MW relaxation or the IP relaxation of the liquid phase for neutral solutes and conductive solutes, respectively. This transition between two very different dielectric processes underpins the use of TVIS technology in characterizing the liquid–solid phase transition in a freeze-dry vial.
In summary, the TVIS spectra show distinct qualitative features depending on solute conductivity and physical state, with MW relaxation dominant in low-conductivity liquids and dielectric ice relaxation dominating post-freezing. For additional details on the qualitative spectral interpretation in non-conductive systems, the reader is referred to our earlier work [12].
3.8. Quantitative Analysis of TVIS Spectra
Having provided a qualitative interpretation of the general features of the TVIS spectra for the sucrose and sucrose–salt solutions in the liquid and frozen/solid states, the next part of this investigation is to develop a quantitative assessment of the ice formation process. To enable this, we first define some parameters that are readily extracted from the available spectra. Fitting data to equivalent circuits and relaxation models is outside the scope of this article; instead, we continue to follow the approach taken in previous publications [12,13,14,15,21] for consistency and for the purposes of comparison.
In total, four TVIS parameters were extracted from the spectra recorded for each TVIS vial using LyoView® software v1.0 (LyosenZ Ltd., Leicester, UK.). Two are taken from the dielectric loss spectrum (i.e., imaginary capacitance) and two are taken from the dielectric permittivity spectrum (i.e., real part capacitance).
- Peak amplitude () and peak frequency () of the loss peak of the MW process, interfacial capacitance (IC), or dielectric relaxation of ice (depending on which dominated the spectra at any time point).
- Real part capacitance at two fixed frequencies (i.e., 10 Hz and 0.2 MHz).
This extraction process is illustrated in Figure 12 using the example of a 5% sucrose solution in the liquid state. Here, the observed process is the MW charging of the glass wall through the solution resistance, which merges with the dielectric relaxation of ice as the physical state changes from liquid to frozen; so, from the dielectric loss spectrum, one appears to witness a single dielectric loss/relaxation process that changes in characteristics during the freezing process.
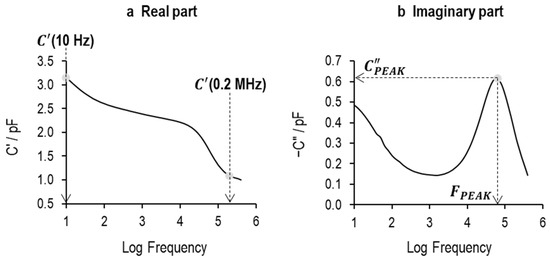
Figure 12.
TVIS parameters derived from (a) real part capacitance, i.e., (10 Hz) and (0.2 MHz); and (b) imaginary part capacitance, and . This example spectrum was obtained from the TVIS vial containing the 5% w/v sucrose solution at +20 °C, prior to freezing. The relaxation process observed by the step in the real part capacitance and the corresponding peak in the imaginary part capacitance spectrum is due to the Maxwell–Wagner polarization of the glass wall through the electrical resistance of the solution.
Figure 13, Figure 14 and Figure 15 show selected imaginary and real part capacitance spectra (graphs a and b, respectively) recorded over the freezing period for the TVIS vial containing 5% sucrose; 5% sucrose and 0.26% NaCl; and 5% sucrose and 0.55% NaCl. The right side shows the derived parameters of the log of the peak frequency (graph c) and the peak amplitude (graph d) for the principal relaxation peak observed in the imaginary capacitance spectra, i.e.,
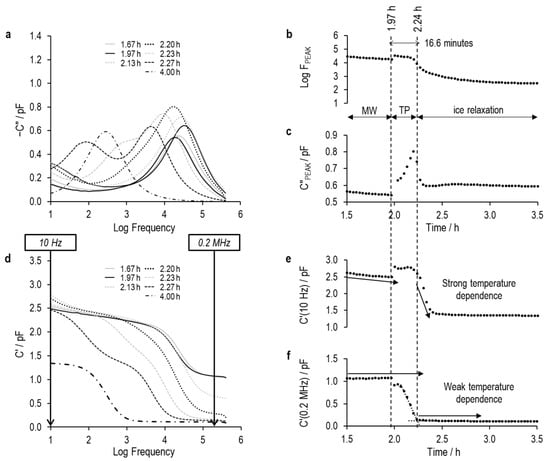
Figure 13.
Imaginary and real part spectra (graphs (a) and (d), respectively) for TVIS vial containing 5% sucrose, and derived TVIS parameters demonstrating the onset of nucleation and solidification endpoint, (b) is the log of the peak frequency, (c) is the magnitude of the peak, (e) is the real part capacitance at low frequency, i.e., 10 Hz, and (f) is the real part capacitance at low frequency, i.e., 0.2 MHz.
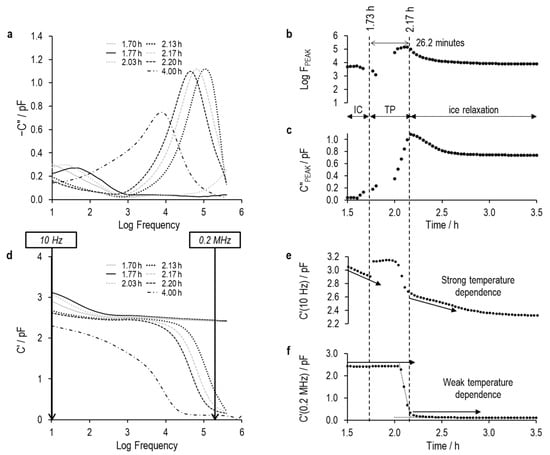
Figure 14.
Imaginary and real part spectra (graphs (a) and (d), respectively) for TVIS vial containing 5% sucrose and 0.26% NaCl, and derived TVIS parameters demonstrating the onset of nucleation and solidification endpoint, (b) is the log of the peak frequency, (c) is the magnitude of the peak, (e) is the real part capacitance at low frequency, i.e., 10 Hz, and (f) is the real part capacitance at low frequency, i.e., 0.2 MHz.
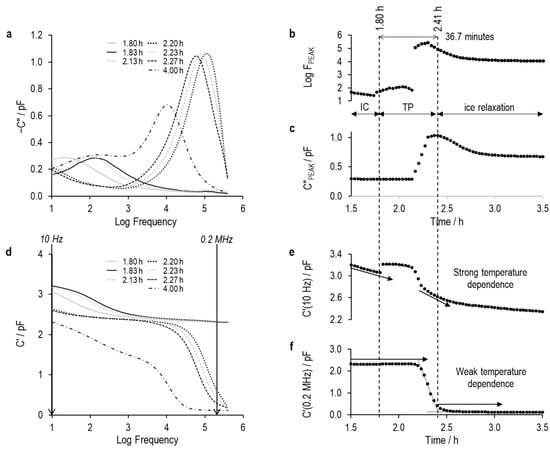
Figure 15.
Imaginary and real part spectra (graphs (a) and (d), respectively) for TVIS vial containing 5% sucrose and 0.55% NaCl, and derived TVIS parameters demonstrating the onset of nucleation and solidification endpoint, (b) is the log of the peak frequency, (c) is the magnitude of the peak, (e) is the real part capacitance at low frequency, i.e., 10 Hz, and (f) is the real part capacitance at low frequency, i.e., 0.2 MHz.
- Maxwell–Wagner process (MW) for the 5% sucrose solution (low conductivity).
- Interfacial capacitance (IC) for the 5% sucrose solutions with 0.26% and 0.55% solutions (high conductivity).
- Dielectric relaxation of ice for the frozen state of all three solutions.
The right sides of Figure 13, Figure 14 and Figure 15 also show the derived parameters of the real capacitance at low and high frequencies, given the symbols (10 Hz) and (0.2 MHz), respectively (graphs e and f, respectively). Overlayed on these profiles are the arrows pointing from left to right, which have been drawn to indicate/highlight the differences in the temperature dependencies of the real part capacitance in the limits of low and high frequency.
The period marked TP is the transition period in which either of the two conditions apply: (i) the peaks of any of the processes are no longer visible within the experimental frequency region of the TVIS instrument, or (ii) the peak observed is a hybrid of multiple processes, for example a peak that comprises contributions from the MW relaxation and from the dielectric relaxation of ice.
Previously, we showed that phase changes (liquid to ice) can be tracked via changes in the imaginary capacitance peak during freezing of low-conductivity samples (e.g., pure water solutions of neutral solutes such as sucrose) [20]. However, adding salt shifts the MW relaxation above the measurable frequency range, and consequently, the dielectric loss peak of the MW process cannot be considered as an indicator for the onset phase of ice formation.
Instead, we observed another process which (as we stated earlier in the article) is presumed to be due to the relaxation of the space charge polarization across the interface, whose time constant depends on the charge transfer of sodium ions with the glass. However, that process is not always observed; therefore, the parameters and of the IC relaxation peak may not provide universal indicators for the onset of ice nucleation for conductive samples. And so, here we focus our attention on the real part capacitance at operating frequencies both lower and higher than the relaxation frequency of ice, i.e., (10 Hz) and (0.2 MHz), to establish whether it was possible to detect the onset of ice formation. Certainly, it is possible to use the high-frequency real part capacitance to observe the end of ice formation [15], but we have yet to demonstrate whether either parameter might be able to detect the onset of ice formation in conductive solutions such as those investigated in this study. Note that the conductivities of these model solutions are at the top end of what would be considered appropriate from a clinical point of view, in which any solution that has a greater tonicity than the blood would cause irritation at the injection site.
3.9. Ice Nucleation Onset
First, we examine the characteristics of the time profiles for the real part capacitance taken from the low and high frequency ends of the spectrum for the 5% sucrose solution without sodium chloride (Figure 13e and 13f, respectively). Both show a discontinuity at the onset of ice formation, with the low-frequency capacitance increasing (due to the spike in temperature of the solution, which is associated with the exothermic process of ice formation) and with the high-frequency capacitance decreasing, presumably because a fraction of the solution is now ice and, therefore, the bulk capacitance decreases. Note that for the non-conductive solution, the MW process has already relaxed at the high frequency of 0.2 MHz, so the bulk capacitance becomes a function of the static dielectric permittivity of water () and the high frequency dielectric permittivity of ice ().
At this point, it seems that either the low- or high-frequency capacitance could provide a universal parameter for determining the onset of ice formation. However, during the freezing of solutions with varying conductivities (exemplified by the 5% sucrose solutions with 0.26% and 0.55% sodium chloride), the real part capacitance at low frequency again increases at the onset of ice formation. In contrast to the sucrose solution without salt, the high-frequency capacitance does not change at the point of ice formation.
This is likely due to the continued dominance of the MW process at these high frequencies. Under these conditions, the measured capacitance remains equal to the series sum of the glass wall capacitance and the interfacial capacitance between the glass and the solution. As a result, (0.2 MHz) does not yet reflect changes in the dielectric properties of the solution caused by ice formation. It is only when the MW process shifts to lower frequencies (as the temperature begins to decrease again) that the relative contributions from the dielectric permittivity of the unfrozen liquid fraction and the high-frequency tail of the dielectric relaxation of ice combine. At this stage, the measured high-frequency capacitance begins to decrease as the system transitions from the dominance of the MW process to that of the high-frequency permittivity of ice.
3.10. Solidification Endpoint
Once solidification is complete, the temperature of the frozen sample continues to decrease as it adjusts to thermal equilibrium with the temperature of the shelf. Of the TVIS parameters studied, i.e., , , (10 Hz), and (0.2 MHz), only real part capacitance at a high frequency limit ( (0.2 MHz)) is less influenced by product temperature, as exemplified by the dielectric studies on pure ice [15,22].
Consider the 5% w/v sucrose solution as an example. After ice nucleation at 1.97 h, the value of (0.2 MHz) decreased (Figure 13f) as ice volume increased and then stabilized at 0.11 pF once solidification was complete. The endpoint can be identified from the lower inflection point of the (e.g., 0.2 MHz) profile—specifically, the intersection of two linear fits: one across the transition step-down and the other across the plateau. Similar solidification endpoints are observed in the profile of the high-frequency capacitance ( (0.2 MHz)) of the conductive solutions. The solidification endpoints were then confirmed by image analysis of the photographic images in Figure 7, Figure 8 and Figure 9 (Table 4).

Table 4.
Solidification endpoint determined by TVIS and an image analysis program (ImageJ).
In finishing the assessment of how the real part capacitance parameters from the TVIS measurement may be used to effect in the determination of the ice nucleation onset and ice solidification endpoint, we would like to stress two points in relation to the alternative method of using a camera to visualize these events:
- (i)
- The camera is placed in front of the chamber window; thus, the information obtained from the two-dimensional image is from one direction and cannot wholly represent the solidification process of all content in the vial, especially at the center [23]. For instance, in the case of one-dimensional radial ice formation, this usually starts from the outside and moves inward; consequently, the sample near the center of the vial might solidify more slowly than that close to the glass wall.
- (ii)
- The placement of a camera within the array of vials would require a special design that, in effect, takes up no more footprint than one of the vials close to the vial under study, so that its physical size does not perturb the usual hexagonal packing of the array. Such a camera (LyoREC™) is available from LyosenZ Ltd. (UK), and its use, along with its LyoView® software, in the assessment of ice formation in the center vials will be the subject of a future study.
In contrast, we can say the following:
- (i)
- The endpoint determined by TVIS reflects the ‘average’ characteristics of the ice mass, and the evidence from this study suggests the possibility of using TVIS parameters, i.e., (0.2 MHz), in determining solidification endpoints when visual observations and photographic evidence are not possible.
- (ii)
- The low profile of the TVIS electrodes and the thin flexible cables means that it is possible to place these vials within the vial array without perturbation to the packing and hence heat transfer to and from the vial.
3.11. Determination of Ice Nucleation Temperature
Due to the dependence of the Maxwell–Wagner (MW) relaxation process on product temperature [13], it is possible to predict the temperature of the solution (in its liquid state) by using thermocouple measurements () taken from a vial adjacent to the TVIS vial. This prediction can be based on temperature-sensitive parameters from the dielectric loss spectrum, such as and . However, as demonstrated in this study, the MW process does not always manifest within the frequency range of the current TVIS instrumentation. In most cases, where the solution exhibits some conductivity, the corresponding decrease in relaxation time shifts the MW process to frequencies beyond the capabilities of the existing TVIS system. Therefore, it is necessary to rely on the low-frequency real part capacitance, (10 Hz), which shows strong temperature dependence. This parameter can be used to establish a temperature calibration, which in turn allows for the prediction of the nucleation temperature within the TVIS vial.
Through our TVIS approach, we propose two scenarios for inferring or predicting the nucleation temperature in the TVIS vial from the temperature recorded in one of the nearest-neighbor thermocouple-containing vials. Note that the equivalence between the temperature in the TVIS vial and the temperature in all of its six nearest neighbors in a hexagonal array is at its worst during the temperature ramp, when the uncertainty in the TVIS vial temperature is ±0.4 °C, as opposed to the point when the temperature stabilizes, when the uncertainty reduces to ±0.15 °C.
The first scenario is when the TVIS vial nucleates before the vial in which the thermocouple is inserted. In such cases, the nucleation temperature can be inferred directly from thermocouple temperatures in the nearest-neighbor vial. In other words, one takes the time point at which the TVIS parameter (10 Hz) indicates that ice nucleation has occurred and then estimates the nucleation temperature from the temperature recorded in the nearest-neighbor vial.
However, in general, the thermocouple vial tends to nucleate prior to the TVIS vial because of the impact of the temperature probe [1,7,24], which brings us to the second scenario in which a temperature calibration is required in order to predict the temperature at which ice nucleates in the TVIS vial.
The method involves plotting the thermocouple temperatures () in the vial placed adjacent to the TVIS vial against the temperature-sensitive TVIS parameter (10 Hz) at each of the time points (recorded every 2 min) during the period of supercooling, immediately leading up to the ice nucleation event in the TC containing vial, and then fitting the data to the mathematical function. The TVIS-predicted product temperatures are then extrapolated beyond calibration range by substituting the values of TVIS parameters into the x-parameter of the fitting function from the calibration curve, and finally, the TVIS vial nucleation temperature is predicted from the point at which (10 Hz) inflects.
The rationale in choosing the supercooling data is that the profile of temperature vs. (10 Hz) is somewhat straightforward, with the calibration data for (10 Hz) fitting well to a second-order polynomial (Table 5).

Table 5.
Temperature calibration coefficient from (10 Hz) parameter, predicting the nucleation temperature ().
The ice nucleation temperature in the TVIS vial is predicted by using the fitting coefficient along with the value of the TVIS parameter at the onset of ice nucleation (Figure 16). In this figure,
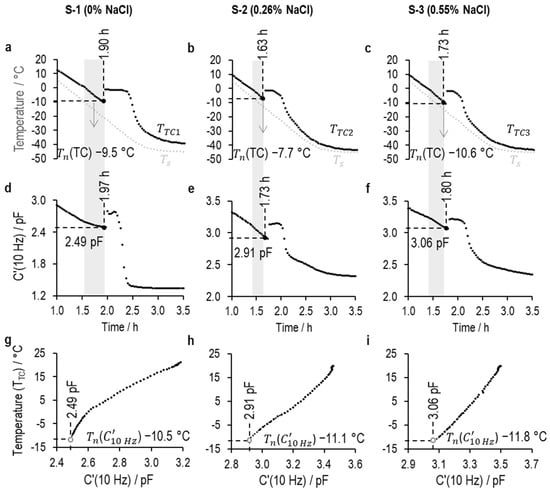
Figure 16.
Determination of the ice nucleation temperatures () of 5% w/v sucrose with 0% NaCl (S-1), 0.26% NaCl (S-2), and 0.55% NaCl (S-3).
(a–c) are the temperature profiles from the thermocouple in the nearest-neighbor vial () and shelf temperature (): (a) S-1 (), S-2 (), and (b) S-3 ();
(d–f) are the time profiles of the (10 Hz) value of (d) S-1, (e) S-2, and (f) S-3 over a 2.5 h freezing stage (from 1.0 h to 3.5 h);
(g–i) are the calibration plots between the thermocouple temperature within the adjacent vial () and the value of (10 Hz) for (e) S-1, (f) S-2, and (g) S-3.
The shaded region demonstrates the data range used in creating the temperature calibration of the supercooled solution.
At the onset of ice nucleation, the values for (10 Hz) for S-1, S-2, and S-3 are 2.49 pF, 2.91 pF, and 3.06 pF, respectively. TVIS nucleation temperatures (()) are then estimated by extrapolating the calibration curve to these (10 Hz) values, to give predictions of −10.5 °C, −11.1 °C, and −11.8 °C for S-1, S-2, and S-3, respectively. By contrast, the nucleation temperatures measured from the thermocouple ((TC)) are −9.5 °C, −7.7 °C, and −10.6 °C for S-1, S-2, and S-3, respectively.
A comparison of the TC and TVIS vial nucleation temperatures is given in Figure 17. The first point to note is that the nucleation temperature () in the TC-containing vial at first decreased with the addition of 0.26% salt and then increased again when 0.55% salt was added. This erratic behavior may be due to the variable impact that the thermocouple placement inside the vial has on the ice formation process. By contrast, given that TVIS is a non-invasive technique (the electrode is attached on the outer surface of the vial), it does not alter the nature of heterogeneous ice nucleation, which is seen to decrease incrementally from −10.5 to −11.1 and then −11.9 °C with successive addition of NaCl.
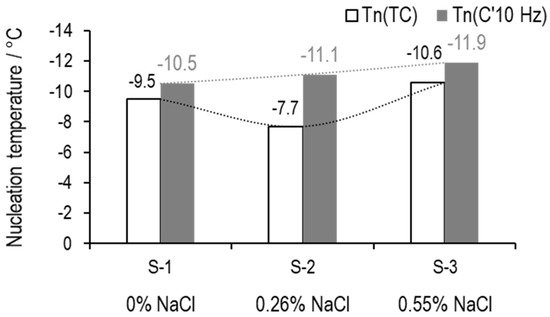
Figure 17.
Nucleation temperature of 5% w/v sucrose with either 0% NaCl (S-1), 0.26% NaCl (S-2), or 0.55% NaCl (S-3). The values above the white bars and grey bars indicate the nucleation temperatures from the thermocouple ((TC)) and TVIS technique (()), respectively.
A linear relationship between the lowering of the heterogeneous nucleation temperature () from that of pure water () and that of the equilibrium freezing point depression () (3) is routinely observed for heterogeneous systems [25,26].
where is an experimentally derived constant (which is independent of the solute type but dependent on nucleation sites/surfaces of the particular system), is the cryoscopic constant (which, for NaCl, is taken as 1.86 mol−1), is the stoichiometric factor for dissociation (which, for NaCl, equals 2), and M is the molarity (which, for the 0.26% and 0.55% w/v solutions of NaCl, are 0.0445 M and 0.0942 M, respectively).
The estimates for from this study (Table 6) are higher than the value of 2 determined by Wilson and Haymet [25], but this is a consequence of the vastly different sample sizes and characteristics of the nucleation sites, in which ~300 µL volumes were assessed with grains of white sand as the nucleating material. Our values are more consistent with observations in the freeze-drying literature [27,28].

Table 6.
Estimates for the factor relating (the reduction in the heterogeneous nucleation time of a solution relative to the heterogeneous nucleation temperature of pure water) to the freezing point depression of the solution, .
An impact of the ice nucleation temperature on the ice structure, i.e., size and morphology, and a subsequent primary drying rate has been well established [1,2,27,29]. The lower the nucleation temperature, the higher the degree of supercooling, which can produce a small ice crystal and increase drying time. Hence, the size of the ice crystal would decrease as the salt concentration increases. In this work, if we consider NaCl concentrations only, 5% sucrose with a 0.55% solution should provide the smallest ice crystal, followed by the longest processing time. However, this does not account for the duration of ice formation time.
3.12. Impact of Salts on the Ice Formation Period
Here, we develop a method based on through-vial impedance spectroscopy to determine the time period required to complete the ice formation process (nucleation and ice growth). This is calculated based on the time difference between the point when nucleation commences and ice completely solidifies (ice solidification endpoint). With a TVIS technique, a spike in the time profile of (10 Hz) is associated with the ice nucleation event, while the end of solidification is an inflection point in the (0.2 MHz) profile. The determination of the ice formation period of three samples is given in Figure 18.
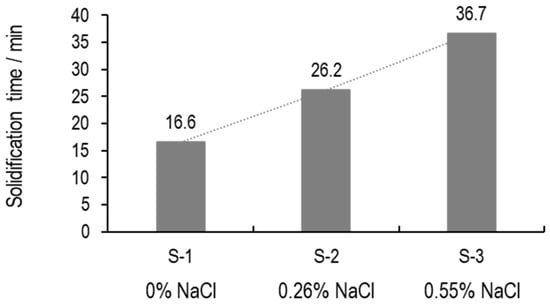
Figure 18.
Time required for complete ice formation of 5% w/v sucrose solution with either 0% (S-1), 0.26% (S-2), or 0.55% NaCl (S-3). Real part capacitance at 10 Hz and 0.2 MHz is used to determine the beginning and end of the ice formation process.
In Figure 18, a twofold increase in solidification time is observed as the salt concentration increases from 0 to 0.55% w/v. To explain this result, a basic understanding of ice growth is required. Ice growth involves the addition of water molecules to the solid–liquid interface and is governed by mass transfer through the solution. Water molecules diffuse through the liquid and then adhere to the surface of the growing ice crystal, thereby increasing its size. When sodium chloride is dissolved in water, it dissociates into water molecules and ions, forming a specific ionic interaction. Because the electrostatic bonds between ions and water molecules are stronger than the hydrogen bonds between water molecules [30,31], these water–ion interactions reduce the diffusion rate of water molecules. This reduced mobility effectively hinders the direct participation of water molecules in ice crystal growth. Consequently, the presence of salt delays ice growth, resulting in an increased solidification time.
An additional contributing factor is the formation of a highly concentrated solute layer on the outer surface of the ice as salt is rejected during crystal growth—a phenomenon known as constitutional supercooling [32]. This concentrated layer lowers the solid–liquid equilibrium temperature at the ice surface by depressing the local freezing point (due to the elevated solute concentration), which in turn increases the degree of supercooling required for continued ice growth.
Several studies have attempted to determine the morphology of ice structure [11,27,33,34,35]. In some, the mean size of ice crystals () was estimated from the rate of crystalline growth () and temperature gradient across the frozen zone () according to Equation (4) [11,36]:
where , , and are constant values and could be obtained from the experimental data.
Here, a simplified TVIS approach to determine how fast the ice developed to the front is proposed. An average solidification rate () is calculated by dividing the thickness of frozen matrix () by the solidification period.
where is the time point at which ice completes solidification, and is the time point where nucleation is initiated. The freezing profile of (10 Hz) parameters is used to provide , while the solidification endpoint () is estimated from the (0.2 MHz) profile. Photographic images of each sample at 4 h of the freezing process were processed using an image analysis program (ImageJ) to provide the thickness of the frozen mass () in five different positions (Figure 10). The value of these measurements was then averaged. All parameters used for calculation are listed in Table 7.

Table 7.
Solidification endpoint determined by different techniques: TVIS, visual inspection, and an image analysis program (ImageJ).
The average solidification rate of the three solutions reported in Table 7 demonstrates that increasing sodium salt by 0.55% can cause an approximate decrease of 50% in the solidification rate, supporting the idea that salt could delay ice formation either through water–ion interaction and/or through its accumulation on the ice surface.
4. General Discussion
We note that direct in-vial sensors (e.g., thermocouples) were deliberately avoided in the TVIS vials because their presence introduces heterogeneous nucleation sites, thereby shifting the nucleation temperature upward and altering the freezing dynamics. This effect was evident in our comparative analysis with the nearest-neighbor thermocouple vials (Figure 3). Similarly, while DSC can confirm thermal transitions under controlled heating and cooling, it does not reproduce the vial geometry or convective conditions of the freeze-drying process. Therefore, our validation strategy combined synchronized photographic evidence and adjacent thermocouple measurements to corroborate TVIS signatures in a minimally invasive manner.
It should be noted that the reproducibility of TVIS-derived nucleation and solidification metrics was assessed qualitatively, but no statistical variance was calculated across replicate vials. Future studies will include larger sample sets to quantify inter-vial variability and establish confidence intervals for the measured parameters.
It should also be noted that while equivalent circuit modeling (e.g., using R–C network analogs) is a common approach in impedance spectroscopy, it was not applied in this study. Previous work has already successfully modeled both the Maxwell–Wagner relaxation and the dielectric relaxation of ice in single-phase systems [12], and we are confident in our interpretation of these features. The newly observed low-frequency relaxation attributed to interfacial capacitance is a potential candidate for such modeling, as its time constant may reflect changes in surface charge dynamics or glass surface properties. Further investigation is needed to explore its dependence on factors such as glass hydrolytic stability or sample aging. However, modeling systems undergoing a phase transition—such as ice nucleation and solidification—would require dynamic circuit elements and transient fitting strategies, the benefits of which are not guaranteed.
Instead, this study adopts an empirical approach based on simple spectral parameters that are readily extractable and require no fitting—such as the real part capacitance at 0.2 MHz. At this frequency, the dielectric response of ice is essentially temperature-insensitive, so changes in this parameter primarily reflect the evolving composition and structure of the unfrozen phase. This makes it particularly useful for assessing events like the solidification endpoint (as we demonstrate here) and the glass transition (as will be demonstrated in future work). Moreover, this empirical approach lowers the barrier to entry for practitioners unfamiliar with circuit modeling and expands the possibility of using more broadly available impedance analyzers, thereby enhancing the accessibility and scalability of TVIS technology.
A final comment is that although the current study focused on NaCl as a model salt, we recognize that in real-world formulations, sugars like sucrose are frequently combined with additional excipients such as calcium chloride, sodium sulfate, or phosphate buffers. These combinations not only influence freezing point depression but also affect the glass transition temperature () of the freeze-concentrated matrix, which has critical implications for drying protocol design. Salts with higher van ’t Hoff factors (e.g., CaCl2, Na3PO4) can lead to complex non-ideal behavior in which no longer follows linear trends with solute molality. TVIS offers a valuable tool to investigate such effects in future studies, particularly for formulations approaching the operational limits of commercial freeze-dryers.
5. Conclusions
The discontinuities in the time profiles of three of the four TVIS parameters (peak frequency (), peak amplitude (), and the real part capacitance at low frequency of 10 Hz ( (10 Hz)) could indicate the onset of ice nucleation in solutions of relatively low conductivity (as confirmed by evidence from a digital camera). However, for the conductive solutions, it is the real part capacitance at low frequency that provided the opportunity to determine the onset of ice formation. Then, by using the temperature recorded from the nearest-neighboring vial, the nucleation temperature could be estimated from the (10 Hz) parameter recorded in the TVIS vial.
Author Contributions
Conceptualization, G.S.; methodology, G.S. and Y.J.; formal analysis, Y.J.; investigation, Y.J.; resources, G.S.; data curation, G.S.; writing—original draft preparation, Y.J. and G.S.; writing—review and editing, G.S.; visualization, Y.J.; supervision, G.S.; project administration, G.S.; funding acquisition, G.S. All authors have read and agreed to the published version of the manuscript.
Funding
This research was funded by the Government Pharmaceutical Organization of Thailand.
Data Availability Statement
The original data presented in the study are openly available at https://doi.org/10.21253/DMU.29281709.v1.
Acknowledgments
During the preparation of this manuscript/study, the authors used ChatGPT 4.o for the purposes of initial drafting of the Featured Article description text. The authors have reviewed and edited the output and take full responsibility for the content of this publication.
Conflicts of Interest
The authors declare no conflicts of interest.
Abbreviations
The following abbreviations are used in this manuscript:
| MW | Maxwell–Wagner process |
| TVIS | Through-vial impedance spectroscopy |
| IC | Interfacial capacitance |
| TP | Transition period |
References
- Roy, M.L.; Pikal, M.J. Process control in freeze drying: Determination of the end point of sublimation drying by an electronic moisture sensor. PDA J. Pharm. Sci. Technol. 1989, 43, 60–66. [Google Scholar]
- Searles, J.A.; Carpenter, J.F.; Randolph, T.W. The ice nucleation temperature determines the primary drying rate of lyophilization for samples frozen on a temperature-controlled shelf. J. Pharm. Sci. 2001, 90, 860–871. [Google Scholar] [CrossRef] [PubMed]
- Tang, X.; Pikal, M.J. Design of freeze-drying processes for pharmaceuticals: Practical advice. Pharm. Res. 2004, 21, 191–200. [Google Scholar] [CrossRef]
- Geidobler, R.; Winter, G. Controlled ice nucleation in the field of freeze-drying: Fundamentals and technology review. Eur. J. Pharm. Biopharm. 2013, 85, 214–222. [Google Scholar] [CrossRef]
- Kasper, J.C.; Winter, G.; Friess, W. Recent advances and further challenges in lyophilization. Eur. J. Pharm. Biopharm. 2013, 85, 162–169. [Google Scholar] [CrossRef]
- Assegehegn, G.; Brito-de la Fuente, E.; Franco, J.M.; Gallegos, C. The Importance of Understanding the Freezing Step and Its Impact on Freeze-Drying Process Performance. J. Pharm. Sci. 2019, 108, 1378–1395. [Google Scholar] [CrossRef]
- Nail, S.; Tchessalov, S.; Shalaev, E.; Ganguly, A.; Renzi, E.; Dimarco, F.; Wegiel, L.; Ferris, S.; Kessler, W.; Pikal, M. Recommended best practices for process monitoring instrumentation in pharmaceutical freeze drying—2017. AAPS Pharmscitech 2017, 18, 2379–2393. [Google Scholar] [CrossRef]
- Patel, S.M.; Doen, T.; Pikal, M.J. Determination of end point of primary drying in freeze-drying process control. AAPS Pharmscitech 2010, 11, 73–84. [Google Scholar] [PubMed]
- Parvis, M.; Grassini, S.; Fulginiti, D.; Pisano, R.; Barresi, A.A. Sputtered thermocouple array for vial temperature mapping. In Proceedings of the 2014 IEEE International Instrumentation and Measurement Technology Conference (I2MTC) Proceedings, Montevideo, Uruguay, 12–15 May 2014; The Institute of Electrical and Electronics Engineers, Inc. (IEEE): Piscataway, NJ, USA, 2014; p. 1465. [Google Scholar]
- Grassini, S.; Parvis, M.; Barresi, A.A. Inert Thermocouple with Nanometric Thickness for Lyophilization Monitoring. IEEE Trans. Instrum. Meas. 2013, 62, 1276–1283. [Google Scholar]
- Colucci, D.; Maniaci, R.; Fissore, D. Monitoring of the freezing stage in a freeze-drying process using IR thermography. Int. J. Pharm. 2019, 566, 488–499. [Google Scholar] [CrossRef]
- Smith, G.; Polygalov, E. Through-vial impedance spectroscopy (TVIS): A novel approach to process understanding for freeze-drying cycle development. In Lyophilization of Pharmaceuticals and Biologicals: New Technologies and Approaches; Methods in Pharmacology and Toxicology; Ward, K., Matejtschuk, P., Eds.; Humana Press: New York, NY, USA, 2019; pp. 241–290. [Google Scholar]
- Smith, G.; Jeeraruangrattana, Y. Through-Vial Impedance Spectroscopy (TVIS): A New Method for Determining the Ice Nucleation Temperature and the Solidification End Point. In Freeze Drying of Pharmaceutical Products, 1st ed.; Fissore, D., Pisano, R., Barresi, A., Eds.; CRC Press: Boca Raton, FL, USA, 2019; pp. 77–98. [Google Scholar]
- Smith, G.; Jeeraruangrattana, Y.; Ermolina, I. The application of dual-electrode through vial impedance spectroscopy for the determination of ice interface temperatures, primary drying rate and vial heat transfer coefficient in lyophilization process development. Eur. J. Pharm. Biopharm. 2018, 130, 224–235. [Google Scholar] [CrossRef] [PubMed]
- Jeeraruangrattana, Y.; Smith, G.; Polygalov, E.; Ermolina, I. Determination of ice interface temperature, sublimation rate and the dried product resistance, and its application in the assessment of microcollapse using through-vial impedance spectroscopy. Eur. J. Pharm. Biopharm. 2020, 152, 144–163. [Google Scholar] [CrossRef]
- Smith, G.; Polygalov, E.; Arshad, M.S.; Page, T.; Taylor, J.; Ermolina, I. An impedance-based process analytical technology for monitoring the lyophilisation process. Int. J. Pharm. 2013, 449, 72–83. [Google Scholar] [CrossRef]
- Smith, G.; Arshad, M.S.; Polygalov, E.; Ermolina, I. An application for impedance spectroscopy in the characterisation of the glass transition during the lyophilization cycle: The example of a 10% w/v maltodextrin solution. Eur. J. Pharm. Biopharm. 2013, 85, 1130–1140. [Google Scholar] [CrossRef][Green Version]
- Arshad, M.S.; Smith, G.; Polygalov, E.; Ermolina, I. Through-vial impedance spectroscopy of critical events during the freezing stage of the lyophilization cycle: The example of the impact of sucrose on the crystallization of mannitol. Eur. J. Pharm. Biopharm. 2014, 87, 598–605. [Google Scholar] [CrossRef]
- Nema, S.; Ludwig, J.D. Pharmaceutical Dosage Forms: Parenteral Medications, 3rd ed.; Informa Healthcare: New York, NY, USA, 2010. [Google Scholar]
- Smith, G.; Arshad, M.S.; Polygalov, E.; Ermolina, I.; McCoy, T.R.; Matejtschuk, P. Process understanding in freeze-drying cycle development: Applications for through-vial impedance spectroscopy (TVIS) in mini-pilot studies. J. Pharm. Innov. 2017, 12, 26–40. [Google Scholar] [CrossRef]
- Pandya, B.; Smith, G.; Ermolina, I.; Polygalov, E. Observations on the Changing Shape of the Ice Mass and the Determination of the Sublimation End Point in Freeze-Drying: An Application for Through-Vial Impedance Spectroscopy (TVIS). Pharmaceutics 2021, 13, 1835–1851. [Google Scholar] [CrossRef] [PubMed]
- Popov, I.; Puzenko, A.; Khamzin, A.; Feldman, Y. The dynamic crossover in dielectric relaxation behavior of ice Ih. Phys. Chem. Chem. Phys. 2015, 17, 1489–1497. [Google Scholar] [CrossRef] [PubMed]
- Burns, A.S.; Stickler, L.A.; Stewart, W.E. Solidification of an aqueous salt solution in a circular cylinder. J. Heat Transf. 1992, 114, 30–33. [Google Scholar] [CrossRef]
- Pikal, M.J.; Rambhatla, S.; Ramot, R. The impact of the freezing stage in lyophilization: Effects of the ice nucleation temperature on process design and product quality. Am. Pharm. Rev. 2002, 5, 48–53. [Google Scholar]
- Wilson, P.W.; Haymet, A. Effect of solutes on the heterogeneous nucleation temperature of supercooled water: An experimental determination. Phys. Chem. Chem. Phys. 2009, 11, 2679–2682. [Google Scholar] [CrossRef]
- Charoenrein, S.; Goddard, M.; Reid, D.S. Effect of solute on the nucleation and propagation of ice. In Water Relationships in Foods; Levine, H., Slade, L., Eds.; Springer: New York, NY, USA, 1991; pp. 191–198. [Google Scholar]
- Rambhatla, S.; Ramot, R.; Bhugra, C.; Pikal, M.J. Heat and mass transfer scale-up issues during freeze drying: II. Control and characterization of the degree of supercooling. AAPS PharmSciTech 2004, 5, 58. [Google Scholar] [CrossRef] [PubMed]
- Pisano, R.; Fissore, D.; Barresi, A.A. Heat Transfer in Freeze-Drying Apparatus. In Developments in Heat Transfer, Marco Aurélio dos Santos Bernardes; InTech: Toyama, Japan, 2011. [Google Scholar]
- Nakagawa, K.; Hottot, A.; Vessot, S.; Andrieu, J. Influence of controlled nucleation by ultrasounds on ice morphology of frozen formulations for pharmaceutical proteins freeze-drying. Chem. Eng. Process. 2006, 45, 783–791. [Google Scholar] [CrossRef]
- Meot-Ner, M. The Ionic Hydrogen Bond. Chem. Rev. 2005, 105, 213–284. [Google Scholar] [CrossRef]
- Marcus, Y. Effect of Ions on the Structure of Water: Structure Making and Breaking. Chem. Rev. 2009, 109, 1346–1370. [Google Scholar] [CrossRef]
- Wettlaufer, J.S. Impurity Effects in the Premelting of Ice. Phys. Rev. Lett. 1999, 82, 2516–2519. [Google Scholar] [CrossRef]
- Arsiccio, A.; Sparavigna, A.C.; Pisano, R.; Barresi, A.A. Measuring and predicting pore size distribution of freeze-dried solutions. Dry Technol. 2019, 37, 435–447. [Google Scholar] [CrossRef]
- Grassini, S.; Pisano, R.; Barresi, A.A.; Angelini, E.; Parvis, M. Frequency domain image analysis for the characterization of porous products. Measurement 2016, 94, 515–522. [Google Scholar] [CrossRef]
- Nakagawa, K.; Tamiya, S.; Sakamoto, S.; Do, G.; Kono, S. Observation of microstructure formation during freeze-drying of dextrin solution by in-situ X-ray computed tomography. Front. Chem. 2018, 6, 418. [Google Scholar] [CrossRef]
- Nakagawa, K.; Hottot, A.; Vessot, S.; Andrieu, J. Modeling of freezing step during freeze-drying of drugs in vials. AIChE J. 2007, 53, 1362–1372. [Google Scholar] [CrossRef]
Disclaimer/Publisher’s Note: The statements, opinions and data contained in all publications are solely those of the individual author(s) and contributor(s) and not of MDPI and/or the editor(s). MDPI and/or the editor(s) disclaim responsibility for any injury to people or property resulting from any ideas, methods, instructions or products referred to in the content. |
© 2025 by the authors. Licensee MDPI, Basel, Switzerland. This article is an open access article distributed under the terms and conditions of the Creative Commons Attribution (CC BY) license (https://creativecommons.org/licenses/by/4.0/).