Abstract
To elucidate the mechanisms governing hydrocarbon accumulation and phase evolution in the deep–ultradeep reservoirs of the Mo-Yong area, this study integrated 2D basin modeling and multi-component phase state simulation techniques, investigating the differences in maturity and hydrocarbon generation history between the Fengcheng Formation (P1f) and the Lower Wuerhe Formation (P2w) source rocks, as well as their coupling relationship with fault activity in controlling hydrocarbon migration, accumulation, and phase evolution. The results indicate that the P1f and P2w in the Mo-Yong area source rocks differ in thermal maturity and hydrocarbon generation evolution. The dual-source charging from both the P1f and P2w significantly enhances hydrocarbon accumulation number, volume, and saturation. The temporal-spatial coupling between peak hydrocarbon generation and multi-stage fault reactivation not only facilitates extra-source accumulation but also drives condensate reservoir formation through gas-oil ratio elevation and light-component enrichment. Based on these results, a model of hydrocarbon accumulation and phase evolution of deep reservoirs was proposed. The model elucidates the fundamental geological principle that source-fault spatiotemporal coupling controls hydrocarbon enrichment degree, while phase differentiation determines reservoir fluid types.
1. Introduction
As the discovery rate of shallow and intermediate-depth resources continues to rise, deep and ultradeep reservoirs have become the new frontier of hydrocarbon exploration [1,2]. Yet these reservoirs are highly heterogeneous and prohibitively expensive to drill. Whether “sweet spots” can be pinpointed hinges first on the spatiotemporal pattern of hydrocarbon migration and accumulation, which dictates the location of high-saturation zones. Moreover, reservoirs of different fluid types—oil, condensate oil, condensate gas, and dry gas—differ markedly in economic value and require distinct development strategies. Consequently, systematic investigation of hydrocarbon migration, accumulation, and phase evolution in deep and ultradeep settings has become the essential prerequisite for reducing exploration risk and achieving efficient development.
The Junggar Basin is located on the eastern margin of the Kazakhstan–Junggar Plate, at the junction of the Kazakhstan, Siberian, and Tarim plates, between 81° E–92° E and 43° N–48° N [3,4,5]. As a multi-cycle superimposed petroliferous basin having experienced multiple tectonic movements [6], it provides diverse hydrocarbon generation and accumulation conditions due to its complex geological framework [7,8]. Recent advancements in exploration technologies have significantly promoted hydrocarbon exploration in deep-ultradeep reservoirs [9,10,11]. Exploration results reveals that reservoirs in the deep-ultradeep Central Depression exhibit diverse hydrocarbon phases, including conventional oil, condensate oil, and condensate gas [8,9,12,13,14]. Significant variations in physical properties (density, viscosity, and interfacial tension) among different hydrocarbon phases profoundly influence the driving forces, reservoir physical conditions, and migration-accumulation mechanisms of deep-ultradeep hydrocarbons [15,16]. These factors are crucial for resources evaluation and the development of effective exploration strategies for deep-ultradeep petroleum systems.
The phase behavior of hydrocarbon fluids is primarily governed by temperature, pressure, and fluid composition [17,18]. During hydrocarbon accumulation, various secondary processes can significantly modify fluid phase characteristics, including compositional fractionation during secondary hydrocarbon migration, physical re-equilibration of paleo-hydrocarbon reservoirs [19,20,21], and biodegradation [22,23]. Notably, faults serve as critical hydrocarbon migration conduits, with their activity phases and activation episodes exerting profound influences on both hydrocarbon migration-accumulation patterns and phase distribution [24,25,26]. Not only can fault activity establish source-reservoir connectivity, thereby affect migration pathways and efficiency, but it also initiates processes like gas-invasion fractionation that fundamentally modify hydrocarbon phase behavior [24,27,28,29]. Furthermore, the fault-mediated hydrocarbon migration from source rocks to reservoirs involves complex physiochemical alterations that represent key drivers of phase transformation [30,31,32].
Current research on the deep-ultradeep reservoirs in the study area has yielded significant progress in understanding hydrocarbon accumulation conditions, key controlling factors, hydrocarbon phases, and their evolution process [8,25,33]. Nevertheless, these studies remain predominantly qualitative in their analysis of migration-accumulation processes and phase behavior, lacking comprehensive quantitative investigations. Three critical knowledge gaps persist: (1) Although high-quality source rocks from the Fengcheng Formation have been identified in the Mahu Sag of the Junggar Basin, their contribution to hydrocarbon accumulations in the Permian, Triassic, and Jurassic reservoirs within the Mo-Yong area remains debated, primarily due to the lack of direct hydrocarbon source rock penetrations in this area. (2) The differential impacts of dual-source (P1f and P2w) versus single-source (P2w only) charging on reservoir systems of Permian, Triassic, and Jurassic formation—including migration efficiency, petrophysical properties, and phase behavior—remain insufficiently understood. (3) Furthermore, although multi-phase fault activity is recognized as crucial for hydrocarbon migration, the complex interplay between source rock configuration, hydrocarbon generation-expulsion timing, and fault activation episodes—along with their collective impact on accumulation processes and phase evolution—remains to be fully elucidated. These unresolved issues hinder a mechanistic understanding of the deep-ultradeep petroleum systems in the Mo-Yong area, posing significant challenges for future exploration and development.
In light of these challenges, this study focuses on the Mo-Yong area to develop an advanced understanding of hydrocarbon migration and phase behavior evolution in deep petroleum systems. The investigation employs an integrated 2D geological modeling approach that incorporates essential geological controls, including source rock configuration and fault activity. These models were used to conducts simulations of hydrocarbon migration and accumulation and phase evolution by integrating source rock hydrocarbon generation history, reservoir temperature and pressure evolution history, and fault activity characteristics. The research ultimately establishes a migration-accumulation and phase evolution model for the study area, providing valuable insights for understanding hydrocarbon migration mechanisms and evaluating fluid phase in deep complex petroleum systems in the Junggar Basin. This study establishes a “migration-accumulation-phase behavior” coupling model. For the first time, when quantitatively reconstructing the phase evolution of extra-source hydrocarbon reservoirs, it incorporates changes in hydrocarbon compositions during migration—thereby breaking through the “constant composition” assumption in previous research, i.e., the premise that hydrocarbon components generated by source rocks are equivalent to those in extra-source reservoirs [34,35]. Additionally, this study, for the first time, employs basin modeling and phase simulation methods to confirm the existence of source rocks in the Fengcheng Formation and their contribution to deep-ultradeep hydrocarbon reservoirs—despite the absence of any wells in the study area that have yet penetrated high-quality source rocks of this formation.
2. Geological Background
The Junggar Basin, situated in northwestern China, is a multi-cycle superimposed petroliferous basin that has undergone multiple tectonic episodes, including the Hercynian, Indosinian, Yanshanian, and Himalayan orogenies [36,37,38,39,40]. Based on basement morphology, boundary characteristics of uplifts and depressions, sedimentary cover, and fault systems, the basin is divided into six first-order and 44 s-order structural units (Figure 1a). The study area is located in the western part of the Central Depression (Figure 1a), where significant oil and gas fields including Moxizhuang, Zhengshacun, and Yongjin fields have been discovered (Figure 1b). Structurally, the region in the study area is relatively uncomplicated, dominated by a gently south-dipping monocline (Figure 1b).
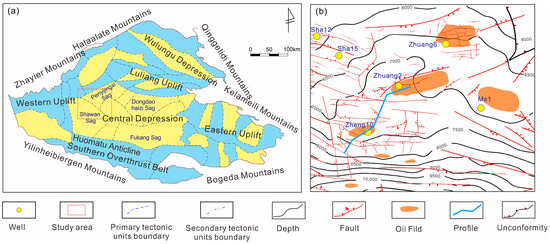
Figure 1.
Structural units of the Junggar Basin: (a) structural map of P2w in the study area; (b) the location of cross sections shown in (modified from Zhang et al. [25]).
The study area comprises a complete stratigraphic succession spanning the Paleozoic Carboniferous through Cenozoic (Figure 2); the target horizons for exploration are the Permian-Jurassic. The Carboniferous System exhibits angular unconformity with overlying strata and is dominated by volcanic lithologies [2]. Previous studies suggest that the Carboniferous System constitutes a component of the folded basement [41,42,43]. The Permian stratigraphic succession (in descending order) comprises the Jiamuhe Formation (P1j), Fengcheng Formation (P1f), Xiazijie Formation (P2x), Lower Wuerhe Formation (P2w), and Upper Wuerhe Formation (P3w). The Permian System represents the first set of sedimentary cover formed during the initial stage of basin development in the Junggar Basin. The basin was a rift basin during the Early-Middle Permian and transitioned into a depression development stage in the Middle-Late Permian [38,44,45]. From the Triassic onwards, the basin entered the intracontinental depression stage and remained dominated by continental deposits until the end of sedimentation in the Cretaceous. Triassic strata include the Karamay (T2k) and Baikouquan (T1b) Formations, both of which exhibit interbedded mudstone and sandstone with basal conglomerate layers. The Jurassic System includes the Badaowan Formation (J1b), Sangonghe Formation (J1s), Xishanyao Formation (J2x), Upper Jurassic Karazha (J3k), and Qigu (J3q) Formation. Upper Jurassic Karazha (J3k) and Qigu (J3q) Formations are absent due to erosional removal; the Middle and Lower Jurassic series are coal-bearing, whereas the Upper Jurassic series consists of red beds.
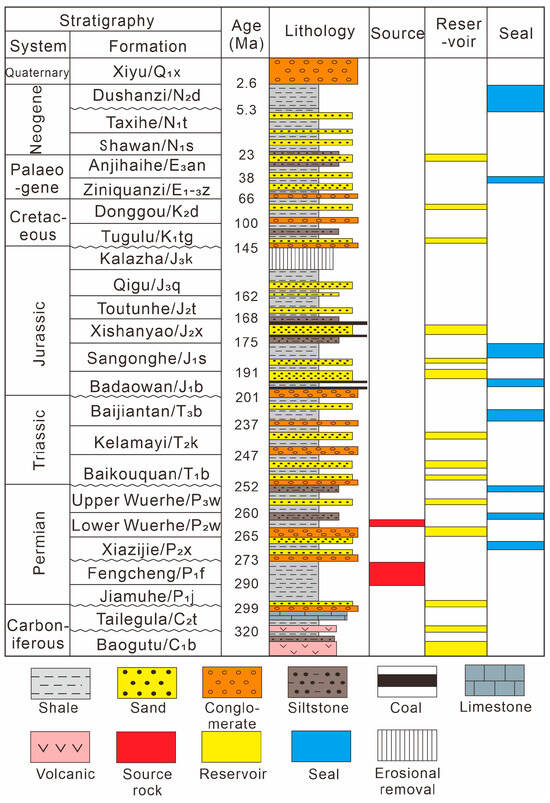
Figure 2.
Integrated stratigraphic column showing petroleum system elements in the Central Junggar Basin (modified from Wang et al. [33]).
P2w and P1f are the most important source rocks in deep-ultradeep reservoirs [33,46]. The P2w dark mudstones were deposited in the deep to semi-deep lacustrine environments [47,48], and the Fengcheng Formation (P1f) is primarily composed of dark dolomitic mudstone, tuffaceous dolomite, and tuffaceous dolomitic mudstone, deposited in a high-salinity residual marine lagoon environment [49,50,51,52]. Critical petroleum system elements in the study area include sandstone reservoirs within the P2x, P3w, T2k, T1b, J1b, and J1s formations, while mudstone intervals in the P2x, P3w, T3b, and J2x formations serve as effective caprocks (Figure 2). The P2x features a distinct vertical lithologic variation, with sandstone predominating in the upper section, conglomerate in the lower portion, and intercalated mudstone in middle intervals. The P3w is primarily composed of mudstone with thin sandstone interbeds. Jurassic strata include the Badaowan Formation (J1b), which consists of interbedded sandstone and mudstone with coal seams. The Sangonghe Formation (J1s) comprises gray mudstone and sandy mudstone alternating with gray argillaceous siltstone and gravel-bearing sandstone. The Xishanyao Formation (J2x) represents lacustrine-swamp coal measures with mudstone–siltstone–sandstone alterations, containing carbonaceous mudstone and coal seams (Figure 2).
The origin of hydrocarbons in Paleozoic and Mesozoic reservoirs within the study area remains a subject of ongoing debate. Existing literature presents two contrasting views: Some researchers attribute the hydrocarbon charge primarily to the Upper Wuerhe Formation source rocks [53,54,55], while others propose a dual-source model involving the Upper Wuerhe and Fengcheng Formations [7,33]. This scientific controversy persists despite drilling evidence from Well ZS 1, which penetrated the P1f but did not encounter high-quality source rock intervals. As a result, the hydrocarbon-generating potential and actual contribution of source rocks from P1f in the Mo-Yong area remain unverified, particularly regarding their role in charging Paleozoic and Mesozoic reservoir systems.
The study area exhibits a well-developed fault system that can be categorized into three hierarchical orders based on structural characteristics and geological significance [56,57]. The classification considers multiple parameters including stratigraphic penetration depth, fault scale, vertical displacement, lateral extension, and depositional control effect [56,57].
First-order faults consist primarily of east-west trending reverse faults with steep dips (>60°). These faults display significant throws and extensive lateral continuity and predominantly cut through Permian-Triassic and older strata. The faults exhibit multi-stage activity, including initial formation during the Hercynian-Indosinian period, with subsequent reactivation in the Yanshanian period [58]. Second-order faults, while less prominent than first-order faults, exert important controls on secondary structural unit developments. Characterized by more modest displacement and generally confined to the Permian-Jurassic sequence (with limited Cretaceous penetration), these faults demonstrate relatively consistent stratigraphic thickness across their hanging walls and footwalls. The principal phase of activity occurred during the Indosinian period. Third-order faults comprise smaller-scale subsidiary structures with limited stratigraphic penetration and minimal displacement. Most Jurassic-intrabasinal faults belong to this category, exerting a controlling influence on the reorganization of Jurassic reservoirs [59]. Notably, certain second- and third-order faults form characteristic “Y”-shaped configurations with deeper first-order faults, creating critical migration pathways for hydrocarbon fluids [60].
3. Data and Method
3.1. Data and Samples
The calibration data for this study, including formation temperature, pressure, hydrocarbon fluid composition, density, viscosity, gas-oil ratio, and oil testing results, are obtained from SINOPEC’s Shengli Oilfield Company (Table 1).

Table 1.
Reservoir temperature, pressure, and fluid characteristics of Wells Zheng 10 and Zhuang 2.
Well Zheng 10, drilled to a depth of 7802 m in the Shawan Sag, encountered commercial hydrocarbon flows in both the P3w and T2k (Table 1). The P3w reservoir fluid composition exhibits a molar composition of 78.94% methane (C1), 13.15% C2–C5, 7.39% C6+, and 0.52% nitrogen (N2) (Table 2). Integrating these physical properties, including fluid density, viscosity, and gas-oil ratio, with empirical phase-discrimination methods and PVT phase-diagram interpretation [49,50] confirms that the P3w reservoir in the Zheng 10 well area exists as a condensate gas phase, whereas the T2k formations are oil-phase reservoirs.

Table 2.
Hydrocarbon composition of reservoir fluid from the P3w formation in Well Zheng 10.
Well Zhuang 2, drilled to a depth of 6610 m, encountered oil–gas shows in the J1s formation, J1b formation, and T2k-T1b formations (Table 1). Testing of the J1s intervals (4622 m–4725.74 m) identified a gas-bearing water layer, while evaluation of the T2k-T1b interval (6075.29 m–6610 m) confirmed a water-bearing oil layer.
The thermal maturity of organic matter in samples from Wells Zheng 10 and Zhuang 2 was determined through vitrinite reflectance analysis following the standard SY/T 5124-2012 [61], Method for Determination of Vitrinite Reflectance in Sedimentary Rocks. Standards Press of China: Beijing, China 2012. To ensure the statistical reliability of vitrinite reflectance (Ro) measurements, a minimum of 30 measurement points were collected for each sample. The microscopic optical system used was a Zeiss Axio Scope A1 microscope (Carl Zeiss AG, Oberkochen, Germany), and the vitrinite reflectance measurement instrument was a Diskus Fossil vitrinite reflectance system (Hilgers Technisches Buero, Königswinter, Germany). The tested results are listed in Table 3.

Table 3.
Thermal maturity measurement from deep and ultradeep intervals in Wells Zheng 10 and Zhuang 2.
3.2. Two-Dimensional Geological Modeling
The 2D geological model was constructed by using PetroMod 2019 software, integrating seismic interpretation and well data for the Zheng 10 and Zhuang 2 well profiles. The model spans approximately 50 km in length and was discretized into 1000 horizontal grid cells to optimize resolution and computational efficiency (Figure 3).
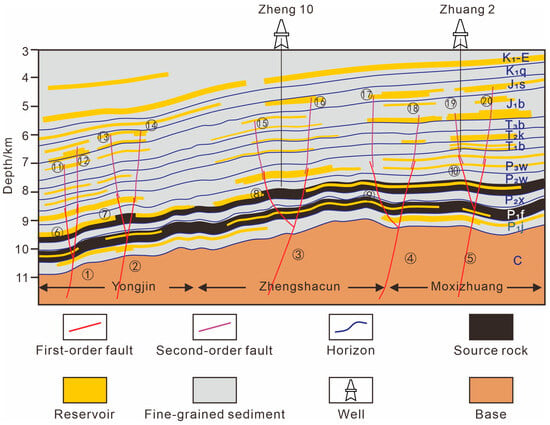
Figure 3.
Two-dimensional geological cross section along Wells Zheng 10 and Zhuang 2 (location shown in Figure 1b). The numbers in the figure indicate the sequence of the faults.
To investigate the controlling effects of source rocks, fault activation timing, and duration on hydrocarbon migration-accumulation, as well as on hydrocarbon composition and phase evolution, six geological models were established based on variations in source rock configuration and fault activation stages (Table 4). Within these models, faults are hierarchically classified as first-order faults and second-order faults. First-order faults are divided into two types: Type 1 faults cut through the Carboniferous-Upper Wuerhe Formation (e.g., Faults 1–5), while Type 2 faults penetrate the Fengcheng-Upper Wuerhe Formation (e.g., Faults 6–10). Second-order faults extend from the Upper Wuerhe Formation to the Sangonghe Formation (e.g., Faults 11–20) (Figure 3).

Table 4.
Temporal distribution of fault activity since the Jurassic and source rock configuration in the study area.
3.2.1. Geochemical Characteristics and Parameter Settings of Source Rocks
The thickness of the P2w source rocks in the study area was estimated based on seismic data and calibrated using drilling results from Well Zheng 10 and other wells. As shown in Figure 3, the thickness of the P2w source rocks ranges from 150 m to 300 m. The organic matter in these source rocks is mainly Type Ⅱ, with a total organic carbon (TOC) content ranging from 0.18% to 9.70% and hydrogen index (HI) ranging from 16.50 mg/g to 332.00 mg/g [62,63,64]. Referring to the research findings of Li et al. and Qu et al. [62,64], and combining these with the organic geochemical test data from source rocks of drilling source rocks collected from the SINOPEC’s Shengli Oilfield Company, the TOC of the P2w source rocks in this study was set at 1.5%, and the HI was set at 279.00 mg/g. The chemical kinetic model required for maturity calculation adopted the Easy%Ro DL model, while the hydrocarbon generation kinetics model referred to the research results of Zhao et al. [65].
Seismic data interpretation indicates that the thickness of the P1f source rocks in the study area varies between 0 m and 400 m. However, no drilling has yet encountered high-quality source rocks within this formation in the study area. In the northwestern Mahu Sag, the organic matter of the P1f source rocks is primarily Type Ⅰ–Type Ⅱ1, with TOC ranging from 0.10% to 4.38% [66,67,68], and HI values mostly between 100 mg/g and 800 mg/g [69,70]. Based on data from SINOPEC’s Shengli Oilfield Company and previous studies, the geological model (Figure 3) assigns the P1f source rocks a thickness of 200 m to 350 m, with a TOC of 3.0% and an HI of 306.59 mg/g. The chemical kinetic model employed for maturity calculation is the Easy%Ro DL model, while the hydrocarbon generation kinetics model is based on the research results of Bai et al. [71].
Given the divergence interpretations of the hydrocarbon sources for the discovered Paleozoic and Mesozoic reservoirs in the study area [72], this study classified the geological models into two categories based on source rock configurations (Table 4). The first category assumes that the hydrocarbons in the study area’s reservoirs originated exclusively from the P2w source rocks (Models 1–3). The second category assumes that the hydrocarbons in the study area reservoirs are derived from both the P2w and the P1f source rocks (Models 4–6) (Table 4).
3.2.2. Fault Activity and Timing Constraints
Considering the limited contribution of the third-order faults (which are exclusively developed within the Jurassic strata) to hydrocarbon migration, they were excluded from the geological modeling process to maintain computational efficiency. Only the first-order and second-order faults were incorporated into the model (Figure 3).
These first-order and second-order faults, together with sandstones, form a “Y-shaped” fault assemblage that constitutes important hydrocarbon migration pathways. Previous studies investigated the episodic activity of these faults through integrated analysis of pressure evolution and numerical modeling [73]. The results demonstrate that both the first-order and second-order faults in the study area experienced multiple activation episodes during major tectonic events, including the Hercynian, Indosinian, Yanshanian, and Himalayan orogenies [73]. Based on these findings, the activation periods and timing of major faults in the study area were established (Table 4).
3.2.3. Other Parameter Settings
The stratigraphic framework and lithological assignments in the geological model were established through seismic inversion and well-log calibration. Stratigraphic ages were constrained by published chronostratigraphic frameworks [33] (Figure 2). The paleo-heat flow evolution data were obtained from Rao et al. [38] thermal modeling research. Paleo-water depth estimates followed the parameterization scheme developed by Xu et al. [14], while the paleo-sediment–water interface temperature (SWIT) was calculated by the method of Wygrala [74]. The timing and magnitude of stratigraphic erosion events were determined based on the research results reported in Zhou et al. [75]. For hydrocarbon migration modeling, we implemented an integrated approach combining Darcy flow dynamics with invasion percolation theory as described by Hantschel et al. [76].
3.3. Hydrocarbon Phase Behavior Simulation and Validation
The phase equilibrium calculations in this study were performed using the Soave–Redlich–Kwong (SRK) equation with Peneloux volume correction. It should be noted that this equation is only applicable to scenarios where fluids have reached phase equilibrium. Previous studies have shown that when gas is injected into existing oil reservoirs, rapid mixing and equilibrium between oil and gas phases can be achieved [77,78,79]. Therefore, we assume that oil and gas generated during different hydrocarbon stages from source rocks can quickly reach fluid phase equilibrium after being injected into the reservoir.
Based on the simulation results of temperature, pressure, and hydrocarbon migration, PVT phase behavior simulation was conducted using the PetroFlash module in PetroMod 2019 software. This process yielded key fluid properties including viscosity, density, gas-oil ratio, and PVT phase diagrams. Subsequently, the fluid phase states in the hydrocarbon reservoirs were identified based on temperature, pressure, and PVT phase diagrams [17,80]. Finally, comprehensive validation was performed by comparing the simulation results with measured reservoir data including hydrocarbon compositions, physical properties, and hydrocarbon phase behavior characteristics; calibration of the simulation results is presented in the Results section.
4. Results
4.1. Model Calibration and Thermal History of Source Rocks
4.1.1. Model Reliability Validation
To validate the geological model and calibrate the thermal evolution history of source rocks, this study compared simulation results with the measured formation temperatures, pressures (Table 1), and vitrinite reflectance data (Table 3). Using Wells Zheng 10 and Zhuang 2 as examples, the established geological model was applied to simulate formation temperatures, pressures, and maturity across different strata.
The results demonstrate good agreement between simulated and measured data (Figure 4). Simulated temperatures deviate from measured values by less than ±5.97%, the simulated pressures show a discrepancy of under ±5.62% compared to actual measurements, and the difference between modeled and observed vitrinite reflectance (Ro%) is within ±2.95%. These findings confirm that the model parameters (e.g., geothermal gradient, rock thermal conductivity, and hydrocarbon generation kinetics) are reasonably configured, ensuring the reliability of the thermal evolution simulation results.
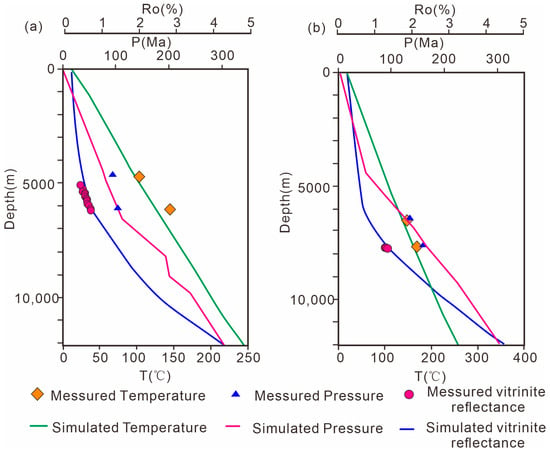
Figure 4.
Model calibration results showing simulated versus measured formation temperature, pressure, and vitrinite reflectance (Ro%) profiles for Well Zhuang 2 (a) and Well Zheng 10 (b).
4.1.2. Thermal Evolution and Hydrocarbon Generation History of Source Rocks
The thermal maturity and hydrocarbon generation history exhibit significant differences between the two principal source rocks (P2w and P1f) in the study area. The organic matters in P2w source rocks in the study area reached the hydrocarbon generation threshold (Ro = 0.5%) at the Late Triassic (~234 Ma), with the majority entering the mature stage (0.7% < Ro < 1.2%) at the Late Jurassic (~155 Ma). Complete maturation was achieved by the end of the Early Cretaceous (~100.5 Ma), while deeper sections attained high maturity (Ro > 1.2%) during the Paleogene (~55 Ma). Current maturity levels range between 1.31% and 1.75% Ro (Figure 5).
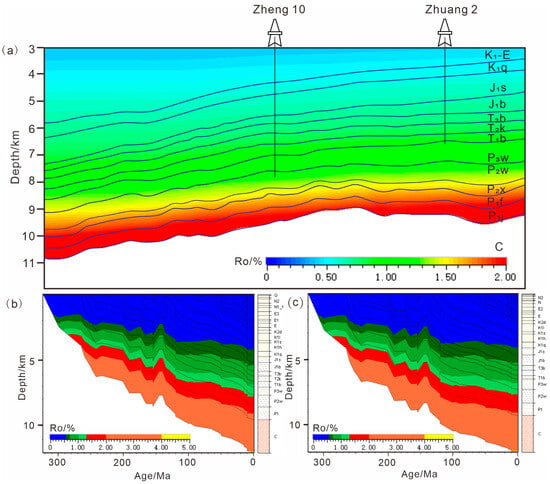
Figure 5.
(a) Present-day maturity distribution simulation results; (b) Thermal maturity evolution history of source rocks in Well Zheng 10; (c) Thermal maturity evolution history of source rocks in Well Zhuang 2.
In contrast, the Fengcheng Formation source rocks in the study area began hydrocarbon generation earlier, reaching the threshold (Ro = 0.5%) by the end of the Early Triassic (~252 Ma). Maturation (0.7% < Ro < 1.2%) occurred during the Late Triassic (~234 Ma), with high maturity being attained after the mid-Late Cretaceous (approximately 89 Ma). Present-day maturity measurements in the central interval range from 1.60% to 2.11% (Figure 5).
Hydrocarbon generation simulation results demonstrate a distinct “early oil generation, late gas generation” pattern in the study area (Figure 6). The P2w source rocks in both Well Zheng 10 and Well Zhuang 2 entered the oil generation window during the Late Triassic to Early Jurassic (Figure 6), and the peak oil generation rates reached 0.0025 might/go/Ma and 0.0009 magic/gTOC/Ma, respectively (Figure 6). Yanshanian tectonic uplift subsequently interrupted thermal maturation, halting hydrocarbon production until renewed burial in the end of the Early Cretaceous reactivated the system. This second phase culminated in an end-Early Cretaceous oil-generation climax, with the maximum oil generation rates reaching 0.0049 mgHC/gTOC/Ma (Zheng 10) and 0.0045 mgHC/gTOC/Ma (Zhuang 2) (Figure 6). By the Late Cretaceous, thermal cracking drove a pronounced shift to gas generation, a process that continues today at rates of 8.0 × 10⁻⁴ mgHC/gTOC/Ma (Zheng 10) and 7.5 × 10⁻⁴ mgHC/gTOC/Ma (Zhuang 2) (Figure 6).
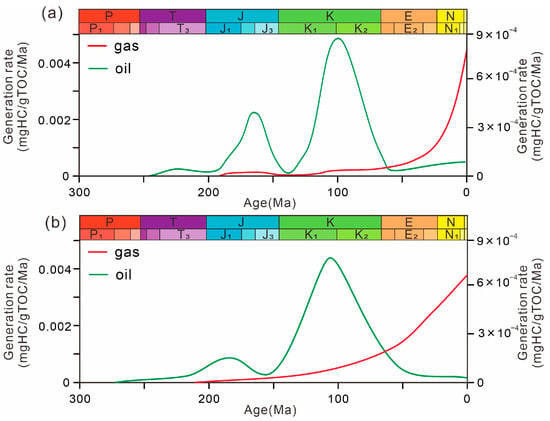
Figure 6.
Evolution of hydrocarbon generation rate in the P2w source rocks: (a) Well Zheng 10; (b) Well Zhuang 2.
The P1f source rocks generated hydrocarbon earlier than those in the P2w. Oil generation began in the Early Triassic, reaching peak production during the Late Triassic, which persisted until the end of the Middle Jurassic. Maximum oil generation rates for Wells Zheng 10 and Zhuang 2 reached 0.026 mgHC/gTOC/Ma and 0.017 mgHC/gTOC/Ma, respectively (Figure 7). A rapid increase in gas generation began in the late Early Cretaceous, with gas generation rates measuring 3.0 × 10⁻³ mgHC/gTOC/Ma of Well Zheng 10 and 3.1 × 10⁻³ mgHC/gTOC/Ma of Well Zhuang 2 (Figure 7).
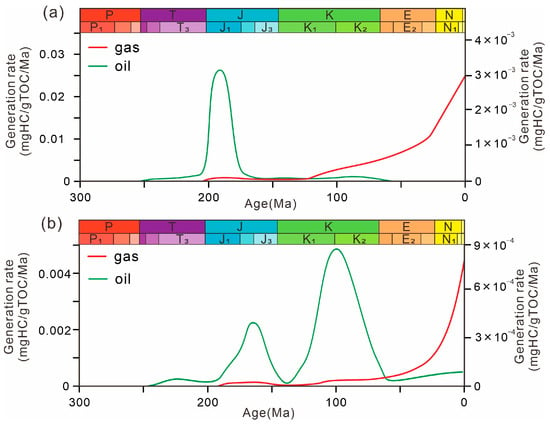
Figure 7.
Evolution of hydrocarbon generation rate in the P1f source rocks: (a) Well Zheng 10; (b) Well Zhuang 2.
Cumulative production from the P2w source rocks in the study area totals 88.46 Mt of oil and 2.27 × 10¹⁰ m3 of gas, while the P1f source rocks have yielded 153.16 Mt of oil and 2.08 × 10¹¹ m3 of gas. These results reflect the progressive thermal maturation trend from oil-dominated to gas-dominated systems in the study area.
4.2. Hydrocarbon Migration and Accumulation Simulation Results
The hydrocarbon migration and accumulation simulation results indicate that hydrocarbons generated from source rocks first migrate vertically along faults into overlying reservoirs, followed by lateral migration within the reservoirs, ultimately accumulating in favorable traps. Notably, a significant volume of hydrocarbons remains trapped within the source rocks themselves. Additionally, hydrocarbon accumulations are observed in external reservoirs, including Jurassic, Triassic, and Permian formations. Due to differences in the settings of source rocks, fault activation stages, and activation times in different models, the migration and accumulation results of each model vary (Table 5 and Table 6). These parametric variations result in substantial divergences in the modeled hydrocarbon distribution patterns, accumulation quantities (both numbers and volumes), and migration pathways.

Table 5.
Comparative analysis of hydrocarbon migration and accumulation in Models 1–3.

Table 6.
Comparative analysis of hydrocarbon migration and accumulation in Models 4–6.
In Models 1–3, all simulations feature only the P2w source rock but differ in fault activation phases and timing. Model 1 demonstrates the most effective hydrocarbon accumulation, with numerous fault activation events well-synchronized with peak hydrocarbon generation. This results in the largest external accumulations (52.42 Mt) across 20 reservoirs, including 9 reservoirs in the P3w formation and a significant 32.43 Mt in J1s (Figure 8a). Hydrocarbon saturation reaches 30.93% in the P3w reservoir at Well Zheng 10, while Well Zhuang 2 shows 20.88% and 23.72% saturation in J1s and P3w, respectively (Table 5). Model 3 shows minimal migration efficiency, as both first-order and second-order faults became inactive after 120 Ma, restricting vertical migration and yielding only 0.69 Mt of external accumulation, primarily in P3w (Figure 8c, Table 5). Model 2 represents an intermediate case where most second-order faults deactivated after 120 Ma, limiting migration to Triassic and Jurassic reservoirs. Consequently, accumulations are predominantly found in J1b and P3w, with volumes and reservoir counts intermediate between Models 1 and 3 (Figure 8b).
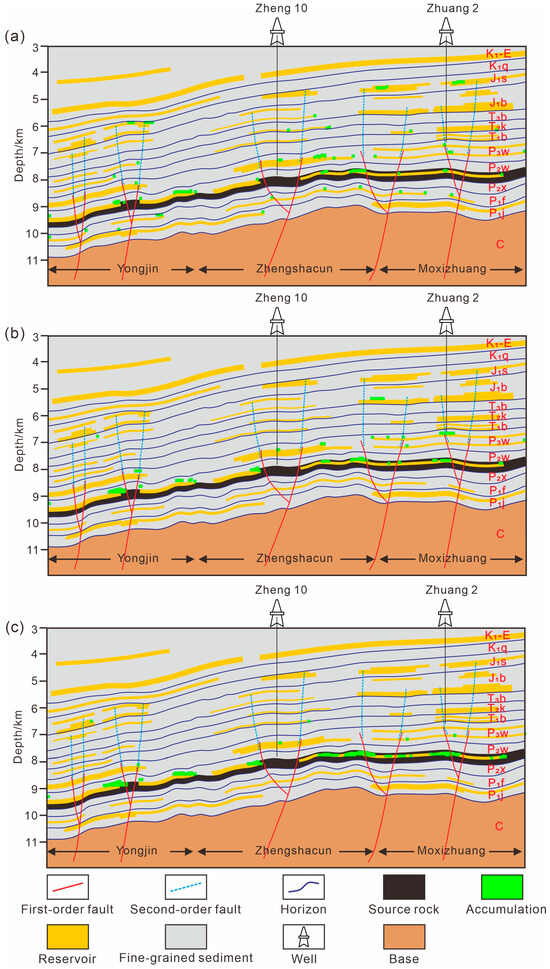
Figure 8.
Comparative hydrocarbon migration and accumulation Results of (a) Model 1; (b) Model 2; (c) Model 3.
Note: The figures present the hydrocarbon accumulation results of Models 1–3. These models only involve hydrocarbon supply from the source rocks of the Lower Wuerhe Formation. Simulation results indicate that the accumulation scale in reservoirs outside the source rocks is limited, with specific accumulation amounts listed in Table 5.
In Models 4–6, both the P2w and P1f source rocks contribute hydrocarbons to overlying reservoirs. Similar to previous observations, optimal fault activation phases synchronized with peak hydrocarbon generation (Model 4) yield maximum external accumulation volumes and reservoir counts, while post-120 Ma fault deactivation (Model 6) results in minimal migration efficiency. Comparative analysis reveals that dual-sourced systems (P1f + P2w, Model 4) generate significantly greater accumulation quantities and reservoir numbers than single-source systems (P2w only, Model 1). Model 4 results show the J1s formation contains 23 hydrocarbon accumulations (109.09 Mt), while the J1b formation hosts six reservoirs (36.17 Mt). Well Zheng 10 contains hydrocarbon accumulations in J1s, J1b, T2k, and P3w intervals with saturations of 23.95%, 47.55%, 18.35%, and 11.15%, respectively (Figure 8 and Figure 9, Table 6). Well Zhuang 2 exhibits saturations of 47.55%, 16.49%, 23.85%, and 47.89% in the J1s, T2k, T1b, and P3w intervals. Although both Model 6 and Model 3 exhibit inactive first- and second-order faults after 120 Ma, Model 6 benefits from an additional effective source rock (P1f) alongside P2w. As a result, Model 6 demonstrates significantly greater hydrocarbon accumulation in terms of both quantity and quality compared to Model 3 (Figure 8 and Figure 9, Table 5 and Table 6).
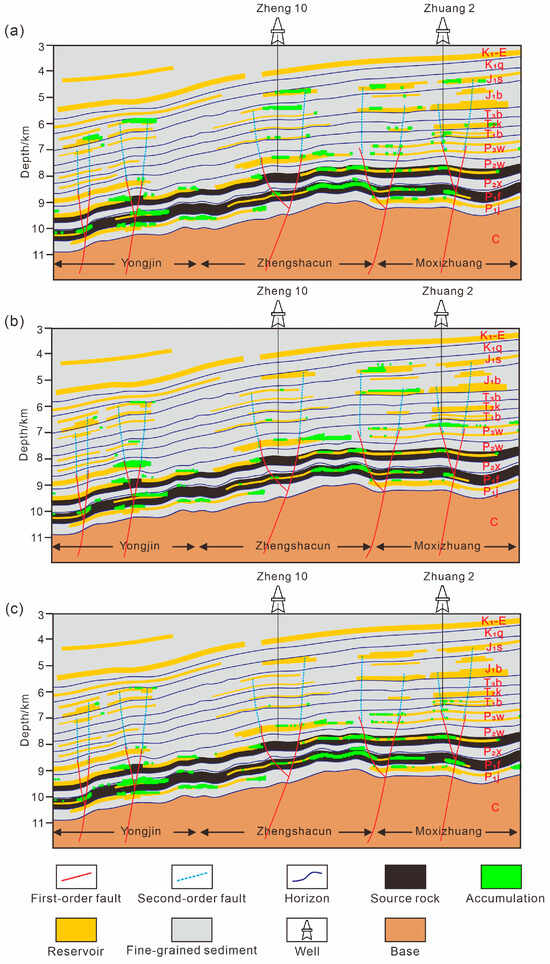
Figure 9.
Comparative hydrocarbon migration and accumulation results of (a) Model 4; (b) Model 5; (c) Model 6.
Note: The figures show the hydrocarbon accumulation results of Models 4–6. These models only involve co-sourcing of hydrocarbons from the source rocks of the Lower Wuerhe Formation and Fengcheng Formation. Compared with Models 1–3, the accumulation scale of extra-source hydrocarbon reservoirs has increased significantly, with specific accumulation amounts listed in Table 6.
4.3. Results of Hydrocarbon Phase States Simulation
The fluid phase simulation results from multiple geological models reveal significant variation in hydrocarbon fluid properties and phase characteristics (Table 7, Figure 10 and Figure 11). The results demonstrate that variation in source rock assemblages and fault activity histories serve as important controlling factors for the observed differences in fluid properties and phase behavior across the models.

Table 7.
Comparative hydrocarbon physical properties and phase simulation results across geological models.
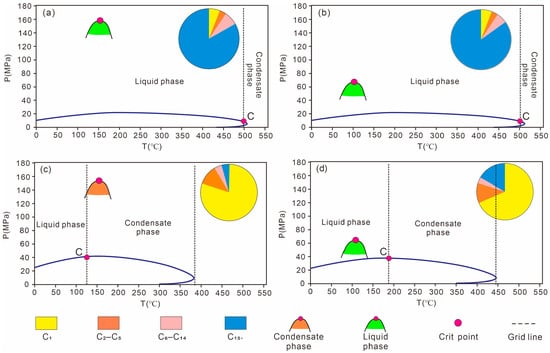
Figure 10.
PVT phase diagram of hydrocarbon fluids in (a) Upper Wuerhe Formation at 7389 m in Well Zheng 10, Model 1; (b) Sangonghe Formation at 4375 m in Well Zhuang 2, Model 1; (c) Upper Wuerhe Formation at 7389 m in Well Zheng 10, Model 4; (d) Sangonghe Formation at 4375 m in Well Zhuang 2, Model 4.
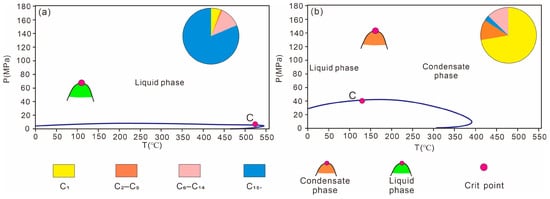
Figure 11.
PVT phase diagrams of hydrocarbon fluids in Model 5 reservoirs: (a) Badaowan Formation at 5392 m in Well Zheng 10; (b) Upper Wuerhe Formation at 6780 m in Well Zhuang 2. Note: Hydrocarbon fluid contents (C1, C2–C5, C6–C14, and C15+) are presented as molar percentages. In Model 5, both the phase states and compositions of hydrocarbons in the Upper Wuerhe Formation and Badaowan Formation exhibit significant differences: the Upper Wuerhe Formation is in condensate gas phase, while the Badaowan Formation is in liquid phase. This difference is closely related to fault activity.
In Models 1–3 and 6, where only the P2w source rock contributes hydrocarbons and fault activity is limited, the migrated natural gas volume to overlying reservoirs is constrained. These models exhibit hydrocarbon fluids with relatively low gas-oil ratios (0.06–198.25 m3/m3) and higher densities (0.82–0.83 g/cm3) and viscosities (4.95–7.68 mPa·s) (Table 7). Compositional analysis reveals a predominance of C6–C14 and C15+. Notably, the P3w reservoir at Well Zheng 10 exhibits a remarkably high C15+ content of 83.3% (Figure 10a). PVT diagrams display narrow two-phase regions, with formation temperatures below critical point temperatures (Tc) and formation pressures exceeding critical condensation pressures (Pm) (Figure 10a,b). In accordance with classification criteria of Yang et al. [80] and Qiao and Chen [81], these fluids in the reservoirs are identified as typical black oil systems.
Note: Hydrocarbon fluid contents (C1, C2–C5, C6–C14, and C15+) are presented as molar percentages. In Model 1, the phase states of hydrocarbon reservoirs in both the Sangonghe Formation and the Upper Wuerhe Formation are liquid phase. In Model 4, significant differences exist in the phase states of hydrocarbon reservoirs between the Upper Wuerhe Formation and the Sangonghe Formation: The Upper Wuerhe Formation is in condensate gas phase, while the Sangonghe Formation remains in liquid phase.
Compared with those in Models 1–3 and 6, the simulation results of Model 4 present distinctly different fluid characteristics, due to dual hydrocarbon contributions from both the P1f and P2w source rocks, coupled with multi-stage fault activity. The external reservoirs show significantly increased gas-oil ratios (2.29–558.69 m3/m3 in the Triassic-Jurassic and 113.68–1042.74 m3/m3 in the P3w formation) and reduced viscosities (4.88–7.61 mPa·s). C1 and C2–C5 component proportions increase substantially, reaching 80.02% for C1 and 11.2% for C2–C5 in P3w of Well Zheng 10 (Figure 10c, Table 7). With formation temperatures between critical temperature and critical condensation temperature and pressures above critical condensation pressure (Figure 10c), the P3w formation exhibits typical condensate gas phase behavior. The hydrocarbon fluids in the Triassic-Jurassic reservoirs also exhibit increased proportions of C1 and C2–C5, though to a lesser degree compared to those in the P3w. As exemplified by the J1s reservoir at 4375 m in Well Zhuang-2, the molar percentages of C1, C2–C5, C6–C14, and C15+ are 68.48%, 11.46%, 3.45%, and 16.61%, respectively. While these fluids maintain an oil-phase state, their PVT phase diagrams demonstrate significantly expanded two-phase envelope areas (Figure 10d) compared to those in Models 1–3, and 6 (Figure 10b).
Model 5 exhibits more complex vertical differentiation in fluid properties resulting from spatiotemporal variations in fault activity. In the upper reservoirs (T1b, T2k, and J1b formations), where faults connecting to source rocks became inactive after 120 Ma, hydrocarbon fluids show lower light component content and maintain oil phase characteristics (Figure 11a, Table 7). These fluids exhibit an average density of 0.83 g/cm3, viscosities ranging from 5.87 to 7.27 mPa·s, and GOR values varying between 3.61 and 205.22 m3/m3 (Table 7). In contrast, the Upper Wuerhe Formation benefits from multi-stage fault activity aligned with hydrocarbon generation-expulsion periods and dual source rock contributions, developing condensate gas with exceptionally high GOR (up to 1807.46 m3/m3, Figure 11b, Table 7), dominated by light components with significantly reduced density and viscosity. These contrasts highlight the crucial influence of temporal matching between fault activity episodes and hydrocarbon generation and expulsion periods on reservoir fluid properties and phase behavior.
5. Discussion
5.1. Influence of Source Rocks on Hydrocarbon Migration, Accumulation, Phase Behavior, and Composition
The compositional characteristics and expulsion volumes of hydrocarbons generated from source rocks significantly impact the hydrocarbon accumulation scale, fluid composition, and phase behavior in traps [81]. Comparative analysis reveals that compared with reservoirs solely sourced from the P2w, dual-sourced reservoirs (P2w + P1f) exhibit significant differences in hydrocarbon quantity, fluid composition, and physical properties in the overlying reservoirs. This divergence stems primarily from the distinct thermal maturation and hydrocarbon generation histories between the two source rocks (Figure 5, Figure 6 and Figure 7). The P1f source rock, characterized by greater burial depth and a higher thermal evolution degree, generates hydrocarbons with a significantly higher proportion of C1–C5 and altered physical properties, consequently influencing the phase behavior characteristics of migrated hydrocarbons in traps.
The composition of hydrocarbons migrated from source rocks determines the phase behavior by influencing the PVT phase envelopes, critical point temperature (Tc), critical point pressure (Pc), critical condensation temperature (Tm), and critical condensation pressure (Pm) [17,18]. Compared with the P2w source rocks, the P1f source rocks, characterized by greater burial depth and higher thermal maturity, generate hydrocarbons enriched in C1–C5. Consequently, hydrocarbons migrating from the P1f source rocks into overlying reservoirs via faults also exhibit higher proportions of these light components. This results in a decrease in the Tc and Tm and an increase in Pc and Pm. As a result, the fluid phase behavior of the hydrocarbon fluids in the reservoir tends to shift toward a condensate phase or gas phase [17,81,82,83].
Typical case studies confirm that the hydrocarbons in reservoirs from dual-source systems (Models 4–6) exhibit higher light hydrocarbon fractions (C1–C5) (Figure 12) and gas-oil ratios (Table 6) than those in single-source systems (Models 1–3). For instance, Well Zheng 10 in the P3w formation, Model 4 (dual-source), exhibits a higher gaseous component content and gas-oil ratio (1051.16 m3/m3), nearly 9.3 times higher than the 112.91 m3/m3 observed in the single-source scenario (Model 1). Correspondingly, Model 4’s PVT phase envelope displays a larger two-phase region, with Tc (125 °C) and Tm (380 °C) significantly lower than Model 1’s (500 °C and 510 °C), resulting in a condensate phase (Figure 10c) versus Model 1’s liquid phase (Figure 10a). This contrast clearly reveals the crucial influence of source rock assemblage on reservoir phase behavior.
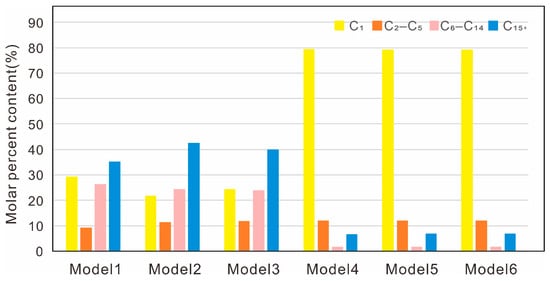
Figure 12.
Molar percentage composition of hydrocarbon generation products from source rocks.
Furthermore, the total hydrocarbon generation and expulsion of a dual-source system (P2w + P1f) substantially exceeds that of a single-source system. Consequently, hydrocarbon migration into the traps in the Permian, Triassic, and Jurassic formations results in greater amounts of hydrocarbon accumulation, larger reservoir scale, and higher saturation. Simulation results reveal that under identical geological parameters, Model 4 (dual source system) achieved hydrocarbon generation (441.84 Mt) and expulsion (289.95 Mt) volumes 3.5 and 2.8 times higher, respectively, than those of the single-source model (Model 1, generation 127.91 Mt, expulsion 104.89 Mt) (Table 5). This quantitative difference directly leads to enhanced hydrocarbon charging intensity, higher reservoir saturation, and increased accumulation numbers in Permian-Jurassic traps of Model 4 compared to Model 1 (Table 5, Figure 8a and Figure 9a).
5.2. Fault Activation Impacts on Hydrocarbon Migration and Phase Behavior
In the deep to ultradeep hydrocarbon accumulation processes within the study area, fault activity plays a crucial role in controlling hydrocarbon migration and accumulation. The spatiotemporal relationship between fault activation episodes and hydrocarbon generation-expulsion significantly influences both the efficiency and outcome of hydrocarbon migration [24,84,85,86]. Numerical simulations demonstrate that when faults remain inactive or exhibit limited activation after the peak hydrocarbon generation period, failing to align with the main phase of hydrocarbon expulsion, the accumulation volume in external reservoirs decreases substantially.
For instance, in Model 6, where all faults ceased activity after 120 Ma, hydrocarbons generated from the source rocks were largely retained within the source interval due to the lack of effective vertical migration pathways. This resulted in an intra-source accumulation of 83.14 Mt, accounting for 77.5% of the total generated hydrocarbons (107.29 Mt) (Figure 9c). Consequently, no significant hydrocarbon accumulations were found in the Jurassic J1s and J1b formations in Wells Zheng 10 and Zhuang 2, with only minor accumulations observed in the T2k, T1b, and P3w formations (Figure 9b). In contrast, Model 4, where faults remained active after 120 Ma, exhibited significantly higher numbers of hydrocarbon reservoirs and greater accumulation volumes outside source rocks compared to Model 6 (Table 6). This demonstrates that sustained fault activity during and after peak hydrocarbon generation is essential for efficient hydrocarbon migration and accumulation in external reservoirs.
The temporal-spatial coupling between fault activity and peak hydrocarbon generation not only affects migration-accumulation efficiency but also profoundly influences the hydrocarbon composition, physical properties, and phase behavior in the reservoirs. Comparative analysis between Model 5 and Model 6 reveals that in Model 5, the first-order faults remained active after 120 Ma, whereas in Model 6, the first-order faults ceased activity after 120 Ma.
This allowed large amounts of light components generated during the gas generation stage of the Well Zhuang 2 source rocks to migrate into the P3w reservoir. The current gas-oil ratio in this reservoir is as high as 1348.60 m3/m3, with hydrocarbon components dominated by C1 (72.17%) and C2–C5 (11.91%), while C6–C14 and C15+ account for only 3.18% and 12.74%, respectively (Figure 13a). Under the reservoir temperature and pressure conditions (161.79 °C, 144.21 MPa), the hydrocarbon fluid phase exhibits typical condensate gas phase characteristics (Figure 13a). Conversely, in Model 6, the first-order faults became sealed after 120 Ma, preventing the effective migration of later-generated natural gas. The hydrocarbon fluids in the P3w reservoir are dominated by C6–C14 and C15+ (C1: 5.76%; C2–C5: 2.87%; C6–C14: 11.00%; C15+: 80.37%), with a gas-oil ratio of only 4.05 m3/m3 (Figure 13b). Despite similar reservoir temperature and pressure conditions (161.62 °C, 153.36 MPa), the compositional differences result in the hydrocarbon fluid phase exhibiting liquid phase characteristics, with a significantly reduced two-phase region in the phase envelope (Figure 13b). This comparison clearly demonstrates that sustained fault activity during the gas generation stage of source rocks is a critical controlling factor for the large-scale migration of light components into reservoirs and the formation of high gas-oil ratio condensate gas phase fluids.
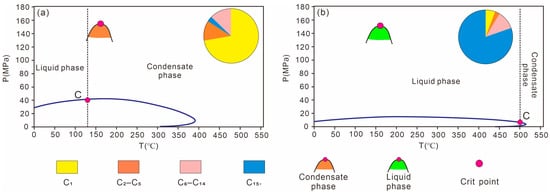
Figure 13.
PVT phase diagrams of hydrocarbon fluids in the P3w reservoir at 6780 m in Well Zhuang 2. (a) Model 5; (b) Model 6. Note: Hydrocarbon fluid component contents (C1, C2–C5, C6–C14, and C15+) are expressed as molar percentages.
Similarly, this study implemented necessary simplifications in fault system modeling during the geological modeling process. Regarding fault hierarchy, only first-order and second-order faults were considered for their control on hydrocarbon migration, while third-order faults were excluded from the analysis. In characterizing fault activity, the complex fault opening process was simplified to a binary state (open or closed) at discrete time points, without fully accounting for critical factors such as the dynamic processes of pressure accumulation and release, spatiotemporal variations in fault slip rates, and permeability differences among various fault types. Although these simplifications enhanced computational efficiency, they may compromise the accuracy of hydrocarbon migration simulations. Therefore, future research should incorporate third-order faults into the model, with particular focus on establishing a pressure-fault opening coupling mechanism. This involves developing a coupled dynamic model for pressure-fault opening, quantifying permeability characteristics across different fault types, and conducting in-depth analysis of both the temporal characteristics of fault opening sequences and permeability variations among fault types. Such improvements will enable more precise elucidation of how fault systems control hydrocarbon migration efficiency and phase behavior evolution.
5.3. Hydrocarbon Migration and Phase Evolution in the Mo-Yong Reservoirs
Previous studies demonstrate that hydrocarbons generated by Permian source rocks migrated upward through fault systems into Permian-Jurassic reservoirs. Permian and Triassic reservoirs experienced three charging periods during the Jurassic, Cretaceous, and Paleogene [87], while Jurassic reservoirs have primarily undergone two charging events in the Cretaceous and Neogene [88,89]. A comprehensive analysis integrating fault activation episodes, peak hydrocarbon generation timing, and charging history, along with comparative studies between simulated results and actual drilling data (including fluid properties, composition, GOR, and phase behavior), reveals that Model 4 best matches the geological data obtained in Well Zheng 10 and other wells (Figure 9a, Table 7 and Table 8).

Table 8.
Comparison of simulated and measured fluid properties and phase state in Wells Zheng 10 and Zhuang 2 (Model 4).
The simulations of Models 1–3, which excluded hydrocarbon contribution from the P1f source rocks, significantly decreased the quantity and scale of hydrocarbon accumulations beyond the source rock intervals. These models showed substantial discrepancies between the simulated results and actual conditions. In Models 2 and 3, no effective hydrocarbon accumulations were formed in the T1b and T2k or the Jurassic reservoirs in the Zheng 10 and Zhuang 2 well areas (Table 1 and Table 5). Moreover, the hydrocarbon phase in the P3w at Well Zheng 10 was simulated as black oil, which contradicts the actual condensate gas phase observed in drilling (Table 1 and Table 5). Although Model 1 simulated minor hydrocarbon accumulation in the J1s at Well Zhuang 2, it failed to generate effective accumulations in the Triassic, and the black oil phase in the P3w at Well Zheng 10 also deviates from drilling results (Table 1 and Table 5).
In the dual-source models (P1f and P2w source rocks), Models 5 and 6 still show notable discrepancies in reservoir distribution, fluid properties, and phase behavior. In Model 5, no effective accumulations were formed in the T1b and T2k or the Jurassic reservoirs at Zhuang 2 (Figure 9b, Table 1 and Table 6). At Well Zheng 10, although hydrocarbons accumulated in the P3w and J1b formations, the quantity was small, and no effective accumulation occurred in the T2k formation (Table 1 and Table 6). Additionally, the GOR and phase (black oil) in the P3w formation did not match drilling data (Figure 13a, Table 1 and Table 7). In Model 6, no effective accumulations were formed in the T1b and T2k formations or the Jurassic reservoirs at Wells Zheng 10 and Zhuang 2 (Figure 9c, Table 1 and Table 6), and the black oil phase in the P3w at Zheng 10 also contradicts drilling results (Table 1 and Table 7).
In contrast, Model 4, which incorporated a dual-source system, showed good agreement with drilling data in terms of hydrocarbon accumulation distribution, fluid composition, physical properties, and phase behavior. The simulated hydrocarbon shows at Wells Zheng 10 and Zhuang 2 also aligned well with drilling results (Table 8 and Table 9). This further confirms the significant contribution of the P2w and P1f source rocks to overlying hydrocarbon accumulations (P3w, T1b, T2k, J1b, J1s) in the study area. Historically, there has been controversy over the oil source in the Mo-Yong Block of the Junggar Basin. In Li et al. [90], through oil-oil correlation studies, it was found that there may be multiple sets of source rocks in the study area, such as Lower Permian source rocks, Lower Wuerhe Formation source rocks, and Jurassic source rocks. Wu et al. [91] reported that deep Triassic lacustrine mudstones in the Junggar Basin may have certain oil-generating potential and could also act as source rocks. Additionally, several studies have indicated that the Fengcheng Formation and Lower Wuerhe Formation are important oil sources [7,50]. These findings provide important references for understanding the diversity of source rocks in the region. While the simulation results of this study do not negate the possibility of the existence of multiple sets of source rocks, they focus on confirming the effectiveness of two deep-seated source rocks: the Fengcheng Formation and the Lower Wuerhe Formation.

Table 9.
Comparison of measured and simulated hydrocarbon fluid compositions in the P3w reservoir of Well Zheng 10.
Based on simulations of temperature and pressure evolution, hydrocarbon generation history, hydrocarbon migration and accumulation processes, and the composition, physical properties, and phase behavior of hydrocarbon fluids in reservoirs in Model 4, this study proposed a model of the hydrocarbon migration-accumulation and phase evolution history of deep to ultradeep reservoirs in the Mo-Yong Area. This model involves hydrocarbon supply from two sets of source rocks: the Upper Wuerhe Formation and the Fengcheng Formation (Figure 9a), which provide the material basis for hydrocarbon migration. Faults were activated multiple times during the hydrocarbon generation process of the source rocks (Table 4, Model 4), and the model verifies three major fault activation events during the hydrocarbon generation period of the source rocks: Late Triassic to late Middle Jurassic, Late Jurassic to the end of Early Cretaceous, and Paleogene to the present.
Hydrocarbons generated by the source rocks migrated along faults to extra-source reservoirs. As organic matter continued to mature thermally, the content of generated natural gas increased, with more and more natural gas being expelled from the source rocks. Among these, the Upper Wuerhe Formation reservoirs, which are closest to the source rocks, received sufficient natural gas injection, causing crude oil to undergo retrograde evaporation and form the current condensate gas phase. In contrast, due to gas loss during migration, the Triassic and Jurassic reservoirs far from the source rocks have low natural gas content, failing to induce retrograde evaporation. The specific process is as follows:
Late Triassic to late Middle Jurassic (Early Oil Accumulation Stage): During the P1f source rocks’ peak oil generation and the P2w early maturity stage, frequent fault activation facilitated hydrocarbon vertically migrating into the overlying P3w, T1b, and T2k reservoirs, forming small-scale oil accumulations (Figure 14a). The accumulated hydrocarbon masses were 3.37 Mt, 0.17 Mt, and 0.34 Mt, respectively. Reservoir fluids, dominated by C6–C14 and C15+ components, exhibited typical oil phase characteristics with density 0.86–0.87 g/cm3, viscosity 9.71–10.52 mPa·s, and GOR below 30 m3/m3 (Figure 14b,c).
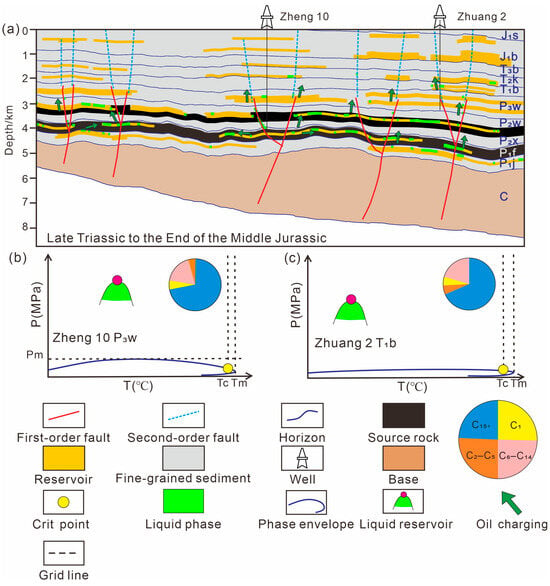
Figure 14.
The model of oil and gas accumulation and phase evolution process from the Late Triassic to the end of the Middle Jurassic. (a) Results of hydrocarbon migration and accumulation; (b) PVT phase diagram of hydrocarbon fluids in the Upper Wuerhe Formation reservoir, Well Zheng 10; (c) PVT phase diagram of hydrocarbon fluids in the Baikouquan Formation reservoir, Well Zhuang 2. Note: The dashed lines in the figure indicate the temperature–pressure grid.
Late Jurassic to the end of the Early Cretaceous (Hydrocarbon Mixing Stage): As the P1f source rocks entered the gas generation stage and the P2w source rocks reached peak oil generation, the generating products of light components (C1–C5) increased significantly, while heavy fractions (C15+) decreased. Fault reactivation enabled continued vertical migration of the hydrocarbons into the overlying reservoirs, where they mixed with previously accumulated oils (Figure 15a). The scale of hydrocarbon accumulations expanded, with masses of 5.23 Mt (P3w), 1.24 Mt (T1b), and 2.75 Mt (T2k), respectively. Fluid densities decreased to 0.85–0.87 g/cm3, viscosities decreased to 8.40–9.23 mPa·s, and GOR increased to 50.34–124.52 m3/m3. The phase envelope expanded, but the phase remained liquid as reservoir pressure exceeded the critical condensate pressure and temperature remained below the critical point (Figure 15b,c). Meanwhile, hydrocarbons also migrated into the Jurassic J1s and J1b formations, forming oil-phase accumulations of 31.63 Mt and 27.27 Mt, respectively (Figure 15a). The phase states of hydrocarbon in Jurassic reservoirs are liquid phase (Figure 15d).
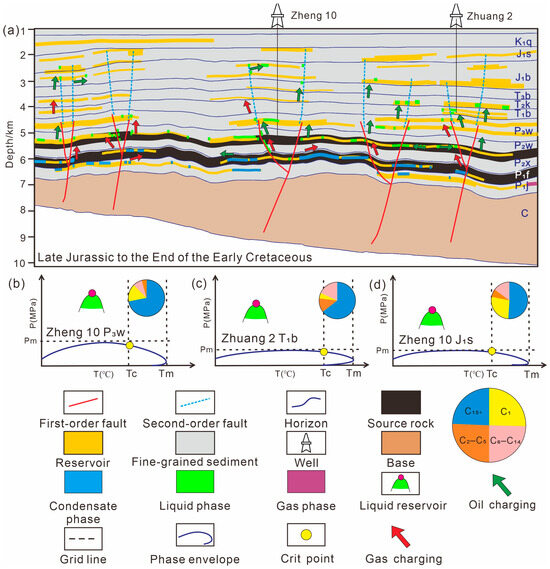
Figure 15.
The model of hydrocarbon accumulation and phase behavior from the Late Jurassic to the end of the Early Cretaceous. (a) Results of hydrocarbon migration and accumulation; (b) PVT phase diagram of hydrocarbon fluids in the Upper Wuerhe Formation reservoir, Well Zheng 10; (c) PVT phase diagram of hydrocarbon fluids in the Baikouquan Formation reservoir, Well Zhuang 2; (d) PVT phase diagram of hydrocarbon fluids in the Sangonghe Formation reservoir, Well Zheng 10. Note: The dashed lines in the figure indicate the temperature–pressure grid.
From the Late Cretaceous onward, the source rocks, predominantly generating gas and undergoing oil cracking, have light component proportions of generated hydrocarbons increased further. Post-Paleogene fault reactivation enabled gas-rich fluid migration and mixing with existing accumulations (Figure 16a). Current reserves reached 22.12 Mt (P3w), 0.93 Mt (T1b), 6.2 Mt (T2k), 36.17 Mt (J1b), and 92.7 Mt (J1s). Intensive gas invasion at Wells Zheng 10 and Zhuang 2 caused oil reverse vaporization, evidenced by expanded two-phase envelope, decreased critical and Tm, and increased cricondenbar pressure, ultimately transforming the fluid phase from liquid to condensate gas under current reservoir conditions (temperature between critical and critical condensation temperature, pressure exceeding cricondenbar) (Figure 16b).
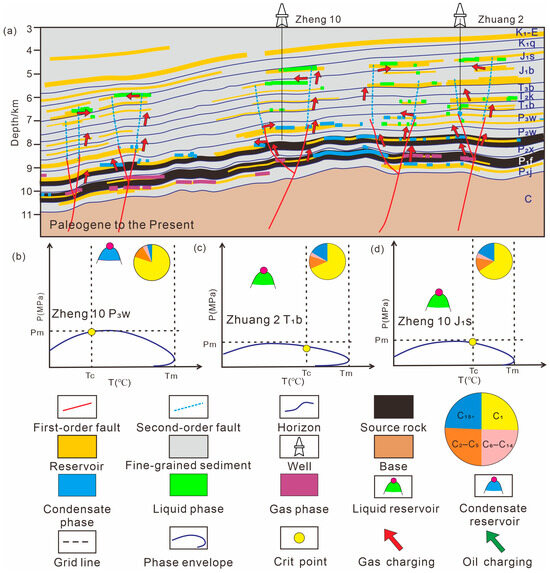
Figure 16.
The model of hydrocarbon accumulation and phase behavior from the Paleogene to the present. (a) Results of hydrocarbon migration and accumulation; (b) PVT phase diagram of hydrocarbon fluids in the Upper Wuerhe Formation reservoir, Well Zheng 10; (c) PVT phase diagram of hydrocarbon fluids in the Baikouquan Formation reservoir, Well Zhuang 2; (d) PVT phase diagram of hydrocarbon fluids in the Sangonghe Formation reservoir, Well Zheng 10. Note: The dashed lines in the figure indicate the temperature–pressure grid.
Notably, gas invasion impacts varied significantly across reservoirs. Although T2k, T1b, J1s, and J1b formations all received gas charge (fluid density 0.82–0.83 g/cm3; viscosity 4.88–7.75 mPa·s), relatively weaker influx (GOR = 2.29–558.69 m3/m3) prevented substantial reverse vaporization. PVT analysis confirms that these reservoirs maintain the oil phase, as Tm remains much higher than reservoir temperatures while cricondenbar pressures stay below reservoir pressures (Figure 16c,d). This differential phase evolution highlights the complex hydrocarbon accumulation history in ultradeep reservoirs.
It should be emphasized that while this study has investigated the impacts of various source rock combinations and fault activities on hydrocarbon migration and fluid phase behavior, establishing corresponding geological models, several simplifications and assumptions remain in the current modeling approach, as previously mentioned. The necessary simplifications made during model construction regarding source rock heterogeneity and fault activation mechanisms may affect the accuracy of simulation results. Although the study highlights the critical role of fault conduits, it does not thoroughly examine how sandstone reservoir properties (such as porosity and permeability) control phase behavior differentiation. The assumption of instantaneous phase equilibrium in reservoirs (using the SRK equation of state) may not fully capture potential non-equilibrium differentiation phenomena (e.g., compositional gradient variations during gas invasion) that occur in actual geological processes. More importantly, the adoption of two-dimensional cross-sectional simulations may inadequately represent the complexity of hydrocarbon migration pathways and phase behavior differentiation in three-dimensional space (including lateral migration and local structural controls).
To address these limitations, future research should focus on developing three-dimensional geological models that incorporate reservoir porosity and permeability heterogeneity. The introduction of non-equilibrium phase behavior models (such as combining flash calculations with kinetic differentiation) would better simulate fluid mixing behaviors under actual reservoir conditions. Additionally, machine learning methods could be employed to conduct sensitivity analyses of key parameters including source rock combinations, reservoir heterogeneity, temperature-pressure conditions, and fault characteristics. This approach would help identify and quantify the relative contributions of these parameters to hydrocarbon migration and phase evolution. Such advancements would significantly enhance our understanding of hydrocarbon accumulation mechanisms, phase behavior evolution, and distribution patterns in deep to ultradeep reservoirs, providing more reliable scientific foundations for exploration practices.
These methodological improvements would not only refine the accuracy of simulation results but also offer more comprehensive insights into the complex interplay between geological factors and fluid behaviors in deep petroleum systems. The integration of advanced computational techniques with geological models represents a promising direction for future research in this field.
5.4. The Influence of Other Parameters on Hydrocarbon Migration and Phase Behavior
The equation of state (EoS) is critical for phase equilibrium calculations. This study employs the Soave–Redlich–Kwong (SRK) equation, and, as assumed in Section 3.3, gas injected into the reservoir can rapidly reach equilibrium. However, the assumption of instantaneous phase equilibrium in reservoirs may fail to fully capture potential non-equilibrium fractionation phenomena occurring in actual geological processes (e.g., compositional gradient changes during gas invasion). In addition to the SRK equation, the Peng–Robinson equation of state can also be used to calculate phase equilibrium for liquid-gas two-phase fluids, yielding PVT phase diagrams [92]. In this study, two hydrocarbon fluids with identical compositions were subjected to calculations using these two equations of state and retrograde phase diagrams, respectively. The results from the two equations exhibit differences, though the discrepancies are minor. Specifically, compared to the SRK equation (blue solid line), the Peng–Robinson equation of state (red dashed line) yields lower critical temperature and critical condensation temperature, as well as higher critical pressure and critical condensation pressure. However, this has little impact on the hydrocarbon phase states in reservoirs: the Upper Wuerhe Formation at 7389 m in Well Zheng 10 (Model 4) is identified as condensate gas phase in both phase diagrams (Figure 17a), and the Sangonghe Formation at 4375 m in Well Zhuang 2 (Model 4) is characterized as liquid phase in both phase diagrams (Figure 17b). Thus, the choice of equation of state has a minor influence on the results of phase behavior simulations.
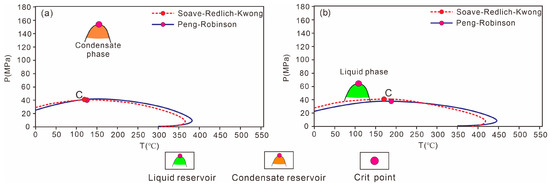
Figure 17.
PVT phase diagrams calculated by the Peng–Robinson and Soave–Redlich–Kwong equations of state. (a) PVT phase diagram of hydrocarbon fluids in the Upper Wuerhe Formation reservoir, Well Zheng 10; (b) PVT phase diagram of hydrocarbon fluids in the Sangonghe Formation reservoir, Well Zhuang 2.
Furthermore, the SRK equation of state is only applicable to gas and liquid phases; it becomes inapplicable in the presence of asphaltenes. In such cases, the Flory–Huggins–Zuo equation of state (FHZ EoS) must be introduced to describe the concentration gradient of asphaltenes and their phase behavior [93]. Although current drilling data have not yet revealed the presence of asphaltenes, the possibility of their existence cannot be ruled out as the coring scope expands.
Grid resolution also affects the simulation results of the model. This analysis adopts two grid schemes: the original model (Sample 1) and a 1× sparse grid model (Sample 2, where the number of grids in both horizontal and vertical directions is 1/2 of that in the original model).
Simulation results show that the hydrocarbon accumulation within source rocks in the sparse model (Sample 2) is 119.26 Mt, significantly lower than that in the original model. In contrast, its extra-source hydrocarbon accumulation is 192.12 Mt, which is significantly higher than the 158.13 Mt in the original model (Table 10). This is because grid resolution influences fault width: reduced grid density leads to greater fault width, thereby increasing the amounts of hydrocarbons migrating along faults to extra-source areas. Phase behavior simulation results indicate that the phase distribution pattern is unaffected by grid size: the Lower Wuerhe Formation remains in condensate gas phase, while the Triassic Karamay Formation, Baikouquan Formation, Badaowan Formation, and Sangonghe Formation are in liquid phase (Figure 18). In summary, although grid size impacts the quantitative results of hydrocarbon accumulation (primarily related to the characterization accuracy of fault migration pathways), the model’s core conclusions—including phase distribution characteristics, main hydrocarbon migration pathways, and relative accumulation trends inside and outside source rocks—remain stable.

Table 10.
Comparison of migration and accumulation results between Sample 1 and Sample 2.
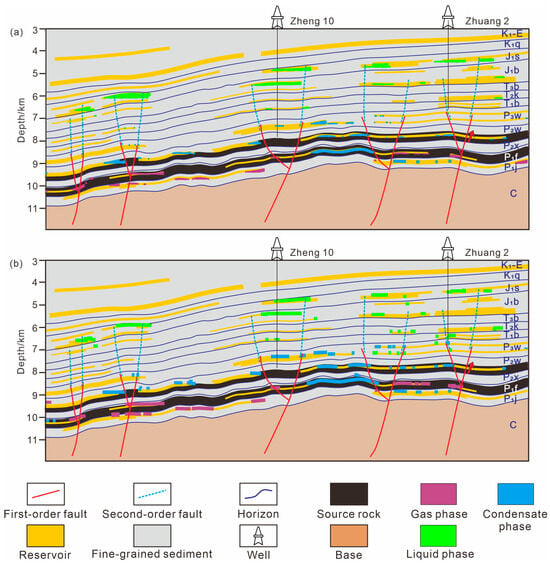
Figure 18.
Comparison of hydrocarbon migration-accumulation and phase behavior simulation results between the sparse grid model (a) and the original model (b).
It should be noted that this study employed necessary simplifications regarding source rock heterogeneity. In our geological modeling, we assumed uniform organic matter types, total organic carbon (TOC) content, and hydrogen index (HI) values for both the P1f and P2w Formation source rocks in lateral distribution, without fully accounting for spatial variations in these parameters. However, in actual geological conditions, organic geochemical parameters of source rocks typically exhibit significant spatial heterogeneity. Such non-uniform characteristics may potentially affect the simulation accuracy of hydrocarbon generation product distribution.
Furthermore, the current study did not comprehensively consider the dynamic variations in expulsion efficiency among different source rocks at various maturity stages. This simplification might introduce potential biases in estimating hydrocarbon migration-accumulation processes and the relative proportions of light versus heavy hydrocarbon components. Therefore, in future research, it is necessary to further optimize the source rock model by considering the spatial variations of source rock parameters and the dynamic changes in hydrocarbon expulsion efficiency, so as to make the understanding of the influence of source rock configuration on hydrocarbon migration and accumulation, hydrocarbon phase, and component distribution more reasonable.
Additionally, in future work, we aim to advance the research in the following aspects: On one hand, we will introduce more advanced uncertainty modeling methods, including the use of Monte Carlo simulation for multi-scenario random sampling analysis and the development of agent models (e.g., response surface models, neural network models) to improve computational efficiency under complex geological conditions, thereby more systematically characterizing the uncertainty range of model outputs [94,95]. On the other hand, we will conduct targeted quantitative evaluations of parameter sensitivity, specifically by combining the single-factor perturbation method (changing parameter values one by one to observe variations in model responses) with global sensitivity analysis (such as the Sobol method) [95,96]. This will enable comprehensive identification of key parameters that significantly influence hydrocarbon migration and accumulation simulation results (e.g., hydrocarbon generation intensity of source rocks, fault conductivity, reservoir porosity, and permeability parameters), as well as clarification of the sensitivity weights of each parameter and the laws governing their interactions.
6. Conclusions
This study established a geological model and utilized numerical simulation methods to reconstruct the thermal maturity and hydrocarbon generation-expulsion evolution history of source rocks, as well as the processes of hydrocarbon migration-accumulation and phase evolution. The main conclusions are as follows:
- (1)
- The simulation results confirm that the hydrocarbon reservoirs in the Permian, Triassic, and Jurassic areas of the study area originate from both the Lower Wuerhe Formation and Fengcheng Formation source rocks. The P2w source rocks entered the oil generation window during the Late Triassic to Early Jurassic, reached the peak oil generation stage by the end of the Early Cretaceous, and began to generate gas in large quantities at the end of the Late Cretaceous. The P1f source rocks started generating in the Early Permian, with the oil generation window lasting until the end of the Early Jurassic, entered the peak oil generation stage during the Late Triassic, and began to generate gas in large quantities at the end of the Early Cretaceous.
- (2)
- The coupling relationship between source rock configuration, hydrocarbon generation peaks, and fault activity influences hydrocarbon migration-accumulation, hydrocarbon composition, and phase evolution. Compared to a single source rock system (only the P2w), the dual-source system (P1f + P2w) can form larger-scale, more numerous, higher-saturation, and lighter-component-rich hydrocarbon accumulations, with hydrocarbon fluid phases tending more toward condensate gas or gas phases. As a critical pathway for hydrocarbon migration, the matching relationship between the multi-stage opening of faults and the hydrocarbon generation peaks of source rocks has a significant influence on hydrocarbon migration efficiency, hydrocarbon fluid component composition, and phase evolution. In particular, the sustained activity of faults during and after the hydrocarbon generation peak not only promotes the migration and accumulation of lighter components but also leads to a shift in fluid phase toward condensate gas by increasing the gas-oil ratio.
- (3)
- The deep to ultradeep petroleum systems in the Mo-Yong area have experienced a characteristic “early-oil and late-gas” mixed migration process. During the Late Triassic to Middle Jurassic, when the P1f source rocks reached the peak oil generation and the P2w source rocks entered the early mature stage, activated first-order and second-order faults served as conduits for hydrocarbon migration. This resulted in the formation of small-scale initial accumulations dominated by liquid-phase hydrocarbons in the Upper Wuerhe Formation (Permian), Baikouquan Formation (Triassic), and Karamay Formation (Triassic) reservoirs.
The Late Jurassic to Early Cretaceous witnessed significant changes as source rock maturity increased and the Fengcheng Formation began generating gas. The resultant enrichment of light hydrocarbon components, coupled with continued fault activity, led to secondary migration and mixing with pre-existing oil accumulations. This process expanded the accumulation scale and elevated the gas-oil ratio while maintaining a liquid-phase state. Concurrently, partial hydrocarbon migration formed accumulations in the Jurassic Sangonghe and Badaowan Formations.
From the Paleogene to the present, accelerated gas generation rates and enhanced crude oil cracking further increased the proportion of light components. Continuous fault activity facilitated additional hydrocarbon migration and mixing, substantially enlarging accumulation volumes. Notably, sufficient late-stage gas injection into the Upper Wuerhe Formation reservoirs triggered retrograde evaporation, transforming the fluid phase into condensate gas. In contrast, other reservoirs retained their oil-phase characteristics, demonstrating distinct phase differentiation controlled by the interplay of source rock evolution and structural dynamics.
Author Contributions
Conceptualization, Y.L. (Yuhong Lei) and L.Z.; methodology, B.X. and C.L.; investigation, B.X.; resources, Y.L. (Yuhong Lei), L.Z., J.W., Z.Z. and N.L.; data curation, B.X., Y.L. (Yan Li) and Y.J.; writing—original draft preparation, B.X.; writing—review and editing, J.W., Z.Z., Y.L. (Yuhong Lei) and B.X.; visualization, B.X.; supervision, Y.L. (Yuhong Lei), L.Z. and N.L.; project administration, Y.L. (Yuhong Lei) and L.Z.; funding acquisition, Y.L. (Yuhong Lei). and L.Z. All authors have read and agreed to the published version of the manuscript.
Funding
This research was funded by the National Natural Science Foundation of China (grant numbers: 42030808) and the Chinese Academy of Sciences Special Program for Seizing the Commanding Heights of Science and Technology (grant numbers: GJ05010202).
Institutional Review Board Statement
Not applicable.
Informed Consent Statement
Not applicable.
Data Availability Statement
The original contributions presented in this study are included in the article. Further inquiries can be directed to the corresponding author.
Acknowledgments
The study would not have been possible without the support from Shengli Oilfield Company (SINOPEC), Dongying, China. We thank Shengli Oilfield Company (SINOPEC) for permission to publish this work.
Conflicts of Interest
Author Chao Li was employed by the company SINOPEC Petroleum Exploration and Production Research Institute. Authors Jinduo Wang and Zhiping Zeng were employed by the company Shengli Oilfield Company (SINOPEC). The remaining authors declare that the research was conducted in the absence of any commercial or financial relationships that could be construed as a potential conflict of interest.
Abbreviations
The following abbreviations are used in this manuscript:
| P1j | Jiamuhe Formation |
| P1f | Fengcheng Formation |
| P2x | Xiazijie Formation |
| P2w | Lower Wuerhe Formation |
| P3w | Upper Wuerhe Formation |
| T1b | Baikouquan Formation |
| T2k | Karamay Formation |
| T3b | Baijiantan Formation |
| J1b | Badaowan Formation |
| J1s | Sangonghe Formation |
| J2x | Xishanyao Formation |
| J3q | Qigu Formation |
| J3k | Karazha Formation |
| TOC | total organic carbon |
| Ro | vitrinite reflectance |
| HI | Hydrogen Index |
| SWIT | Paleo-sediment–water interface temperature |
| GOR | gas-oil ratio |
| SRK | Soave–Redlich–Kwong |
| Tc | critical point temperature |
| Pc | critical point pressure |
| Tm | critical condensation temperature |
| Pm | critical condensation pressure |
| Mt | metric tons |
| mgHC/gTOC | milligrams of hydrocarbon per gram of total organic carbon |
| PVT | pressure-volume-temperature |
| EoS | equation of state |
References
- Cao, Y.; Yuan, G.; Yang, H.; Wang, Y.; Liu, K.; Zan, N.; Xi, K.; Wang, J. Current status of oil and gas exploration and research progress on the genesis of high-quality reservoirs in deep–ultra-deep clastic rocks of petroliferous basins. Acta Petrol. Sin. 2022, 43, 112–140. [Google Scholar]
- Ma, Y.; Xunyu, C.; Lu, Y.; Zongjie, L.; Huili, L.; Shang, D.; Peirong, Z. Practice and theoretical and technical progress in exploration and development of Shunbei ultra-deep carbonate oil and gas field, Tarim Basin, NW China. Pet. Explor. Dev. 2022, 49, 1–20. [Google Scholar] [CrossRef]
- Zhang, Z.; Guo, Y.; Lv, D.; Lu, M.; Wang, T.; Wang, L.; Zheng, G.; Zhang, Y.; Wang, B.; Duan, G. High-latitude continental evidence of the Jenkyns Event: Insights from the Southern Junggar Basin, NW China. Glob. Planet. Change 2025, 254, 105007. [Google Scholar] [CrossRef]
- Zhi, D.; Gong, D.; Liu, M.; Santosh, M.; Qin, Z.; Ren, Q.; Chen, X.; Zou, H. Evolution of Paleozoic West Junggar Basin, NW China: Seismic data, detrital zircon evidence from Earth’s oldest alkali lake deposit. Geosci. Front. 2024, 15, 101887. [Google Scholar] [CrossRef]
- Zhang, J.-Q.; Yu, F.-S.; Wang, Y.-F.; Shen, Z.-Y.; Xiu, J.-L.; Xue, Y.; Shao, L.-F. Multi-phase deformation and analogue modelling of the Junggar Basin, NW China. Pet. Sci. 2024, 21, 3720–3741. [Google Scholar] [CrossRef]
- Li, B.; Tang, Y.; Chen, Z.; Wang, Y.; He, D.; Yan, K.; Chen, L. The Geochemical Characteristics of Source Rock and Oil in the Fukang Sag, Junggar Basin, NW China. Minerals 2023, 13, 432. [Google Scholar] [CrossRef]
- Wang, X. Source Rocks and Gas Gepchemistry in Junggar Basin; Petroleum Industry Press: Beijing, China, 2013. [Google Scholar]
- Zhang, Z.; Zhang, Y.; Zhang, M.; Lu, H.; Zhang, R.; Chen, Y.; Wang, H.; Li, P. Main Controlling Factors of Oil and Gas Accumulation and Exploration Direction in the Permian-Triassic of the Central Depression, Junggar Basin. Pet. Geol. Exp. 2022, 44, 559–568. [Google Scholar]
- Li, J.; Wang, X.; Yang, F.; Song, Y.; Abulimiti, Y.; Bian, B.; Liu, H.; Wang, X.; Gong, D. Hydrocarbon Accumulation Patterns and Exploration Prospects of the Lower Combination in the Western Part of the Central Depression, Junggar Basin. Oil Gas Geol. 2022, 43, 1059–1072. [Google Scholar] [CrossRef]
- Cai, H.; Jin, J.; Li, E.; Zhang, Z.; Yu, S.; Pan, C. Chemometric differentiation of oil families in the Mahu sag, Junggar Basin, NW China. Pet. Sci. 2025; in press. [Google Scholar] [CrossRef]
- Wang, D.; Hu, H.; Zou, J.; Wang, T.; Zhu, G.; Chen, X.; Liang, S. Formation and Enrichment Conditions of Lower Permian Shale Gas in the Dongdaohaizi Depression, Junggar Basin, and Its Main Controlling Factors. Bull. Geol. Sci. Technol. 2024, 43, 98–112. [Google Scholar]
- Wei, L.; Zhihuan, Z.; Yongcai, Y.; Xianlong, M. Oil source of reservoirs in the hinterland of the Junggar basin. Pet. Sci. 2007, 4, 34–43. [Google Scholar] [CrossRef]
- Ablimiti, Y.; He, W.; Li, N.; Ma, D.; Liu, H.; Bian, B.; Ding, X.; Jiang, M.; Wang, J.; Cao, J. Mechanisms of deep oil–gas accumulation: New insights from the Carboniferous Central Depression, Junggar Basin, China. Front. Earth Sci. 2022, 10, 987822. [Google Scholar] [CrossRef]
- Xu, B.; Lei, Y.; Zhang, L.; Li, C.; Wang, J.; Zeng, Z.; Li, S.; Cheng, M.; Zhang, Z.; Xie, J. Hydrocarbon Phase State Evolution and Accumulation Process of Ultradeep Permian Reservoirs in Shawan Sag, Junggar Basin, NW China. Energy Fuels 2023, 37, 12762–12775. [Google Scholar] [CrossRef]
- Pang, X.; Zhou, X.; Jiang, Z.; Wang, Z.; Li, S.; Tian, J.; Xiang, C.; Yang, H.; Chen, D.; Yang, W.; et al. Hydrocarbon Reservoirs Formation, Evolution, Prediction and Evaluation in the Superimposed Basins. Acta Geol. Sin. 2012, 86, 1–103. [Google Scholar]
- Luo, X.; Zhang, L.; Fu, X.; Pang, H.; Zhou, B.; Wang, Z. Advances in the Study of Deep Oil and Gas Accumulation Dynamics. Bull. Mineral. Petrol. Geochem. 2016, 35, 876–889. [Google Scholar] [CrossRef]
- Di Primio, R.; Dieckmann, V.; Mills, N. PVT and phase behaviour analysis in petroleum exploration. Org. Geochem. 1998, 29, 207–222. [Google Scholar] [CrossRef]
- Primio, R.D.; Horsfield, B. From petroleum-type organofacies to hydrocarbon phase prediction. AAPG Bull. 2006, 90, 1031–1058. [Google Scholar] [CrossRef]
- Wei, G.; Yang, W.; Du, J.; Xu, C.; Zou, C.; Xie, W.; Wu, S.; Zeng, F. Tectonic features of Gaoshiti-Moxi paleo-uplift and its controls on the formation of a giant gas field, Sichuan Basin, SW China. Pet. Explor. Dev. 2015, 42, 283–292. [Google Scholar] [CrossRef]
- Su, J.; Yang, H.; Wang, Y.; Xiao, Z.; Zhang, B.; Wang, X.; Bi, L. Controls by organic geochemistry trackers of secondary hydrocarbon accumulation during Neotectonic central uplift of the Tarim basin. J. Pet. Sci. Eng. 2015, 128, 150–159. [Google Scholar] [CrossRef]
- Liu, X.; Fan, J.; Jiang, H.; Pironon, J.; Chen, H.; Li, C.; Lu, X.; Yu, X.; Ostadhassan, M. Fluid history of the lower Cambrian Longwangmiao Formation in the Anyue gas field (Sichuan Basin, SW China). Geoenergy Sci. Eng. 2023, 231, 212308. [Google Scholar] [CrossRef]
- Horstad, I.; Larter, S.R.; Mills, N. A quantitative model of biological petroleum degradation within the Brent Group reservoir in the Gullfaks Field, Norwegian North Sea. Org. Geochem. 1992, 19, 107–117. [Google Scholar] [CrossRef]
- Larter, S.; Huang, H.; Adams, J.; Bennett, B.; Jokanola, O. The controls on the composition of biodegraded oils in the deep subsurface: Pan II—Geological controls on subsurface biodegradation fluxes and constraints on reservoir-fluid property prediction. AAPG Bull. 2006, 90, 921–938. [Google Scholar] [CrossRef]
- Boles, J.R.; Eichhubl, P.; Garven, G.; Chen, J. Evolution of a hydrocarbon migration pathway along basin-bounding faults: Evidence from fault cement. AAPG Bull. 2004, 88, 947–970. [Google Scholar] [CrossRef]
- Zhang, L.; Li, C.; Luo, X.; Zhang, Z.; Zeng, Z.; Ren, X.; Lei, Y.; Zhang, M.; Xie, J.; Cheng, M.; et al. Vertically transferred overpressures along faults in Mesozoic reservoirs in the central Junggar Basin, northwestern China: Implications for hydrocarbon accumulation and preservation. Mar. Pet. Geol. 2023, 150, 106152. [Google Scholar] [CrossRef]
- Yuan, F.; Tian, J.; Hao, F.; Liu, Z.; Zhang, K.; Wang, X. Fault characterization and its significance on hydrocarbon migration and accumulation of western Tazhong Uplift, Tarim Basin: Insight from seismic, geochemistry, fluid inclusion and in situ U-Pb dating. Mar. Pet. Geol. 2024, 170, 107137. [Google Scholar] [CrossRef]
- Kissin, Y.V. Catagenesis and composition of petroleum: Origin of n-alkanes and isoalkanes in petroleum crudes. Geochim. Cosmochim. Acta 1987, 51, 2445–2457. [Google Scholar] [CrossRef]
- Huang, H.; Huang, B.; Huang, Y.; Li, X.; Tian, H. Condensate origin and hydrocarbon accumulation mechanism of the deepwater giant gas field in western South China Sea: A case study of Lingshui 17-2 gas field in Qiongdongnan Basin. Pet. Explor. Dev. 2017, 44, 409–417. [Google Scholar] [CrossRef]
- Li, C.; Zhang, L.; Luo, X.; Lei, Y.; Yu, L.; Cheng, M.; Wang, Y.; Wang, Z. Overpressure generation by disequilibrium compaction or hydrocarbon generation in the Paleocene Shahejie Formation in the Chezhen Depression: Insights from logging responses and basin modeling. Mar. Pet. Geol. 2021, 133, 105258. [Google Scholar] [CrossRef]
- Wang, C.; Zeng, J.; Zhang, G.; Yin, X. Formation processes of gas condensate reservoirs in the Baiyun Depression: Insights from geochemical analyses and basin modeling. J. Nat. Gas Sci. Eng. 2022, 100, 104464. [Google Scholar] [CrossRef]
- Xiang, B.; Zhou, N.; Ma, W.; Wu, M.; Cao, J. Multiple-stage migration and accumulation of Permian lacustrine mixed oils in the central Junggar Basin (NW China). Mar. Pet. Geol. 2015, 59, 187–201. [Google Scholar] [CrossRef]
- Chen, J.; Deng, C.; Wang, X.; Ni, Y.; Sun, Y.; Zhao, Z.; Liao, J.; Wang, P.; Zhang, D.; Liang, D. Formation mechanism of condensates, waxy and heavy oils in the southern margin of Junggar Basin, NW China. Sci. China Earth Sci. 2017, 60, 972–991. [Google Scholar] [CrossRef]
- Wang, Q.; Chen, D.; Gao, X.; Li, M.; Shi, X.; Wang, F.; Chang, S.; Yao, D.; Li, S.; Chen, S. Overpressure origins and evolution in deep-buried strata: A case study of the Jurassic Formation, central Junggar Basin, western China. Pet. Sci. 2023, 20, 1429–1445. [Google Scholar] [CrossRef]
- Deng, R.; Wang, Y.; Chen, C. Fluid Phase Modeling and Evolution of Complex Reservoirs in the Halahatang Depression of the Tabei Uplift, Tarim Basin. ACS Omega 2022, 7, 14933–14943. [Google Scholar] [CrossRef] [PubMed]
- Chen, C.; Wang, Y.; Beagle, J.R.; Liao, L.; Shi, S.; Deng, R. Reconstruction of the evolution of deep fluids in light oil reservoirs in the Central Tarim Basin by using PVT simulation and basin modeling. Mar. Pet. Geol. 2019, 107, 116–126. [Google Scholar] [CrossRef]
- Kröner, A.; Windley, B.F.; Badarch, G.; Tomurtogoo, O.; Hegner, E.; Jahn, B.M.; Gruschka, S.; Khain, E.V.; Demoux, A.; Wingate, M.T.D. Accretionary growth and crust formation in the Central Asian Orogenic Belt and comparison with the Arabian-Nubian shield. In 4-D Framework of Continental Crust; Hatcher, R.D., Jr., Carlson, M.P., McBride, J.H., Catalán, J.R.M., Eds.; Geological Society of America: Boulder, CO, USA, 2007; Volume 200. [Google Scholar] [CrossRef]
- He, D.; Zhang, L.; Wu, S.; Li, D.; Zhen, Y. Tectonic evolution stages and features of the Junggar Basin. OilGas Geol. 2018, 39, 845–861. [Google Scholar] [CrossRef]
- Rao, S.; Zhu, Y.; Hu, D.; Hu, S.; Wang, Q. The Thermal History of Junggar Basin: Constraints on the Tectonic Attribute of the Early-Middle Permian Basin. Acta Geol. Sin. 2018, 92, 1176–1195. [Google Scholar]
- Cheng, C. Characteristics of Strike-Slip Faults in No.4 Blocks in Central Junggar Basin and Its Significance of Petroleum Geology. J. Shengli Coll. China Univ. Pet. 2018, 32, 8–10. [Google Scholar]
- Zhi, D.; Liu, W.; Hu, W.; Cao, J.; Zheng, M.; Wang, T. Source identification and accumulation restoration of complex oil reservoirs in Mahu Sag, Junggar Basin. Energy Explor. Exploit. 2023, 42, 146–177. [Google Scholar] [CrossRef]
- Zhao, J.; Chen, S.; Deng, G.; Shao, X.; Zhang, H.; Aminov, J.; Chen, X.; Ma, Z. Basement Structure and Properties of the Western Junggar Basin, China. J. Earth Sci. 2019, 30, 223–235. [Google Scholar] [CrossRef]
- Huang, L.; Su, J.; Pan, S.; Li, C.; Wang, Z. Tectonic evolution of the early permian Junggar basin: Insights into a foreland basin shaped by lithospheric folding. Mar. Pet. Geol. 2025, 171, 107178. [Google Scholar] [CrossRef]
- Zhong, K.; Guo, P.; Li, Z.; Wang, J.; Liu, W.; Zhang, B.; Song, M.; Li, C.; Xu, J. Hydrothermal structures in alkaline lake shales, the Permian Fengcheng Formation of the Junggar Basin, NW China. Mar. Pet. Geol. 2025, 182, 107578. [Google Scholar] [CrossRef]
- Tang, W.; Zhang, Y.; Pe-Piper, G.; Piper, D.J.W.; Guo, Z.; Li, W. Permian rifting processes in the NW Junggar Basin, China: Implications for the post-accretionary successor basins. Gondwana Res. 2021, 98, 107–124. [Google Scholar] [CrossRef]
- Tang, W.; Zhang, Y.; Pe-Piper, G.; Piper, D.J.W.; Guo, Z.; Li, W. Permian to early Triassic tectono-sedimentary evolution of the Mahu sag, Junggar Basin, western China: Sedimentological implications of the transition from rifting to tectonic inversion. Mar. Pet. Geol. 2021, 123, 104730. [Google Scholar] [CrossRef]
- Hou, M.; Zha, M.; Liu, H.; Liu, H.; Qu, J.; Imin, A.; Ding, X.; Jiang, Z. The coupling control of biological precursors and environmental factors on β-carotane enrichment in alkaline lacustrine source rocks: A case study from the Fengcheng formation in the western Junggar Basin, NW China. Pet. Sci. 2024, 21, 836–854. [Google Scholar] [CrossRef]
- Li, S.; Yu, X.; Tan, C.; Steel, R.; Hu, X. Jurassic sedimentary evolution of southern Junggar Basin: Implication for palaeoclimate changes in northern Xinjiang Uygur Autonomous Region, China. J. Palaeogeogr. 2014, 3, 145–161. [Google Scholar]
- Liu, S.; Gao, G.; Gang, W.; Xiang, B.; Wang, M.; Wang, C. Comparison of Formation Conditions of Source Rocks of Fengcheng and Lucaogou Formations in the Junggar Basin, NW China: Implications for Organic Matter Enrichment and Hydrocarbon Potential. J. Earth Sci. 2023, 34, 1026–1040. [Google Scholar] [CrossRef]
- Yu, S.; Wang, X.; Xiang, B.; Ren, J.; Li, E.; Wang, J.; Huang, P.; Wang, G.; Xu, H.; Pan, C. Molecular and carbon isotopic geochemistry of crude oils and extracts from Permian source rocks in the northwestern and central Junggar Basin, China. Org. Geochem. 2017, 113, 27–42. [Google Scholar] [CrossRef]
- Carroll, A.R.; Liang, Y.; Graham, S.A.; Xiao, X.; Hendrix, M.S.; Chu, J.; Cleavy, L. McKnight Junggar basin, northwest China: Trapped Late Paleozoic ocean. Tectonophysics 1990, 181, 1–14. [Google Scholar] [CrossRef]
- Cao, J.; Zhang, Y.; Hu, W.; Yao, S.; Wang, X.; Zhang, Y.; Tang, Y. The Permian hybrid petroleum system in the northwest margin of the Junggar Basin, northwest China. Mar. Pet. Geol. 2005, 22, 331–349. [Google Scholar] [CrossRef]
- Chen, J.; Wang, X.; Deng, C.; Liang, D.; Zhang, Y.; Zhao, Z.; Ni, Y.; Zhi, D.; Yang, H.; Wang, Y. Geochemical Features of Source Rocks and Crude Oil in the Junggar Basin, Northwest China. Acta Geol. Sin. 2016, 90, 37–67. [Google Scholar]
- Dong, X.; Li, J.; Pan, T.; Xu, Q.; Chen, L.; Ren, J.; Jin, K. Hydrocarbon accumulation conditions and exploration potential of Hongche fault zone in Junggar Basin. Acta Pet. Sin. 2023, 44, 748–764. [Google Scholar]
- Liu, H.; Meng, X.; Ren, X.; Cheng, B.; Cheng, C.; Deng, X.; Zhang, H.; Fang, X. Origin and source of Jurassic crude oil in well Pen-1 western Depression, Junggar Basin. J. China Univ. Pet. (Ed. Nat. Sci.) 2023, 47, 25–37. [Google Scholar] [CrossRef]
- Liu, Y.; Lu, X.; Zhao, M.; Zhuo, Q.; Gui, L. Hydrocarbon Generation and Accumulation in the South Junggar Basin, Northwest China: Insights From Basin Modeling. Front. Earth Sci. 2022, 10, 920011. [Google Scholar] [CrossRef]
- Liu, G.; Wei, Y.; Chen, Y.; Jia, K.; Gong, D.; Wang, F.; Sun, J.; Zhu, F.; Ma, W. Genetic mechanism and distribution characteristics of Jurassic-Cretaceous secondary reservoirs in the hinterland of Junggar Basin. Acta Pet. Sin. 2019, 40, 914–927. [Google Scholar]
- Li, Z.; Tang, L.; Ding, W.; Yao, S.; Wang, Y.; Liu, H.; Wang, Y. Fault characteristic analysis for the hinterland of Junggar basin. Pet. Explor. Dev. 2002, 29, 40–43. [Google Scholar]
- Li, C. Study on the Genesis Mechanism and Evolution Process of Abnormal Pressure in the Mesozoic of the Central Junggar Basin. Ph.D. Dissertation, University of Chinese Academy of Sciences (Institute of Geology and Geophysics, Chinese Academy of Sciences), Beijing, China, 2019. [Google Scholar]
- Hong, T.Y. Characteristics and Controlling Role of the Lower Cretaceous Unconformity on Oil Accumulation in the Central Junggar Basin. Ph.D. Dissertation, China University of Geosciences (Beijing), Beijing, China, 2006. [Google Scholar]
- Lin, H.; Wang, J.; Cao, J.; Ren, X. Jurassic compression-torsion fault patterns of the central Junggar basin and their controlling role on reservoir. Acta Geol. Sin. 2019, 93, 3259–3268. [Google Scholar]
- SY/T 5124-2012; Method of Determining Microscopically the Reflectance of Vitrinite in Sedimentary. SINOPEC: Beijing, China, 2012.
- Li, Y.; Lu, J.; Liu, X.; Wang, J.; Chen, S.; He, Q. Geochemical characteristics of source rocks and gas exploration direction in Shawan Sag, Junggar Basin. Nat. Gas Geosci. 2022, 33, 1319–1331. [Google Scholar] [CrossRef]
- Zhang, L.; Lei, D.; Tang, Y.; Abulimiti; Chen, G.; Hu, W.; Cao, J. Hydrocarbon Fluid Phase in the Deep-Buried Strata of the Mahu Sag in the Junggar Basin. Acta Geol. Sin. 2015, 89, 957–969. [Google Scholar]
- Qu, J.; Zhang, Q.; Hou, M.; Ding, X.; Ablimit, I. Source and Accumulation Process of Deep-Seated Oil and Gas in the Eastern Belt around the Penyijingxi Sag of the Junggar Basin, NW China. Processes 2023, 11, 2340. [Google Scholar] [CrossRef]
- Zhao, Z.; Feng, Q.; Liu, X.; Lu, H.; Peng, P.a.; Liu, J.; Hsu, C.S. Petroleum Maturation Processes Simulated by High-Pressure Pyrolysis and Kinetic Modeling of Low-Maturity Type I Kerogen. Energy Fuels 2022, 36, 1882–1893. [Google Scholar] [CrossRef]
- Wu, Y.; Liu, C.; Jiang, F.; Hu, T.; Lv, J.; Zhang, C.; Guo, X.; Huang, L.; Hu, M.; Huang, R.; et al. Geological characteristics and shale oil potential of alkaline lacustrine source rock in Fengcheng Formation of the Mahu Sag, Junggar Basin, Western China. J Pet. Sci. Eng. 2022, 216, 110823. [Google Scholar] [CrossRef]
- Hou, M.; Qu, J.; Zha, M.; Swennen, R.; Ding, X.; Imin, A.; Liu, H.; Bian, B. Significant contribution of haloalkaliphilic cyanobacteria to organic matter in an ancient alkaline lacustrine source rock: A case study from the Permian Fengcheng Formation, Junggar Basin, China. Mar. Pet. Geol. 2022, 138, 105546. [Google Scholar] [CrossRef]
- Dang, W.; Gao, G.; You, X.; Fan, K.; Wu, J.; Lei, D.; He, W.; Tang, Y. Geochemical identification of a source rock affected by migrated hydrocarbons and its geological significance: Fengcheng Formation, southern Mahu Sag, Junggar Basin, NW China. Pet. Sci. 2024, 21, 100–114. [Google Scholar] [CrossRef]
- Jiang, C.; Wang, G.; Song, L.; Huang, L.; Wang, S.; Zhang, Y.; Huang, Y.; Dai, Q.; Fan, X. Identification of fluid types and their implications for petroleum exploration in the shale oil reservoir: A case study of the Fengcheng Formation in the Mahu Sag, Junggar Basin, Northwest China. Mar. Pet. Geol. 2023, 147, 105996. [Google Scholar] [CrossRef]
- Gong, D.; Liu, Z.; Zhou, C.; Ownsworth, E.; Selby, D.; He, W.; Qin, Z. Carboniferous–Permian interglacial warming and volcanism temporally linked to the world’s oldest alkaline lake deposit of the Fengcheng Formation, NW China. Palaeogeogr. Palaeocl. 2024, 654, 112441. [Google Scholar] [CrossRef]
- Bai, Y.; Wang, F.; Niu, Z.; Jin, K.; Li, P.; Duo, S.; Chen, G. Hydrocarbon generation kinetics of source rocks of Permian Fengcheng Formation in Mahu Sag, Junggar Basin. Lithol. Reserv. 2022, 34, 116–127. [Google Scholar]
- Carroll, A.R.; Bohacs, K.M. Lake-Type Controls on Petroleum Source Rock Potential in Nonmarine Basins. AAPG Bull. 2001, 85, 1033–1053. [Google Scholar] [CrossRef]
- He, W.J. Causes and Evolution of Abnormal Pressure in the Deep Part of the Central Junggar Basin. Master’s Thesis, China University of Petroleum (East China), Qingdao, China, 2020. [Google Scholar]
- Wygrala, B.P. Integrated Study of an Oil Field in the Southern Po Basin, Northern Italy. Ph.D. Thesis, University of Cologne, Cologne, Germany, 1989. [Google Scholar]
- Zhou, L.; Zheng, J.; Lei, D.; He, D.; Tang, Y.; Shi, X.; Pang, L.; Yang, Z. Recovery of eroded thickness of the Jurassic of Chemo palaeouplift in Junggar Basin. J. Palaeogeogr. 2007, 9, 243–252. [Google Scholar] [CrossRef]
- Hantschel, T.; Kauerauf, A.I. Fundamentals of Basin and Petroleum Systems Modeling; Springer: Berlin/Heidelberg, Germany, 2009. [Google Scholar] [CrossRef]
- Mullins, O.; Zuo, J.; Wang, K.; Hammond, P.; Santos, R.; Dumont, H.; Mishra, V.; Chen, L.; Pomerantz, A.; Dong, C.; et al. The Dynamics of Reservoir Fluids and their Substantial Systematic Variations. Petrophysics 2014, 55, 96–112. [Google Scholar]
- Mullins, O.; Chen, L.; Betancourt, S.; Achourov, V.; Dumont, H.; Cañas, J.; Forsythe, J.; Pomerantz, A. Reservoir fluid geodynamics. In Fluid Chemistry, Drilling and CompletionFluid Chemistry, Drilling and Completion; Oil and Gas Chemistry Management Series; Elsevier: Amsterdam, The Netherlands, 2022; pp. 1–39. [Google Scholar] [CrossRef]
- Mullins, O.C.; Elshahawi, H.; Chen, L.; Forsythe, J.C.; Betancourt, S.S.; Hakim, B.; Messonnier, T.; Mohamed, T.S.; Kristensen, M.; Pan, S.; et al. Compositional Mixing Characteristics of Separate Gas and Oil Charges into Oil Field Reservoirs. Energy Fuels 2023, 37, 7760–7776. [Google Scholar] [CrossRef]
- Yang, S. Reservoir Physics; Petroleum Industry Press: Beijing, China, 2007. [Google Scholar]
- Qiao, R.; Chen, Z. Petroleum phase evolution at high temperature: A combined study of oil cracking experiment and deep oil in Dongying Depression, eastern China. Fuel 2022, 326, 124978. [Google Scholar] [CrossRef]
- Losh, S.; Cathles, L.; Meulbroek, P. Gas washing of oil along a regional transect, offshore Louisiana. Org. Geochem. 2002, 33, 655–663. [Google Scholar] [CrossRef]
- Wei, X.; Liu, K.; Yang, X.; Yang, P.; Liu, J.; Ding, X. Evolution of the Dibei condensate gas reservoirs in the northern Kuqa Foreland Basin, western China: Insight for hydrocarbon in-reservoir alteration. Mar. Pet. Geol. 2025, 174, 107306. [Google Scholar] [CrossRef]
- Xi, S.; Li, W.; Li, R. Hydrocarbon generation and reservoir formation: A case from Chang 7 source rock in Majiatan area, west margin of Ordos Basin. Pet. Explor. Dev. 2008, 35, 657–663. [Google Scholar]
- Meng, L.; Yuan, H.; Zhang, Y.; Zhang, Y. Prediction of Oil Source Fault-Associated Traps Favorable for Hydrocarbon Migration and Accumulation: A Case Study of the Dazhangtuo Fault in the Northern Qikou Sag of the Bohai Bay Basin. Processes 2024, 12, 1609. [Google Scholar] [CrossRef]
- Chu, R.; Wang, Y.-G.; Shi, H.-T. Quantitative evaluation of fault sealing capacity and hydrocarbon migration: Insight from the Liuzhuang fault in the Bohai Bay Basin, China. Int. J. Earth Sci. 2024, 113, 459–475. [Google Scholar] [CrossRef]
- Zeng, Z.; Wang, J.; Li, C.; Xu, B.; Fan, J.; Liu, D.; Li, S.; Zhang, Z. Research on the source rock types and thermal evolution of the Permian Lower Wuerhe Formation in the Shawan Sag, Junggar Basin. Chin. J. Geol. 2024, 59, 330–340. [Google Scholar] [CrossRef]
- Zhang, Y.; Cao, J.; Hu, W. Timing of petroleum accumulation and the division of reservoir-forming assemblages, Junggar Basin, NW China. Pet. Explor. Dev. 2010, 37, 257–262. [Google Scholar] [CrossRef]
- Zhang, H.; Liu, H.; Han, Z.; Li, J.; Zhang, W. Characteristics of Fluid Inclusions and Pressure Recovery during Hydrocarbon Accumulation Period in Jurassic Sangonghe Formation in Fukang Sag, Junggar Basin. Earth Sci. 2024, 49, 2420–2433. [Google Scholar]
- Li, B.; He, D.; Li, M.; Chen, L.; Yan, K.; Tang, Y. Biomarkers and Carbon Isotope of Monomer Hydrocarbon in Application for Oil–Source Correlation and Migration in the Moxizhuang–Yongjin Block, Junggar Basin, NW China. ACS Omega 2022, 7, 47317–47329. [Google Scholar] [CrossRef]
- Wu, M.; Jin, J.; Ma, W.; Xiang, B.; Zhou, N.; Ren, J.; Cao, J. Deep-Buried Triassic Oil-Source Correlation in the Central Junggar Basin, NW China. Geofluids 2017, 2017, 7581859. [Google Scholar] [CrossRef]
- Peng, D.-Y.; Robinson, D.B. A New Two-Constant Equation of State. Ind. Eng. Chem. Fundam. 1976, 15, 59–64. [Google Scholar] [CrossRef]
- Mullins, O.; Zuo, J.; Dong, C.; Elshahawi, H.; Seifert, D.; Cribbs, M. The Dynamics of Fluids In Reservoirs. In Proceedings of the SPE Annual Technical Conference and Exhibition, New Orleans, LA, USA, 30 September–2 October 2013; Volume 1. [Google Scholar] [CrossRef]
- Steffens, B.; Corlay, Q.; Suurmeyer, N.; Noglows, J.; Arnold, D.; Demyanov, V. Can Agents Model Hydrocarbon Migration for Petroleum System Analysis? A Fast Screening Tool to De-Risk Hydrocarbon Prospects. Energies 2022, 15, 902. [Google Scholar] [CrossRef]
- Altamar, R.P. Modeling hydrocarbon pathways from accumulation to source: A stochastic agent-based approach with permeability-driven matrices. Lead. Edge 2025, 44, 566–570. [Google Scholar] [CrossRef]
- Yang, J.; Liu, Y.; Dai, H.; Yuan, S.; Jiao, T.; Wen, Z.; Ye, M. Development of an integrated global sensitivity analysis strategy for evaluating process sensitivities across single- and multi-models. J. Hydrol. 2024, 643, 132014. [Google Scholar] [CrossRef]
Disclaimer/Publisher’s Note: The statements, opinions and data contained in all publications are solely those of the individual author(s) and contributor(s) and not of MDPI and/or the editor(s). MDPI and/or the editor(s) disclaim responsibility for any injury to people or property resulting from any ideas, methods, instructions or products referred to in the content. |
© 2025 by the authors. Licensee MDPI, Basel, Switzerland. This article is an open access article distributed under the terms and conditions of the Creative Commons Attribution (CC BY) license (https://creativecommons.org/licenses/by/4.0/).