Abstract
A rise in the water level may result in different vertical rebound levels of the ground surface, adversely affecting buildings. Ground rebound occurred in the Xi’an Yuhuazhai area from 2018 to 2019, but the soil’s deformation characteristics remain unclear. Drilling and water level data and FLAC3D 6.0 were used to simulate water level recovery. The deformation characteristics of different soil layers were examined, their future development was predicted, and the influences of various parameters on ground rebound were analyzed. The rebound amount of the hanging wall in the second confined aquifer was 38.32 mm, accounting for 61.12% of the total rebound amount. The rebound amount of the footwall in the second confined aquifer was 22.14 mm, accounting for 79.63% of the total rebound amount. The predicted maximum rebound of the upper and lower soil layers in the next 5 years was 2.8 mm and 2.6 mm, respectively, representing a vertical difference of 0.2 mm, which has no significant effect on building safety. The results provide a scientific basis for groundwater management and settlement prevention and control in Xi’an.
1. Introduction
A rise in the groundwater level substantially slows land subsidence [1]. The degree of land subsidence decreases with an increase in the recharge amount, and the influence of water level recharge is positively correlated with the aquifer’s recharge level [2,3,4]. Ground rebound resulting from groundwater level recovery has been analyzed in Italy, Suzhou, Wuxi, Changzhou, Shanghai, Cangzhou, Beijing, and other regions [3,5,6,7,8,9,10,11]. Land subsidence in Xi’an has been substantially alleviated since the Heihe River Water Diversion Project was implemented at the end of 2003 due to the conversion of drinking water sources from pumping wells to reservoirs [12]. However, hydrological monitoring data from recent years have shown that a slow rise in the groundwater level causes a change from land subsidence to ground rebound in some areas of Xi’an [12,13,14]. Yuhuazhai is a typical rebound area in Xi’an [15,16,17].
Scholars have investigated surface displacement after groundwater exploitation or water level rise using numerical simulations [3,18,19,20,21,22,23,24,25,26] and predicted the future development trends [20]. Some scholars conducted groundwater recharge tests and found that the groundwater level impacts land subsidence. Ground rebound occurred when the water level rose gradually [4,27,28]. Others have studied the temporal and spatial evolution of surface displacement and groundwater level using Interferometric Synthetic Aperture Radar (InSAR) monitoring data [12,13,14,29,30].
Ground settlement studies typically focus on the deformation characteristics of different soil layers and their rebound contributions during water table rebound. Studies have shown that water level rebound affects ground deformation by increasing pore water pressure and changing the aquifer’s characteristics [3]. A study in Changzhou showed that elastic rebound occurred in the water-bearing sand layer and the water barrier after a mining ban [31]. A Shanghai study found that the amount of recharge was negatively correlated with the settlement amount, and the effect of recharge was layer-dependent [2,4]. The reason is the elastic rebound of pores. An increase in pore pressure leads to soil rebound, in which the deformation of the sand layer is synchronized with the water table. In contrast, significant hysteresis occurs in clay layers due to their lower permeability [5,7,32]. Groundwater level rebound or an artificial recharge can trigger ground rebound. Pore water pressure is the key factor affecting soil rebound, and the amount of rebound is significantly positively correlated with the amount of water table rebound. Sand and clay layers are involved in the rebound, but exhibit differences.
Most studies on ground rebound have focused on the Yangtze River Delta region (Shanghai and Changzhou). In contrast, InSAR has been primarily used in the Xi’an region for surface deformation monitoring due to the limited availability of stratified data. Therefore, this paper utilizes numerical simulations and InSAR data to analyze the effects of groundwater level change on ground rebound. The soil deformation in a typical Yuhuazhai ground rebound area in Xi’an is examined, the influence of core parameters on ground rebound is analyzed, and the ground rebound caused by future water level changes is predicted. The amount of rebound in this study refers to the amount of deformation in the perpendicular direction.
2. The Characteristics of Ground Rebound and Groundwater Level
2.1. Current Ground Rebound Conditions
The study area is located near Yuhuazhai in Xi’an (108°45′0″–109°10′0″ E, 34°11′34.51″–34°11′34.51″ N) (Figure 1a). The geomorphological types from the piedmont of the Qinling Mountains to the floodplain of the Weihe River include a piedmont alluvial plain, a loess tableland, and an alluvial plain of the Weihe River and its tributaries. The f4 ground fissure passes through the study area, and a borehole is located on the upper and lower sides of the ground fissure (Figure 1b). The angle of the ground fissure is about 80°. Persistent scatter (PS)-InSAR was used to analyze the surface deformation of the Yuhuazhai area from 2017 to 2021 (Figure 1c). The Xi’an Yuhuazhai area experienced general land subsidence during this period, and ground rebound occurred from August 2018 to July 2019. The rising rate was fast and slow. Figure 1d,e shows the region in the rebound state in 2022 and a decrease in the rebound trend in 2023.
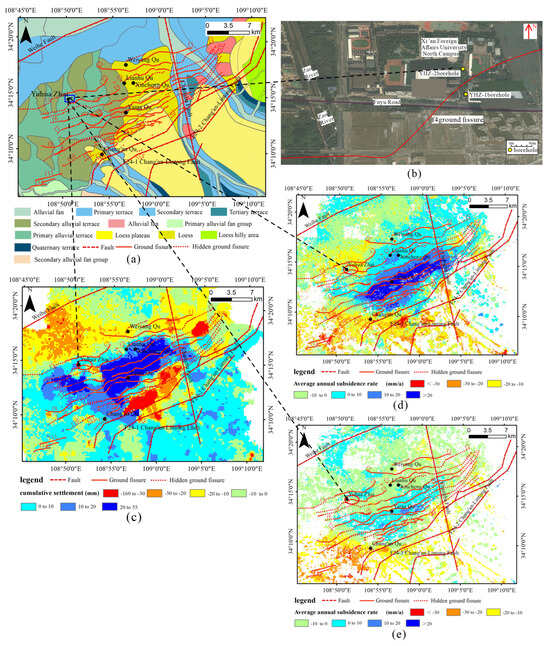
Figure 1.
Research area status: (a) Location map of the study area; (b) Borehole location; (c) Cumulative land subsidence trend from 2017 to 2021; (d) Xi’an land subsidence trend in 2022; (e) Land subsidence trend in Xi’an in 2023.
2.2. Groundwater Dynamics
According to the water level monitoring data at a depth of 245 m (Figure 2), the depth of the monitoring well, and the stratigraphic structure of the upper side and footwalls, the area was divided into a phreatic aquifer and two confined aquifers. The buried depth of the phreatic aquifer is 0–80 m, the buried depth of the first confined aquifer is 80–150 m, and the buried depth of the second confined aquifer is 150–245 m. The InSAR monitoring data was divided into two stages. The first stage was the rapid rebound stage (from October 2018 to March 2019). The second stage was the recovery stage with large fluctuations, which were within 1 mm.
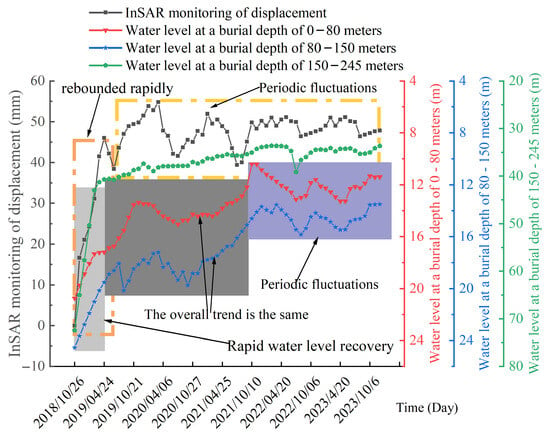
Figure 2.
Groundwater level change and surface monitoring map.
The cumulative recovery of the second confined aquifer was about 40 m from October 2018 to December 2023. From October 2018 to January 2019, the water level rose rapidly by nearly 30 m, followed by a slow upward trend in the following three years. A sudden drop in the water level occurred in February 2022, with a decline of about 5 m in two months. The water level rose again in the following three months, with a recovery of about 4.5 m, and remained stable in the subsequent period.
The water level fluctuation of the first confined aquifer rose, and the frequency of fluctuations was high. This period was divided into two stages. In the first stage (from June 2019 to December 2020), the head fluctuation range was 17 to 20 m. Water level recovery occurred in December 2020 and continued during the following four months, with a recovery of about 6 m. Subsequently, the water level fluctuated periodically within about 2 m.
The phreatic aquifer also exhibited a rise in the water level by about 8 m from October 2018 to August 2019. The water level decreased in the next 8 months. In April 2020, the water level rebounded and reached about 6 m in August 2021. The water level fluctuated within 4 m in the following two years.
An analysis of the water level and ground rebound data indicated a rapid rebound of the ground and the water level in the second confined aquifer. The other two aquifers showed a rapid rise in the water level. It was speculated that the rapid increase in the water level caused the rapid rebound of the ground.
3. Numerical Simulation of the Decline and Rise of the Groundwater Level
3.1. Control Equations
The theoretical framework of the FLAC3D 6.0 fluid–solid coupling software is based on the Biot porous medium theory, which couples solid deformation and fluid flow. The governing equations include the following.
- Equations of Solid Mechanics (Equilibrium Equations)
- : Total stress tensor (effective stress + pore water pressure);
- : average density of the porous medium ( is the solid density, is the fluid density, and n is the porosity);
- u: solid displacement vector.
- 2.
- Fluid Flow Equations (Modified Darcy’s Law)
- q: seepage rate (Darcy flow rate);
- k: coefficient of permeability;
- μ: hydrodynamic viscosity;
- p: pore water pressure.
The mass conservation equation (continuity equation) is expressed as follows:
Q: Source and sink items (e.g., water injection or pumping).
- 3.
- Effective Stress Principle
- : Effective stress (determines solid deformation);
- a: Biot coefficient (usually close to 1);
- I: Unit Tensor.
FLAC3D 6.0 alters porosity (n) and permeability (k) using solid deformation, which affects the seepage field. A change in pore water pressure (P) counteracts the solid deformation according to the effective stress principle.
3.2. The Establishment of a Three-Dimensional Geological Model
According to the formation’s structure and the depth of the monitoring well, the aquifer within 300 m was divided into the phreatic layer and the first and second confined aquifers (Figure 3). The buried depth of the first and second confined aquifers was 100–176 m and 176–300 m, respectively. The first confined aquifer was divided into two water-bearing sections, and the second confined aquifer was divided into four water-bearing sections. The 0–96 m depth range of the footwall formation was the phreatic aquifer, and the buried depths of the top and bottom plates of the first and second confined aquifers in the hanging wall were 96–166 m and 166–300 m, respectively. The first confined water-bearing component was divided into two water-bearing sections, and the second confined water-bearing rock component was divided into three water-bearing sections.
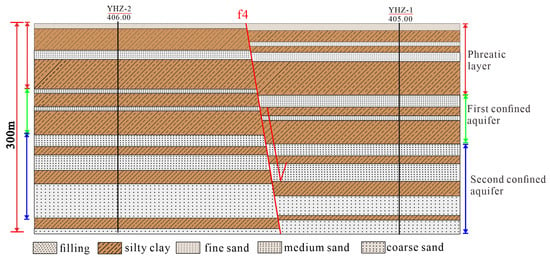
Figure 3.
Column diagram of boreholes on both sides of the f4 ground fissure.
Based on drilling data, the hanging wall and footwall strata in the Yuhuazhai ground fissure area were grouped (Table 1). The strata of the hanging wall and the footwall are a combination of sand and clay layers, except that the first layer is filled with soil. The footwall strata were divided into 15 layers, with the sand layer accounting for 38.33%, and the clay layer accounting for 61.67%. The hanging wall stratum was divided into 17 layers; the sand layer accounted for 44.33%, and the clay layer accounted for 55.67%. The total thickness of the clay layer of the footwall exceeded that of the hanging wall.

Table 1.
Grouping of hanging wall and footwall strata in the Yuhuazhai ground fissure area.
According to the stratigraphic structure in Table 1, a three-dimensional geological model was established using FLAC3D 6.0 software (Figure 4). The length (x direction) was 1000 m, the width (y direction) was 300 m, and the height (z direction) was 300 m. A ground fissure with a length of 500 m and an angle of 80° was placed at the bottom of the top surface in the x direction.
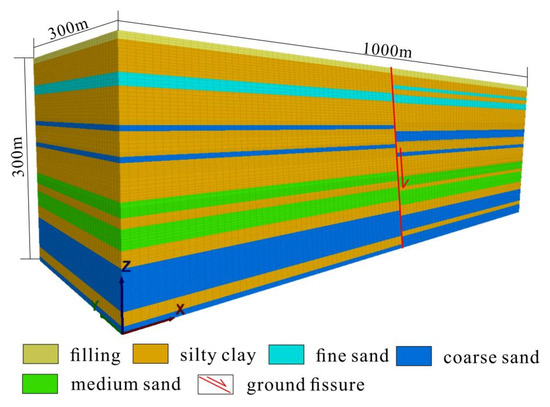
Figure 4.
Model diagram of the Yuhuazhai area.
3.3. Boundary Conditions and Parameters
The boundary conditions of the displacement and seepage were as follows. The top surface had a free displacement and free drainage boundary. The bottom had a fixed displacement and an undrained boundary. Both sides had fixed boundaries horizontally and free boundaries vertically. The seepage boundary was assigned according to the water head boundary. These boundaries remained constant during the recharge. A change in the aquifer’s water level affected the remaining aquifers and aquifuges, involving seepage and plastic deformation. The Mohr–Coulomb model was used to calculate deformation, and the isotropic model was used as the fluid model.
The thickness, physical, and mechanical properties of the soil layers were assigned using data from studies on ground fissures and surface displacement [33,34,35,36]. Due to the similarity between the upper and lower soil layers, only the parameters of the upper soil are provided. The physical and mechanical parameters of the soil layers of the hanging wall are listed in Table 2. The parameters of the ground fissures are listed in Table 3.

Table 2.
Physical and mechanical parameters of different soil layers on the hanging wall of the three-dimensional geological model in the Yuhuazhai area.

Table 3.
Ground fissure parameters.
3.4. Simulation of the Decline and Rise of the Groundwater Level
The fluid–solid coupling model in FLAC3D 6.0 was used to establish different initial water heads for the phreatic and confined aquifers. A change in pore water pressure was achieved by pumping or adding water to the sand layer in the phreatic and confined aquifers. The changes in water level for the different aquifers are shown in Figure 5. The agreement between the simulated and measured values is high, with the second confined aquifer achieving the best simulation performance.
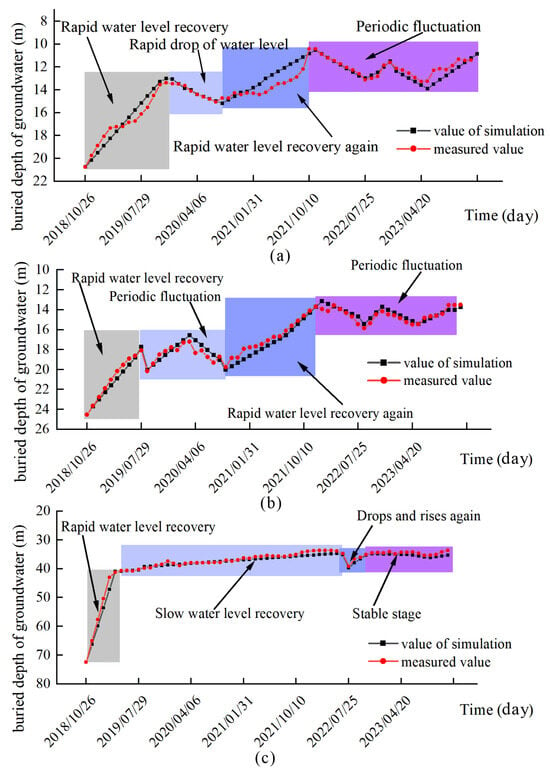
Figure 5.
Water level fluctuation: (a) Phreatic aquifer; (b) First confined aquifer; (c) Second confined aquifer.
4. Soil Deformation Resulting from Groundwater Level Change
4.1. Theoretical Basis
The Mohr–Coulomb model was used to simulate the soil’s mechanical behavior in the numerical simulation. It is based on the following two core elements.
4.1.1. Yield Criterion (Mohr–Coulomb Criterion)
The Mohr–Coulomb criterion characterizes the damage of a material by its shear strength, which is mathematically expressed as follows:
where is the shear stress, is the normal stress on the damage surface (the compressive stress is negative), c is the cohesive force, and is the angle of internal friction.
In the principal stress space ( ≥ ≥ σ3), the criterion can be expressed as follows:
The material undergoes shear damage when the stress state satisfies this equation.
4.1.2. Plastic Flow Law
Non-associated flow (common): The direction of plastic strain does not coincide exactly with the yield surface. The shear expansion angle (ψ) affects the volume: ψ ≤ ϕ (which is typically ψ = 0 or ψ < ϕ).
Associated flow: If the shear expansion angle is equal to the angle of internal friction (ψ = ϕ), the volume expansion may be overestimated.
The elastic phase of the soil in FLAC3D 6.0 is defined by the shear modulus (G) and the bulk modulus (K) corresponding to linear elasticity. The calculation of the plastic phase consists of three steps: the first step calculates the stress increment, the second step checks whether the Mohr–Coulomb yield condition is satisfied, and the third step applies the stress to the yield surface using a plastic correction if the stress exceeds a threshold.
4.2. Deformation Characteristics of the Aquifer
Figure 6 shows that the rebound of the hanging wall is slightly larger than that of the footwall. Since we focused on the rebound value of the upper side and the footwalls of different layers, the monitoring points were used to assess the displacement during pumping. The layout of the monitoring points on the upper side and the footwalls was based on the soil layer thicknesses (Table 2). The value is 0 at the bottom of the model and increases in the Z-axis direction. The maximum value of the Z-axis on the top surface is 300.
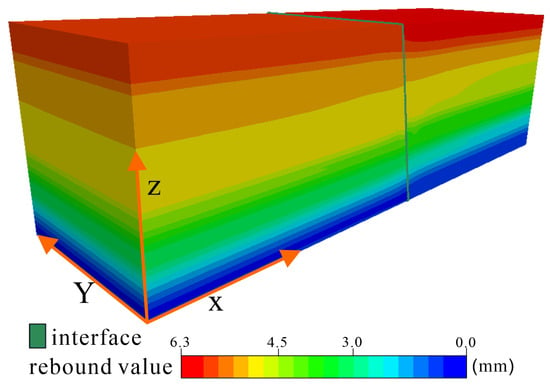
Figure 6.
Numerical simulation of the final displacement.
Figure 7 shows the numerical simulation results and the InSAR surface monitoring values for the hanging wall. The simulated displacement rebound values are 63 mm for the hanging wall and 55 mm for the footwall. The value derived from InSAR monitoring is 53 mm. The displacement trend is similar for the numerical simulation and the InSAR data. The reason for the small error is that the model simplifies the formation’s structure. The simulated rebound value of the hanging wall for the second confined aquifer is 38.32 mm, accounting for 61.12% of the total rebound amount. That of the first confined aquifer is 7.69 mm (12.26%), and that of the phreatic aquifer is 16.69 mm (26.62%). The rebound amount of the footwall for the second confined aquifer is 22.14 mm (79.63%), and that for the first confined aquifer is 2.5 mm (4.39%). The rebound amount for the phreatic aquifer is 8.9 mm (15.99%). These results indicate that the second confined aquifer contributes the most to the total rebound.
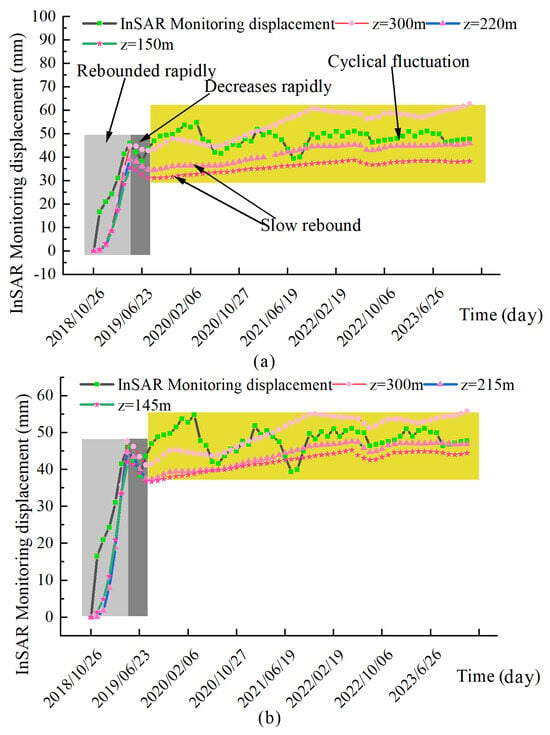
Figure 7.
InSAR data monitoring results of the displacements of the layers: (a) Hanging wall; (b) Footwall. Note: Light gray in the figure represents the rapid rebound phase, dark gray represents the slight decline phase, and yellow represents the volatile rebound phase.
4.3. Deformation Characteristics of Different Aquifers
4.3.1. Deformation Characteristics of the Phreatic Aquifer
The deformation trend at the monitoring points on the hanging wall and the footwall of the phreatic aquifer is consistent with the water level fluctuations. The relative downward displacement is slightly smaller for the lower soil layer than for the upper soil layer, indicating that the influence on the upper soil layer is larger for the same water level fluctuations. The change in the water level can be divided into three stages (Figure 8a,c). The red box represents the rapid recovery stage of the water level, the blue box indicates the recovery stage, and the purple box indicates the stable water level stage, when small cyclical fluctuations occur. The soil displacement can be divided into five stages (Figure 8a,c). The light-gray rectangle indicates the rapid rebound stage of the soil. The dark-gray rectangle indicates that the soil exhibits low compression and rebound, with a cumulative rebound amount of approximately 0. The light-yellow rectangle denotes the rebound of the soil. Some compression occurs in the early stage. The dark-yellow rectangle indicates slight compaction. The green rectangle indicates that the soil is relatively stable, with a small amount of rebound. The colors in Figure 8, Figure 9 and Figure 10 have the same meaning.
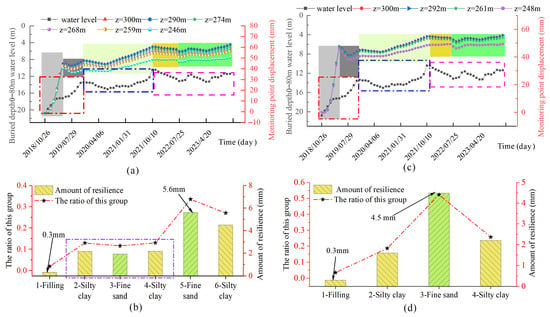
Figure 8.
Deformation characteristics of the phreatic aquifer: (a) The hanging wall’s displacement and water level fluctuations; (b) The rebound of the layers of the hanging wall; (c) The footwall’s displacement and water level fluctuations; (d) The rebound of the layers of the footwall. Note: In Figure (a,b), light gray represents the rapid rebound phase, dark gray represents the minor fluctuation phase, light yellow represents the minor compression and major rebound phase, dark yellow represents the minor compression phase, and dark green represents the volatility rebound phase. The corresponding figures below are the same.
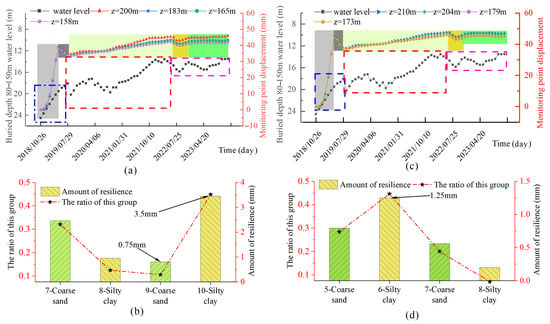
Figure 9.
Deformation characteristics of the first confined aquifer: (a) The hanging wall’s displacement and water level fluctuations; (b) The rebound of the layers of the hanging wall; (c) The footwall’s displacement and water level fluctuations; (d) The rebound of the layers of the footwall.
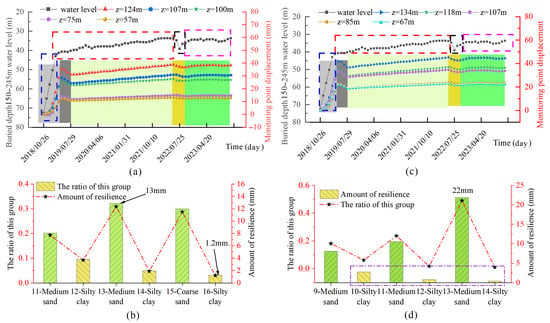
Figure 10.
Deformation characteristics of the second confined aquifer: (a) The hanging wall’s displacement and water level fluctuations; (b) The rebound of the layers of the hanging wall; (c) The footwall’s displacement and water level fluctuations; (d) The rebound of the layers of the footwall.
In the water recovery stage, the fine sand in the fifth layer and the silty clay in the sixth layer of the hanging wall exhibit significantly larger rebound than the other layers. The cumulative rebound value of the hanging wall is 16.7 mm (Figure 8b). The rebound of the sand layer accounts for 45.1% of the cumulative rebound. The rebound amounts of the third layer (fine sand) and the fourth layer (silty clay) in the footwall are larger than those of the other layers. The cumulative rebound value of the footwall is 8.6 mm (Figure 8d), of which the sand layer accounts for 52.3% of the total.
The trends of the displacement and water levels of the hanging wall and the footwall are consistent, with small numerical differences. The trends of the upper and lower layers are the same for the two confined aquifers. The cumulative rebound value of the hanging wall is 8.1 mm larger than that of the footwall.
4.3.2. Deformation Characteristics of the Confined Aquifer
The displacement trend and the water level changes of the layers of the first confined aquifer are the same as above. However, it is observed that a small decrease in the water level does not affect the trend of the soil rebound in the layers, but the rate of rebound decreases (Figure 9a,c). During the rise in the water level, the rebound amounts of the fine sand in the 7th layer and the silty clay in the 10th layer of the hanging wall are substantially larger than those of the other layers. The cumulative rebound value of the hanging wall is 7.69 mm (Figure 9b), of which the sand layer accounts for 42.63% of the total. The rebound amounts of the fine sand in the 7th layer and the silty clay in the 10th layer of the footwall are larger than those of the other layers. The cumulative rebound value of the footwall is 2.8 mm (Figure 9d), and the sand layer accounts for 48.31% of the total. The cumulative rebound value of the hanging wall is 4.89 mm larger than that of the footwall. The thickness of the upper sand layer accounts for 31.58%, and that of the clay layer accounts for 68.42%. The thickness of the sand layer in the footwall accounts for 17.14%, and that of the clay layer accounts for 82.65%. The thickness ratio of the upper sand layer is greater than that of the lower sand layer.
The displacement trend of the layers of the second confined aquifer is consistent with the water level trend (Figure 10a,c). However, after the water level rebound rate decreases, the rebound trends of the soil layers are not smooth, indicating a significant correlation between the change rates of the rebound and the water level. During the water recovery stage, the rebound amounts of the medium sand in the 13th layer and the coarse sand in the 15th layer of the hanging wall are larger than those of the other layers. The cumulative rebound value of the hanging wall is 38.32 mm (Figure 10b), and the sand layer accounts for 82.33% of the total. The rebound amounts of the coarse sand in the 13th layer and the medium sand in the 11th layer of the footwall are larger than those of the other layers. The cumulative rebound value of the lower layer is 44.45 mm (Figure 10d), of which the sand layer accounts for 90.99% of the total. The cumulative rebound value of the hanging wall is 6.13 mm smaller than that of the footwall. The thickness of the upper sand layer accounts for 72.58%, and that of the clay layer accounts for 27.42%. The thickness of the lower sand layer accounts for 67.16%, and that of the clay layer accounts for 32.84%. The thickness ratio of the upper sand layer is greater than that of the lower sand layer.
The thickness ratio of the hanging wall’s sand layer of the phreatic aquifer and the confined aquifer is greater than that of the footwall’s sand layer. The rebound value of the hanging wall of the phreatic aquifer and the first confined aquifer is greater than that of the footwall. However, the second confined aquifer is an exception, indicating that the cumulative rebound of the multi-layer soil is related to the thickness ratio of the sand layer.
4.4. Dynamic Prediction of Ground Rebound
The reasons for establishing a model for the Yuhuazhai area are to analyze the compression and rebound of the soil layers and predict the surface displacement during future water level changes. We used the three-dimensional geological model of the Yuhuazhai area to predict the rebound in 2025 based on 2023 data.
At the end of 2023, the water level of the phreatic layer was at a depth of 11 m. The water level of the first confined aquifer was at 13 m, whereas that of the second confined aquifer was at 35 m. The rise in the water level in Xi’an is expected to remain the same in the short term. The current water level recovery rate of the third confined aquifer is 2.5 m/year. This value was used to determine the maximum rebound in the future. It was assumed that the water level of the second confined aquifer would rise to 15 m (slightly less than that of the first confined aquifer) in the next 5 years, whereas the water level of the phreatic aquifer and the first confined aquifer would remain unchanged.
The cumulative rebound of the hanging wall’s surface is 2.8 mm if the water level of the second confined aquifer rises by 20 m in the next 5 years (Figure 11a). The displacements of the remaining layers are 0 in the third confined aquifer. The cumulative rebound of the footwall surface is 2.6 mm (Figure 11b), and those of the remaining layers are the same as those of the hanging wall. The rebound difference between the upper and lower walls in the next 5 years is predicted to be 0.2 mm; this difference will not significantly impact existing buildings.
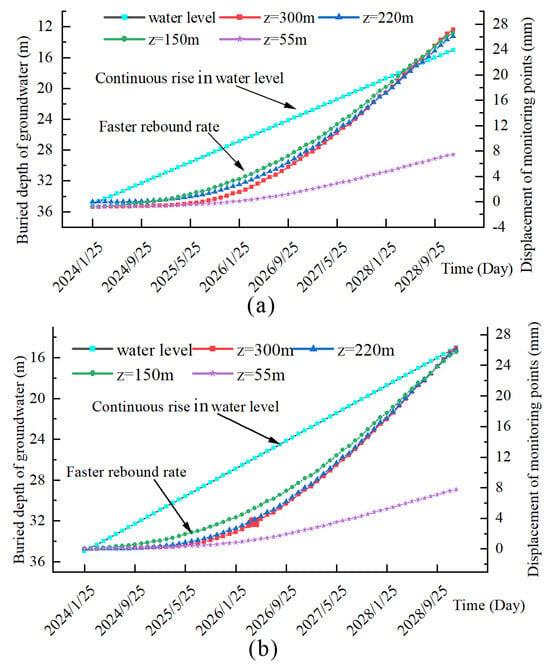
Figure 11.
Predicted rebound: (a) Hanging wall; (b) Footwall.
5. Discussion
5.1. Effect of Elastic Modulus on Ground Rebound
The modulus of elasticity significantly affects the numerical simulation results [37,38,39,40]. An increase in the modulus of elasticity increases the ground stiffness and reduces settlement. Therefore, we selected elastic moduli that were 5 times and 0.2 times the normal value of the sand and clay layers, respectively, and compared the rebound values of the layers under the same water level recovery conditions. The rebound values of the hanging wall’s layers (Figure 12a) and the footwall’s layers (Figure 12b) are significantly larger for an elastic modulus that is 0.2 times larger than one that is 5 times larger than the normal value. This result shows that the elastic modulus has a linear correlation with the rebound, helping to select parameters.
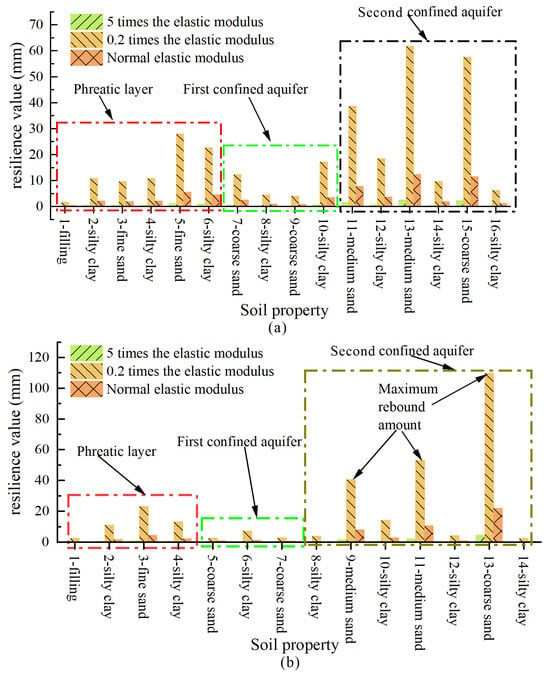
Figure 12.
Rebound values for different elastic moduli: (a) Hanging wall; (b) Footwall.
5.2. The Influence of the Permeability Coefficient on Ground Rebound
The compaction of the clay layer significantly affects land subsidence or rebound resulting from water level recovery [32,41,42]. Land subsidence studies have observed hysteresis and found that the contribution of the clay layer to land subsidence exceeded that of the sand layer. The main reason is that the permeability coefficient of the clay layer is much smaller than that of the sand layer. Pumping causes the pore pressure of the water-bearing sand layer to decrease rapidly, whereas that of the clay layer decreases slowly. However, the clay layer compresses more due to its small elastic modulus. The pore pressure decreases over time, and the compression of the clay layer increases slowly.
The permeability coefficient of the clay layer significantly influences the simulation results. However, the effects of the permeability coefficient of the sand layer are unknown. Therefore, it is necessary to analyze the influence of water level rise on ground rebound for the different permeability coefficients of the sand and clay layers. We selected permeability coefficients of the sand and clay layers that were 0.1 and 10 times the normal values to calculate the rebound amount of the soil layers during water level recovery.
Different permeability coefficients have varying effects on the different layers. In the second confined aquifer, the rebound value of the sand layer in the hanging wall (Figure 13a) and the footwall (Figure 13b) is the largest at 0.1 times the normal permeability coefficient, and the rebound value is the smallest at 10 times the normal permeability coefficient. Thus, the lower the permeability coefficient of the sand layer, the larger the rebound resulting from a rise in the water level. However, the opposite is observed for the phreatic aquifer and the first confined aquifer, i.e., the higher the permeability coefficient, the larger the rebound in the sand and clay layers. As the water level in the sand layer rises, the pore pressure increases, resulting in a pore pressure difference between the sand and clay layers. A high permeability coefficient of the clay layer facilitates water seepage, leading to rapid increases in pore water pressure, reducing the effective stress of the soil, and increasing the rebound. Therefore, we observed similar responses in the phreatic aquifer and the first confined aquifer.
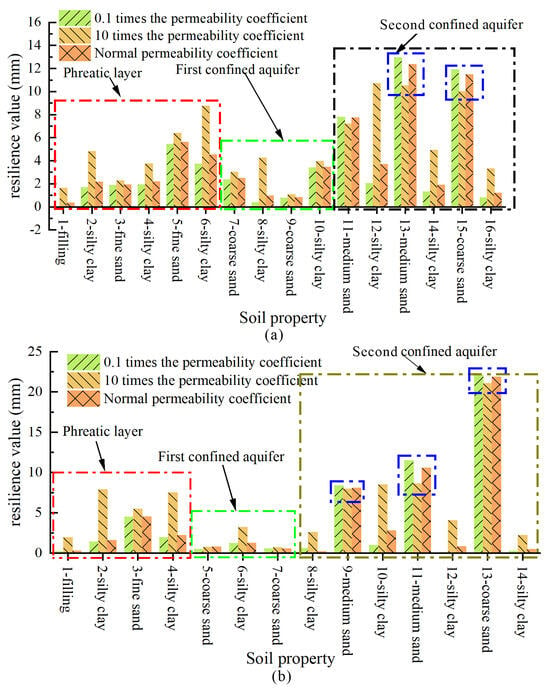
Figure 13.
Rebound values for different permeability coefficients: (a) Hanging wall; (b) Footwall.
5.3. The Influence of the Water Level Recovery Rate on Ground Rebound
Due to the differences in the permeability coefficient between the clay and sand layers, the pumping speed affects land subsidence [25,43,44,45]. Short-term rapid pumping causes a sharp drop in the water level, creating a significant hydraulic gradient. The clay layer has low permeability and slow drainage, which may generate temporary high water pressures, exacerbating the risk of subsidence. Long-term slow pumping results in a slow decline in the water level and a larger settlement area with a lower settlement rate because the water in the clay layer has sufficient time to drain. As a result, the settlement is more uniform, but the cumulative settlement is higher. The rate of water level rise significantly affects ground rebound. The simulation time is long when the water level rises slowly.
We utilized rates of water level rise that were 5 and 0.2 times the normal rate to analyze the rebound in different soil layers under the same water head condition. In the second confined aquifer, the rebound values of the sand layers of the hanging wall (Figure 14a) and the footwall (Figure 14b) are the largest at the normal rate of water level rise and the smallest at 0.2 times the normal rate. In the phreatic aquifer and the first confined aquifer, the rebound of the sand layer is the largest at 0.2 times the normal rate and the smallest at 5 times the normal rate. The rebound of the clay layer in the three aquifers is the largest at 0.2 times the normal rate and the smallest at 5 times the normal rate. The rate of water level rebound has a larger influence on the clay layer than on the sand layer due to the large difference in the permeability coefficient.
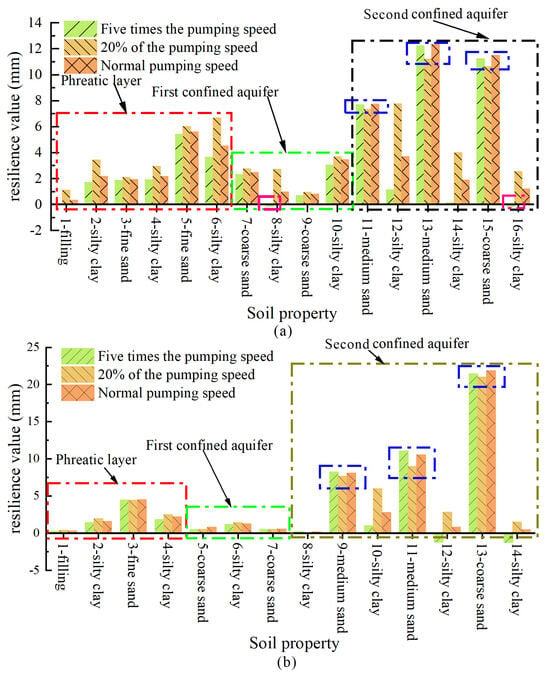
Figure 14.
Rebound values for different pumping speeds: (a) Hanging wall; (b) Footwall.
The results suggest that the lower the rate of water level rebound, the larger the amount of ground rebound, indicating a significant gap in our understanding. However, the premise of the numerical simulation is to increase the same head. The calculation time is shorter for a higher recovery rate. The seepage channel of the clay layer has not been fully formed, resulting in a small amount of rebound. The seepage time is longer at a lower water recovery rate, and the water level remains in the recovery stage for a longer period during the simulation.
6. Conclusions
This study utilized drilling and water level recovery data and InSAR monitoring results to analyze the compression deformation in different soil layers during water level recovery in the Yuhuazhai area of Xi’an. The future surface rebound trend and the core parameters affecting the rebound were investigated. The main conclusions are as follows:
- In the water level recovery stage, the rebound amount of the hanging wall of the second confined aquifer was 38.32 mm, accounting for 61.12% of the total rebound amount. The rebound amount of the first confined aquifer was 7.69 mm, accounting for 12.26%, and that of the phreatic aquifer was 16.69 mm, accounting for 26.62%. The second confined aquifer contributed the most to the total rebound.
- The formation structure affected the rebound. The soil layers of the hanging walls of the three aquifers exhibited different rebound values in the water level recovery stage. The thicker the sand layer, the higher the rebound amount.
- Based on the current water level trend, the predicted maximum rebound amount of the hanging wall (footwall) in the next five years was 2.8 mm (2.6 mm). The difference (0.2 mm) will not significantly impact existing buildings.
- The elastic modulus exhibited a significant linear correlation with the ground rebound. The difference in the permeability coefficient between the clay and sand layers is the dominant reason for the different rebound values. Continuous water level recovery increases ground rebound.
Author Contributions
Methodology, F.C.; software, G.H.; validation, G.H., F.C. and Y.S.; formal analysis, Q.L.; investigation, F.Q.; resources, S.Z.; data curation, S.Z.; writing—original draft preparation, G.H.; writing—review and editing, F.C.; visualization, F.C.; supervision, Q.L.; project administration, Q.L.; funding acquisition, F.Q. All authors have read and agreed to the published version of the manuscript.
Funding
This research was funded by the Observation and Research Station of Ground Fissure and Land Subsidence, Ministry of Natural Resources, Xi’an, Shaanxi, 710054 (Project code: 202307), and the Key Laboratory of Earth Fissures Geological Disaster, Ministry of Natural Resources (grant number EFGD2024060).
Institutional Review Board Statement
Not applicable.
Informed Consent Statement
Not applicable.
Data Availability Statement
The original contributions presented in this study are included in the article. Further inquiries can be directed to the corresponding author.
Acknowledgments
We sincerely thank the review experts and editors for their valuable suggestions, which have significantly improved the logic and completeness of this paper.
Conflicts of Interest
The authors declare no conflicts of interest.
References
- Tian, M. Response and contral factors of surface deformation in the middle and upper regions of the Chaobai River alluvial fan for the groundwater recharge of South-North Water Diversion Project. Geol. Rev. 2024, 70, 1571–1586. [Google Scholar]
- Zhang, J.; Hu, K.; Yue, W.; Liu, B.; Wang, J.; Gao, Q. Land subsidence in shanghai city and its response to groundwater exploitation and reinjection. Resour. Environ. Yangtze Basin 2016, 25, 567–572. [Google Scholar]
- Wang, X.; Luo, Z.J.; Li, Z.; Zhao, Q.; Dai, J. The impact of groundwater recharge on land subsidence: A case study from the Cangzhou test area, Hebei Province, China. Hydrogeol. J. 2023, 31, 813–825. [Google Scholar] [CrossRef]
- Qu, C. Analysis on Recharge Test at Lujiazui Area in Shanghai. Chin. J. Undergr. Space Eng. 2014, 10, 295–298. [Google Scholar]
- Coda, S.; Tessitore, S.; Di Martire, D.; Calcaterra, D.; De Vita, P.; Allocca, V. Coupled ground uplift and groundwater rebound in the metropolitan city of Naples (southern Italy). J. Hydrol. 2019, 569, 470–482. [Google Scholar] [CrossRef]
- Shi, X.; Feng, Z.; Yao, B.; Huang, X.; Wu, J. Study on the deformation characteristics of soil layers after banning groundwater pumping in su-xi-chang area. Quat. Sci. 2014, 34, 1062–1071. [Google Scholar]
- Luo, Y.; Yan, X.; Yang, T.; Ye, S.; Wu, J. Space-time characteristics of exploitation and recharge of groundwater and land subsidence of Shanghai’s land area. J. Nanjing Univ. Nat. Sci. 2019, 55, 449–457. [Google Scholar]
- Luo, Y.; Ye, S.; Wu, J.; Jiao, X.; Wang, H. Characterization of Land Subsidence During Recovery of Groundwater Levels in Shanghai. Geol. J. China Univ. 2015, 21, 243–254. [Google Scholar]
- Bai, Z.C.; Wang, Y.P.; Balz, T. Beijing Land Subsidence Revealed Using PS-InSAR with Long Time Series TerraSAR-X SAR Data. Remote Sens. 2022, 14, 2529. [Google Scholar] [CrossRef]
- Dong, J.; Guo, S.K.; Wang, N.; Zhang, L.; Ge, D.Q.; Liao, M.S.; Gong, J.Y. Tri-decadal evolution of land subsidence in the Beijing Plain revealed by multi-epoch satellite InSAR observations. Remote Sens. Environ. 2023, 286, 17. [Google Scholar] [CrossRef]
- Wang, Y.K.; Gong, H.L.; Zhou, C.F.; Wang, Q.; Wang, H.T.; Zhang, J.C. Decomposition and attribution analysis of the coupled evolution characteristics of groundwater and land subsidence in the Beijing-Tianjin-Hebei Plain. J. Hydrol. Reg. Stud. 2025, 59, 17. [Google Scholar] [CrossRef]
- Shi, W.; Chen, G.; Meng, X.M.; Jiang, W.Y.; Chong, Y.; Zhang, Y.; Dong, Y.; Zhang, M.S. Spatial-Temporal Evolution of Land Subsidence and Rebound over Xi’an in Western China Revealed by SBAS-InSAR Analysis. Remote Sens. 2020, 12, 3756. [Google Scholar] [CrossRef]
- Wang, B.H.; Zhao, C.Y.; Zhang, Q.; Peng, M.M. Sequential InSAR Time Series Deformation Monitoring of Land Subsidence and Rebound in Xi’an, China. Remote Sens. 2019, 11, 2854. [Google Scholar] [CrossRef]
- Li, G.R.; Zhao, C.Y.; Wang, B.H.; Peng, M.M.; Bai, L. Evolution of spatiotemporal ground deformation over 30 years in Xi’an, China, with multi-sensor SAR interferometry. J. Hydrol. 2023, 616, 14. [Google Scholar] [CrossRef]
- Sun, Y.; Yang, T.; Lu, Q.; Liu, C.; Zhan, J. Spatial-temporal evolution characteristics of land subsidence and ground fissure in yuhua village of xi’an city using sbas-insar technique. J. Eng. Geol. 2022, 30, 553–564. [Google Scholar]
- Feng, M.; Qi, Q.; Dong, Y.; Zeng, L.; Zhang, X.; Liu, W.; Li, Y.; Wang, T.; Zhang, G. Monitoring Surface Deformation in Xi’an City from 2019 to 2022 Based on Sentinel-1A Data. Northwest. Geol. 2023, 56, 178–185. [Google Scholar]
- Wei, D.; Wang, S. Settlement monitoring and analysis along Xian metro line based on time series insar technology. Prog. Geophys. 2024, 39, 498–509. [Google Scholar]
- Yang, Y.; Li, G.-M.; Dong, Y.-H.; Li, M.; Yang, J.-Q.; Zhou, D.; Yang, Z.-S. Simulation of the impact of the South to North Water Transfer Project on groundwater in the Beijing plain. In Proceedings of the 7th International Groundwater Quality Conference, Zurich, Switzerland, 13–18 June 2010; Eawag: Dübendorf, Switzerland, 2011; pp. 88–91. [Google Scholar]
- Glass, J.; Rico, D.A.V.; Stefan, C.; Nga, T.T.V. Simulation of the impact of managed aquifer recharge on the groundwater system in Hanoi, Vietnam. Hydrogeol. J. 2018, 26, 2427–2442. [Google Scholar] [CrossRef]
- Luo, Z.; Yao, B.; Wang, X. Three Dimension Numerical Model of Groundwater Resource Evaluation of Complex Aquifer System. J. Jilin Univ. 2005, 35, 188–194. [Google Scholar]
- Yang, K.L.; Xu, C.J.; Zeng, C.F.; Zhu, L.; Xue, X.L.; Han, L. Analysis of Recharge Efficiency Under Barrier Effects Incurred by Adjacent Underground Structures. Water 2025, 17, 257. [Google Scholar] [CrossRef]
- Du, J.J.; Zhang, Y.; Luo, Z.J.; Zhang, C.H. Prediction of Ground Subsidence Induced by Groundwater Mining Using Three-Dimensional Variable-Parameter Fully Coupled Simulation. Water 2024, 16, 2487. [Google Scholar] [CrossRef]
- Li, B.L.; Jiang, L.L.; Wang, D.L.; Yin, Y.; Shen, Y.P.; Han, Y.X. Study on the Deformation Characteristics of Railway Subgrade Structures Induced by Groundwater Level Changes. Adv. Civ. Eng. 2025, 2025, 5559122. [Google Scholar] [CrossRef]
- Intui, S.; Inazumi, S.; Soralump, S. Sustainability of Soil/Ground Environment under Changes in Groundwater Level in Bangkok Plain, Thailand. Sustainability 2022, 14, 10908. [Google Scholar] [CrossRef]
- Xiong, X.; Luo, Y.; Shi, X.; Wu, J.; Wu, J. Three-dimensional Land Subsidence Modeling Based on TOUGH2-FLAC~(3D)and Control Strategies Evaluation. Geol. J. China Univ. 2017, 23, 172–180. [Google Scholar]
- Xu, C.H.; Yu, D.D.; Liu, G.; Luo, Z.J.; Li, Z. Numerical Simulation of Artificial Recharge Groundwater Effect on Overlying Soft Clay Compression Control. Adv. Civ. Eng. 2023, 2023, 6615699. [Google Scholar] [CrossRef]
- Liu, X.; Song, X.; Tan, Y.; Jing, X. Field tests on groundwater recharge of deep excavations in Nantong water-rich sandy stratum. Chin. J. Geotech. Eng. 2020, 42, 1331–1340. [Google Scholar]
- Chang, Y.S.; Lv, L.; Wang, X.D.; Xie, R.Z.; Wang, Y.P. The influence of withdrawal-recharging pattern on the deformation characteristics of sand in confined aquifer. Heliyon 2024, 10, 9. [Google Scholar] [CrossRef]
- Wang, B.; Zhu, L.; Pan, D.; Guo, L.; Peng, P. Research on temporal and spatial evolution law of land subsidence in Zhengzhou. Remote Sens. Land Resour. 2020, 32, 143–148. [Google Scholar]
- Zhang, S.; Li, M.; Liu, Z.; Si, J.; Wu, W.; Zhang, Y. Temporal and Spatial Distribution Characteristics of Land Subsidence in Xian-Xianyang Interpreted by Time-Series InSAR. J. Geod. Geodyn. 2024, 44, 391–397. [Google Scholar]
- Liu, M.Y.; Zhang, Q.Q.; Gong, X.L.; Xu, S.G.; Gu, C.S.; Zhang, Y. Study on soil deformation characteristic and the life process of land subsidence in Changzhou Area of Jiangsu Province. Shanghai Land Resour. 2022, 43, 50–55+72. [Google Scholar]
- Wu, J.H.; Shi, B.; Cao, D.F.; Jiang, H.T.; Wang, X.F.; Gu, K. Model test of soil deformation response to draining-recharging conditions based on DFOS. Eng. Geol. 2017, 226, 107–121. [Google Scholar] [CrossRef]
- Wang, Q.; Peng, J.; Jiang, Z.; Teng, H. Numerical simulation and layerwise mark monitoring of land subsidence and ground fissures of typical section in Xian. Rock Soil Mech. 2014, 35, 3298–3302. [Google Scholar]
- Li, N.; Li, M.; Zhao, F.; Wang, Q. Numerical Simulation Analysis of Xian Land Subsidence by FLAC~(2D). J. Catastrophol. 2013, 28, 210–214. [Google Scholar]
- Jiang, Z.; Peng, J.; Wang, Q. Influence of pre-existing fault on ground fissures during pumping action. J. Eng. Geol. 2010, 18, 651–656. [Google Scholar]
- Jiang, Z.; Peng, J.; Wang, Q. Numerical Simulation of the Effect of Preexisting Fault on Land Subsidence and Ground Fissures During Pumping. J. Jilin Univ. Earth Sci. Ed. 2012, 42, 1099. [Google Scholar]
- Yun, J.S.; Yoo, H.K.; Hwang, S.P.; Kim, W.S.; Kim, H.E. Prediction of Settlement Due to Shield TBM Tunneling Based on Three-Dimensional Numerical Analysis. Buildings 2025, 15, 2235. [Google Scholar] [CrossRef]
- Zhang, L.L.; Cheng, H. Layered mechanics model for surface movement and deformation due to confined aquifer pumping. J. Theor. Appl. Mech. 2025, 63, 59–74. [Google Scholar] [CrossRef]
- Ma, F.H.; Li, S.L.; Wang, Q.Y. Study on the Impact of Deep Foundation Excavation of Reclaimed Land on the Deformation of Adjacent Subway Tunnels. Buildings 2024, 14, 1771. [Google Scholar] [CrossRef]
- Kim, H.; Nam, K.M.; Ha, S.-G.; Yoo, H.K. A numerical study on the behavior of existing and enlarged tunnels when widened by applying the pre-cutting method. J. Korean Tunn. Undergr. Space Assoc. 2020, 22, 451–468. [Google Scholar]
- Isotton, G.; Ferronato, M.; Gambolati, G.; Teatini, P. On the possible contribution of clayey inter-layers to delayed land subsidence above producing aquifers. In Proceedings of the Prevention and Mitigation of Natural and Anthropogenic Hazards Due to Land Subsidence, Nagoya, Japan, 15–19 November 2015; pp. 519–523. [Google Scholar]
- Ding, G.; Hu, C.; Chen, H.; Chen, G.; Li, L. Permeability characteristics of clay in land subsidence center at Hengshui, Hebei, China. J. Eng. Geol. 2012, 20, 82–87. [Google Scholar]
- Qin, H.H.; Andrews, C.B.; Tian, F.; Cao, G.L.; Luo, Y.; Liu, J.R.; Zheng, C.M. Groundwater-pumping optimization for land-subsidence control in Beijing plain, China. Hydrogeol. J. 2018, 26, 1061–1081. [Google Scholar] [CrossRef]
- Xiong, X.; Shi, X.; Wu, J.; Wu, J. 3D numerical simulation of elasto-plastic land subsidence induced by groundwater pumping. Hydrogeol. Eng. Geol. 2017, 44, 151–159. [Google Scholar]
- He, G.F.; Yan, X.X.; Zhang, Y.; Yang, T.L.; Wu, J.C.; Bai, Y.; Gu, D. Experimental Study on the Vertical Deformation of Soils due to Groundwater Withdrawal. Int. J. Geomech. 2020, 20, 12. [Google Scholar] [CrossRef]
Disclaimer/Publisher’s Note: The statements, opinions and data contained in all publications are solely those of the individual author(s) and contributor(s) and not of MDPI and/or the editor(s). MDPI and/or the editor(s) disclaim responsibility for any injury to people or property resulting from any ideas, methods, instructions or products referred to in the content. |
© 2025 by the authors. Licensee MDPI, Basel, Switzerland. This article is an open access article distributed under the terms and conditions of the Creative Commons Attribution (CC BY) license (https://creativecommons.org/licenses/by/4.0/).