Article

Three-Dimensional-Printed Lateral Extraction Enhanced Desorption Electrospray Ionization Source for Mass Spectrometry

1
Beijing Institute of Space Long March Vehicle, Beijing 100076, China
2
Tsinghua Shenzhen International Graduate School, Tsinghua University, Shenzhen 518055, China
*
Author to whom correspondence should be addressed.
Appl. Sci. 2025, 15(17), 9468; https://doi.org/10.3390/app15179468
Submission received: 15 July 2025 / Revised: 23 August 2025 / Accepted: 26 August 2025 / Published: 28 August 2025
(This article belongs to the Special Issue Analytical Chemistry: Techniques and Applications)

Abstract

This paper introduces a novel Lateral Extraction Enhanced Desorption Electrospray Ionization (LEE-DESI) source. This source is specifically designed to tackle the crucial issue of electric field interference in dual-channel ambient ionization mass spectrometry (AIMS). By incorporating dual-channel spraying-based desorption and extraction into a 3D-printed chamber with optimized spatial parameters, the system effectively reduces cross-channel interference while boosting ionization efficiency. The desorption spray is responsible for desorbing analytes from untreated samples, and the extraction spray further ionizes more neutral droplets through charge transfer, which substantially enhances sensitivity. Compared with traditional DESI, the LEE-DESI source demonstrates improved detection limits, reproducibility, and operational simplicity, as validated using Rhodamine B, L-arginine, and Angiotensin I, as well as drug standards including methadone, ketamine, and fentanyl. This highlights its potential for high-throughput analysis of complex matrices in proteomics, metabolomics, and biomedical applications.

1. Introduction

Mass spectrometry technology is employed to separate and detect charged molecular ions according to their mass-to-charge ratio. Given its high sensitivity, selectivity, and throughput capabilities, it assumes a pivotal role in various fields, including proteomics, metabolomics, food safety, biomedical analysis, and chemical imaging. Ionization is one of the core technologies in mass spectrometry. In 2004, Cooks proposed Desorption Electrospray Ionization (DESI), which made it possible to perform direct mass spectrometric analysis on untreated samples [1]. In 2005, Durst introduced Direct Analysis in Real Time (DART) [2]. Subsequently, the concept of Ambient Ionization Mass Spectrometry (AIMS) was proposed and has since become a research focus [3,4,5,6,7,8].
Recent advances in 3D printing have significantly impacted chemical analysis due to its rapid design–prototype cycles, cost-effectiveness, and customizable open-source features [9,10,11,12]. This technology shows particular promise for mass spectrometry enhancement, where commercially available ambient ionization sources remain limited, creating substantial replication challenges for researchers. Crucially, ambient ionization’s relatively lenient material requirements compared to conventional techniques enable effective integration with 3D-printed components. Elviri et al. demonstrated that 3D-printed PLA sample holders for DESI could double the signal intensity compared to conventional PTFE fixtures [13]. Chen et al. developed textile-based electrofluidic devices coupled with DESI-MS for protein preconcentration [14]. Zemaitis et al. implemented a fully 3D-printed DESI source for rat brain tissue imaging [15]. These cases demonstrate how 3D printing’s rapid prototyping, customization, and cost-efficiency can transform specialized, hard-to-commercialize MS technologies. Our work extends this approach by developing a 3D-printed chamber, specifically addressing dual-spray interference challenges while retaining these manufacturing advantages.
The implementation of dual-channel and multi-channel spray in AIMS presents two significant advantages: streamlining sample pretreatment procedures to facilitate high-throughput detection and enhancing analytical performance, such as improving detection sensitivity. Dual-channel and multi-channel spray ionization technologies have extensive application requirements in precise mass analysis [16,17], the detection of complex matrix samples [18,19], sensitivity improvement [20,21], and high-throughput analysis of macromolecular compounds [22,23,24,25,26]. Huang et al. developed a high-throughput induced nano-spray array ionization technology [27]. Li et al. proposed a dual-channel induced nano-spray device for internal calibration [16]. Chambers et al. designed a glass-based microfluidic device featuring two independent electrospray nozzles to sequentially ionize solutions for mass analysis [17]. Yu et al. introduced a multi-channel ionization technology based on microfluidic chips for extracting and ionizing complex matrices without the need for sample pretreatment [20]. Luo’s research group proposed a multi-channel rotating electrospray ionization technique in which desorbed analytes were simultaneously ionized by multiple spray solvents, enabling mass spectrometric detection of various compounds in complex matrices [21].
In studies employing dual or multiple sprays concurrently for high-throughput analysis, researchers have noted significant electric field interference among independently charged spray tips. To enable simultaneous and independent charged spray functionality in dual- or multi-channel systems, numerous studies have resorted to compromise-based solutions or have implemented ingenious structural designs to alleviate this problem. The mutual interference between charged sprays is a crucial challenge that must be urgently resolved in the development of dual- and multi-channel spray ionization technologies. It is also one of the key issues addressed in this paper.
In recent years, 3D-printed chambers have been used in self-aspiration capillary electrospray ionization [28] (SACESI) and self-aspiration corona discharge ionization ion sources [29] (SACDI), resulting in a very stable ionization effect; however, the multi-channel electrospray system used for extraction and desorption lacks such standardized interface designs. Thus, in this paper, we propose a lateral extraction enhanced desorption electrospray ionization source (LEE-DESI). As illustrated in Figure 1, a glass slide physically separated the two spray channels to prevent direct interaction. The sample was deposited on one side of the slide, where the desorption spray desorbed charged droplets from the sample surface. Due to the inherently low ion collection efficiency of DESI and the aerosolizing effect of high-pressure nitrogen, some neutral sample droplets were generated. These neutral droplets were then transported to the region near the mass spectrometer inlet, where the extraction spray from the opposite side generated charged droplets. Collisions between the charged extraction droplets and neutral desorption droplets facilitate energy and charge transfer, enabling the extraction and ionization of neutral species.
By incorporating dual-channel sprays into DESI—one for desorption and the other for extraction—the ionization efficiency during the desorption process is enhanced, thus boosting the desorption signal of samples. The ion source makes use of 3D printing technology to fix the optimized spatial parameters of the DESI setup and prevent electric field interference between the dual-channel charged sprays. Compared with traditional DESI, it demonstrates advantages such as high sensitivity, low detection limits, good reproducibility, and user-friendly operation. These advantages were validated using a range of representative compounds: Rhodamine B as a model dye for sensitivity testing, L-arginine and Angiotensin I as representatives of small molecules and peptides, respectively, and methadone, ketamine, and fentanyl as examples of controlled substances to demonstrate applicability in forensic and biomedical analysis.

2. Materials and Methods

2.1. Materials and Instruments

Methanol and formic acid were purchased from ANPEL (Shanghai, China) and Aladdin (Shanghai, China), respectively. We used Rhodamine B from Amper (Shanghai, China) and L-arginine and Angiotensin I (Ang I) from Aladdin (Shanghai, China) for verifying the devices. Methadone, ketamine hydrochloride, and fentanyl were provided by the Guangdong Nantian Institute of Forensic Science (Shenzhen, China). Artificial urine purchased from GEMIC (Shanghai, China) was used to dilute the ketamine hydrochloride. All of the above chemicals were of analytical reagent grade.
A single-sided frosted glass slide (Yancheng Wanyang Instrument Co., Ltd., Yancheng, China) was used to apply the sample to the surface. Quartz capillaries (100 μm i.d., 360 μm o.d., Zhengzhou Innatek Co., Ltd., Zhengzhou, China) were used for the transportation of solutions. The nitrogen (Shenzhen Huateng Special Gas Co., Ltd., Shenzhen, China) was supplied via a gas cylinder. The solution was injected using a syringe pump (KD Scientific, Holliston, MA, USA) and a microsyringe from an LCQ Fleet mass spectrometer (Thermo Fisher Scientific, Waltham, MA, USA). Three-dimensional printing (Shenzhen SANDI Technology Co., Ltd., Shenzhen, China) was applied to manufacture the LEE-DESI chamber. This design was executed using SLA 3D printing, a cost-effective manufacturing method where the material expense for a single chamber is around 150 RMB. The LEE-DESI source was tested and characterized using the LCQ Fleet mass spectrometer (Thermo Fisher Scientific, Waltham, MA, USA) and the Kirin 3 miniaturized mass spectrometer (Shenzhen Zhiqin Instrument Co., Ltd., Shenzhen, China).
Data acquisition and processing were performed using the following software: Xcalibur Qual Browser (version 2.2; Thermo Fisher Scientific, Waltham, MA, USA) for viewing, and processing raw data; and Origin (version 2022; OriginLab Corporation, Northampton, MA, USA) for statistical analysis and figure plotting.

2.2. Device Structure

Prior to finalizing the spatial parameters through 3D printing, we established two experimental platforms: (1) a laboratory DESI platform for systematic optimization of the basic spray geometry and (2) a laboratory LEE-DESI platform for investigating the feasibility of dual independent charged sprays and verifying whether the significant electric field interference between charged spray tips reported in the literature actually exists.
As depicted in Figure 2a, the key optimized parameters for the DESI platform consist of an angle α of 50°, a distance of 3 mm from the sprayer tip to the glass slide surface, and a distance of 6 mm from the mass spectrometer inlet to the edge of the glass slide. These parameters were derived through iterative testing on the laboratory DESI platform to maximize ionization efficiency and signal stability. The liquid solution of the desorption spray channel is connected to the mass spectrometer inlet system, while its gas interface is connected to a nitrogen cylinder to provide auxiliary gas delivery. The liquid solution utilizes a fused silica capillary with an outer diameter of 360 μm and an inner diameter of 100 μm. A stainless steel tube with an inner diameter of 500 μm coaxially encloses the capillary, leaving a small gap. The capillary spray tip extends 0.5 mm beyond the steel tube to facilitate the alignment of the auxiliary gas flow with the electrospray direction.
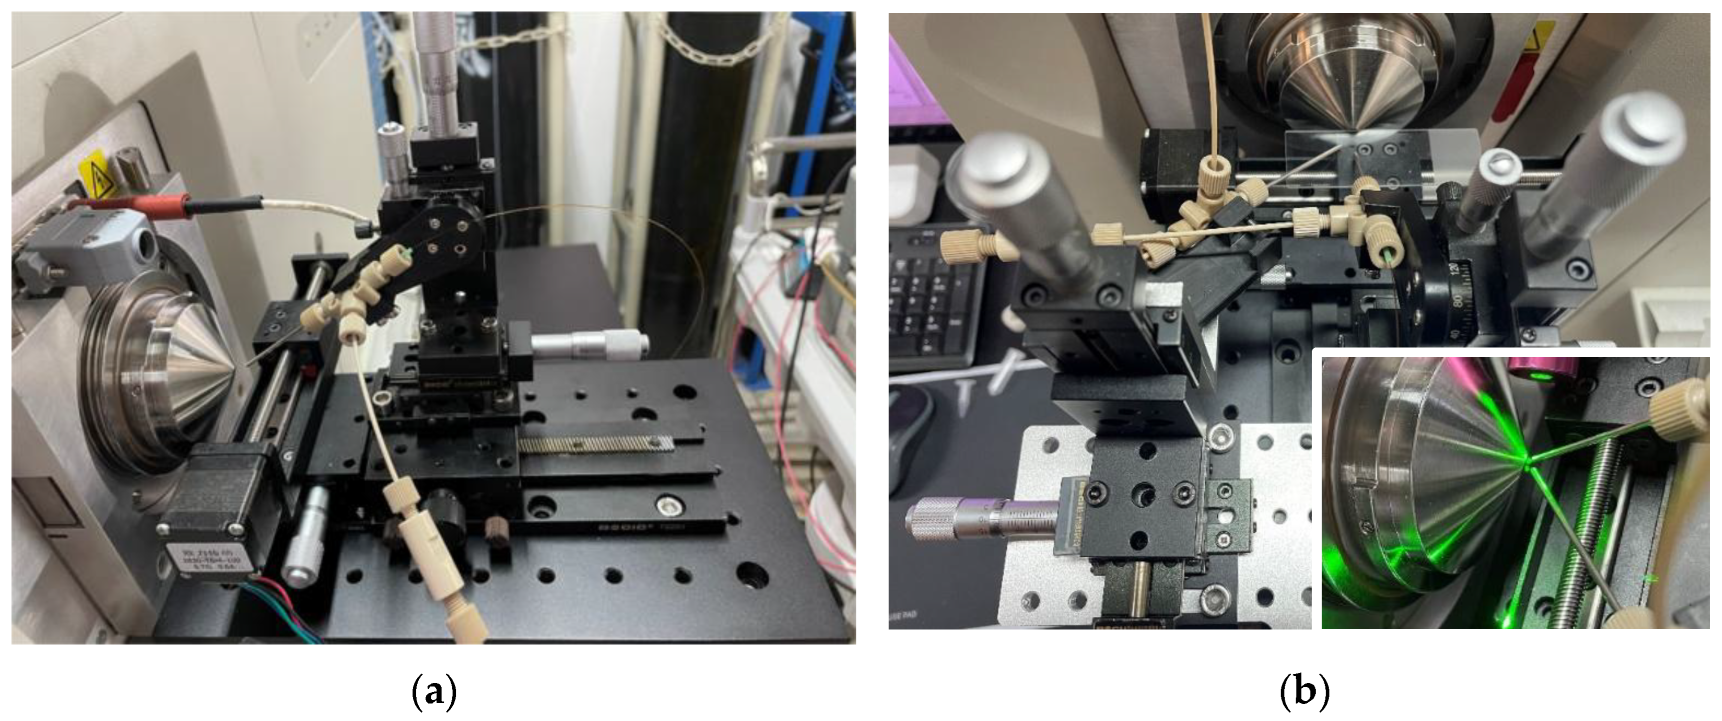
The LEE-DESI platform extends the conventional DESI platform by incorporating a precision-controlled secondary spray channel. As shown in Figure 2b, the right channel serves as the desorption electrospray path while the left channel functions as the extraction spray path. Both channels permit precise adjustment of sprayer angle and displacement, maintaining an inter-spray angle of 50°. The system operates in standard DESI mode when only the right channel is activated, whereas simultaneous activation of both channels enables LEE-DESI functionality. The extraction sprayer (left) maintains an identical configuration to the desorption sprayer (right) and thus requires no additional description. Experimental results revealed strong electric field interference between the two charged spray channels. Under laser illumination, distinct mutual repulsion between the sprays was observed with clearly visible boundaries. Furthermore, the high-speed gas flow from the desorption spray channel caused significant spray dispersion. These combined effects substantially compromised the sample detection signal intensity, demonstrating that the current LEE-DESI platform does not yet meet the requirements for successful dual-spray operation.
While the dual-spray configuration in our prototype LEE-DESI platform (Figure 2b) demonstrated suboptimal performance, we observed several notable advantages over single-channel systems. The dual-channel arrangement produced a significantly larger total spray volume. More importantly, the high-speed gas flow facilitated the convergence of charged solvent droplets from the extraction channel with both charged and neutral sample droplets from the desorption channel near the mass spectrometer inlet. This interaction enabled effective energy and charge transfer through droplet collisions, while the gas flow simultaneously enhanced desolvation of charged droplets—collectively resulting in improved sample ionization efficiency.
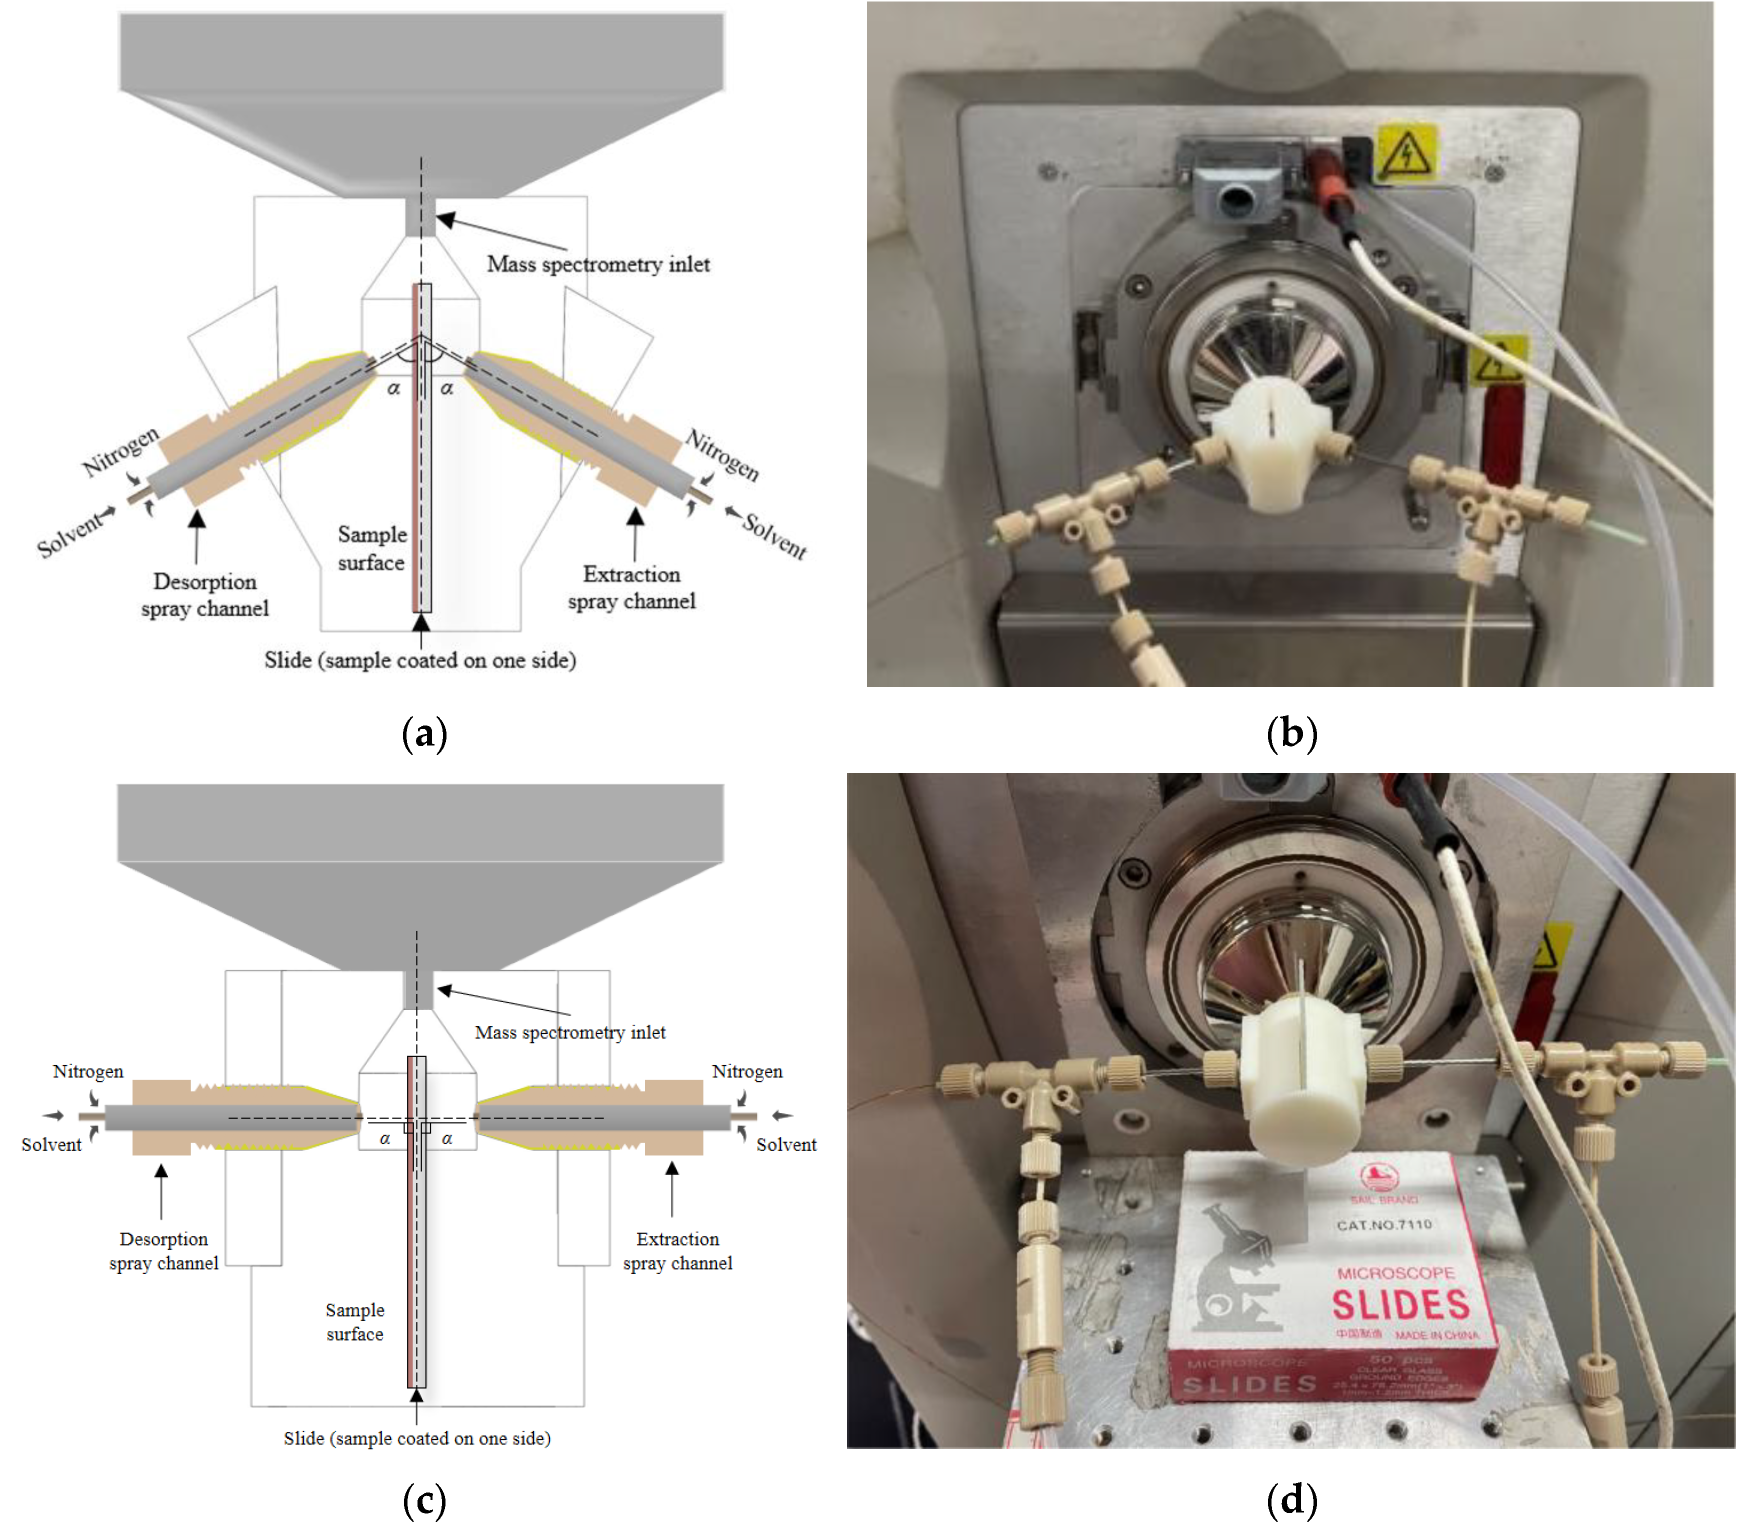
The investigation focused on developing an approach that would maintain the optimized DESI parameters while eliminating interference between dual spray channels. Three-dimensional printing technology was selected for this application due to its rapid prototyping capabilities. The resulting 3D-printed chamber was designed according to mass spectrometer interface specifications, featuring an integrated coupling interface with an orifice diameter of 2.2 mm, and incorporated the optimized DESI spatial parameters (α = 50°, 3 mm sprayer-to-surface distance, 6 mm inlet-to-slide distance). Figure 3 illustrates the integrated chamber design, where desorption and extraction spray channels are positioned on opposite sides. The chamber features a plug-and-play interface with the mass spectrometer, eliminating time-consuming alignment procedures and significantly enhancing experimental efficiency.
A critical design element involves the strategic placement of a glass slide that physically separates the two spray channels while permitting controlled droplet interactions near the MS inlet. This configuration effectively prevents direct spray interference while preserving the beneficial charge transfer effects identified in preliminary studies. The assembly protocol for the 3D-printed LEE-DESI platform mirrors that of the initial prototype (described in preceding sections), maintaining operational consistency while addressing the limitations of the earlier design.
In addition to the 50° dual-channel spray configuration, a 90° dual-channel spray setup was also tested. This extreme-angle design was implemented to investigate the operational limits of dual-spray functionality, particularly whether the spatial constraints at 90° would lead to spray failure or signal instability. The spatial parameters for the 90° setup included a distance of 3mm from the sprayer tip to the glass slide surface and a distance of 6mm from the mass spectrometer inlet to the edge of the glass slide. The liquid and gas interfaces remained identical to the 50° configuration.

2.3. Sample Preparation

Rhodamine B was dissolved in a methanol–water mixture (1:1, v/v) to prepare a 100 ppm (parts per million) standard solution. This standard solution was subsequently diluted with the same methanol–water mixture (1:1, v/v) to obtain Rhodamine B test solutions at concentrations of 50, 20, 10, 5, 2, 1, 0.5, and 0.2 ppm. Using an identical method, a 10 ppm L-arginine solution and a 100 ppm angiotensin solution were also prepared. Methadone and fentanyl were prepared as 10 ppm standard solutions, while ketamine hydrochloride was provided as a 100 ppm standard. The 100 ppm ketamine hydrochloride solution was subsequently diluted to 10 ppm using artificial urine. The prepared test solutions were applied to single-sided frosted glass slides with cotton swabs and left to dry completely. The slides were then inserted into the LEE-DESI platform for analysis, with the frosted side facing the desorption electrospray channel. A methanol–water mixture (1:1, v/v, containing 0.1% formic acid) was used as the spray solvent.

3. Results and Discussion

3.1. Optimization and Performance of the 3D-Printed DESI Platform

All experiments in this section were performed using the 50° LEE-DESI platform unless otherwise specified. First, we verified that the system has normal desorption functionality. Given that the 3D-printed LEE-DESI chamber has already fixed the optimized spatial parameters of DESI, we then moved on to optimizing three crucial parameters in the desorption spray channel: the spray voltage, solvent flow rate, and auxiliary gas pressure.
A 10 ppm Rhodamine B solution was employed as the test sample. Starting from 0 kV, the spray voltage was increased incrementally in 1 kV intervals. At each step, the peak intensity of Rhodamine B in the mass spectrum was recorded, and the maximum value was determined. The experimental results (Figure 4a) indicated that the signal intensity increased with the voltage up to 7 kV, after which it started to decline. To minimize detection variability, 6 kV was selected as the optimal spray voltage.
The flow rate was adjusted from 0 μL/min in 10 μL/min increments. The signal intensity increased steadily with the flow rate until 50 μL/min, after which it decreased (Figure 4b). To balance detection accuracy and solvent consumption, 30 μL/min was chosen as the optimal flow rate.
The auxiliary gas pressure started at 0.4 MPa. After each adjustment at intervals of 0.1 MPa, the peak intensity of Rhodamine B in the spectra was also recorded. The experimental results (Figure 4c) showed that within the range of 0.4 MPa to 0.6 MPa, the sample signal intensity increased slowly; within the range of 1.0 MPa to 1.2 MPa, the sample signal intensity decreased slowly; and within the range of 0.6 MPa to 1.0 MPa, the amplitude of the change in the sample signal intensity was relatively large. To avoid significant fluctuations in the Rhodamine B signal intensity caused by changes in the auxiliary gas pressure, 0.8 MPa was designated as the optimal auxiliary gas pressure.
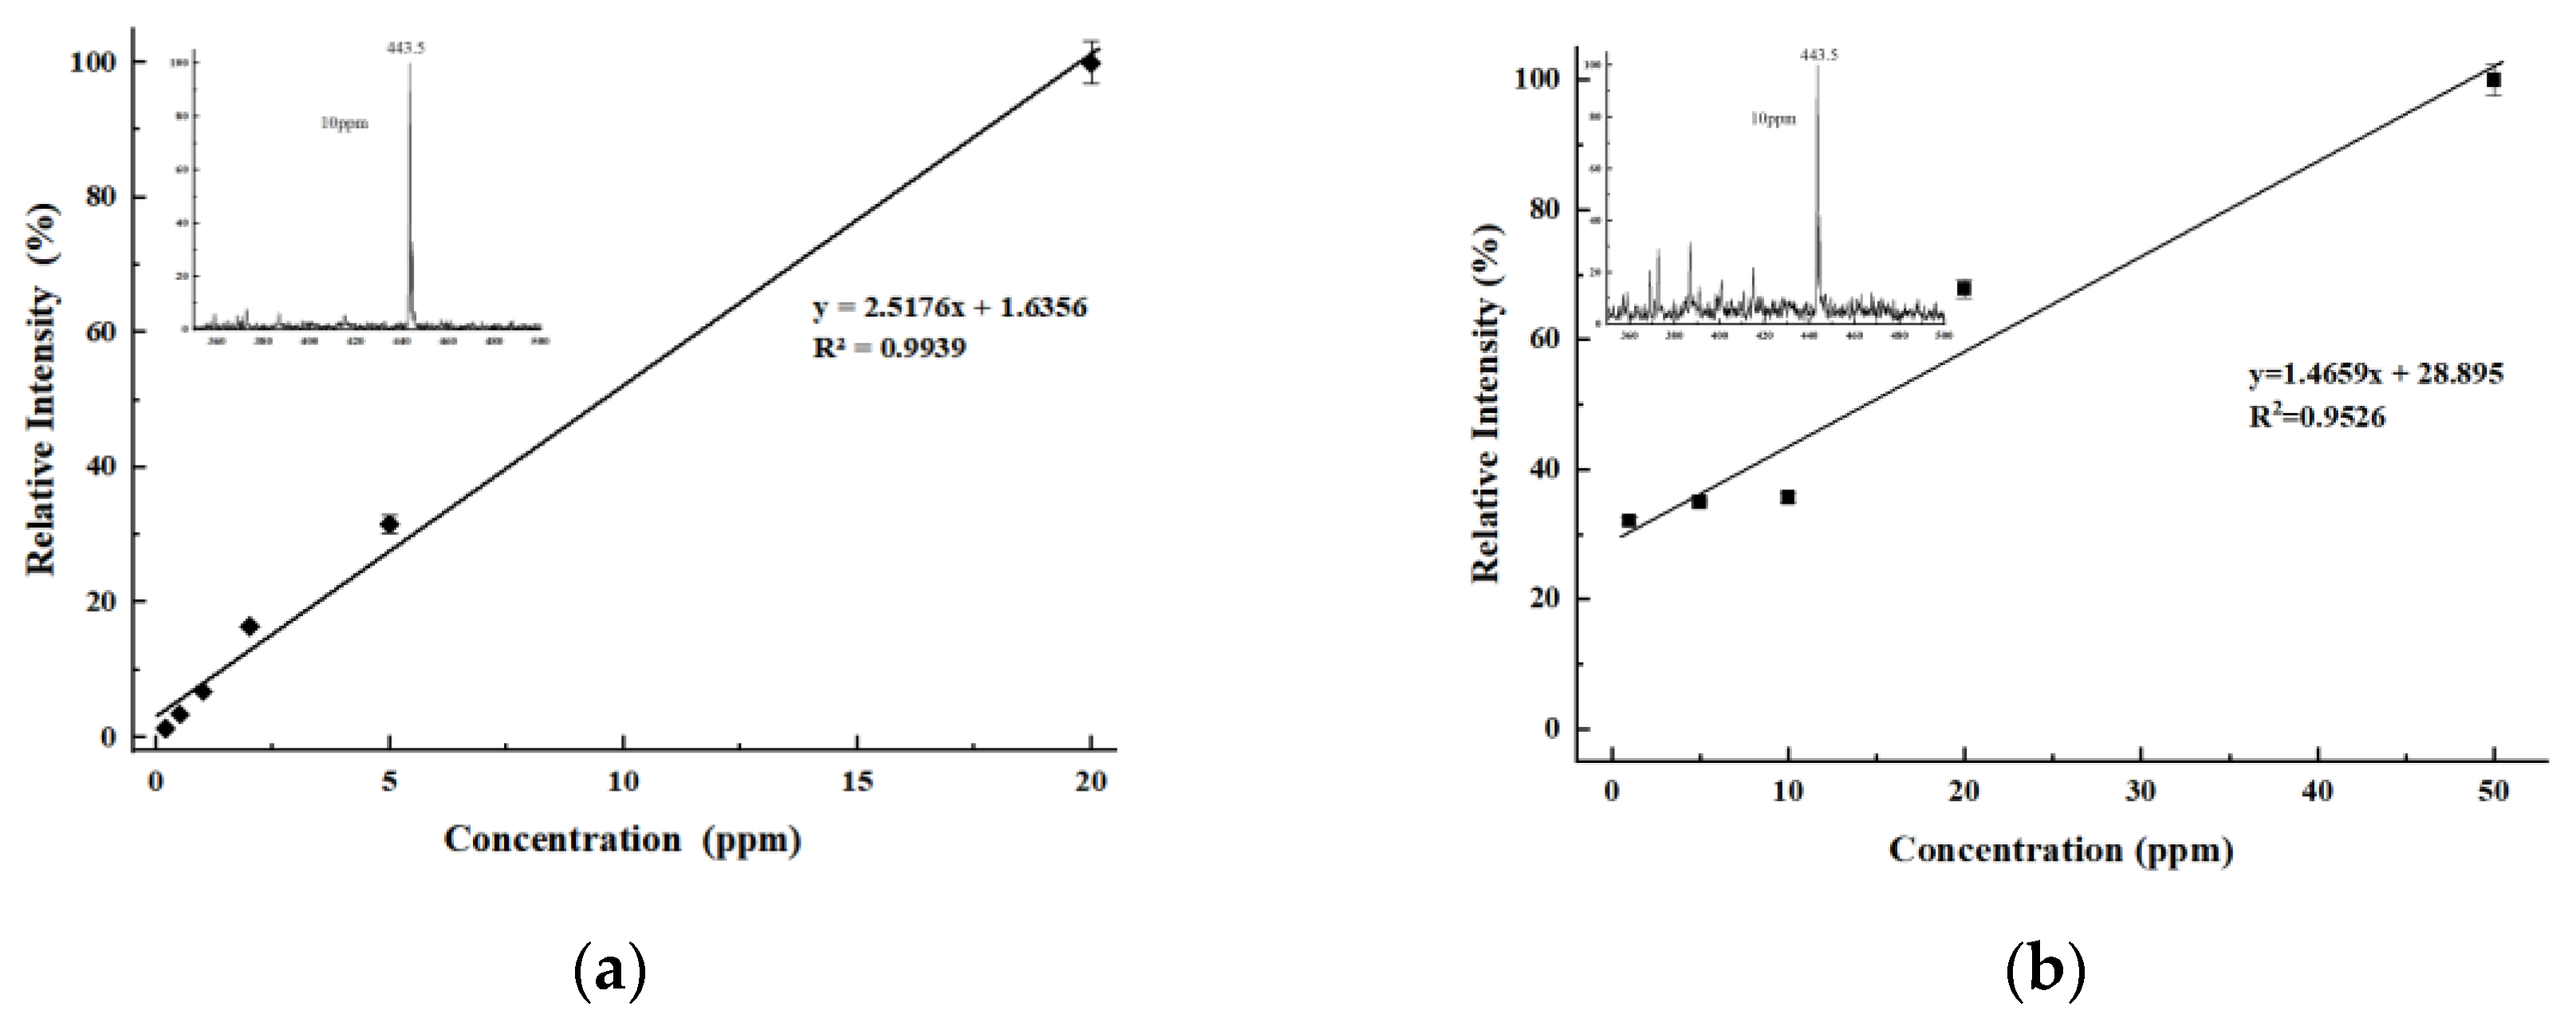
Quantitative analysis of Rhodamine B was performed using both the 3D-printed LEE-DESI platform’s desorption spray channel (six concentrations: 0.2, 0.5, 1, 2, 5, 20 ppm) (as shown in Figure 5a) and a laboratory DESI platform (five concentrations: 1, 5, 10, 20, 50 ppm) (as shown in Figure 5b), with triplicate measurements at each concentration (averaged after outlier exclusion). The 3D-printed system demonstrated superior performance, yielding a calibration curve with a correlation coefficient >0.99 compared to >0.95 for the conventional DESI platform. Mass spectra of 10 ppm Rhodamine B revealed reduced interference peaks in the 3D-printed configuration, attributable to its semi-enclosed housing that minimizes ambient contamination. This design enhanced signal-to-noise ratios, lowering the detection limit from 0.5 ppm (conventional DESI) to 0.2 ppm (3D-printed DESI). This comprehensive evaluation confirms that the 3D-printed LEE-DESI platform not only maintains all essential DESI functionalities but also delivers substantially improved analytical performance metrics, including enhanced sensitivity, superior spectral quality, and more reliable quantification.
To further validate the cleanliness of the 3D-printed chamber, we analyzed potential sample carryover by comparing signal intensities during and after sample introduction. For this test, 0.2 ppm Rhodamine B was desorbed using the LEE-DESI platform, with MS/MS detection employed to isolate target ions and prevent signal obscuration by background peaks. As shown in Figure 6, the average signal intensity of the sample (5.15E1) during the 1.4–1.9 min period significantly exceeded the background noise (6.26E0) in the 2.7–3.7 min no-sample interval. The absence of residual peaks confirms that the chamber design effectively minimizes adsorption. If interference peaks were observed, ethanol immersion (5–10 min) and drying of the device would be required, ensuring no contamination between experiments.

3.2. LEE-DESI Mode

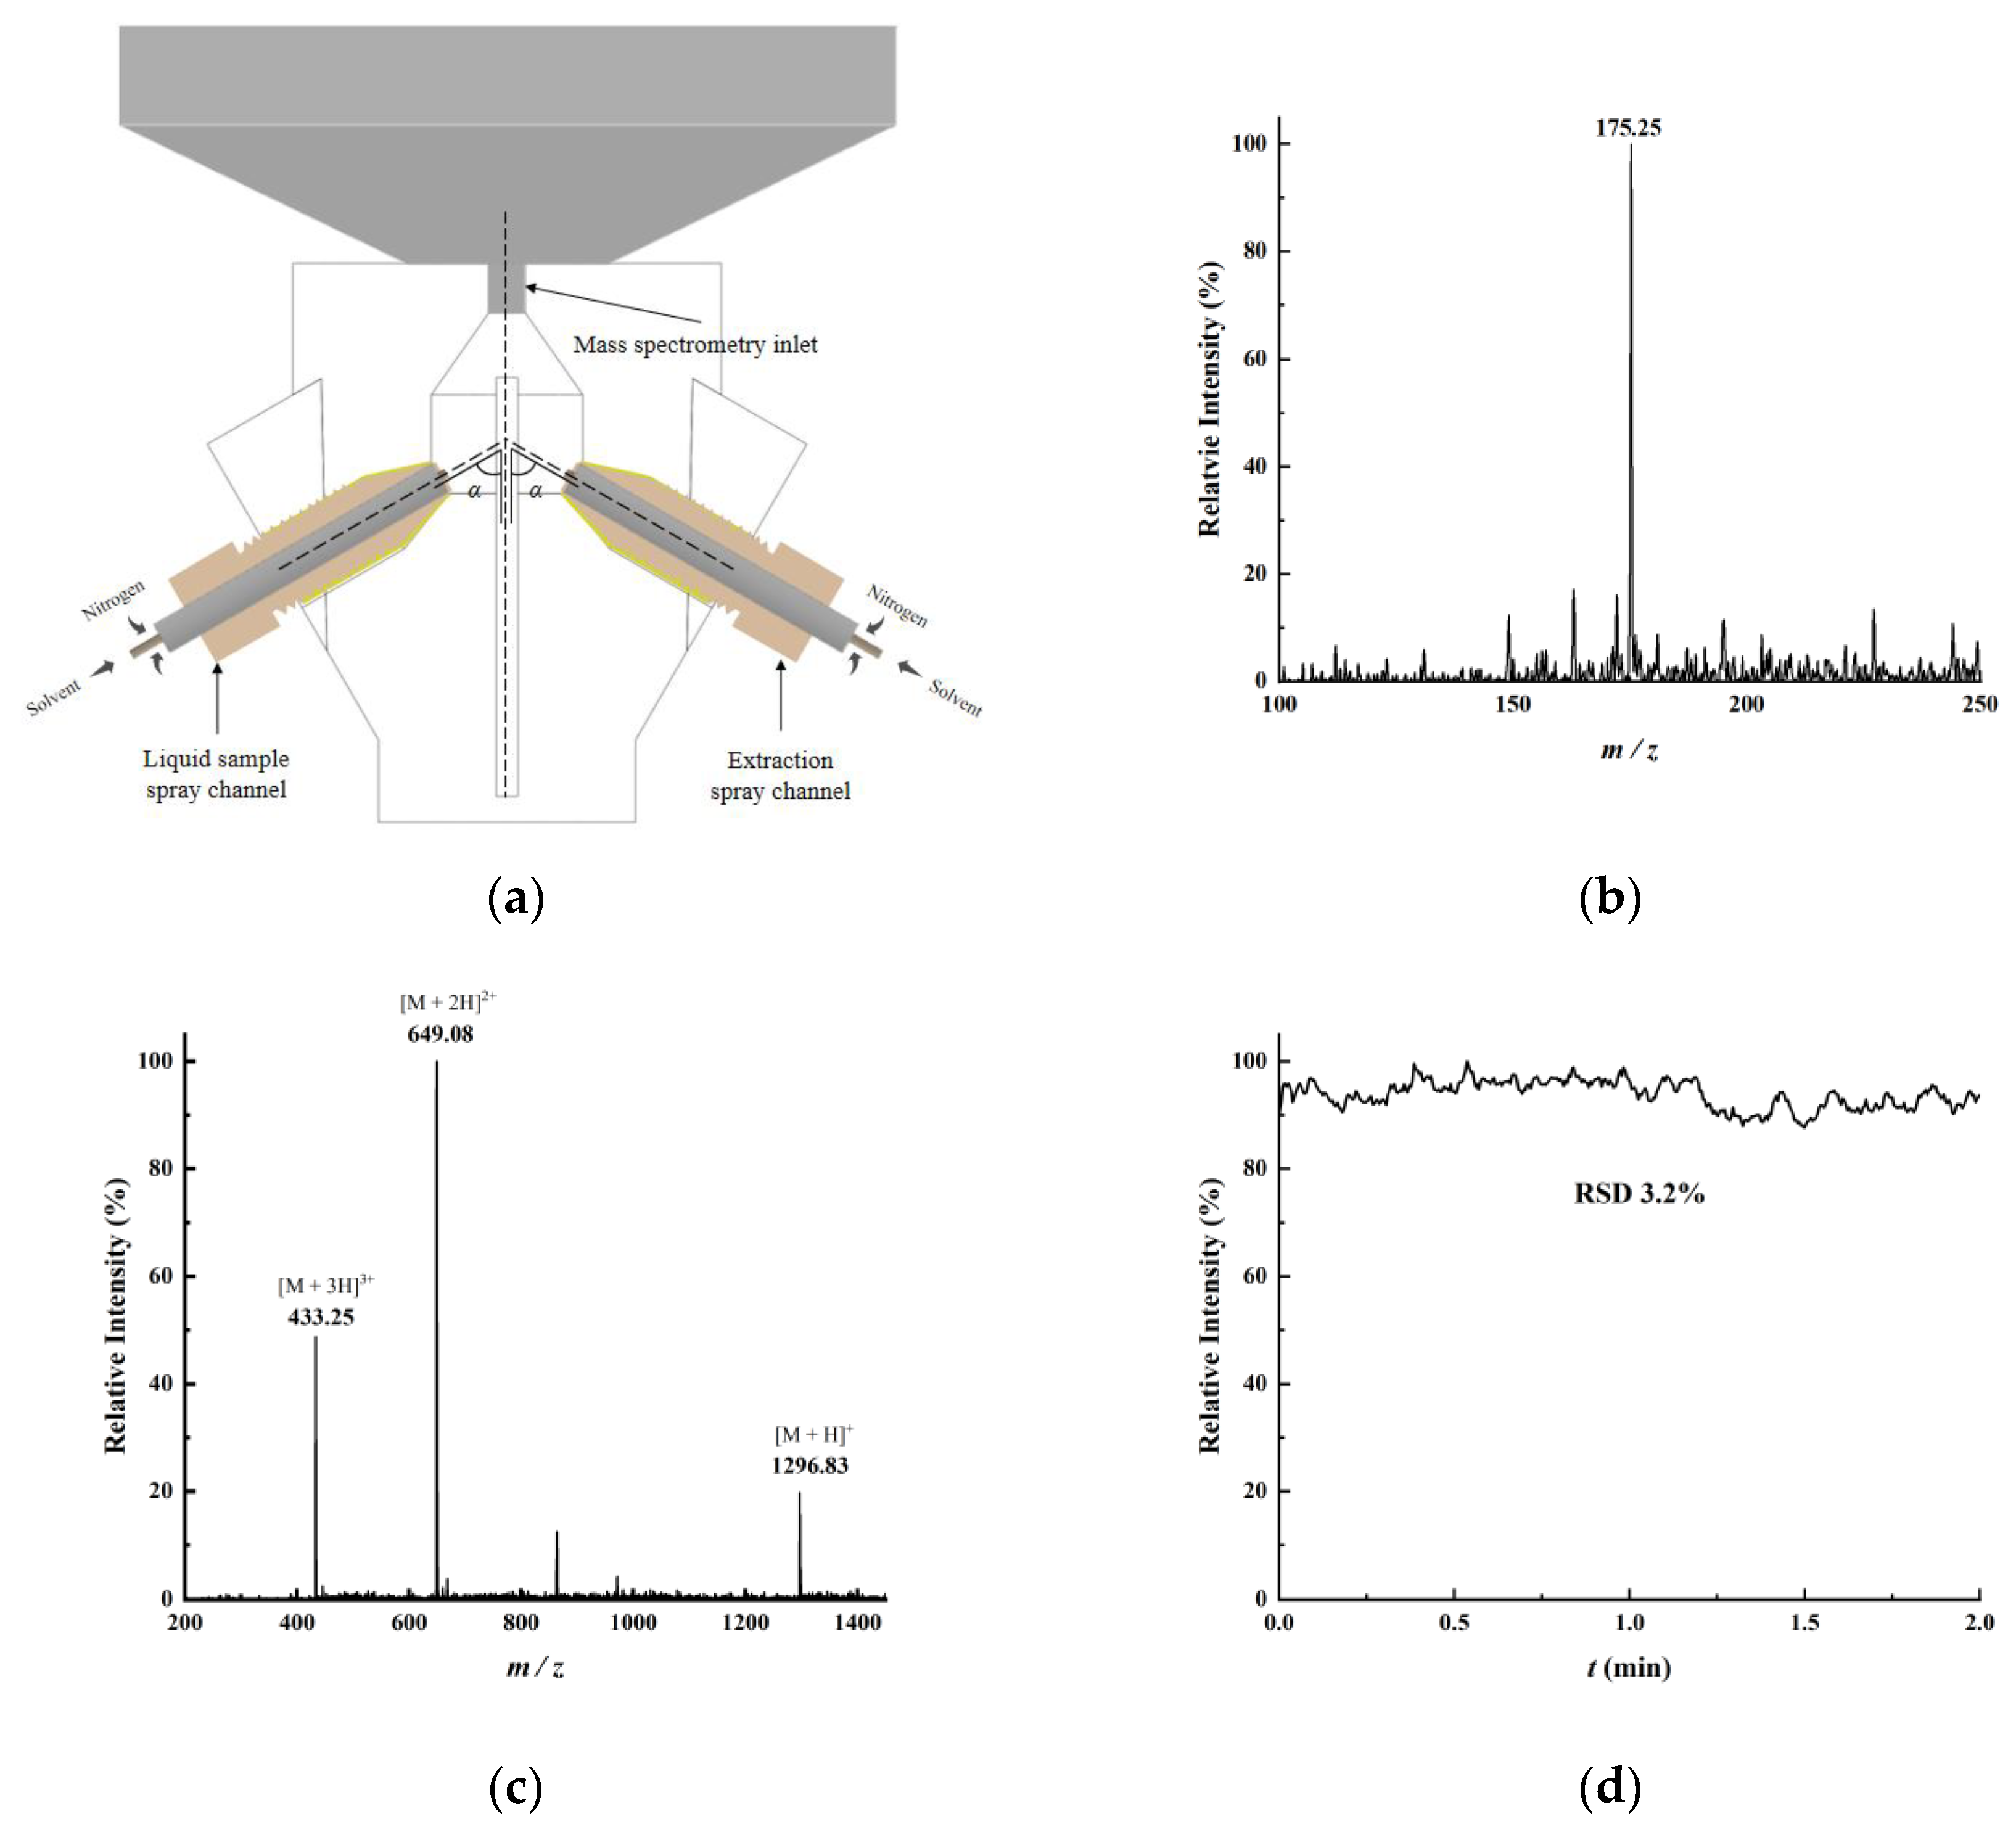
Next, using the 50° platform, we showcased the extraction ability of the full LEE-DESI mode. First, the glass slide was removed, and liquid sample analysis was carried out using the desorption spray channel (operated without high voltage) under optimized parameters: the auxiliary gas pressure was set at 0.8 MPa, and the solvent flow rate was 30 μL/min (Figure 7a). The extraction spray channel was configured with an auxiliary gas pressure of 1 MPa, a solvent flow rate of 5 μL/min, and a spray voltage of 5 kV. This working mode is similar to extraction electrospray ionization (EESI). Following system optimization, analytical performance was evaluated using two representative compounds: small-molecule L-arginine (MW 174.20) and Angiotensin I peptide. As demonstrated in Figure 7b, arginine showed its characteristic protonated molecular ion [M + H]+ at m/z 175.25 in the mass spectrum. The average mass spectrum and the 2 min total ion chromatogram (TIC) of Ang I are presented in Figure 7c,d, respectively. In Figure 7a, the prominent peaks at m/z 1297, 649, and 433 correspond with the protonated molecular ions [M + H]+, [M + 2H]2+, and [M + 3H]3+ of the peptide, respectively. The relative standard deviation (RSD) of the Ang I TIC signal over 2 min was calculated to be 3.2%. These results illustrate the stability of the mass spectrometric data, verifying that the LEE-DESI system can achieve stable extraction operation.
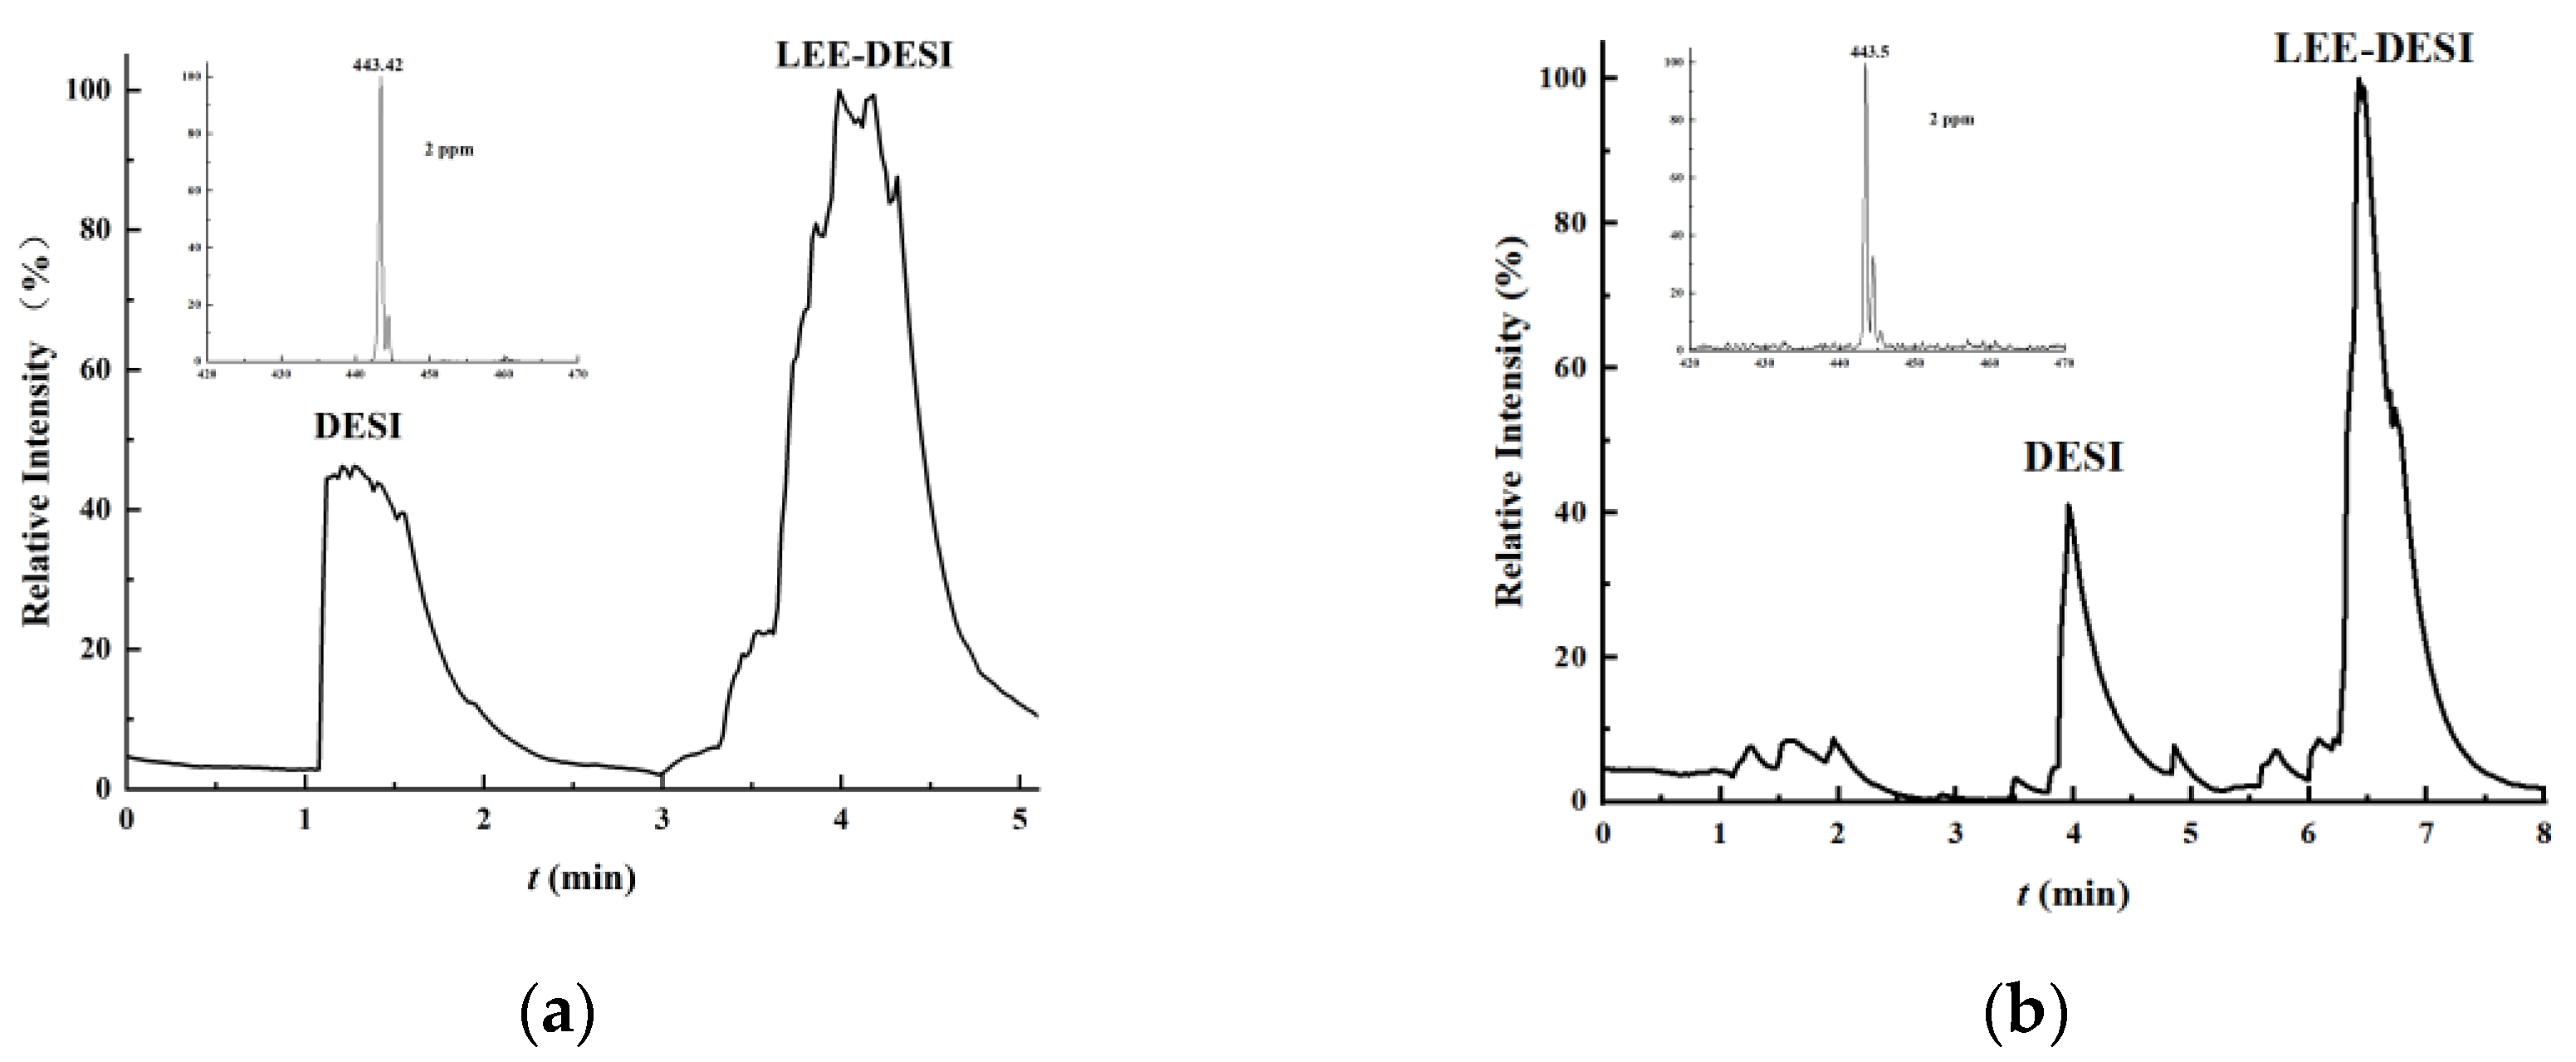
To validate the enhanced desorption capability of the system, experiments were conducted under two conditions: (1) with both spray channels (desorption and extraction) activated and (2) with only the desorption spray channel operational. A 2 ppm Rhodamine B sample was analyzed in both configurations. The resulting mass spectra are shown in Figure 8. The results demonstrate that the signal intensity of Rhodamine B obtained with dual-channel spray activation is approximately 2-fold higher than that achieved with the desorption channel alone. This significant enhancement confirms the effectiveness of the dual-spray design in amplifying desorption signals and validating the system’s ability to improve detection sensitivity.
To further validate the conclusions, a quantitative analysis of Rhodamine B was performed with both spray channels activated. Seven concentration levels (0.2, 0.5, 1, 2, 5, 10, 20 ppm) were tested, with each concentration measured three times to calculate the mean value. The resulting calibration curve incorporates data from the single-channel desorption spray mode (Figure 5a) for direct comparison. Both calibration curves exhibit correlation coefficients exceeding 0.99, indicating a strong linear relationship between signal intensity and sample concentration. Notably, the steeper slope observed in the dual-channel configuration reflects improved detection sensitivity compared to the single-channel mode, further confirming the enhanced desorption capability of the system. Additionally, the estimated limit of detection (LOD) for Rhodamine B was reduced from 0.2 ppm (single-channel desorption spray) to 0.06 ppm (dual-channel activation), demonstrating a significant improvement in detection sensitivity. The method also exhibited excellent reproducibility across the quantitative working range, as evidenced by the relative standard deviations (RSDs) for triplicate measurements at each concentration being consistently low. For example, at the 1 ppm level, the RSD was 3.9% and 2.4% for the 50° and 90° configurations, respectively. These results collectively validate that the dual-spray design effectively enhances desorption efficiency and lowers detection limits, achieving the functional goals of the LEE-DESI.
Comparative analysis of the 50° and 90° configurations revealed a nuanced dependence of performance on operational mode (Figure 9). In the dual-spray mode, the 90° configuration generated a stronger signal intensity for Rhodamine B, as evidenced by its steeper calibration slope. Conversely, the 50° configuration yielded superior signal output in single-spray mode. Furthermore, the 50° platform provided consistently more stable signals across both modes. This performance dichotomy suggests that while steeper spray angles may promote more efficient droplet collisions in the complex dual-spray environment, the 50° configuration maintains better overall stability due to its optimized fluid dynamics and more uniform electric field distribution. Considering the critical need for reproducibility in analytical applications, the 50° platform represents the preferred configuration despite its marginally lower peak intensity.

3.3. Practical Applications of LEE-DESI

The transition from laboratory prototype to 3D-printed LEE-DESI platform fully retains all fundamental DESI capabilities while substantially extending them through optimized dual-spray functionality. Furthermore, the 3D-printed design inherently enhances reproducibility by permanently fixing the critical spatial parameters, thereby eliminating the user-to-user and day-to-day variability associated with manual alignment in conventional DESI setups. This additive manufacturing approach provides distinctive operational benefits—particularly its plug-and-play compatibility that minimizes setup time and allows for reliable performance when transferred to other laboratory settings.
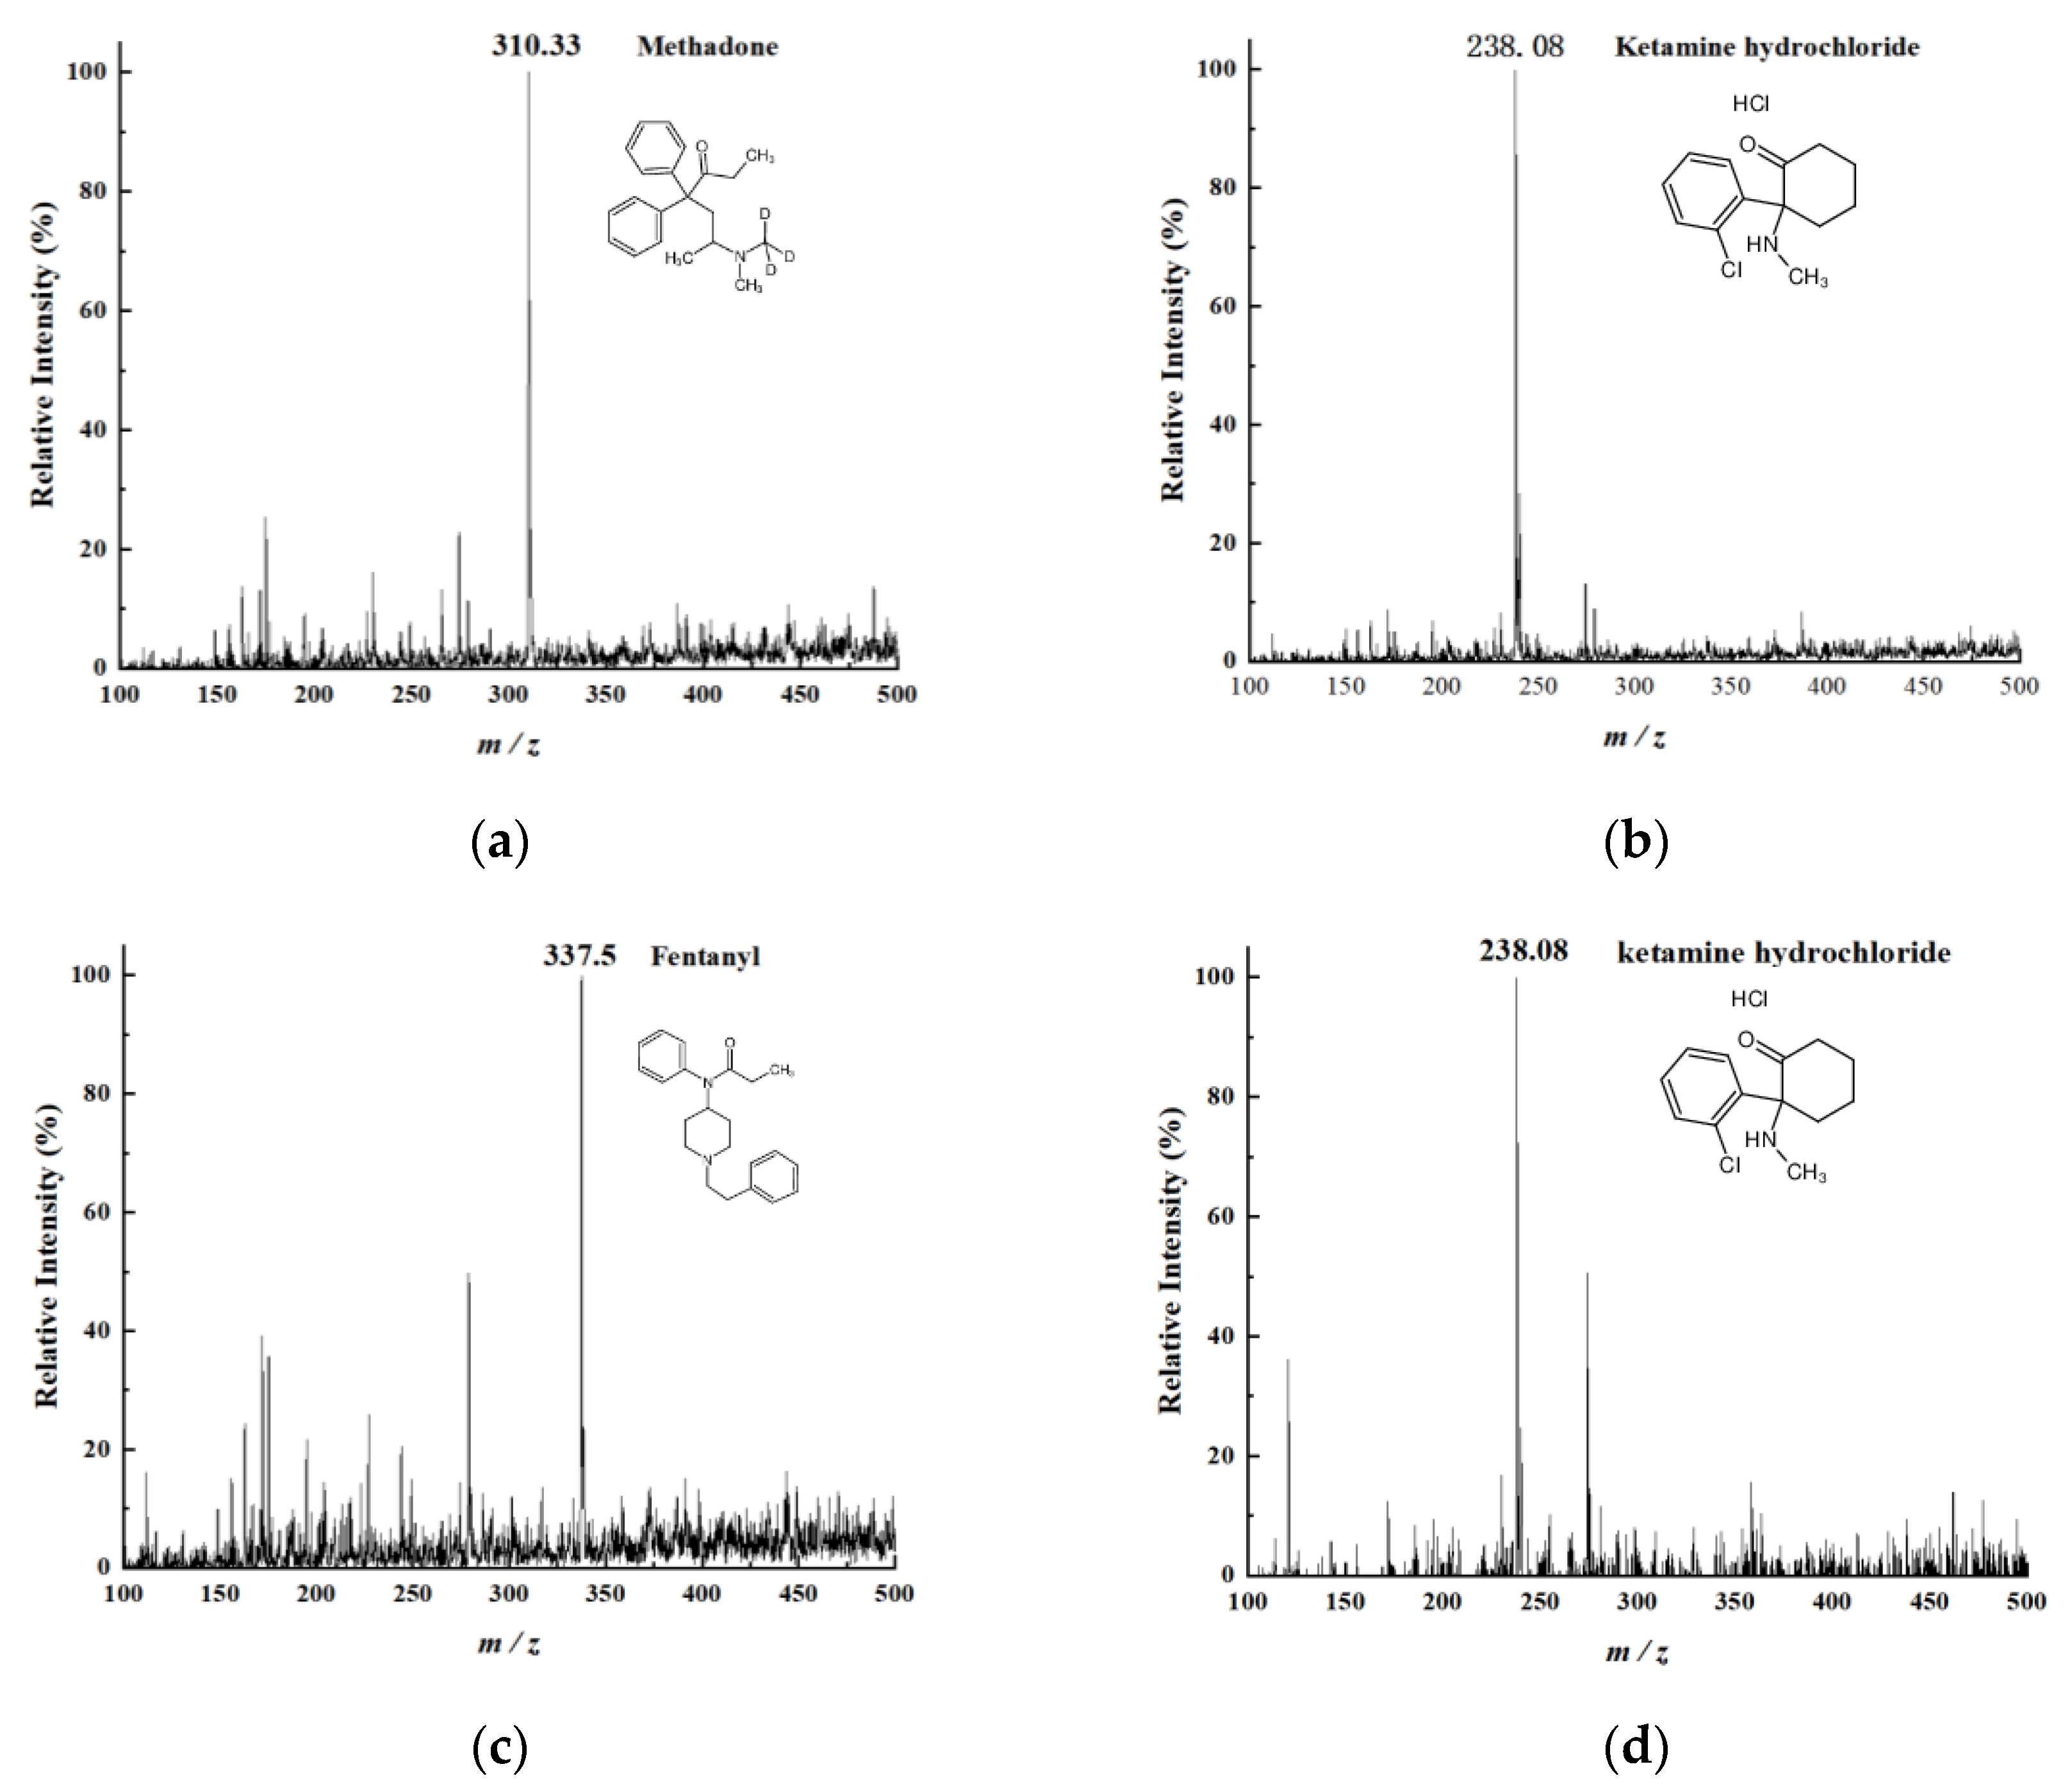
The application potential of this 3D-printed platform was systematically validated through dual approaches: (1) detection of controlled substances and pharmaceuticals and (2) integration with portable mass spectrometry systems. The 50° LEE-DESI platform successfully detected three drug samples, specifically methadone, ketamine hydrochloride, and fentanyl, yielding well-resolved and stable mass spectral signals, as shown in Figure 10a–c, respectively. To better simulate real-world detection scenarios, a complex test matrix was prepared by diluting 100 ppm ketamine hydrochloride with artificial urine to 10 ppm working concentration, as shown in Figure 10d. Subsequent analysis using the extraction functionality of the 3D-printed LEE-DESI device produced a clear mass spectrum. These results demonstrate the platform’s potential for application in more complex sample matrices and challenging detection environments.
The 3D-printed LEE-DESI device interfaces with both the Qilin-3 and LCQ Fleet mass spectrometers through identical open-port coupling to the sample introduction inlet. To accommodate the Qilin-3′s inlet specifications, the orifice diameter was reduced from 2.2 mm to 1.6 mm, as shown in Figure 11a. For system validation, only the desorption electrospray channel was activated under optimized parameters: 0.8 MPa auxiliary gas pressure, 5 μL/min solvent flow rate supplied by a syringe pump, and 4.6 kV spray voltage. Subsequent analysis of 100 ppm Rhodamine B yielded a full-scan mass spectrum displaying the characteristic peak at m/z 443.05, as shown in Figure 11b, conclusively demonstrating the compatibility of this configuration with portable mass spectrometry systems. This comprehensive evaluation demonstrated the system’s practical value for real-world applications and established its field detection capabilities in on-site mass spectrometry.

4. Conclusions

The LEE-DESI successfully addressed the electric field interference issues in dual-channel spray systems via innovative spatial separation and 3D-printed structural optimization. By integrating desorption and extraction sprays within an optimized geometry, the system attains enhanced ionization efficiency and sensitivity while maintaining operational simplicity. The fixed spatial parameters provided by 3D printing ensure reproducible performance across different experimental setups. Performance evaluations with standard compounds confirmed the system’s reliability for quantitative analysis, showing consistent signal response across multiple measurements. The dual-spray configuration demonstrates clear advantages for direct sample analysis, particularly in maintaining signal stability while reducing preparation requirements. The design’s flexibility allows for straightforward adaptation to different mass spectrometer interfaces, as shown through successful coupling with both laboratory and portable instruments. These features make the LEE-DESI a practical solution for the direct analysis of untreated samples within complex matrices.
Building on this foundation, two promising future directions are immediately apparent. First, the fixed geometry of the source makes it ideally suited for adaptation to imaging mass spectrometry by integrating a motorized stage into raster samples, which could revolutionize the detection of spatial chemical distributions in biological tissues. Second, while this study demonstrates efficacy in standardized scenarios, a critical next step is the rigorous validation of the system with truly complex matrices—such as clinical biofluids and tissue homogenates—to fully unlock its potential in proteomic and metabolomic workflows.
Future applications may therefore extend to multi-channel systems for high-throughput analysis, as well as to the challenging realms of chemical imaging and in situ bioanalysis, thereby further promoting ambient ionization technologies in real-time analytical workflows.

Author Contributions

Conceptualization, X.Q., and J.L.; data curation, J.L.; writing—original draft, J.L.; writing—review and editing, X.Q.; funding, X.Q. All authors have read and agreed to the published version of the manuscript.

Funding

This research was funded by Shenzhen Natural Science Foundation, grant number JCYJ20200109142824889.

Institutional Review Board Statement

Not applicable.

Informed Consent Statement

Not applicable.

Data Availability Statement

The original contributions presented in this study are included in the article. Further inquiries can be directed to the corresponding author.

Conflicts of Interest

The authors declare no conflicts of interest.

Abbreviations

The following abbreviations are used in this manuscript:
LEE-DESILateral Extraction Enhanced Desorption Electrospray Ionization
DESIDesorption Electrospray Ionization
AIMSAmbient Ionization Mass Spectrometry
DARTDirect Analysis in Real Time
Ang IAngiotensin

References

  1. Takats, Z.; Wiseman, J.M.; Gologan, B.; Cooks, R.G. Mass spectrometry sampling under ambient conditions with desorption electrospray ionization. Science 2004, 306, 471–473. [Google Scholar] [CrossRef]
  2. Cody, R.B.; Laramee, J.A.; Durst, H.D. Direct analysis in real time (DART) mass spectrometry. Anal. Chem. 2005, 77, 2297–2302. [Google Scholar] [CrossRef]
  3. Cooks, R.G.; Ouyang, Z.; Takats, Z.; Wiseman, J.M. Detection Technologies. Ambient mass spectrometry. Science 2006, 311, 1566–1570. [Google Scholar] [CrossRef] [PubMed]
  4. Venter, A.; Nefliu, M.; Cooks, R.G. Ambient desorption ionization mass spectrometry. TrAC Trends Anal. Chem. 2008, 27, 284–290. [Google Scholar] [CrossRef]
  5. Chen, H.; Gamez, G.; Zenobi, R.J. What can we learn from ambient ionization techniques? Am. Soc. Mass Spectrom. 2009, 20, 1947–1963. [Google Scholar] [CrossRef] [PubMed]
  6. Harris, G.A.; Galhena, A.S.; Fernández, F.M. Ambient sampling/ionization mass spectrometry: Applications and current trends. Anal. Chem. 2011, 83, 4508–4538. [Google Scholar] [CrossRef]
  7. Badu-Tawiah, A.K.; Eberlin, L.S.; Ouyang, Z.; Cooks, R.G. Chemical aspects of the extractive methods of ambient ionization mass spectrometry. Annu. Rev. Phys. Chem. 2013, 64, 481–505. [Google Scholar] [CrossRef]
  8. Feider, C.L.; Krieger, A.C.; Dehoog, R.J.; Eberlin, L.S. Ambient ionization mass spectrometry: Recent developments and applications. Anal. Chem. 2019, 91, 4266–4290. [Google Scholar] [CrossRef] [PubMed]
  9. Grajewski, M.; Hermann, M.; Oleschuk, R.D.; Verpoorte, E.; Salentijn, G.I. Leveraging 3D printing to enhance mass spectrometry: A review. Anal. Chim. Acta 2021, 1166, 338332. [Google Scholar] [CrossRef]
  10. Carrasco-Correa, E.J.; Simó-Alfonso, E.F.; Herrero-Martínez, J.M.; Miró, M. The emerging role of 3D printing in the fabrication of detection systems. TrAC Trends Anal. Chem. 2021, 136, 116177. [Google Scholar] [CrossRef]
  11. Guillén-Alonso, H.; Rosas-Román, I.; Winkler, R. The emerging role of 3D-printing in ion mobility spectrometry and mass spectrometry. Anal. Methods 2021, 13, 852–861. [Google Scholar] [CrossRef] [PubMed]
  12. Garcia, N.S.; Alonso, H.G.; Martínez-Jarquín, S.; Moreno-Pedraza, A.; Soto-Rodríguez, L.D.; Winkler, R. Build, share and remix: 3D printing for speeding up the innovation cycles in ambient ionisation mass spectrometry (AIMS). Metabolites 2022, 12, 185. [Google Scholar] [CrossRef]
  13. Elviri, L.; Foresti, R.; Bianchera, A.; Silvestri, M.; Bettini, R. 3D-printed polylactic acid supports for enhanced ionization efficiency in desorption electrospray mass spectrometry analysis of liquid and gel samples. Talanta 2016, 155, 321–328. [Google Scholar] [CrossRef]
  14. Chen, L.; Cabot, J.M.; Rodriguez, E.S.; Ghiasvand, A.; Innis, P.C.; Paull, B. Thread-based isoelectric focusing coupled with desorption electrospray ionization mass spectrometry. Analyst 2020, 145, 6928–6936. [Google Scholar] [CrossRef]
  15. Zemaitis, K.J.; Wood, T.D. Integration of 3D-printing for a desorption electrospray ionization source for mass spectrometry. Rev. Sci. Instrum. 2020, 91, 104102. [Google Scholar] [CrossRef]
  16. Li, Y.; Zhang, N.; Zhou, Y.; Wang, J.; Zhang, Y.; Wang, J.; Xiong, C.; Chen, S.; Nie, Z. Induced dual-nanospray: A novel internal calibration method for convenient and accurate mass measurement. J. Am. Soc. Mass Spectrom. 2013, 24, 1446–1449. [Google Scholar] [CrossRef] [PubMed]
  17. Chambers, A.G.; Ramsey, J.M. Microfluidic dual emitter electrospray ionization source for accurate mass measurements. Anal. Chem. 2012, 84, 1446–1451. [Google Scholar] [CrossRef] [PubMed]
  18. Chen, H.; Venter, A.; Cooks, R.G. Extractive electrospray ionization for direct analysis of undiluted urine, milk and other complex mixtures without sample preparation. Chem. Commun. 2006, 19, 2042–2044. [Google Scholar] [CrossRef]
  19. Meier, L.; Berchtold, C.; Schmid, S.; Zenobi, R. Extractive electrospray ionization mass spectrometry-enhanced sensitivity using an ion funnel. Anal. Chem. 2012, 84, 2076–2080. [Google Scholar] [CrossRef]
  20. Yu, C.; Tang, F.; Qian, X.; Chen, Y.; Yu, Q.; Ni, K.; Wang, X. Multi-channel microfluidic chip coupling with mass spectrometry for simultaneous electro-sprays and extraction. Sci. Rep. 2017, 7, 17389. [Google Scholar] [CrossRef]
  21. Qiu, R.; Zhang, C.; Qin, Z.; Luo, H. A multichannel rotating electrospray ionization mass spectrometry (MRESI): Instrumentation and plume interactions. RSC Adv. 2016, 6, 36615–36622. [Google Scholar] [CrossRef]
  22. Mortensen, D.N.; Williams, E.R. Ultrafast (1 μs) mixing and fast protein folding in nanodrops monitored by mass spectrometry. J. Am. Chem. Soc. 2016, 138, 3453–3460. [Google Scholar] [CrossRef]
  23. Mortensen, D.N.; Williams, E.R. Investigating protein folding and unfolding in electrospray nanodrops upon rapid mixing using theta-glass emitters. Anal. Chem. 2015, 87, 1281–1287. [Google Scholar] [CrossRef]
  24. Fisher, C.M.; Kharlamova, A.; Mcluckey, S.A. Affecting protein charge state distributions in nano-electrospray ionization via in-spray solution mixing using theta capillaries. Anal. Chem. 2014, 86, 4581–4588. [Google Scholar] [CrossRef]
  25. Mao, P.; Gomez-Sjoberg, R.; Wang, D. Multinozzle emitter array chips for small-volume proteomics. Anal. Chem. 2013, 85, 816–819. [Google Scholar] [CrossRef] [PubMed]
  26. Mao, P.; Wang, H.T.; Yang, P.; Wang, D. Multinozzle emitter arrays for nanoelectrospray mass spectrometry. Anal. Chem. 2011, 83, 6082–6089. [Google Scholar] [CrossRef]
  27. Huang, G.; Li, G.; Cooks, R.G. Induced nanoelectrospray ionization for matrix-tolerant and high-throughput mass spectrometry. Angew. Chem. Int. Ed. Engl. 2011, 50, 9907–9910. [Google Scholar] [CrossRef] [PubMed]
  28. Shi, W.; Huo, X.; Ding, X.; Zhu, P.; Wan, Y.; Lu, X.; Feng, R.; Yu, Q.; Wang, X. Rapid screening of illegally added drugs in functional food using a miniature ion trap mass spectrometer. Food Chem. 2022, 386, 132808. [Google Scholar] [CrossRef] [PubMed]
  29. Yang, H.; Ai, J.; Zhu, Y.; Shi, Q.; Yu, Q. Rapid classification of coffee origin by combining mass spectrometry analysis of coffee aroma with deep learning. Food Chem. 2024, 446, 138811. [Google Scholar] [CrossRef]
Figure 1. Illustration of the mechanism of LEE-DESI.
Applsci 15 09468 g001
Figure 2. (a) Experimental setup diagram of the DESI platform; (b) experimental setup diagram of the LEE-DESI platform. Inset shows distinct mutual repulsion between the sprays.
Applsci 15 09468 g002
Figure 3. (a) Schematic diagram of LEE-DESI platform with α = 50°; (b) the configuration of the 50°dual-channel spray coupling with mass spectrometry; (c) schematic diagram of LEE-DESI platform with α = 90°; (d) the configuration of the 90° dual-channel spray coupling with mass spectrometry.
Applsci 15 09468 g003
Figure 4. Results for the optimization of the DESI mode: (a) the signal intensity of 10 ppm Rhodamine B solution acquired with different spray voltages; (b) the signal intensity of 10 ppm Rhodamine B solution acquired with different flow rates; (c) the signal intensity of 10 ppm Rhodamine B solution acquired with different gas inlet pressures.
Applsci 15 09468 g004
Figure 5. (a) Calibration curve for Rhodamine B measurements of 3D-printed LEE-DESI platform’s desorption spray channel. Inset shows the acquired mass spectrum of 10 ppm Rhodamine B solution; (b) calibration curve for Rhodamine B measurements of a laboratory DESI platform. Inset shows the acquired mass spectrum of 10 ppm Rhodamine B solution.
Applsci 15 09468 g005
Figure 6. (a) The signal intensity of 0.2 ppm Rhodamine B solution; (b) average mass spectrum of 0.2 ppm Rhodamine B desorbed by 3D-printed LEE-DESI platform (1.4–1.9 min); (c) average mass spectrum of background noise (2.7–3.7 min).
Applsci 15 09468 g006
Figure 7. (a) Schematic representation of analyte extraction in LEE-DESI; (b) the signal intensity of 10 ppm L-arginine solution; (c) the signal intensity of 100 ppm Ang I solution; (d) the 2 min total ion chromatogram (TIC) of Ang I solution.
Applsci 15 09468 g007
Figure 8. (a) The signal intensity of 2 ppm Rhodamine B solution between the 50° LEE-DESI with both spray channels (desorption and extraction) activated and DESI with only the desorption spray channel. Inset shows the acquired mass spectrum of 2 ppm Rhodamine B solution; (b) the signal intensity of 2 ppm Rhodamine B solution between the 90° LEE-DESI with both spray channels (desorption and extraction) activated and DESI with only the desorption spray channel. Inset shows the acquired mass spectrum of 2 ppm Rhodamine B solution.
Applsci 15 09468 g008
Figure 9. Calibration curves for Rhodamine B obtained under different configurations of the LEE-DESI, including both 50° and 90° geometries with both spray channels activated and DESI with the single-channel desorption spray mode.
Applsci 15 09468 g009
Figure 10. (a) The mass spectrum of 10 ppm methadone solution; (b) the mass spectrum of 100 ppm ketamine hydrochloride solution; (c) the mass spectrum of 10 ppm fentanyl solution; (d) the mass spectrum of 10 ppm ketamine hydrochloride in artificial urine, diluted from the 100 ppm standard.
Applsci 15 09468 g010
Figure 11. (a) Experimental setup diagram of LEE-DESI platform coupled to Kirin 3 field mass spectrometer; (b) full-sweep mass spectrum of 100ppm Rhodamine B detected by Kirin 3 field mass spectrometer.
Applsci 15 09468 g011
Disclaimer/Publisher’s Note: The statements, opinions and data contained in all publications are solely those of the individual author(s) and contributor(s) and not of MDPI and/or the editor(s). MDPI and/or the editor(s) disclaim responsibility for any injury to people or property resulting from any ideas, methods, instructions or products referred to in the content.