Abstract
It is recognized that boats which intervene in dangerous situations are characterized by high maneuverability, have good governance properties, and must be equipped with high-speed propellers. This paper proposes a computerized analysis, using Computational Fluid Dynamics modeling, of a high-speed propeller, in open water, from the perspective of velocity and pressure manifested on the propeller blades. The use of numerical methods allows to determine the thrust forces on the propellers, to highlight the areas in the propeller blade where the maximum and minimum pressures occur, to identify the cavitation zone and to visualize the degree of turbulence of the fluid flow on the propeller blades in rotational motion. The analysis proves to be an efficient procedure in determining the characteristics of a high-speed propeller before deciding its production/manufacture. The Shear Stress Transport method was used for fluid turbulence analysis and the “Thrust–Propeller RPM” diagram and “Torque–propeller RPM” diagram finalized this study, the mentioned diagrams being the most important in choosing an efficient propeller for a given boat.
1. Introduction
Turbulence is a non-linear phenomenon in fluid dynamics and represents a formidable challenge in computational science and engineering. Nowadays there are many researchers who are trying to develop various models within the framework of Reynolds-averaged Navier–Stokes (RANS) equations. Among the topics related to naval propellers, which have preoccupied researchers over time, is the turbulent regime of fluid flow around the propeller (considering or not the presence of the hull of the ship in its vicinity). The methods of modeling/simulation, analysis and interpretation that stimulate the interest of the authors of this work are Computational Fluid Dynamics (CFD) and Shear Stress Transport (SST).
Documenting the results obtained by various researchers over time, with reference to the turbulent flow regime (targeting high-speed marine propellers) and the study methods used by them, the following can be briefly mentioned. In [,] authors highlight the usefulness of using Computational Fluid Dynamics (CFD) and SST methods for turbulence modeling and analysis in various domains, like marine engineering as well as aeronautical or civil engineering. Their results are relevant for real-world applications, but rely heavily on numerical simulations, requiring more robust experimental validations to confirm the accuracy of the modeling. Using Navier–Stokes equations for predicting the coherent structures in turbulent flow, the study [] concerns the local flow analysis around a rotating KP505 propeller in open water conditions at an advance ratio of 0.7. They [] used the CFD method to compare propeller hydrodynamic performance in case of a single propeller, tandem propellers and contra-rotating propellers demonstrating that the last two increase propeller thrust. The ship’s behavior in waves depends, among others, on propeller–hull interactions in waves. They demonstrate that the use of advanced models such as PANS or the sinusoidal blade motion can improve performance predictions. However, these approaches remain limited by the complexity of real-world operating conditions and the lack of comparisons with extensive experimental data. Jang, Eom and their colleagues [] were interested in the propeller movement at the stern of the caused by the ship motion in waves. The propeller performance was calculated using Computational Fluid Dynamics (CFD) at several constant tilt angles, the thrust and torque of the propeller being analyzed in sinusoidal pitch motion were compared with the results obtained in constant tilt angles. In study [], the advance speed of the virtual propeller disk was determined using an improved momentum conservation principle combined with the body force method, enabling the accurate real-time calculation of the advance speed. Study [] introduces a three-dimensional non-linear (k-ε) turbulence model to analyze flow dynamics, velocity distributions, and mass transport mechanisms in both a meandering and straight navigation way. With the help of ANSYS software CFX, authors of [] studied the effects of the surface roughness and protrusions on propeller performance. Their conclusion was that efficiency is increased by protrusions located on the pressure surface of the propeller and those with 0.2 mm protrusions show the best performance. Nakisa et al. [] focused on analyzing the streamlines, velocity, and pressure distributions in and around the propeller region. Their study employed Ansys-CFX 14.0, utilizing a viscous flow finite volume solver with a two-phase Eulerian–Eulerian fluid model and the SST turbulence approach. Meanwhile, Bakhtiary and Ghassemi [] investigated the turbulent flow surrounding a marine cycloidal propeller using a 2.5-dimensional numerical technique based on the unsteady Reynolds-averaged Navier–Stokes equations coupled with the SST k-ω turbulence model. They conclude that the hydrodynamic efficiency of analyzed marine propellers drops as the blade number increases. The same methods were used in [] for the simulation of a marine propeller in a fully turbulent flow. The authors considered the pressure distribution, streamlines and unsteady oscillating load of thrust and torque for one blade and for all blades of the propeller.
The modeling was carried out for a range of fluid flow velocities between 0 [m/s] and 10 [m/s], and for a range of propeller shaft rotation speeds between 300 RPM and 5400 RPM. The selection of these ranges is justified by the fact that they parametrically cover the entire operational profile of the fast boat propulsion system. This domain reflects real operating conditions, from low-speed regimes (such as maneuvering in port or slow-speed cruising) to maximum-speed regimes corresponding to the engine’s peak load during cruising or top-speed navigation. The selected shaft rotation speeds are compatible with the design and performance characteristics of the engine and the propeller used, ensuring a realistic representation of the hydrodynamic behavior of the propulsion assembly across the fast boat operational profile. The analysis presented in [] investigated the influence of incident pressure, target distance, and impact time on the forming depth and an analysis of the punching phenomenon of the formed components when a water jet cavitation shock is used. Numerical simulation based on Reynolds-averaged Navier–Stokes equations applied on a cavitating propeller in open water are presented by Yusvika, Prabowo, Tjahjana and others [] using the facilities of Computational Fluid Dynamics (CFD). Their study demonstrates that cavitation becomes more aggressive at a higher water temperature than at a lower temperature. The article [] explores the impact of geometric parameters on the performance of a toroidal propeller, an innovative type of propeller with ring-shaped curved blades used in naval applications. It is a promising alternative to classic propellers, with the potential to reduce cavitation, noise and improve propulsive efficiency. It includes CFD Simulations (Reynolds-averaged Navier–Stokes, Realizable k-ε + ZGB model for cavitation), physical tests on a test bench with metallic propellers, experimentally validated (error < 10%), single-factor and multifactorial studies (Design-Expert, SPSS v22), analysis on a wide range of advance coefficients (J) and speeds. The article focuses on the thrust coefficient and pressure distribution to evaluate the results. Also, the article [] analyzes the thrust and cavitation performance of the submersible waterjet propeller compared to the conventional propeller, both in open water and in the presence of hull currents. It is concluded that the submersible jet provides stable thrust and superior efficiency, significantly reducing cavitation losses in complex environments. The paper [] deals with the calibration of CFD methodology for simulating the full-scale propulsion performance of the real ship MV REGAL, comparing numerical results with data from model tests and sea trials. The study highlights the influence of turbulence patterns and surface roughness on thrust, shaft power and cavitation distribution, contributing to the optimization of numerical predictability in modern naval design. In [], CFD simulations validated the superior performance of the Kappel Tip Rake propeller, demonstrating high thrust and efficient torque at low RPMs, along with an optimized pressure distribution that reduces the risk of cavitation and [] presents a method for CFD propeller modeling using the concept of “body force”. This approach, based on blade element theory, is coupled with a URANS solver to predict propeller performance, including thrust and torque, in a more computationally efficient manner compared to detailed geometry modeling.
The authors of this paper started with the conviction that CFD and SST analysis create 3D models that can be easily visualized and modified by changing the relevant parameters. The SST model combines the advantages of the k-omega model in the boundary layer with the k-epsilon model in the free stream, making it ideal for accurately capturing the behavior of the bounded layer and flow separation phenomena at the propeller surface. The use of specialized software licenses for marine engineering allows the quality control of the designed product, without the risk of material losses and unjustified financial expenses. In a virtual space identical to the one in which the analyzed object will be placed, it is possible to detect errors, identify and solve problems before it is sent to production. Of course, the authors recognize the need to validate the simulations (on replica-models) in hydrodynamic testing laboratories and sea trials (the latter being possible only after the construction of the prototype).
With their paper, the authors focused exclusively on the preliminary part of the design process of a high-speed propeller. The work proposes the computerized analysis (using Computational Fluid Dynamics (CFD) modeling with ANSYS CFX module used standard parameters) of a high-speed propeller, in open water, from the perspective of velocity and pressure manifested on the propeller blades. The scope of the study is to determine the ideal performance of the design propeller. For that the author aims to determine using numerical methods the “Thrust–Propeller RPM” diagrams and “Torque–propeller RPM” diagrams, which are most important in choosing a propeller for a given boat. The “Thrust–Propeller RPM” diagrams help the design team to choose the proper propeller for the desired boat speed and the “Torque–propeller RPM” allows the design team to choose the proper engine. The simulations were targeted on analyses for velocity and pressure on propeller blades and the working method; results and conclusions are briefly presented below. The paper addresses the gaps in the literature by performing an advanced CFD analysis on the high-speed marine propeller, before the manufacturing stage, providing validated thrust and torque curves depending on the rotation regime, an aspect rarely addressed in the preliminary design phase. The novelty consists of simulating real naval operating conditions, identifying areas with cavitation risk and optimizing the geometry, facilitating propeller-engine correlation without the need for expensive physical tests in the preliminary stages of design.
2. Theoretical Considerations
One of the best turbulence models was developed by dr. Florian Menter and presented since 1994–Shear Stress Transport (SST) turbulence model [,]. This model is based on physical experiments, and consists of a hybrid formulation, strategically combining the strengths of k-ω and k-ε models, reducing their respective limitations.
Florian Menter introduced a blending mechanism between these two models using a function, F1 (see Equation (2)) which switches between the models’ equations. The approach of this model is to solve two transport equations: for the turbulent kinetic energy, , and for the specific dissipation rate, ω [,].
- A.
- The equation for turbulent kinetic energy, k
In Equation (1) the left-hand side terms represent the temporal evolution and convective transport of k. On the right-hand side, signifies the production of turbulent kinetic energy, which is derived from the interaction of mean velocity gradients with the Reynolds stresses. The term quantifies the rate of dissipation of turbulent kinetic energy into thermal energy. The final term describes the turbulent diffusion of , influenced by both molecular viscosity and the turbulent eddy viscosity , being a model constant.
- B.
- The transport equation for specific dissipation rate, ω
This equation is more complex due to the blending mechanism
In Equation (2), α, β and σω are model constants, dimensionless.
Like in the equation, the left part of the equation accounts for transient and convective transport.
The right part of the equation includes the following:
- Production:
- Dissipation:
- Diffusion:
The most important element of this equation is the cross-diffusion term .
This term, weighted by becomes active predominantly in the k-ε region transforming the k-ω equation into k-ε and ensuring consistency in the far field.
The blending function F1 is defined as follows:
In Equation (3): y represents the distance to the nearest wall; ν represents the kinematic viscosity; represent the Cross Diffusion Term and is calculated with the following relation:
Different than eddy-viscosity models which over-predict eddy viscosity in regions characterized by strong adverse pressure gradients and, therefore, lead to errors, in the SST model a limit for turbulent shear stress was introduced based on the turbulent kinetic energy.
The eddy viscosity is formulated as
In this equation represents the magnitude of the strain rate tensor, is another blending function designed to ensure that the limiter is active primarily in the boundary layer, which is the region where eddy-viscosity models have most errors and a1 is a constant empirically determined. is defined as follows:
3. Materials and Methods
This study did not use any artificial intelligence tools; we still had to use artificial intelligence (Chat GPT 4) to have a scan on the internet to identify most relevant paperwork in this field. We did that to study the most relevant methods utilized.
Fluid Dynamics is applied in a wide variety of fields that require the study of the behavior of gases and liquids. Simplistically speaking, Computational Fluid Dynamics (CFD) modeling provides three-dimensional, time-accurate information about fluid motion, in general, but also about particle trajectories or surface dynamics.
The development of new fluid modeling algorithms, combined with modern computational architectures, now allows engineers to simulate the behavior of fluids with a fidelity that rivals that of a geometric model (3D CAD model) of the system to be studied and for which information on the properties of the fluids can be entered. Several aspects can be successfully studied, such as speeds, flow rates, current line trajectories, pressure distribution on certain contours, etc.
The ANSYS CFX module [] is one of the best-known and most powerful fluid dynamics solvers. It is a general-purpose tool that can simulate a wide range of processes, such as internal flow, aerodynamics, combustion, conjugate heat transfer, etc. ANSYS simulation software dedicated to the study of fluid dynamics allows the determination of the impact of fluid flow on a product both in the design and manufacturing phases, as well as during its operating time. It contains physical models for turbulence, reactive flows, heat transfer, acoustics and multiphase flows. It is also one of the most scalable software packages on the market, being able to achieve 93% efficiency on computing systems with 200,000 cores.
The study of the Fluid–Structural Interaction (FSI) highlights both the flow of the fluid and the way in which it encounters a solid structure. The fluid flow can exert pressure and/or loads on the structure. These loads can cause structural deformations significant enough to alter the flow of the fluid itself. Undesirable effects can increase as the level of interaction between fluid and structure increases. Simulations made with ANSYS applications allow a deeper understanding of the phenomena that occur, thus ensuring safety and reliability.
Modeling with ANSYS involves, in principle, going through some work steps, but it should be noted that it is practically impossible to detail the working mode. Next, some essential aspects of working with ANSYS will be mentioned.
For the study presented in this paper, a high-speed propeller was used, with a diameter of 14 cm, with 3 fixed blades, as can be seen in Figure 1.
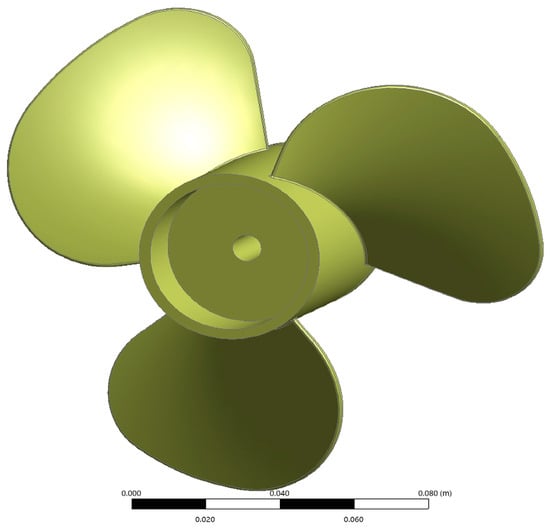
Figure 1.
Propeller geometry.
Also, fluid domain geometry was generated.
The fluid domain geometry consists of two domains:
- -
- one region, near the propeller consists of a rotating disk surrounding the propeller (see Figure 2).
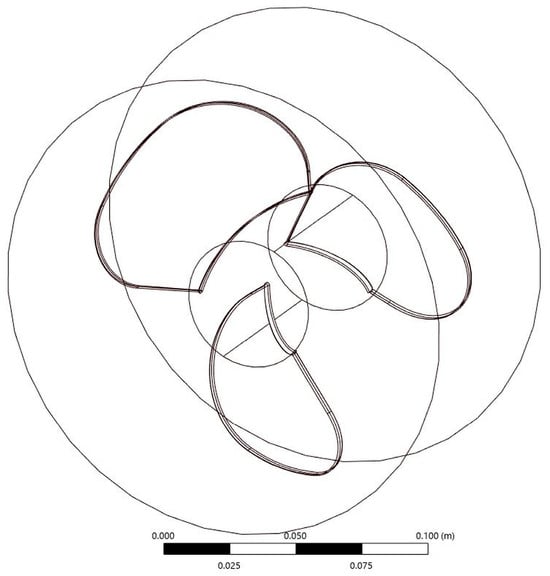
Figure 2.
Domain geometry near the propeller.
- -
- an external cylindrical fixed domain, 1 m in front of the propeller, 3 m behind the propeller and 1 m around the propeller (see Figure 3).
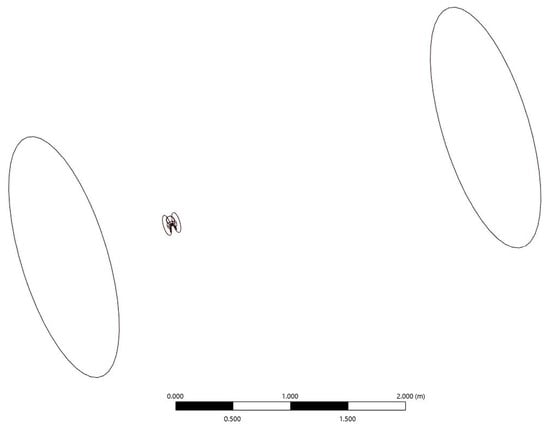 Figure 3. External domain geometry.
Meshing is a fundamental step in all analysis processes within ANSYS. It involves dividing geometries into small polygons, enabling each polygon to be individually processed for accurate result generation []. A finer network creates better results. However, excessive network refinement can lead to long processing times. In this paper, mesh was automatically generated, and consists of 24,692 nodes and 130,503, with a small resolution on the rotating domain and a larger resolution on the external domain (see Figure 4 and Figure 5).
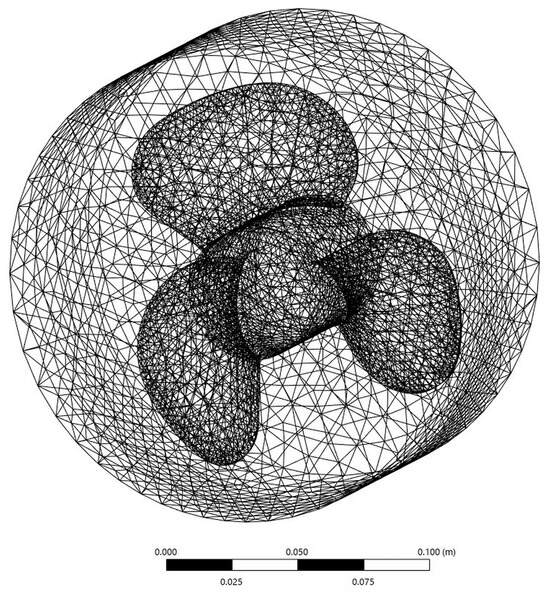
Figure 4.
The rotating domain mesh for propeller.
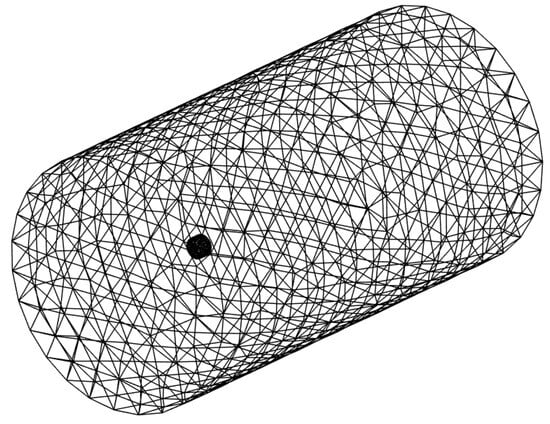
Figure 5.
The external domain mesh.
To ensure the reliability and mesh independence of the numerical results, a mesh sensitivity analysis was conducted using three levels of mesh resolution: coarse, default (used in the study) and fine. The mesh characteristics are shown in Table 1. As the element size was progressively refined (from 0.5 m in the coarse mesh to 0.125 m in the fine mesh), the number of nodes and elements increased substantially. Despite this, the minimum edge length remained constant across all cases, preserving geometric fidelity in critical regions. The default mesh, characterized by an element size of approximately 0.256 m and containing over 130,000 elements, was selected as optimal. It provided a good balance between numerical accuracy and computational cost. Comparisons of key output parameters across the three mesh levels showed negligible variation between the default and fine meshes, indicating that mesh independence was achieved [].

Table 1.
The characteristics of mash sensitivity.
For the sensitivity mesh study, two cases were chosen: the v = 2 [m/s] with rpm = 3600 case and the v = 6 [m/s] with rpm = 3000 case as shown in Table 1. The analyzed sensitivity results are shown in the Section 4.
- Setting boundary conditions is a crucial step in CFD simulations. Boundary conditions define how each surface interacts with the fluid. Additionally, users can choose from various turbulence models to accurately represent non-laminar flow behavior.
This work considered two situations, as follows.
- -
- Boundary conditions for water speed 0 [m/s]. For this case, the following boundary conditions are valid: the fixed domain is declared as a free slip wall on the external cylindrical surface [,]; both sides of the fixed domain are openings; the propeller limits are declared as smooth walls; the rotating domains rotate with the propeller’s RPM (Figure 6).
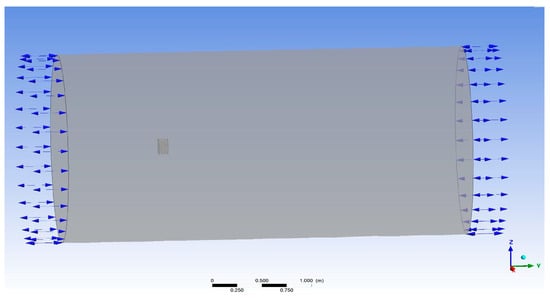 Figure 6. Boundary conditions for water speed 0 [m/s].
- -
- Boundary conditions for water speed bigger than 0 [m/s]. For this second case, the following boundary conditions are valid: the fixed domain is declared as a free slip wall on the external cylindrical surface; the fixed domain side situated in front of the propeller is declared as the inlet; the fixed domain side situated behind the propeller is declared as the opening; the propeller limits are declared as smooth walls; the rotating domain rotates with the propeller’s RPM (Figure 7).
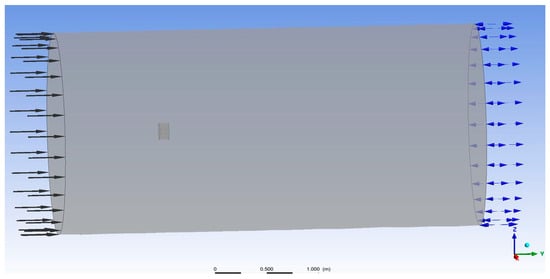 Figure 7. Boundary conditions for water speed greater than 0 [m/s].
4. Results and Discussion
After all variables are set (type of analysis: static; turbulence model: for the simulation, the SST model was considered) the solution is then processed by launching the “Compute execution” command. This is the part where iterations of the formulations are carried out so that they can be convergent. Here, the solver uses complex mathematical equations to generate the results.
“Results” is a CFD post-processor where the simulation’s output can be seen and analyzed. “Post CFD” is an important and essential component for users, as here they can see a simulated demonstration of how the analyzed product will behave in real-world scenarios. As mentioned in the introduction, the present paper aims to analyze (using Computational Fluid Dynamics (CFD) modeling with the ANSYS CFX module) a high-speed propeller, in open water, from the perspective of three aspects: pressure on the propeller, velocity on the propeller and velocity on the liquid domain. The modeling was performed for a range of fluid flow velocities between 0 [m/s] and 10 [m/s] and for a range of the shaft propeller rotation speed between 300 [RPM] and 5400 [RPM]. The simulation was performed in the static domain using an SST turbulence model as a working method [].
Table 2 and Table 3 summarize the case studies for the extremes of the analysis interval (v = 0 [m/s], respectively, v = 10 [m/s]). This decision was taken out of the desire not to oversize the presented paper. Obviously, the very small size of the charts makes it difficult to read. Interested readers are encouraged to contact the corresponding author at the e-mail address and all information will be made available together with the appropriate explanations.

Table 2.
Graphical results for the extreme speed values of 0 m/s considered in the analysis.

Table 3.
Graphical results for the extreme speed values of 10 [m/s] considered in the analysis.
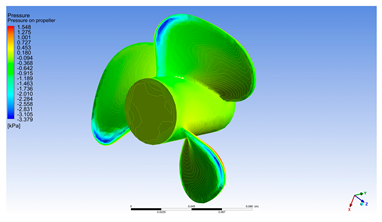
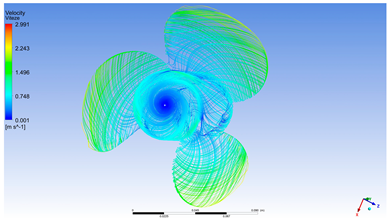
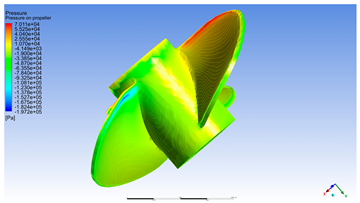
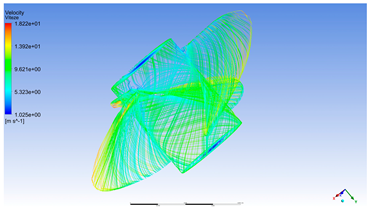
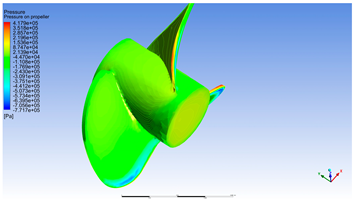
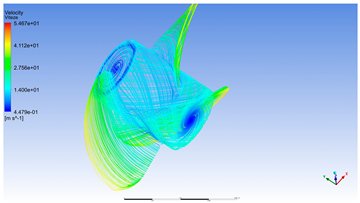
The three figures analyzed from Table 2, corresponding to rotational speeds of 300 RPM, 1800 RPM and 4200 RPM for water speed 0 [m/s], provide a clear depiction of the propeller’s hydrodynamic behavior in pure rotational regimes, unaffected by external flow. These conditions allow for the direct observation of the effects induced solely by rotational motion on the pressure and velocity distributions across the blade surfaces.
At 300 RPM, the pressure distribution is weak, with values close to zero and minimal variation between the pressure and suction sides of the blades. The local fluid velocity on the blade surface remains low, predominantly represented by cool colors (blue and green), indicating limited interaction with the surrounding fluid. This regime reflects a passive operating state, in which the propeller generates negligible thrust and the flow remains nearly static around the blades.
If the propeller rotation of 1800 RPM is analyzed, blade pressure increases noticeably, with the emergence of yellow and orange zones on the pressure side, while the suction side begins to exhibit darker blue tones. Local velocity intensifies, particularly near the blade tips, where orange and red regions appear, indicating significant acceleration of the flow induced by rotation. This regime marks a transition toward active operation, where the propeller begins to generate thrust and influence the energy distribution within the fluid domain. The local fluid velocity on the blade surfaces increases noticeably, especially near the blade tips, where orange and red bands appear—signaling substantial acceleration of the flow induced by rotation. This behavior suggests that the propeller is operating in an active and efficient regime, where the interaction with the fluid is strong enough to produce useful thrust forces, yet remains within safe mechanical limits without triggering cavitation risks associated with higher rotational speeds. From a hydrodynamic standpoint, the 1800 RPM regime represents a balanced zone between performance and stability, making it ideal for evaluating energy efficiency and calibrating numerical models. It serves as a valuable reference point in propeller analysis, allowing the clear observation of the transition from passive to high-performance operation without introducing major flow instabilities or excessive blade loading.
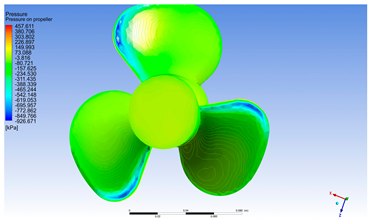
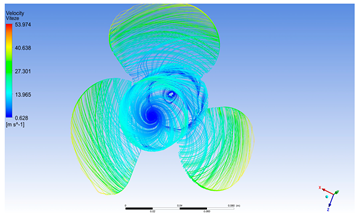
At 4200 RPM, the pressure distribution becomes highly pronounced and well-defined. Bright red zones appear on the pressure side, while deep blue regions dominate the suction side, indicating a strong pressure gradient. Local fluid velocity reaches elevated levels, with extensive red and yellow areas, especially near the blade tips. This regime is characteristic of peak performance, where the propeller generates a powerful pressure and velocity field with maximum thrust potential. Although cavitation risk is reduced in the absence of external flow, mechanical stresses on the blades are significant, particularly at the tips.
These simulations demonstrate how, in the absence of water inflow, the propeller generates pressure and velocity distributions solely through rotation, with a clear progression from passive to active regimes. Such observations are essential for understanding the fundamental behavior of the propeller and for calibrating numerical models under controlled conditions.
The three simulations (Table 3) at rotational speeds of 1500, 3600, and 5400 RPM with a 10 [m/s] inflow velocity reveal the propeller’s hydrodynamic response under increasing load. As the rotational speed rises, pressure and velocity gradients on the blade surfaces intensify, enhancing thrust generation and overcoming inflow resistance. At lower speeds, pressure differences and surface velocities are moderate, limiting performance. With higher speeds, pressure gradients and local velocities, especially near blade tips, increase sharply, indicating improved propulsive efficiency but also greater mechanical stresses and a higher risk of cavitation due to extreme negative pressures.
These simulations demonstrate how increasing rotational speed enables the propeller to transition from a braking regime to one of efficient propulsion, with a clear evolution in the pressure and velocity fields. These observations are essential for optimizing the operating regime of the propeller in high-speed marine applications and for validating its hydrodynamic design under maximum load conditions.
For a better understanding of the simulations and the results obtained, the following are detailed in the case analysis for:
- -
- the fluid flow velocity of 6 [m/s].
- -
- the propeller shaft speed of 3000 [RPM].
Two aspects have been considered and detailed below.
- A.
- Pressure on propeller
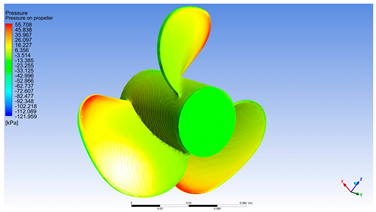
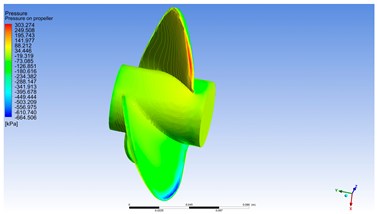
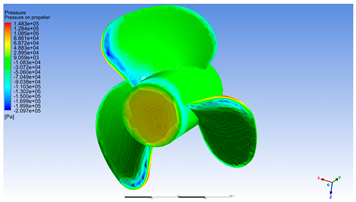
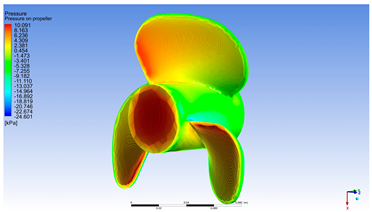
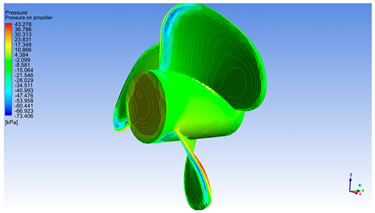
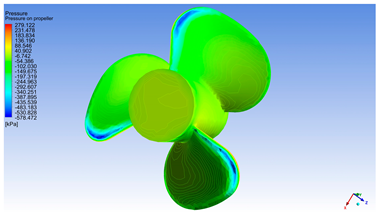
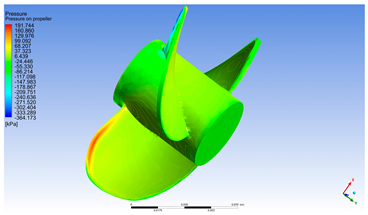
In Figure 8 two regions of interest can be observed on the tip of the propeller: the red region where the maximum pressure is reached; the blue region, where there are negative values and cavitation phenomena is most probable to occur (this region is usually protected by special surface treatments or more resistive material insertion). The simulation of pressure distribution across the propeller clearly highlights the complex hydrodynamic behavior of the blades during rotation []. The visualized values span a wide range—from very high positive pressures (exceeding 125 kPa, represented in deep red) to extreme negative pressures (below −220 kPa, illustrated in dark blue)—indicating a significant pressure differential between the pressure side and the suction side of the blades.
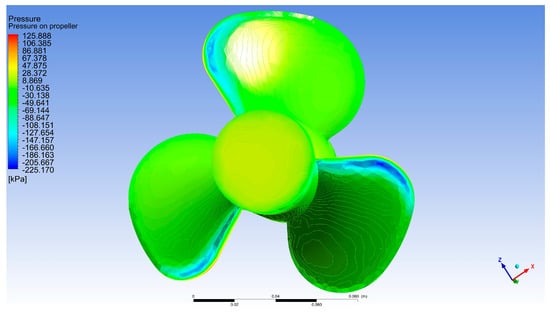
Figure 8.
Pressure on propeller [Pa].
From a scientific standpoint, this variation reveals the presence of a pronounced pressure gradient, which is critical for thrust generation. Regions of positive pressure are predominantly located on the forward-facing surface of the blades, especially near the central and mid-span areas. These zones correspond to areas where the flow decelerates and fluid compression directly contributes to propulsive force. In contrast, negative pressure regions appear on the suction side, particularly near the blade tips, where fluid velocity is highest and suction effects impose additional hydrodynamic loading.
The highly negative pressure values may indicate a risk of cavitation, especially if the local pressure drops below the vapor pressure of water. Cavitation is a phenomenon that adversely affects propeller performance and durability, leading to vibrations, noise, and rapid material erosion. Therefore, identifying these regions is essential for optimizing blade geometry and adjusting rotational speed under high-load operating conditions.
The pressure distribution observed in this simulation suggests that the propeller operates efficiently at high rotational speeds, maintaining a balance between axial loading and flow stability. Elevated pressure near the hub and reduced pressure toward the tips correspond to an effective torque generation pattern, though they may induce varying mechanical stresses along the blade span. This information is valuable for validating structural design and defining optimal operating regimes.
- B.
- Velocity on propeller
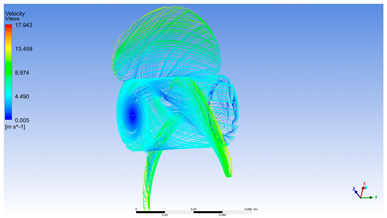
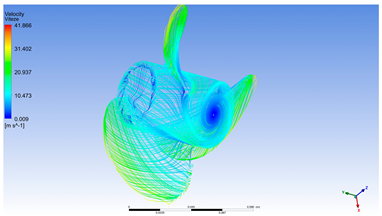
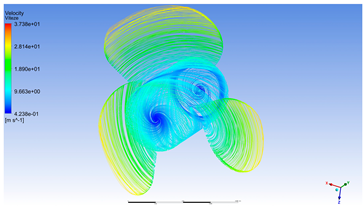
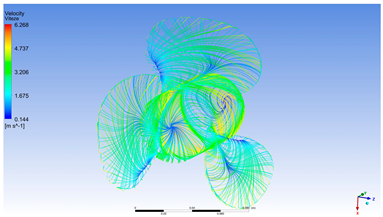
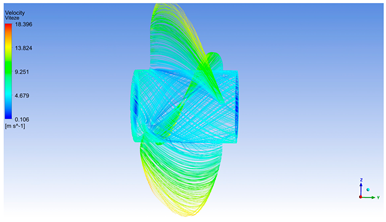
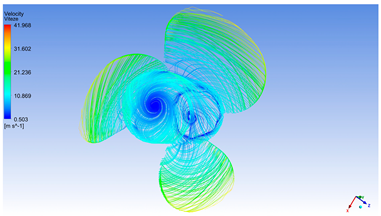
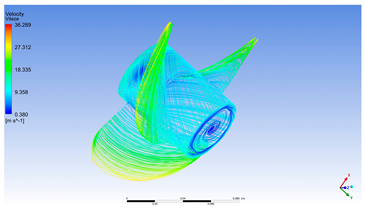
Figure 9 highlights that the maximum speed is reached on the tip of the blades (yellow to red color on the drawing). Even when the water speed is 6 [m/s], on the tip of the blades the flow can reach a speed of up to 30.48 [m/s]. This phenomenon can be explained by the combination of the propeller’s rotational speed and centrifugal effects [] occurring near the blade tips. From a scientific standpoint, the pronounced increase in local velocity at the blade extremities has several implications:
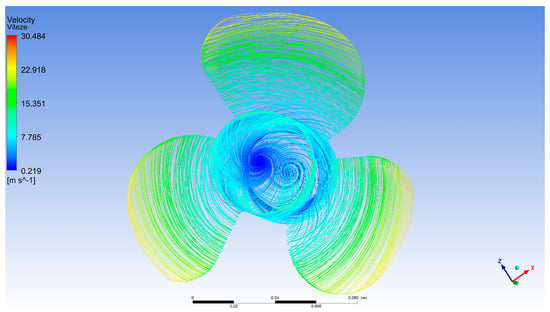
Figure 9.
Velocity on the propeller [m/s].
- The blade tip effect amplifies local velocity because the outermost points of the blades travel at a significantly higher linear speed compared to sections closer to the hub. As a result, the relative velocity between the blade and the fluid increases, leading to accelerated flow around the blade surface.
- The substantial velocity differential between the axial inflow (6 [m/s]) and the local tip velocity (30.48 [m/s]) generates a steep pressure gradient, which contributes significantly to thrust generation but also introduces risks such as cavitation.
- The regions highlighted in yellow and red indicate zones of maximum velocity—these colors not only reflect an intensified flow but also mark potential critical points in terms of blade structural integrity. These areas are subject to the highest dynamic loads.
- Tip vortices and turbulent flow structures may emerge as a consequence of this phenomenon, potentially reducing overall propeller efficiency and leading to energy losses.
This simulation is highly valuable for marine propulsion engineering, offering insights into blade geometry optimization, avoidance of overload regimes, and adaptation of blade profiles for high-speed applications. The data support energy distribution analysis around the blades and provide a foundation for calculating coefficients such as the pressure coefficient (Cp) and estimating propulsive efficiency under turbulent flow conditions.
Table 4 and Table 5 summarize the case studies for the middle of the analysis interval (v = 4 [m/s] v = 6 [m/s], respectively).

Table 4.
Graphical results for the middle speed values of 4 [m/s] considered in the analysis.

Table 5.
Graphical results for the extreme speed values of 6 [m/s] considered in the analysis.
As presented in Table 4, the simulations performed at a constant inflow velocity of 4 [m/s] and varying rotational speeds of 300, 1800 and 4200 RPM highlight a clear and continuous evolution of the propeller’s hydrodynamic behavior as a function of rotational regime. At low RPM, the pressure and velocity fields are weakly developed, with minimal pressure differentials and low flow acceleration, indicating a subcritical operating regime with limited thrust and negligible fluid–structure interaction.
As the rotational speed increases, the pressure gradient across the blade surfaces becomes more pronounced, and local flow velocity rises significantly—particularly near the blade tips. These changes reflect a shift toward efficient thrust generation, where hydrodynamic loading becomes substantial and the propeller operates under more favorable energetic conditions. At the highest rotational speed, extreme pressure values and peak surface velocities are observed, exceeding the inflow velocity by several times. These conditions signal the onset of turbulent flow features, elevated structural loads, and an increased risk of cavitation, especially in low-pressure regions on the suction side.
Overall, the trend reveals a transition from a passive to an active hydrodynamic regime, where enhanced propulsion performance is accompanied by intensified mechanical stresses and cavitation risk. These insights are essential for defining optimal operating parameters and for validating the propeller’s design from both performance and durability perspectives.
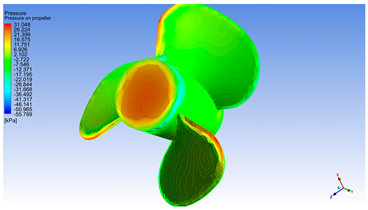
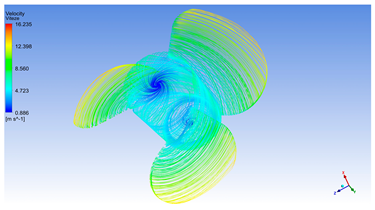
As illustrated in Table 5, the pressure and velocity distributions at 1500, 3600 and 5400 RPM (with constant inflow velocity of 6 [m/s]) highlight the progressive evolution of the propeller’s hydrodynamic performance. At 1500 RPM, the pressure distribution is moderate and uniform, with low local fluid velocities (<15 [m/s]) and fully attached flow, indicating a baseline operation with limited thrust and minimal fluid–structure interaction. As the rotational speed increases to 3600 and then 5400 RPM, both pressure gradients and local velocities intensify significantly. Red and orange zones appear on the pressure side, while increasingly dark blue regions form on the suction side, especially at 5400 RPM, where maximum pressure differentials are reached. Correspondingly, flow velocities near the blade tips rise above 25 [m/s] at 3600 RPM and exceed 30 [m/s] at 5400 RPM. These conditions mark a transition from efficient operation (at 3600 RPM) to a high-performance regime (at 5400 RPM), characterized by increased thrust generation but also elevated dynamic loads and a growing risk of cavitation, particularly in low-pressure zones. This comparative analysis confirms that higher rotational speeds enhance propulsive efficiency through greater pressure differentials and accelerated flow, while simultaneously imposing more severe mechanical and hydrodynamic constraints. These results are essential for identifying optimal operating conditions and validating the propeller’s geometric design from both engineering and scientific standpoints.
Overall, these figures demonstrate how increasing rotational speed amplifies both the pressure differential and local velocity, enhancing the propeller’s thrust performance while also intensifying structural loads and cavitation risks. These insights are directly applicable to defining optimal operating regimes and validating the geometric profile of the propeller for engineering and scientific purposes.
To verify the independence of the solution from the discretization mesh, a sensitivity study was performed using three levels of refinement: fine mesh, default mesh (used in the basic simulations) and coarse mesh as seen in Table 1. Comparing the results (Table 6) obtained for force, torque and maximum velocity reveals absolutely small percentage differences between the meshes, especially between the default and fine mesh as seen in Table 7.

Table 6.
Numerical results for the extreme speed values of 6 [m/s] considered in the analysis.

Table 7.
The percentages results for the extreme speed values of 6 [m/s] considered in the analysis.
Specifically, the absolute difference between the default and fine mesh is as follows:
- 0.5% for force,
- 6.0% for torque,
- 0.3% for maximum velocity.
Compared to the coarse mesh, the differences from the default increase slightly, but remain acceptable for engineering applications:
- 1.5% for force,
- 6.8% for torque,
- 0.3% for maximum velocity.
These values indicate that the default mesh offers satisfactory accuracy, with a favorable trade-off between the accuracy of the results and the computational cost. Considering the reduced variations compared to mesh-fine, it can be concluded that they are independent of the grid, and the chosen discretization is appropriate for the present study.
The convergence of the solutions was also verified according Figure 10, Figure 11 and Figure 12 for v = 2 [m/s] and 3600 rpm, and Figure 13, Figure 14 and Figure 15 for v = 6 [m/s] and 3000 rpm.
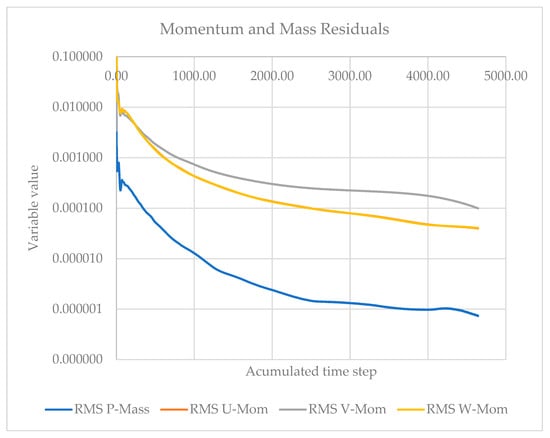
Figure 10.
Momentum and mass convergence diagram for v = 2 [m/s] and 3600 rpm.
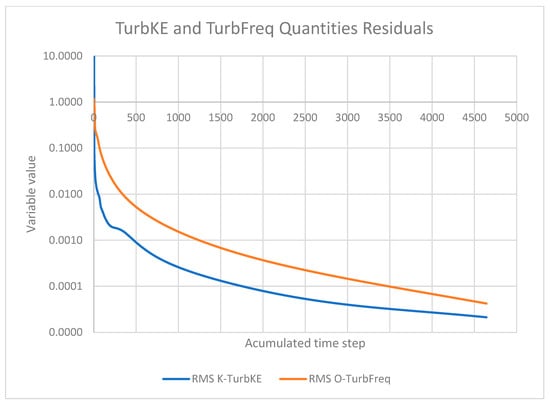
Figure 11.
Turbulence convergence diagram for v = 2 [m/s] and 3600 rpm.
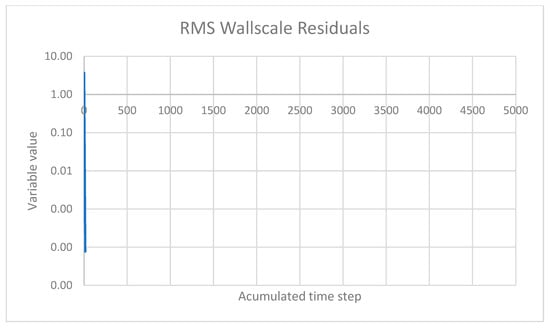
Figure 12.
Wall and boundary convergence diagram for v = 2 [m/s] and 3600 rpm.
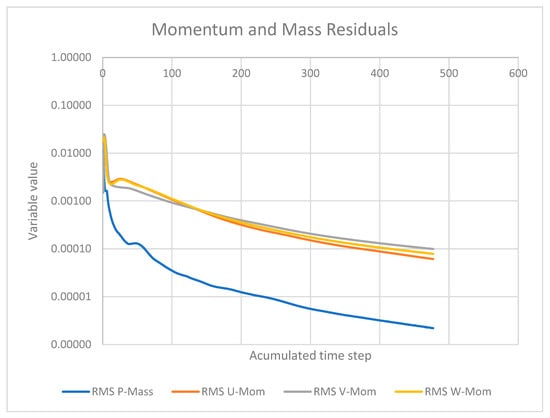
Figure 13.
Momentum and mass convergence diagram for v =6 [m/s] and 3000 rpm.
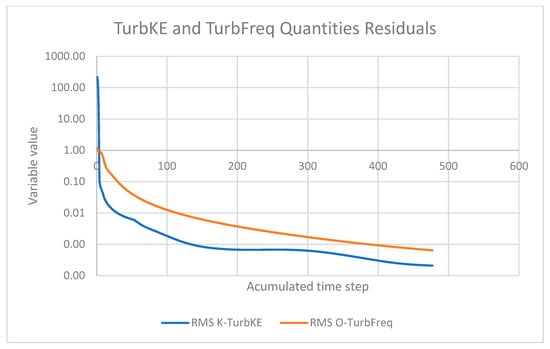
Figure 14.
Turbulence convergence diagram for v = 6 [m/s] and 3000 rpm.
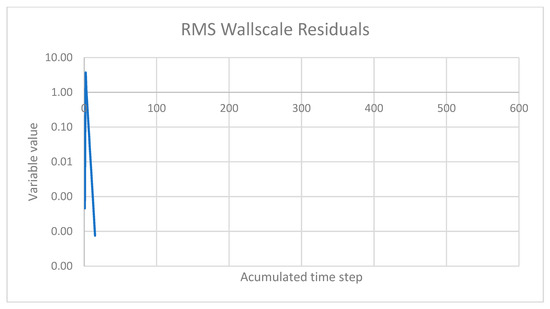
Figure 15.
Wall and boundary convergence diagram for v = 6 [m/s] and 3000 rpm.
According to Figure 10, Figure 11 and Figure 12, the numerical stability and accuracy of the solution were verified. A convergence analysis was conducted based on the evolution of residuals throughout the CFD simulation, corresponding to a case with an inlet flow velocity of 2 m/s and a rotational speed of 3600 rpm. The results are presented in three plots representing the residuals of mass and momentum conservation, turbulence parameters (SST k-ω model), and wall boundary treatment, respectively.
All monitored variables exhibited a consistent and monotonic decrease in root mean square (RMS) residuals, with no signs of numerical oscillation or divergence. The mass conservation residual (P-Mass) reached values below 10−5, while momentum components and turbulence parameters decreased below the 10−3 threshold, indicating a well-converged flow field. Additionally, the wall scale residual remained well below 10−4 confirming the adequate resolution of the near-wall region—crucial for the accurate modeling of momentum and heat transfer near solid boundaries.
Therefore, it can be concluded that the solution is numerically converged and physically stable, validating the robustness of the simulation setup and ensuring the reliability of the computed results for flow and associated phenomena analysis.
Based on the convergence Figure 13, Figure 14 and Figure 15 for the case with an inlet velocity of 6 m/s and a rotational speed of 3000 RPM, it can be concluded that the numerical solution is stable and reliable. The RMS residuals for mass and momentum conservation (U, V, W) showed a consistent decrease, reaching values below 10−5 and 10−4 respectively, which indicates an excellent convergence of the flow field. Similarly, the residuals for the SST turbulence model parameters (k and ω) continuously decreased throughout the simulation, stabilizing at values below the 10−3 threshold, which confirms an adequate resolution of the turbulent phenomena. The rapid convergence of the wall scale residual below 10−4 also validates the quality of the computational mesh and the numerical treatment applied at the solid boundaries, which is essential for accurate modeling. Therefore, the absence of oscillations and the monotonic decreasing trend of all residuals confirm the robustness of the simulation setup and the reliability of the obtained results.
5. Conclusions
The numerical method employed in this research incorporated a wide range of propeller rotational speeds (from 300 RPM to 5400 RPM, with increments of 300 RPM) and various vessel speeds (from 0 to 10 m/s, with increments of 2 [m/s]).
Figure 16 illustrates the “Thrust–Propeller RPM” diagram (the numerical values were indicated in Table 8). The data obtained from the simulation of the marine propeller in ANSYS Fluent provide a detailed representation of its performance as influenced by variations in rotational speed (RPM) and inflow water velocity. The fixed-pitch three-blade propeller, with a diameter of 14 [cm], was tested in a virtual environment to evaluate the axial force generated under diverse operating conditions. The dataset clearly reflects the evolution of this force with respect to the two key variables: RPM and water speed.
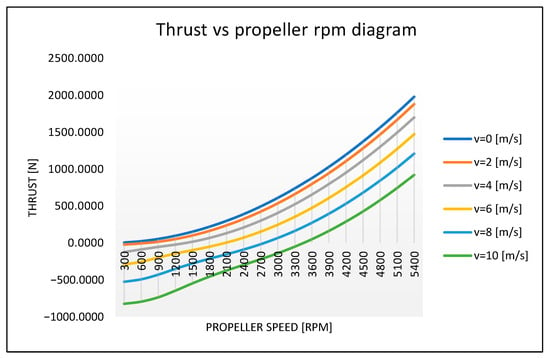
Figure 16.
Thrust vs. propeller RPM diagram.

Table 8.
The numerical values for the diagram in Figure 16.
Under stagnant water conditions (v = 0 [m/s]), the axial force increases markedly with RPM, confirming the typical behavior of a propeller operating in a non-flowing medium. This near-exponential growth suggests an efficient conversion of mechanical energy into thrust, unaffected by external flow disturbances. However, as the flow velocity increases, particularly in the 2–10 m/s range, the propeller enters a more complex regime in which dynamic interactions with the incident flow significantly alter its performance. At lower RPMs, the axial force becomes negative, indicating not only a lack of thrust generation but also hydrodynamic drag acting in the direction opposite to intended motion. This behavior may be attributed to unfavorable interactions between the blade geometry and incoming flow, resulting in a braking effect.
Nevertheless, with increasing RPM, a gradual reversal of this phenomenon is observed. At intermediate water velocities (v = 4–6 [m/s]), the threshold RPM required to achieve positive axial force appears to lie between 2400 and 2700 RPM, denoting a minimum performance benchmark. Surpassing this threshold enables the propeller to regain control over the flow field and to once again convert mechanical input into useful axial thrust. This transition from drag-dominated to propulsion-dominated regimes is essential for characterizing the functional capabilities of the propeller and has implications for both propulsive efficiency and cavitation potential across different operational scenarios.
In the upper RPM range (3000–5400 RPM), the axial force becomes progressively more positive, regardless of the flow velocity, demonstrating the propeller’s capability to operate effectively in dynamic environments. This trend suggests that at higher water speeds, the propeller not only overcomes hydrodynamic resistance but utilizes it as a stabilizing factor. Consequently, optimal performance is achieved at high RPMs combined with moderate to high water velocities, where the maximum axial thrust is significant and indicative of elevated propulsive efficiency.
Figure 17 represents the “Torque–propeller RPM” diagram (the numerical values were indicated in Table 9).
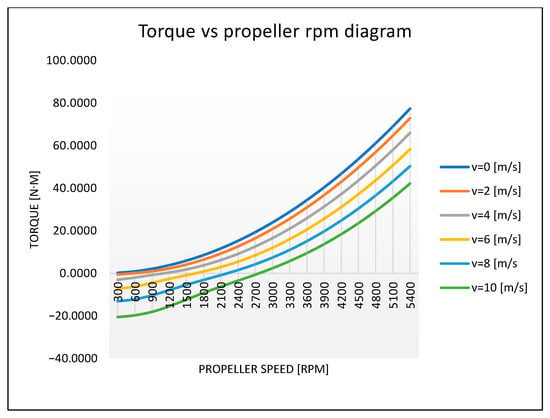
Figure 17.
Torque vs. propeller RPM diagram.

Table 9.
The numerical values for the diagram in Figure 17.
The simulation data illustrate how torque varies as a function of propeller rotational speed and water inflow velocity. At low RPMs, particularly under higher flow conditions, the torque values become negative, indicating that the fluid imposes significant resistance on the propeller. This behavior can be associated with a braking regime. For instance, at 300 RPM and v = 10 [m/s], the torque is approximately −20.55 Nm, suggesting that the incoming flow strongly opposes the motion of the propeller, causing it to act more as a hydrodynamic brake than as a thrust generator.
As the rotational speed increases, the propeller begins to dominate the interaction with the fluid, and the torque transitions to positive values. This shift implies that the propeller is actively generating torque that can be converted into mechanical power. Under static water conditions (v = 0 [m/s]), the torque increases almost linearly, rising from 0.24 Nm to over 69 Nm between 300 and 5100 RPM. This reflects a consistent and progressive mechanical efficiency in a quiescent fluid environment. By contrast, at v = 10 [m/s], the torque enters the positive domain only after approximately 2700 RPM, indicating the presence of a minimum power threshold required to overcome flow resistance.
Such information is essential for determining the overall efficiency of the system, since torque combined with RPM defines the mechanical power consumed or delivered by the propeller. Therefore, analyzing torque curves enables the evaluation of energy efficiency, identification of optimal operating regimes, and estimation of mechanical overload risks. Negative torque values at low RPMs suggest that these regimes should be avoided in practical applications to prevent unnecessary energy consumption and excessive stress on the mechanical structure.
This study aimed to present a novel method for evaluating marine propeller suitability, targeting both the scientific community and, more critically, engineers involved in the design and construction of high-speed vessels who are continuously seeking innovative solutions.
Given the current technological reality where engineers can autonomously model and 3D-print propellers, the authors propose a methodology for obtaining “thrust curves” and “torque curves”, before printing the propeller. Thrust curves are instrumental in determining the vessel’s attainable speed, while torque curves provide critical data regarding engine load.
The results demonstrate a noticeable reduction in the propeller’s generated thrust at higher speeds. This observation aligns with theoretical expectations, as the propeller itself acts as an appendage contributing to the overall drag resistance of the vessel. Specifically, at a speed of 10 [m/s] (approximately 19.5 knots), the propeller begins to generate positive thrust for the vessel only for a shaft rotation above 2700 RPM.
From a hydrodynamic perspective, the data suggest that the propeller features a geometry well-suited for medium to high flow regimes, with a torque distribution that promotes both stability and energy efficiency. The evolution of torque as a function of RPM and water velocity can be used to determine key performance coefficients—such as the torque coefficient and advance ratio—which are essential for characterizing the propeller in open-water conditions. Additionally, these results may be extrapolated to assess cavitation risk, particularly in high-RPM and low-pressure regimes, where pressure distribution across the blades becomes critical.
In conclusion, the reference propeller exhibits robust hydrodynamic behavior, with a clear transition between braking and propulsion regimes, and a demonstrated ability to adapt to varying flow conditions. These characteristics make it suitable for applications where torque control and energy efficiency are of primary importance.
Furthermore, the investigations identified regions susceptible to cavitation phenomena. This identification is crucial for implementing targeted protective measures to extend the operational lifespan of the propeller. The reliability of the presented propeller simulations, in the absence of validation against experimental data or results from peer-reviewed publications, is limited. Comparison with the validated literature can serve as a reference point to identify potential numerical artifacts or over/underestimation of key parameters. To strengthen the credibility of the results, future work should include validation steps—either through experimental testing or benchmarking against trusted numerical studies—ensuring that the simulation framework accurately reproduces known physical behavior.
Author Contributions
Conceptualization, A.P. and M.R.; methodology, A.P.; software, O.-N.V.; validation, M.R., A.P. and O.-N.V.; formal analysis, O.-N.V.; investigation, A.P.; resources, M.R., A.P. and O.-N.V.; data curation, A.P.; writing—original draft preparation, O.-N.V.; writing—review and editing, O.-N.V.; visualization, A.P.; supervision, M.R., A.P.; project administration, O.-N.V.; funding acquisition, M.R. All authors have read and agreed to the published version of the manuscript.
Funding
This research received no external funding.
Institutional Review Board Statement
Not applicable.
Informed Consent Statement
Not applicable.
Data Availability Statement
The data supporting the conclusions of this article will be made available by the authors on request.
Acknowledgments
The authors would like to thank “Mircea cel Bătrân” Naval Academy of Constanţa, Romania, for the permission to use the software licenses and for all the support provided in the development of this work. During the writing of this article, the authors only used AI (Chat GPT) to have a scan on the internet to find the most relevant papers related to CFD propeller analysis. These papers are the bibliography (presented in references section) utilized to find the most relevant methods utilized.
Conflicts of Interest
Author Marian Ristea was employed by the Jalmare Oy. The remaining author declare that the research was conducted in the absence of any commercial or financial relationships that could be construed as a potential conflict of interest.
References
- Loh, A.C.; Yongson, O.; Samylingam, L.; Rilling, D.; Kok, C.K.; Chen, G.M. CFD analysis of Hydrodynamic Characteristics of Tidal Current Turbines. Engineering. Technol. Appl. Sci. Res. 2025, 1, 22049–22058. [Google Scholar] [CrossRef]
- Drăgan, V. A Numerical Proof of Concept for Thermal Flow Control, Engineering. Technol. Appl. Sci. Res. 2017, 7, 1387–1390. [Google Scholar] [CrossRef]
- Seok, W.; Lee, S.B.; Rhee, S.H. Computational simulation of turbulent flows around a marine propeller by solving the partially averaged Navier-Stokes equation. Proc. Inst. Mech. Eng. Part C—J. Mech. Eng. Sci. 2019, 233, 6357–6366. [Google Scholar] [CrossRef]
- Su, S.C.; Wang, S.S.; Cao, J.B.; Feng, D.S. Prediction of hydrodynamic characteristics of combined propellers based on CFD method. J. Phys. Conf. Ser. 2019, 1300, 012016. [Google Scholar] [CrossRef]
- Jang, Y.H.; Eom, M.J.; Kim, S.H.; Song, G. A numerical Study on the Open Water Performance of a Propeller with Sinusoidal Pitch Motion. Brodrograndja 2020, 71, 71–83. [Google Scholar] [CrossRef]
- Cai, B.; Qiu, L.Y.; Tian, B.B.; Xu, Q.; Mao, X.F.; Chai, W.; Zhan, X.Y. Research on predicting methods of propeller-hull interactions in head waves. Ocean. Eng. 2023, 269, 113493. [Google Scholar] [CrossRef]
- Benoumessad, K.; Fourar, F.Z.; Fourar, A.; Massouh, F. Modeling Turbulent Flow Velocity Profiles in Irregularly shaped Open Channels: A 3D Approach. Eng. Technol. Appl. Sci. Res. 2025, 15, 22203–22208. [Google Scholar] [CrossRef]
- Song, Y.C.; Yu, H.L.; Chen, C.C.; Liu, C.Y.; Yang, Y.X.; Chi, C.K. Performance Analysis of a Propeller with Surface Protrusions. Sens. Mater. 2022, 34, 3857–3868. [Google Scholar] [CrossRef]
- Nakisa, M.; Maimun, A.; Ahmed, Y.M.; Steen, S.; Behrouzi, F.; Hassanzadeh, R.; Sakbi, A.F. Propeller Effect on 3D Flow at the Stern Hull of a LNG Carrier using Finite Volume Method. Mech. Mater. Eng. 2014, 554, 566–570. [Google Scholar] [CrossRef]
- Bakhtiary, M.; Ghassemi, H. Numerical analysis on effects of blade number on hydrodynamic performance of low-pitch marine cycloidal propeller. Proc. Inst. Mech. Eng. Part M-J. Eng. Marit. Environ. 2020, 234, 490–501. [Google Scholar] [CrossRef]
- Firouzi, J.; Ghassemi, H.; Vakilabadi, K.A. Effect of the cross-flow wake on the hydrodynamic performance of the HSP propeller by the CFD solver. J. Mar. Eng. Technol. 2022, 21, 271–280. [Google Scholar] [CrossRef]
- Quaisie, J.K.; Yamba, P.; Tabie, V.M.; Sekyi-Ansah, J.; Akayeti, A.; Mohammed, A.-H. The Effect of Cavitation Water Jet Shock as a Newly Technology on Micro-Forming Process. Engineering. Technol. Appl. Sci. Res. 2023, 13, 10407–10413. [Google Scholar] [CrossRef]
- Yusvika, M.; Prabowo, A.R.; Tjahjana, D.D.D.P.; Sohn, J.M. Cavitation Prediction of Ship Propeller Based on Temperature and Fluid Properties of Water. J. Mar. Sci. Eng. 2020, 8, 465. [Google Scholar] [CrossRef]
- Wu, J.; Wang, Q.; Deasy, H.; Hang, J. A Study on the Effect of Toroidal Propeller Parameters on Efficiency and Thrust. Energies 2024, 17, 5938. [Google Scholar] [CrossRef]
- Li, J.; Ma, L.; Chen, D.; Qi, Y.; Bai, T.; Pan, G. Comparative Study of Hydrodynamic Performance of Submerged Water Jet Propeller and Conventional Propeller Under Multiple Operating Conditions. Machines 2025, 13, 147. [Google Scholar] [CrossRef]
- Krasilnikov, V.; Skjefstad, V.S.; Koushan, K.; Rambech, H.J. A Calibration Study with CFD Methodology for Self-Propulsion Simulations at Ship Scale. J. Mar. Sci. Eng. 2023, 11, 1342. [Google Scholar] [CrossRef]
- Chen, C.-W.; Lu, J.-L.; Chen, X.-P.; Wang, D.-J. A Study on the Propulsion Performance of Hybrid-Driven Underwater Glider Equipped with a Kappel Tip Rake Propeller. Appl. Sci. 2024, 14, 7245. [Google Scholar] [CrossRef]
- Wu, P.-C. CFD Body Force Propeller Model with Blade Rotational Effect. Appl. Sci. 2022, 12, 11273. [Google Scholar] [CrossRef]
- Menter, F.R. Two-equation eddy-viscosity turbulence models for engineering application. AIAA J. 1994, 32, 1598–1605. [Google Scholar] [CrossRef]
- Farkas, A.; Degiuli, N.; Martic, I.; Dejhalla, R. Impact of Hard Fouling on the Ship Performance of Different Ship Forms. J. Mar. Sci. Eng. 2020, 8, 748. [Google Scholar] [CrossRef]
- Available online: https://turbmodels.larc.nasa.gov/sst.html (accessed on 30 July 2025).
- Choong, W.H.; Yeo, K.B.; Tamiri, F.M.; Teo, K.T.K. Outboard Marine Propeller Performance Analysis Through CFD Modelling. In Proceedings of the 2013 UKSim 15th International Conference on Computer Modelling and Simulation, Cambridge, UK, 10–12 April 2013. [Google Scholar] [CrossRef]
- ANSYS User Manual. Available online: https://ansyshelp.ansys.com/public/account/secured?returnurl=/Views/Secured/main_page.html (accessed on 30 July 2025).
- Pan, Y.; Geng, Z.; Yuan, H.; Zhai, S.; Huo, F. Numerical Simulation and Flow Field Analysis of Porous Water Jet Nozzle Based on Fluent. Appl. Sci. 2024, 14, 7075. [Google Scholar] [CrossRef]
- Sikirica, A.; Carija, Z.; Kranjcevic, L.; Lucin, I. Grid Type and Turbulence Model Influence on Propeller Characteristics Prediction. J. Mar. Sci. Eng. 2019, 7, 374. [Google Scholar] [CrossRef]
- Degiuli, N.; Martic, I. CFD Applications in Ship and Offshore Hydrodynamics. J. Mar. Sci. Eng. 2024, 12, 1926. [Google Scholar] [CrossRef]
- Arifin, M.D. Analysis of Thrust & Torque B-Series Propeller using CFD: Variation of Blade and nProp. Int. J. Mar. Eng. Innov. Res. 2022, 7, 225–231. [Google Scholar] [CrossRef]
- Helal, M.M.; Ahmed, T.M. Adel A Banawan, Mohamed A Kotb, Numerical prediction of the performance of marine propellers using computational fluid dynamics simulation with transition-sensitive turbulence model. Proc. Inst. Mech. Eng. Part M J. Eng. Marit. Environ. 2018, 233, 515–527. [Google Scholar] [CrossRef]
- Vimala, V.; Veeramanikandan, K.; Viswanathan, N.; Krishnan, B.P.; Hari, S.; Madhavan, S.; Dhinesh, S.; Karthikeyan, V. Analysis of marine propeller using computational fluid dynamics. Mater. Proc. 2022, 68 Pt 6, 2375–2381. [Google Scholar] [CrossRef]
- Gaggero, S. Robust simulation-based design optimization of marine propellers. Ocean. Eng. 2025, 321, 120397. [Google Scholar] [CrossRef]
Disclaimer/Publisher’s Note: The statements, opinions and data contained in all publications are solely those of the individual author(s) and contributor(s) and not of MDPI and/or the editor(s). MDPI and/or the editor(s) disclaim responsibility for any injury to people or property resulting from any ideas, methods, instructions or products referred to in the content. |
© 2025 by the authors. Licensee MDPI, Basel, Switzerland. This article is an open access article distributed under the terms and conditions of the Creative Commons Attribution (CC BY) license (https://creativecommons.org/licenses/by/4.0/).
