Article

Steel Surface Defect Detection Algorithm Based on Improved YOLOv8 Modeling

1
Jilin Provincial Key Laboratory for Numerical Simulation, Jilin Normal University, Siping 136000, China
2
School of Mathematics and Computer Science, Jilin Normal University, Siping 136000, China
3
Teacher Development Center, Jilin Normal University, Siping 136000, China
*
Authors to whom correspondence should be addressed.
Appl. Sci. 2025, 15(15), 8759; https://doi.org/10.3390/app15158759
Submission received: 20 June 2025 / Revised: 30 July 2025 / Accepted: 6 August 2025 / Published: 7 August 2025

Abstract

Detecting steel defects is a vital process in industrial production, but traditional methods suffer from poor feature extraction and low detection accuracy. To address these issues, this research introduces an improved model, EB-YOLOv8, based on YOLOv8. First, the multi-scale attention mechanism EMA is integrated into the backbone and neck sections to reduce noise during gradient descent and enhance model stability by encoding global information and weighting model parameters. Second, the weighted fusion splicing module, Concat_BiFPN, is used in the neck network to facilitate multi-scale feature detection and fusion. This improves detection precision. The results show that the EB-YOLOv8 model increases detection accuracy on the NEU-DET dataset by 3.1%, reaching 80.2%, compared to YOLOv8. Additionally, the average precision on the Severstal steel defect dataset improves from 65.4% to 66.1%. Overall, the proposed model demonstrates superior recognition performance.

1. Introduction

Steel is an essential basic material for the global industry [1], and it is used extensively in construction, machinery manufacturing, transportation, energy, and other fields [2]; but in the steelmaking process, defects such as cracks, spots, scratches, corrosion, and so on [3,4] may appear on the surface [5], and these defects will affect corrosion resistance, surface flatness, etc., which will in turn affect the end product performance. This is particularly noticeable in some industries that require a very high quality of materials, such as in the aviation, aerospace, and automobile manufacturing industries, where quality problems on the surface of the material can create safety hazards. Accordingly, the timely and effective detection of steel surface defects is the basis for the assurance of product safety and reliability [6].
Nowadays, the main methods for steel surface defect detection [7] are dependent on deep learning methods and methods based on traditional techniques [8]. Among them, traditional methods [9] include magnetic particle inspection, penetration inspection, eddy current inspection, ultrasonic inspection, X-ray inspection, and machine vision inspection. Although these techniques have made progress in defect detection, they still have the disadvantages of limited applicable materials, a large influence of detection results by inspectors, and low detection accuracy. It is on this basis that methods rooted in deep learning have come to the forefront, with target detection algorithms of this kind falling into two distinct categories, namely one-stage approaches and two-stage approaches.
One-stage approaches are represented by YOLO (You Only Look Once) [10] and SSD (Single Shot Multibox Detector) [11], which predict the location and category of the target object directly from the input image by one-time forward propagation. The two-stage approaches are based on the sliding window and candidate region generation, which are mainly based on the R-CNN family, with R-CNN [12], Fast R-CNN [13], Mask R-CNN [14], RetinaNet [15], and so on. These algorithms first generate the appropriate alternative regions and then classify and adjust the boundaries of these regions to achieve the recognition effect. Despite the superiority of two-stage algorithms in terms of accuracy when compared with single-stage algorithms, they have problems such as difficulty in detecting small objects and high computational overhead. Therefore, in the field of materials science and automation, the development of efficient and accurate strip surface defect detection technology has become a popular research topic. Currently, deep learning techniques [16] have been shown to be an effective method for improving the precision and efficiency of defect detection. Of these, the YOLO series [17] represents a turning point in the evolution of machine vision, which is inspired by the GoogLeNet classification network [18] architecture to meet the stringent requirements of real-time detection with high accuracy, and it has been widely used in the detection of tiny surface defects. As a one-stage target detection approach, the YOLO series has gone through many versions since its introduction [19], and each iteration has considerable improvements in power, speed, and accuracy. YOLOv8 has increased speed in defect detection compared with its predecessor, but the detection accuracy has yet to be optimized. Therefore, this paper mainly aims to improve the YOLOv8 model in terms of detection accuracy. The main contributions are twofold. First, we embed a multi-scale attention mechanism into YOLOv8 to suppress noise and enhance model stability. Second, we implement group reconstruction, parallel multi-scale learning, and cross-spatial interaction to achieve efficient, high-performance feature enhancement. These improvements address the challenges of detecting defects on steel surfaces, including significant variations in defect size, low contrast, and low detection accuracy in complex backgrounds. We introduce a new connection structure called Concat_BiFPN, which performs weighted fusion and the concatenation of feature maps to achieve more precise feature fusion. This approach offers unique advantages for detecting small, irregular steel defects. The new model demonstrates stable, high-precision performance when detecting surface defects in steel materials.

2. YOLOv8

YOLOv8 was designed by Ultralytics and is based on the previous models of YOLO. The overall architecture is separated into four sections, namely the input, backbone, neck, and head. Figure 1 shows this network structure. The input section is concerned with image preprocessing, adjusting the provided images to the necessary training size according to a certain ratio, and Mosaic data enhancement [20]. The backbone section is the module utilized for the extraction of primary information. It is made up of CBS, C2f, and SPPF. Using the ELAN structure concept, the C2f convolution module is designed in YOLOv7 [21], which guarantees a light weight and obtains richer gradient flow information by parallelizing more branches of the gradient flow. The neck part adopts an FPN (feature pyramid network) together with a PAN (path aggregation network) to facilitate the merging of features of different dimensions. The head part is in charge of the final target detection and classification functions, including a recognition head and a classification head. A decoupled header scheme is implemented to increase the accuracy of each by assigning the classification and regression tasks to be processed by different network layers, allowing each task to focus on its objective. In the loss functions, the BCE (binary cross-entropy) function is used for the loss of the classification branch, and the DFL (distribution focal loss) and CIoU (complete intersection over union) functions are used for the loss of the regression branch. Considering the model’s detection capability and the adaptability of the dataset’s feature map size, this article uses YOLOv8 as the baseline model and introduces the attention mechanism EMA (efficient multi-scale attention) [22] and the pyramid network model BiFPN [23].

3. Construction of EB-YOLOv8

3.1. Model Architecture

To address issues such as poor feature extraction capability, low detection accuracy, and model instability, the multi-scale attention mechanism (EMA) and the weighted bidirectional feature pyramid network (BiFPN) were integrated into the YOLOv8 network to create the EB-YOLOv8 model (Figure 2). Here, “E” refers to the EMA attention mechanism and “B” refers to the BiFPN pyramid structure. The EMA is added before the three C2f modules in the neck section and the SPPF in the backbone section to perform global encoding and calibrate channel weights. After each model parameter update, smoothing is applied to accelerate convergence and enhance stability. A new Concat_BiFPN structure is constructed in the neck section. Following the Upsample module, which ensures that feature maps of different scales are size-aligned, the Concat_BiFPN structure replaces the Concat structure in the YOLOv8 structure. This achieves the bidirectional fusion of feature map information, significantly enhancing the expressive capability of feature maps. In the cross-layer feature fusion process, learnable weight parameters are introduced, and weighted fusion is performed to automatically adjust recognition priorities of different scales in real time. This enables a precise identification of targets of varying sizes.
Figure 3 shows the workflow of this model. First, the input image (640 × 640) is passed through the backbone for five rounds of downsampling to generate multi-scale feature maps. Next, the feature pyramid network performs bidirectional feature fusion. First, deep semantic features are fused from top to bottom. Then, shallow detail features are fused from bottom to top. The EMA attention mechanism is embedded during this process to enhance key features. Finally, three feature maps of different resolutions (80 × 80, 40 × 40, and 20 × 20) are used to detect small, medium, and large objects simultaneously, achieving efficient, multi-scale object recognition.

3.2. Embedding Multi-Scale Attention Mechanisms to Strengthen Feature Attention

The small size of the target and the high similarity or complexity of the background can sometimes cause YOLO-series models to fail to focus on target details when detecting surface defects in steel, resulting in missed detections and false positives. The attention mechanism [24] is a data processing method that has made significant progress in solving the problem of detecting tiny features in small targets. They focus on important information and select key details from a set of information. These mechanisms can help models focus better on key features of the target. Additionally, incorporating appropriate attention mechanisms can reduce data fluctuations during model training and enhance model stability. However, EMA stands out among other attention mechanisms because it efficiently enhances features through group reconstruction, parallel multi-scale learning, and cross-spatial interaction. This makes EMA more suitable for steel surface defect detection tasks.
Based on the above analysis, this paper introduces the efficient multi-scale attention (EMA) module, which is embedded in the C2f module (Figure 4). The EMA module is based on cross-spatial learning. The module outputs multi-scale feature maps that are grouped by channel dimension. C represents the number of channels, and H and W represent the height and width of the feature map, respectively. The parallel structure consists of two 1 × 1 convolutions that extract micro-defect edges and a 3 × 3 dilated convolution that captures the global context information of macro-defects. The 3 × 3 branch uses a single 3 × 3 convolution kernel to capture multi-scale feature representations and expand the feature space. The two 1 × 1 branch paths implement channel encoding operations with a sigmoid function applied to the output of the 1 × 1 convolution. The two-channel attention maps within each group are aggregated via simple multiplication, enabling cross-scale detection. Next, two-dimensional global average pooling (as in Equation (1)) encodes global spatial information. This guides the adaptive weight map, which is generated by spatial attention, to act as a high-pass filter. The filter adjusts features, enhances defect edges, and significantly improves detection accuracy in low-contrast images. The sigmoid function reduces the weights of low-gradient background regions, addressing defect detection tasks in complex backgrounds. Additionally, it smooths out high-frequency random noise in the time dimension by weighting the model’s weights, thereby reducing noise in gradient descent and improving the model’s stability.
Z C = 1 H × W j H i W x c i , j
Figure 4. Embedded EMA structure.
Applsci 15 08759 g004

3.3. Constructing Weighted Fusion Splicing Module to Realize Multi-Scale Feature Fusion

More advanced feature fusion mechanisms are required for the accurate and rapid identification of defects when inspecting steel surfaces. However, the neck component of YOLOv8 still uses the PANet [25] path aggregation structure, which transmits feature information through a bidirectional path network consisting of top-down and bottom-up paths. All feature layers contribute equally during fusion without considering differences in scale. YOLOv8’s original Concat connection structure simply stacks feature maps without an adaptive weighting mechanism that distinguishes the importance of different input feature maps. This results in low fusion efficiency and potentially introduces redundant or interfering information. Based on the above issues, this paper employs a weighted bidirectional feature pyramid network (BiFPN) to enhance the feature network (structure shown in Figure 5). The green arrows in the figure represent downward paths, the orange arrows represent upward paths, and the blue arrows represent jump connections. Uncolored circles represent features, while colored circles represent operators. The BiFPN constructs a bidirectional closed-loop fusion for the five levels of features from P3 to P7 (decreasing resolution, increasing semantic depth): The top-down path progressively upsamples high-level semantic features (P7/P6/P5) and dynamically fuses them with adjacent mid-to-low-level features (P6/P5/P4) via learnable weights, ultimately injecting them into the high-resolution lower-level P3 layer to enhance details; the bottom-up path downsamples the enhanced P3 details layer-by-layer and fuses them back into the P4–P7 layers, simultaneously optimizing the high-level semantic representation. This bidirectional flow enhances the expressive power of the features. A fast normalization method is also used for weighted fusion to distinguish the contribution of each level of features to the fusion, thereby achieving more precise feature fusion. This weighted strategy makes the utilization of features more efficient and effectively improves the performance of small object detection.
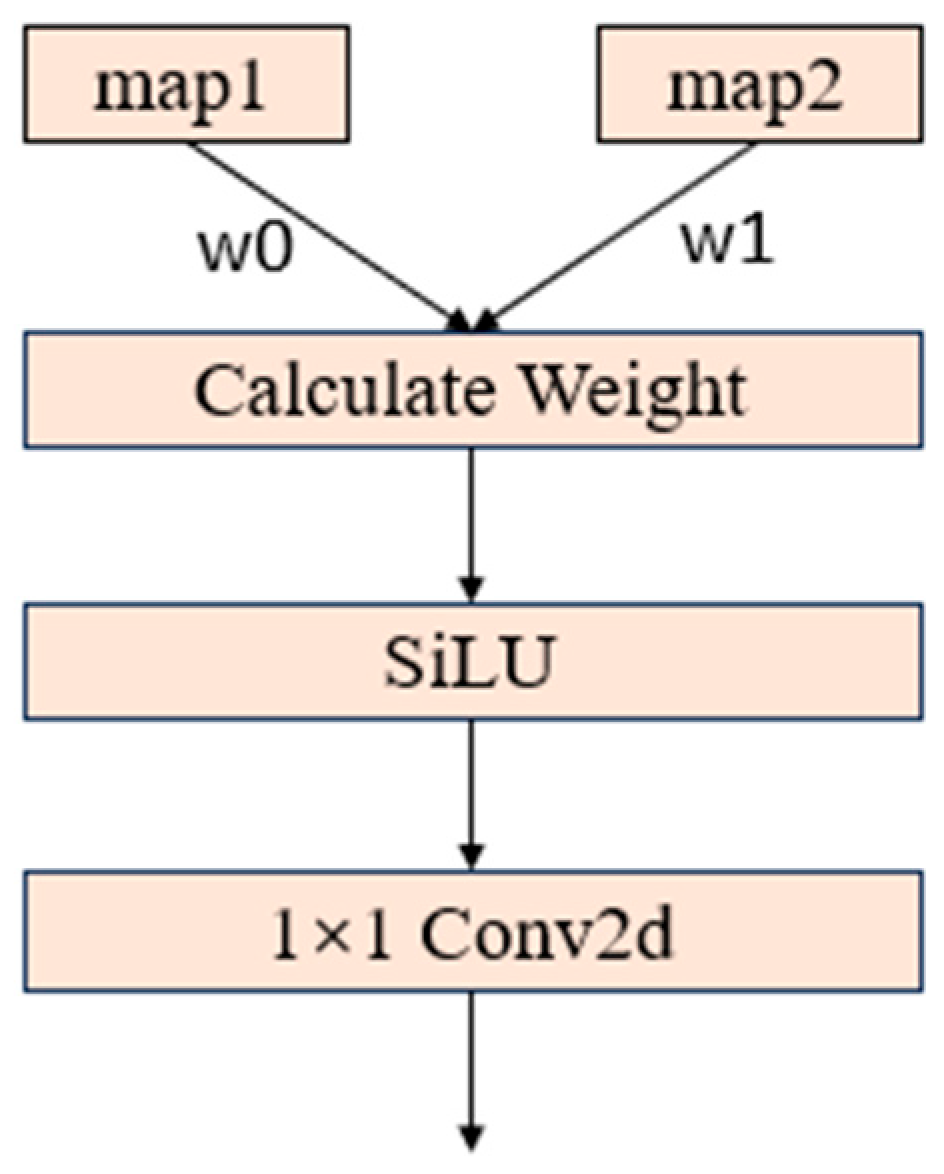
This paper proposes a Concat_BiFPN structure based on fast normalized weighted fusion (Figure 6) to replace the Concat and PANet modules in YOLOv8. The Concat_BiFPN module performs weighted fusion on the two input feature maps by assigning learnable weights to each input path’s feature map for importance-based weighting. The weighted feature maps are then concatenated along the channel dimension, followed by convolution layers to fuse the concatenated information and reduce dimensions, thereby achieving the weighted fusion of multi-scale features. Finally, the SiLU activation function is used with a 1 × 1 convolution to adjust the number of channels, enabling the model to have stronger fusion capabilities when dealing with multi-scale features with defects. This structure innovatively adopts an adaptive weight allocation strategy, dynamically learning the importance ratios of features at different levels to significantly optimize the fusion effect of multi-scale features. During feature processing, high-resolution shallow-layer features are assigned higher weights, effectively enhancing the identification capability of micron-level pitting; simultaneously, the channel dimension fusion method avoids feature compression loss in traditional methods, significantly improving the retention rate of details in small-sized defects.
This technology offers unique advantages over traditional fusion modes. For example, compared to the multi-layer redundant calculations of the stacked BiFPN, this technology achieves cross-scale feature optimization through a single weighted channel concatenation, fundamentally solving the problem of small-target information attenuation caused by multiple feature compressions in stacked structures. It significantly improves sensitivity to small defects while maintaining real-time performance. Compared to standard additive fusion, its special advantage lies in its channel dimension protection mechanism. Additive operations require the forced unification of channel dimensions, leading to the loss of critical features of small targets during convolution compression; in contrast, weighted concatenation preserves the original channel information, improving the contour integrity of sub-millimeter defects by nearly 40%.

4. Experimentation

4.1. Dataset

This experiment is trained and validated on two publicly available datasets, NEU-DET [26] and SSDD (Severstal Steel Defect Dataset) [27]. The NEU-DET dataset is an open source steel surface defect dataset from Northeastern University, containing 1800 images, each of which is 200 × 200 pixels in size. There are six kinds of common surface defects, namely Cr (Crazing), In (Inclusion), Pa (Patches), Ps (Pitted_surface), Rs (Rolled-in_scale), and Sc (Scratches), and there are 300 images for every type of defect, as shown in Figure 7. The SSDD dataset is the Kaggle Steel Defects Competition dataset, a bar defect dataset provided by Schewel Steel. The dataset consists of 6666 images for training and validation, with a size of 800 × 128 pixels, including 3082 pits (Class-0), 321 inclusions (Class-1), 14,648 scratches (Class-2), and 1907 patches (Class-3). However, because its light distribution is more complex than other bar defects and the class distribution is not balanced, to strengthen the generalization ability of the model and to reduce the effect of overfitting, the data enhancement of the SSDD dataset is performed in this experiment, which includes up–down flipping, left–right flipping, and up–down left–right flipping. The ratio of the expanded dataset to the raw dataset is 3:1, and the total number of images in the training and validation sets is 19,998, including 9246 Class-0 cards, 963 Class-1 cards, 43,944 Class-2 cards, and 5721 Class-3 cards. Some examples are shown in Figure 8. Both datasets are split 8:1:1 into training, test, and validation sets.

4.2. Experimental Environment

In this study, the experiment was conducted using the Windows 11 operating system, and the GPU model used in the experiment was NVIDIA GeForce RTX 2080 Ti, the equipment manufacturer is NVIDIA Corporation, headquartered in Santa Clara, CA, USA; the deep learning framework utilized was Pytorch 2.5.1.
The experiment was conducted in accordance with the following parameters: the learning rate was set to 0.1 and remained constant throughout training, the input image size was 640 × 640 pixels, 200 epochs was used, and the batch size was 32; the optimizer was SGD.

4.3. Experimental Evaluation Indicators

In this experiment, the detection performance of the model was evaluated using four metrics: P (precision), R (recall), model parameters, and the mAP (mean average precision) [28]. Since the mAP can holistically and accurately measure the total performance of the target detection method in multi-category tasks with high localization accuracy requirements, this paper mainly adopts the mAP as the main evaluation index. In the experimental process, the predicted situation was often the same or different from the real situation. TP denotes the number of positive samples that were correctly predicted, TN denotes the number of negative samples that were correctly predicted, FN denotes the number of positive samples that were incorrectly predicted, and FP denotes the number of negative samples that were incorrectly predicted.
P is used to denote the probability that a sample is positive, given that it has been predicted to be positive. This is calculated as outlined in Equation (2):
P = T P T P + F P
R is defined as the probability that a sample which is in fact positive will be predicted as positive, calculated as in Equation (3):
R = T P T P + F N
AP is the average accuracy of every class in the dataset, which is calculated as in Equation (4):
A P = 0 1 P ( r ) d r
The mAP is the mean of all APs from the categories. Here, n denotes the number of categories in a dataset, calculated as in Equation (5):
m A P = 1 n i = 1 n A P i

4.4. Ablation Experiment

Taking YOLOv8 as the baseline model, the EB-YOLOv8 model is constructed by improving it. To more fully illustrate the effect of each structural change on the network properties, this paper conducts four sets of model ablation experiments on two datasets, including the original YOLOv8 model, the YOLOv8+E model, the YOLOv8+B model, and the EB-YOLOv8 model. The YOLOv8+E model adds EMA to the raw model; the YOLOv8+B model incorporates a new connection structure, Concat_BiFPN, into the network. The EB-YOLOv8 model is the integration of the YOLOv8-E model and the YOLOv8-B model. Table 1 and Table 2 show the analytical results.
From Table 1, it can be analyzed that the YOLOv8+E model increases the P-value by 3.6% and the mAP value by 0.4% in contrast to YOLOv8 model; the YOLOv8+B model increases the P-value by 1.9% and the mAP-value by 0.8% by integrating the BiFPN model with the Concat module compared to the YOLOv8 model; the EB-YOLOv8 model integrates YOLOv8+E with YOLOv8-B and the overall detection effect is 1.9% and 0.8%, respectively. The EB-YOLOv8 model integrates YOLOv8+E and YOLOv8+B, with an enhancement of 1.9% in terms of the mAP value. The EB-YOLOv8 model, comprising the integration of YOLOv8+E and YOLOv8+B, exhibits an enhancement in the overall detection effect, with an increase in the P-value from 68.8% to 77.5%. Since the higher the mAP, the lower the R, the R value changes from 74.6% to 73.8%, the mAP value increases from 77.1% to 80.2%, except for in Pa-type defects, whose accuracy remained unchanged, and In-type defects, which decreased by only 0.7%. The accuracy of all other defect types improved with varying degrees, especially Rs-type defects, which improved by 13.8%. This fully demonstrates the effectiveness of the EB-YOLOV8 model.
On the SSDD dataset (Table 2), under conditions of uneven defect type distribution, large data volume, and more complex lighting distribution, the P-values of both the YOLOv8+E model and the YOLOv8+B model increased compared to the original model, indicating improved reliability in model predictions. The mAP value of YOLOv8+E rose by 0.1%, while that of YOLOv8+B increased by 2.7% compared to the original model. Although the mAP values for Class-0 and Class-3 saw slight declines of 0.8% and 1.6%, respectively, Class-1 and Class-2 improved by 3.2% and 1.2%, respectively. Moreover, despite the incorporation of an attention mechanism and the replacement of the original Concat structure with the Concat_BiFPN structure in the improved model, the detection accuracy increased, while the number of parameters changed by only 62.
In summary, EB-YOLOv8 achieved higher average precision without a significant increase in parameters. The improved model exhibits stronger robustness, faster convergence, enhanced feature extraction capability, and superior detection performance.

4.5. Comparison Experiment

To further verify the effectiveness of the improved algorithm proposed in this paper for steel surface defect detection, the enhanced EB-YOLOv8 algorithm was compared with current mainstream defect detection algorithms on both the NEU-DET and SSDD datasets. The experimental results are presented in Figure 9 and Figure 10.
On the NEU-DET dataset, compared with YOLOv5n [29], YOLOv8, YOLOv10n [29], and YOLOv11n [29] algorithms, our improved algorithm achieves notable mAP improvements of 5.8%, 3.1%, 5.6%, and 2.1%, respectively, surpassing all mainstream object detection methods. Under the SSDD dataset, the mAP values of the four models [30] in the comparison figure also improved to varying degrees, with the maximum increase in the mAP reaching 10.6%. The above comparison tests fully prove that the improved algorithm proposed in this paper has better results in steel surface defect detection, and high-accuracy detection algorithms are more suitable for industrial material defect detection.

4.6. Visual Result Analysis

In target detection tasks, the background usually occupies most of the image, while the defective part only occupies a small part of the image. The proportion of positive and negative samples is imbalanced. In this case, the PR curve is more useful than the ROC curve. The PR curve focuses on the positive samples and can better predict the positive samples, helping us to more accurately assess the effectiveness of the model in target identification and localization. The ROC curve may not be accurate enough due to the influence of the background. To summarize, to show the detection effect of each defect category more intuitively, as shown in Figure 11 and Figure 12, this paper presents the comparative mAP values of YOLOv8 and EB-YOLOv8 for each defect category under both the NEU-DET and SSDD datasets using P-R plots, respectively, with recall as the cross-coordinate and precision as the longitudinal coordinate. The term AP refers to the area below the P-R curve, and the mAP is equal to the average of all category APs. In the figure, “all-classes” represents the average mAP value of all classes.
This study demonstrates that the enhanced model can enhance the detection accuracy of various defect classes. In the NEU-DET dataset, due to the strong similarity in the appearance of the defects in the inclusion category and the small defect sites, the mAP value of the inclusion category decreased by 0.7%. While the patch category remains unchanged, the mAP values of other categories generally increase, especially the Rolled-in_scale category, with an increase of 13%. In the SSDD dataset, the mAP values of EB-YOLOv8 are still improved despite the small amount of Class-2 category data compared to other categories, which proves the stronger feature extraction ability of the model.
To further demonstrate the improved stability of the model’s detection performance, this study also analyzed the loss curves of the models, as shown in Figure 13 and Figure 14. Here, box_loss measures the error between predicted and ground truth bounding boxes, cls_loss calculates classification accuracy for anchor boxes, and dfl_loss represents regression loss for bounding box coordinates. Smoother curves indicate a more stable gradient descent with reduced noise. The figures clearly show that compared to YOLOv8, EB-YOLOv8 exhibits reduced fluctuations across all curves as epochs increase, demonstrating smoother convergence trends. These training results confirm that EB-YOLOv8 achieves greater stability and lower noise than the original model.

4.7. Visualization Result Analysis

Figure 15 shows the final detection results. Selecting some of the detection results, we can find that in the NEU-DET dataset, only two defects are detected in the original YOLOv8 model for the Crazing class defects and the Rolled-in_scale class defects, and there are leakage and inaccurate detection problems, while our designed model can detect three defect locations and has more accurate detection results for the detection of defects. To summarize, the EB-YOLOv8 model is more effective in defect detection and identification.

5. Conclusions

This paper introduces the YOLOv8 model and proposes an improved model, the EB-YOLOv8 model, to overcome the current problems of steel surface defect detection. The model adds the EMA module to make the model update and converge more smoothly, to reduce the noise in the gradient descent by weighted average model weights, to solve the problem of large data fluctuations in complex scenes, and to increase the stability of the model. The channel dimensions are also grouped into several sub-features to reduce computational overheads. The original PANet structure is substituted with the BiFPN in combination with Concat in YOLOv8, which achieves effective multi-scale feature fusion and increases its accuracy. EB-YOLOv8 combines these two structures to enhance the detection accuracy and stability of the model.
In the field of steel defect detection, there has been relatively little research focused on imbalanced datasets like SSD, with most studies concentrating on well-distributed datasets. However, the distribution characteristics of samples significantly impact model performance. Therefore, future research should further investigate these issues to enhance model robustness and generalization capability.

Author Contributions

Conceptualization, M.P. and Y.L.; methodology, S.B.; software, M.P.; validation, M.P., Y.L. and S.B.; formal analysis, M.P.; investigation, Y.L.; re-sources, Y.L.; data curation, M.P.; writing—original draft preparation, M.P.; writing—review and editing, Y.L. and S.B.; visualization, M.P.; supervision, Y.L.; project administration, Y.L. and S.B.; funding acquisition, Y.L. All authors have read and agreed to the published version of the manuscript.

Funding

This study was supported by the National Natural Science Foundation of China (No. 21606099), the Innovative and Entrepreneurial Talents Foundation of Jilin Province (No. 2023QN31), and the Natural Science Foundation of Jilin Province (No. YDZJ202301ZYTS157, 20240304097SF).

Data Availability Statement

The original contributions presented in this study are included in the article. Further inquiries can be directed to the corresponding author.

Conflicts of Interest

The authors declare no conflict of interest.

References

  1. Luo, Q.; Fang, X.; Liu, L.; Yang, C.; Sun, Y. Automated Visual Defect Detection for Flat Steel Surface: A Survey. IEEE Trans. Instrum. Meas. 2020, 69, 626–644. [Google Scholar] [CrossRef]
  2. Kou, X.; Liu, S.; Cheng, K.; Qian, Y. Development of a YOLO-V3-based model for detecting defects on steel strip surface. Measurement 2021, 182, 109454. [Google Scholar] [CrossRef]
  3. Che, L.; He, Z.; Zheng, K.; Si, T.; Ge, M.; Cheng, H.; Zeng, L. Deep learning in alloy material microstructures: Application and prospects. Mater. Today Commun. 2023, 37, 107531. [Google Scholar] [CrossRef]
  4. Li, M.; Wang, H.; Wan, Z. Surface defect detection of steel strips based on improved YOLOv4. Comput. Electr. Eng. 2022, 102, 108208. [Google Scholar] [CrossRef]
  5. Fan, C.; Yang, S.; Duan, C.; Zhu, M.; Bai, Y. Microstructure and mechanical properties of 6061 aluminum alloy laser-MIG hybrid welding joint. J. Cent. South Univ. 2022, 29, 898–911. [Google Scholar] [CrossRef]
  6. Versaci, M.; Angiulli, G.; La Foresta, F.; Laganà, F.; Palumbo, A. Intuitionistic fuzzy divergence for evaluating the mechanical stress state of steel plates subject to bi-axial loads. Integr. Comput. Aided Eng. 2024, 31, 363–379. [Google Scholar] [CrossRef]
  7. Wang, Y.-Z.; Zheng, Z.; Zhu, M.-M.; Zhang, K.-T.; Gao, X.-Q. An integrated production batch planning approach for steelmaking-continuous casting with cast batching plan as the core. Comput. Ind. Eng. 2022, 173, 108636. [Google Scholar] [CrossRef]
  8. Zeng, K.; Xia, Z.; Qian, J.; Du, X.; Xiao, P.; Zhu, L. Steel Surface Defect Detection Technology Based on YOLOv8-MGVS. Metals 2025, 15, 109. [Google Scholar] [CrossRef]
  9. Bhatt, P.M.; Malhan, R.K.; Rajendran, P.; Shah, B.C.; Thakar, S.; Yoon, Y.J.; Gupta, S.K. Image-Based Surface Defect Detection Using Deep Learning: A Review. J. Comput. Inf. Sci. Eng. 2021, 21, 040801. [Google Scholar] [CrossRef]
  10. Redmon, J.; Divvala, S.; Girshick, R.; Farhadi, A. You Only Look Once: Unified, Real-Time Object Detection. arXiv 2016. [Google Scholar] [CrossRef]
  11. Liu, W.; Anguelov, D.; Erhan, D.; Szegedy, C.; Reed, S.; Fu, C.-Y.; Berg, A.C. SSD: Single Shot MultiBox Detector. In Computer Vision—ECCV 2016; Leibe, B., Matas, J., Sebe, N., Welling, M., Eds.; Springer International Publishing: Cham, Switzerland, 2016; Volume 9905, pp. 21–37. [Google Scholar]
  12. Girshick, R.; Donahue, J.; Darrell, T.; Malik, J. Rich feature hierarchies for accurate object detection and semantic segmentation. arXiv 2014. [Google Scholar] [CrossRef]
  13. Ren, S.; He, K.; Girshick, R.; Sun, J. Faster R-CNN: Towards Real-Time Object Detection with Region Proposal Networks. arXiv 2016. [Google Scholar] [CrossRef]
  14. Anantharaman, R.; Velazquez, M.; Lee, Y. Utilizing Mask R-CNN for Detection and Segmentation of Oral Diseases. In Proceedings of the 2018 IEEE International Conference on Bioinformatics and Biomedicine (BIBM), Madrid, Spain, 3–6 December 2018; pp. 2197–2204. [Google Scholar] [CrossRef]
  15. Lin, T.-Y.; Goyal, P.; Girshick, R.; He, K.; Dollár, P. Focal Loss for Dense Object Detection. arXiv 2018. [Google Scholar] [CrossRef]
  16. Han, O.C.; Kutbay, U. Detection of Defects on Metal Surfaces Based on Deep Learning. Appl. Sci. 2025, 15, 1406. [Google Scholar] [CrossRef]
  17. Redmon, J.; Farhadi, A. YOLO9000: Better, Faster, Stronger. In Proceedings of the 2017 IEEE Conference on Computer Vision and Pattern Recognition (CVPR), Honolulu, HI, USA, 21–26 July 2017; pp. 6517–6525. [Google Scholar] [CrossRef]
  18. Szegedy, C.; Liu, W.; Jia, Y.; Sermanet, P.; Reed, S.; Anguelov, D.; Erhan, D.; Vanhoucke, V.; Rabinovich, A. Going Deeper with Convolutions. arXiv 2014. [Google Scholar] [CrossRef]
  19. Chen, Z.; Zhu, Q.; Zhou, X.; Deng, J.; Song, W. Experimental Study on YOLO-Based Leather Surface Defect Detection. IEEE Access 2024, 12, 32830–32848. [Google Scholar] [CrossRef]
  20. Ishtiaque Mahbub, A.M.; Malikopoulos, A.A. Platoon Formation in a Mixed Traffic Environment: A Model-Agnostic Optimal Control Approach. In Proceedings of the 2022 American Control Conference (ACC), Atlanta, GA, USA, 8–10 June 2022; pp. 4746–4751. [Google Scholar] [CrossRef]
  21. Wang, C.-Y.; Bochkovskiy, A.; Liao, H.-Y.M. YOLOv7: Trainable bag-of-freebies sets new state-of-the-art for real-time object detectors. arXiv 2022. [Google Scholar] [CrossRef]
  22. Ouyang, D.; He, S.; Zhang, G.; Luo, M.; Guo, H.; Zhan, J.; Huang, Z. Efficient Multi-Scale Attention Module with Cross-Spatial Learning. In Proceedings of the ICASSP 2023—2023 IEEE International Conference on Acoustics, Speech and Signal Processing (ICASSP), Rhodes Island, Greece, 4–10 June 2023; pp. 1–5. [Google Scholar] [CrossRef]
  23. Tan, M.; Pang, R.; Le, Q.V. EfficientDet: Scalable and Efficient Object Detection. arXiv 2020. [Google Scholar] [CrossRef]
  24. Wang, C.; Hu, J.; Yang, C.; Hu, P. DES-YOLO: A novel model for real-time detection of casting surface defects. PeerJ Comput. Sci. 2024, 10, e2224. [Google Scholar] [CrossRef]
  25. Liu, S.; Qi, L.; Qin, H.; Shi, J.; Jia, J. Path Aggregation Network for Instance Segmentation. arXiv 2018. [Google Scholar] [CrossRef]
  26. He, Y.; Song, K.; Meng, Q.; Yan, Y. An End-to-End Steel Surface Defect Detection Approach via Fusing Multiple Hierarchical Features. IEEE Trans. Instrum. Meas. 2020, 69, 1493–1504. [Google Scholar] [CrossRef]
  27. Severstal Steel Defect Dataset 2020. Available online: https://gitcode.com/open-source-toolkit/f4425/blob/main/severstal-steel-defect-detection.zip (accessed on 25 October 2024).
  28. Davis, J.; Goadrich, M. The relationship between Precision-Recall and ROC curves. In Proceedings of the 23rd International Conference on Machine Learning—ICML ’06, Pittsburgh, PA, USA, 25–29 June 2006; pp. 233–240. [Google Scholar] [CrossRef]
  29. Ma, S.; Zhao, X.; Wan, L.; Zhang, Y.; Gao, H. A lightweight algorithm for steel surface defect detection using improved YOLOv8. Sci. Rep. 2025, 15, 8966. [Google Scholar] [CrossRef] [PubMed]
  30. Liang, L.; Chen, K.; Chen, L.; Long, P. Improving the lightweight FCM-YOLOv8n for steel surface defect detection. Opto-Electron. Eng. 2025, 52, 240280–240281. [Google Scholar]
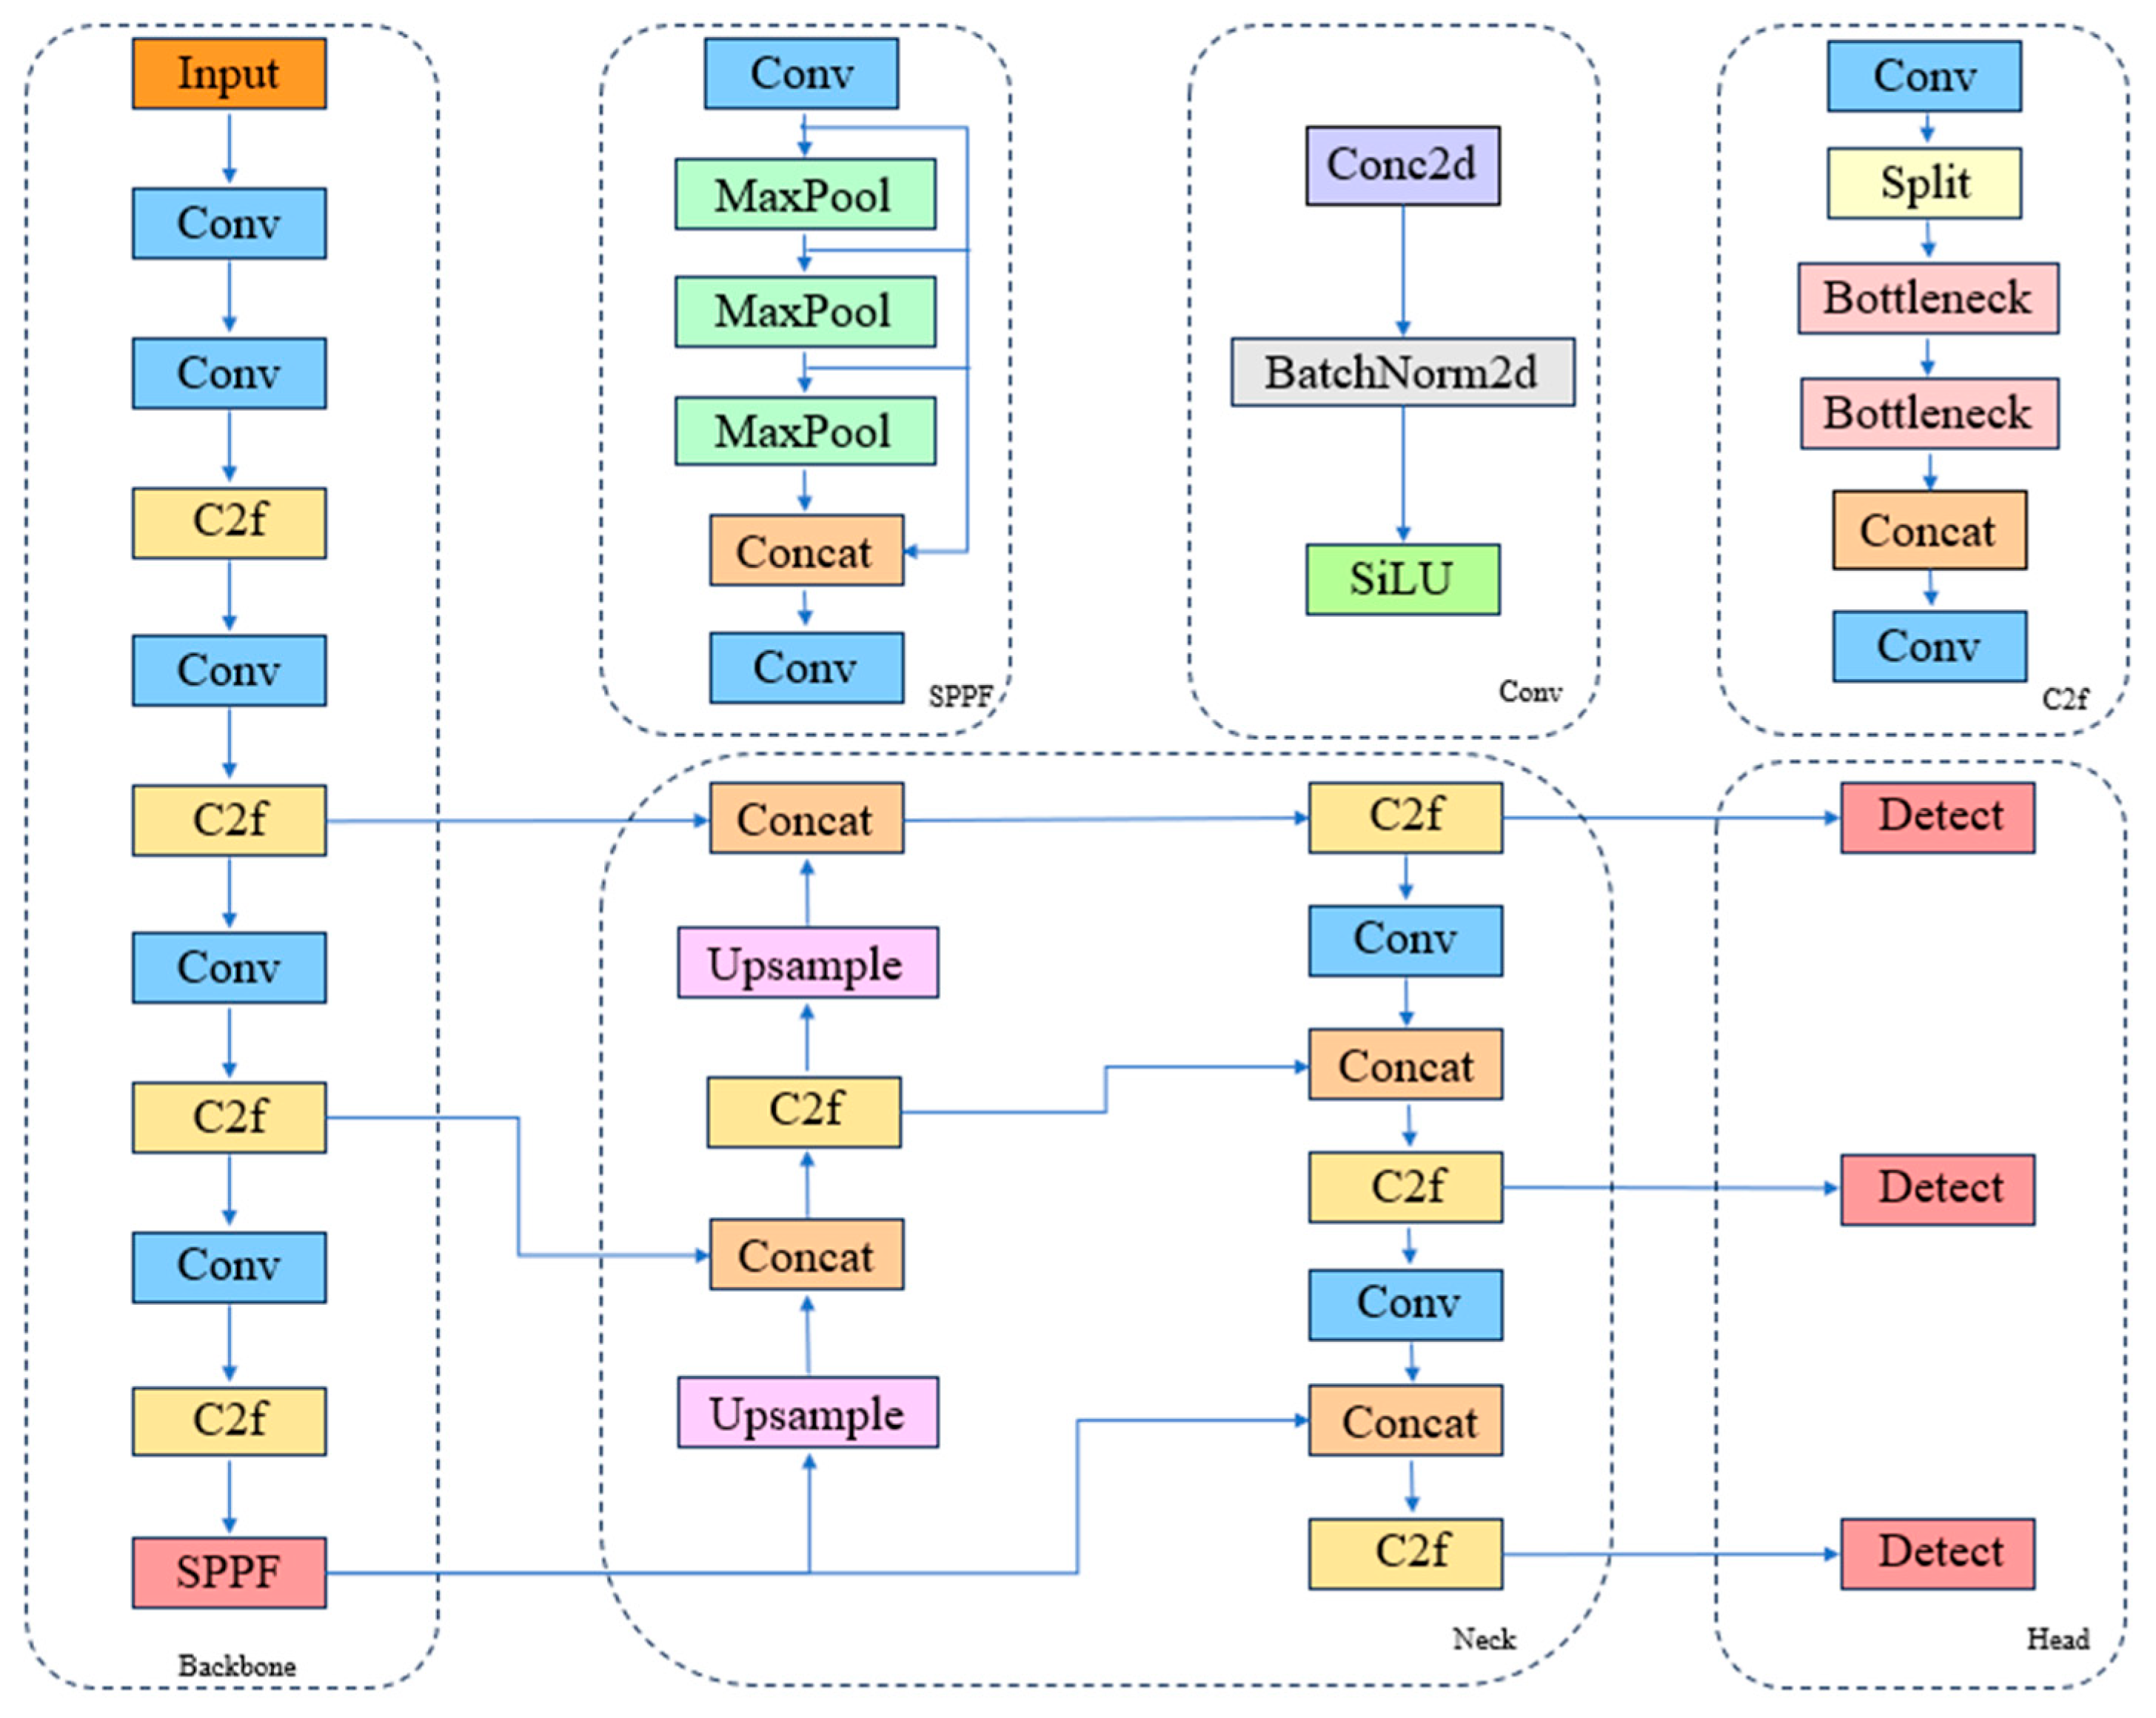
Figure 1. YOLOv8 structure.
Applsci 15 08759 g001
Figure 2. Structure of EB-YOLOv8.
Applsci 15 08759 g002
Figure 3. EB-YOLOv8 flowchart.
Applsci 15 08759 g003
Figure 5. BiFPN structure.
Applsci 15 08759 g005
Figure 6. Concat_BiFPN structure.
Applsci 15 08759 g006
Figure 7. Example plot of NEU-DET dataset.
Applsci 15 08759 g007
Figure 8. Example of defects before and after data enhancement for SSDD.
Applsci 15 08759 g008
Figure 9. Different experimental modeling results on the NEU-DET dataset.
Applsci 15 08759 g009
Figure 10. Different experimental modeling results on the SSDD dataset.
Applsci 15 08759 g010
Figure 11. P-R curve of YOLOv8 (a) and EB-YOLOv8 (b) on the NEU-DET dataset.
Applsci 15 08759 g011
Figure 12. P-R curve of YOLOv8 (a) and EB-YOLOv8 (b) on the SSDD dataset.
Applsci 15 08759 g012
Figure 13. Loss curves for YOLOv8 (a) and EB-YOLOv8 (b) on the NEU-DET dataset.
Applsci 15 08759 g013
Figure 14. Loss curves for YOLOv8 (a) and EB-YOLOv8 (b) on the SSDD dataset.
Applsci 15 08759 g014aApplsci 15 08759 g014b
Figure 15. Comparison of visualization results between the YOLOv8 algorithm and the EB-YOLOv8 algorithm.
Applsci 15 08759 g015aApplsci 15 08759 g015b
Table 1. Different experimental modeling results on the NEU-DET dataset.
ModelAP%P%R%mAP%Param
CrInPaPsRsSc
YOLOv839.983.292.487.966.293.369.074.677.13006818
YOLOv8+E38.180.993.987.076.495.772.472.578.73006874
YOLOv8+B38.781.293.986.972.394.770.774.677.93006827
Ours42.282.592.488.580.095.775.172.780.23006880
Table 2. Different experimental modeling results on the SSDD dataset.
ModelAP%R%P%mAP%Param
Class-0Class-1Class-2Class-3
YOLOv861.753.576.271.361.464.765.73006428
YOLOv8+E60.155.476.771.162.366.965.83006484
YOLOv8+B61.763.476.871.760.572.868.43006437
Ours60.956.777.469.760.569.766.23006490
Disclaimer/Publisher’s Note: The statements, opinions and data contained in all publications are solely those of the individual author(s) and contributor(s) and not of MDPI and/or the editor(s). MDPI and/or the editor(s) disclaim responsibility for any injury to people or property resulting from any ideas, methods, instructions or products referred to in the content.