Abstract
The emergence of telemedicine as a transformative information technology paradigm has significantly impacted various industries worldwide, particularly healthcare. With the advancement of machine learning (ML), new avenues have opened for the diagnosis, management, and treatment of Chronic Obstructive Pulmonary Disease (COPD). This study aims to deepen the understanding of pulmonary data through advanced analytical techniques, enhanced diagnostic accuracy, and predicted disease progression. A comprehensive approach is proposed for assessing the severity of COPD using regression analysis and generalized linear models (GLM). The results indicate that the proposed model achieves a prediction accuracy of 86.7%, demonstrating its effectiveness in evaluating disease severity. This tool can assist healthcare professionals in making informed clinical decisions for the management of COPD. The findings underscore the potential of AI-driven technologies to improve patient outcomes in chronic disease management.
1. Introduction
COPD is a progressive respiratory condition characterized by persistent breathing difficulties. In recent years, ML techniques have been increasingly applied to identify COPD through the analysis of clinical data and medical imaging [1,2].
Several well-established risk factors contribute to the development of COPD, including cigarette smoking, occupational exposure to harmful fumes, dust, and gases, as well as genetic predisposition [3]. While smoking remains a primary risk factor, it does not inevitably lead to COPD; studies show that approximately 30% of smokers may not develop the disease. Emerging research also suggests that adverse early-life conditions, such as impaired lung growth and reduced pulmonary function, may significantly increase the likelihood of developing COPD at a younger age [4].
Artificial intelligence (AI) technologies have shown promise in detecting COPD by leveraging a range of data sources, including electronic medical records, blood tests, lifestyle factors, imaging data, and ML algorithms [5,6]. Medical records often contain relevant information on previous respiratory illnesses and treatments, while blood tests can reveal biomarkers associated with COPD [7,8]. Additionally, lifestyle data such as a history of tobacco use, exposure to air pollution or industrial gases, and physical activity levels can further inform AI models in identifying individuals at risk [9]. COPD is a debilitating disease that significantly impairs quality of life and reduces life expectancy. It is recognized as a major global public health concern, with projections suggesting that by 2030, it will rank as the seventh most prevalent disease and the third leading cause of mortality worldwide. The increasing rates of smoking and worsening air quality in developing regions, particularly in Africa and Asia, are expected to intensify the COPD burden in these areas [10]. Machine learning algorithms offer a powerful means of detecting patterns in medical and diagnostic data that may indicate the presence or progression of COPD [11].
There is an urgent need to implement strategies that enable the early identification of individuals at high risk for developing COPD, as well as those already in the initial stages of the condition [12,13]. ML, a branch of AI, has emerged as a powerful tool for generating accurate predictions without the need for explicitly programmed instructions [14,15]. ML models utilize historical data to learn patterns and relationships that can be used to predict new outcomes. Generally, ML techniques are classified into three main categories: supervised learning, unsupervised learning, and reinforcement learning [16,17]. The machine learning pipeline typically begins with data exploration, followed by data preprocessing or cleansing, model development, and presentation of results [18]. Within the bioinformatics community, exploratory data analysis (EDA) has gained significant attention for its role in uncovering patterns in complex datasets. EDA is instrumental in formulating relevant research questions and generating testable hypotheses [19].
However, a major limitation in many existing studies is their reliance on small, narrowly defined datasets and a restricted set of features. This poses challenges to the generalizability of the models, as they may not perform reliably across diverse populations or varying data types [20]. Additionally, there is often a lack of validation using real-world data, which typically contains noise and variability not present in controlled research datasets. This raises concerns regarding the robustness of the models in practical clinical settings [21].
While ML-based algorithms have demonstrated considerable potential in the detection of COPD, further research is essential to enhance diagnostic precision, particularly in identifying disease severity at earlier stages. Although several studies have focused on predictive models for COPD prognosis, there remains a critical gap in the accurate prediction of disease severity across different stages.
This study introduces a novel predictive framework for assessing COPD severity using GLMs. The proposed approach integrates a comprehensive set of clinically relevant covariates within a statistically rigorous and interpretable structure. By balancing model transparency with predictive accuracy, the framework addresses a critical gap in COPD severity modeling and offers a reproducible methodology suited for clinical implementation.
2. Related Literature Review
The adoption and integration of telehealth into healthcare delivery systems hold significant potential to improve patient outcomes and reduce treatment-related costs. The continued expansion of telehealth services is largely driven by advancements in technology that allow healthcare providers to connect with patients effectively and empathetically, regardless of geographic location [22,23].
In the context of machine learning, various studies have outlined standard workflows that generally include steps such as data preparation, model development and training, model evaluation, selection, and deployment [24,25]. These workflows provide a structured approach to building predictive models for healthcare applications, including the diagnosis and monitoring of chronic respiratory conditions like COPD.
Recent advances in machine learning have introduced sophisticated approaches such as reinforcement learning and multi-modal learning, which have demonstrated promising results in complex diagnostic tasks. For instance, Bing et al. developed an energy-efficient and damage-recovery slithering gait for snake-like robots based on reinforcement learning and inverse reinforcement learning [26]. Similarly, Hao et al. proposed a multi-modal self-paced locality-preserving learning framework aimed at improving Alzheimer’s disease diagnosis, showcasing the integration of diverse data modalities and advanced learning strategies [27]. Furthermore, Deng et al. investigated learning-based refinement of object boundaries, offering insights that could enhance feature extraction and imaging analysis in medical applications [28]. Incorporating such methodologies in future COPD research may facilitate models capable of capturing complex nonlinear patterns and multi-source data, ultimately improving diagnostic accuracy and clinical relevance.
One study utilized Random Forests, an ensemble learning algorithm, to predict the percentage of forced expiratory volume in one second (FEV1%) using lung function test data and patient demographic information. The model demonstrated strong predictive performance and effectively identified individuals with airflow obstruction [29].
Another study applied gradient boosting, and another applied the ensemble learning technique, to estimate the severity of airflow obstruction. By leveraging patient demographics and pulmonary function test results, the model was able to accurately classify patients across different stages of COPD [30]. A third study employed artificial neural networks, a deep learning approach, to assess the extent of airflow obstruction using spirometry data. The model also achieved high predictive accuracy and successfully identified varying degrees of COPD severity [1].
Regression algorithms have proven particularly effective in COPD prediction tasks, as they are capable of modeling continuous outcome variables such as the degree of airflow obstruction based on multiple predictor variables, including demographic information, smoking history, and lung function test results [31]. One study applied linear regression to forecast FEV1 values using these features and reported strong predictive accuracy, enabling the identification of patients at heightened risk of developing COPD. In the same study, multiple linear regression was also employed, yielding similarly robust results in predicting airflow obstruction [32].
Several studies have employed different machine learning approaches to improve COPD detection. One study utilized logistic regression to predict the presence or absence of COPD based on patient demographics and lung function test results, reporting satisfactory diagnostic accuracy [33]. Another investigation applied a deep learning algorithm to classify computed tomography (CT) images as normal or indicative of COPD, achieving an accuracy of 88.9% in detecting the disease from imaging data [34]. Additionally, Das et al. (2018) used an artificial neural network on pulmonary function test (PFT) results and patient demographic data to classify COPD cases, reaching an accuracy of 86% [35].
Collectively, these findings highlight the potential of machine learning techniques to effectively detect COPD using a range of clinical and imaging datasets. Nonetheless, further research is needed to enhance the precision and generalizability of these models across diverse patient populations and data types.
The literature review reveals a notable gap in the application of machine learning methods specifically aimed at assessing the severity of COPD, indicating an important area for future investigation. While prior studies have demonstrated promising results using advanced machine learning techniques such as Random Forests, gradient boosting, and deep learning for COPD detection and severity classification, they often prioritize predictive accuracy at the expense of interpretability. Many rely on narrow feature sets or imaging data alone, limiting their clinical applicability and generalizability. In contrast, our study employs a statistically robust and interpretable GLM framework that incorporates a diverse and clinically meaningful set of covariates, including lung function metrics, comorbidities, and lifestyle factors. This approach not only preserves model transparency, which is crucial for clinical adoption, but also offers a reproducible methodology grounded in clinical plausibility. These distinctions collectively underscore the novelty and practical significance of our proposed model.
3. Research Method
Regression analysis is a fundamental tool in healthcare research, offering a structured approach to understanding the relationships between predictor variables and outcomes of interest. By employing linear, log-linear, or nonlinear regression models, researchers can quantify the association between a response variable Y and explanatory covariates xi (where i = 1, …, n, with n denoting the number of observations). This framework enables analysts to estimate the parameters of the model from observed data, predict values of Y, and evaluate model performance, thereby facilitating comprehensive what-if scenarios. Regression analysis not only models observed data but also helps establish causal relationships between variables, providing a robust foundation for accurate prediction.
To investigate the relationship between predictor variables and the severity of COPD, GLMs were utilized. GLMs were chosen for their interpretability and suitability for the data structure, allowing for a clear understanding of how each covariate influences the response variable. Although more complex machine learning techniques such as Random Forests and XGBoost may offer improved predictive accuracy, they were not employed in this study to maintain model transparency and enhance clinical interpretability.
Standard linear regression models assume homoscedasticity that the variance of errors is constant across all levels of covariates and independence of observations. The linear regression model can be expressed as follows:
where Yi is the dependent variable (a parameter that has been estimated) for observation i, while xi is the corresponding independent variable. β0 is the intercept, represents the slope, and εi is the residual error, representing the difference between observed and predicted values. Model parameters are estimated by minimizing the sum of squared residuals, ∑, to achieve the best fit. Slope is calculated as follows:
To ensure that the predicted mean values remain non-negative, it is common to apply a link function g(⋅) such that
The link function g(⋅) transforms the expected value μi to a scale appropriate for the model. For example, the logarithmic link g(x) = log(x) is used to guarantee non-negativity, while the logit link function is applied to scale the mean to a probability range between 0 and 1.
For multiple predictors, the linear regression model extends to
This model can be represented compactly in matrix form as
where
and the design matrix is
When the outcome is binary, such as disease status (presence or absence of COPD), the response variable is modeled using a binomial generalized linear model with the canonical logit link function. The logit model is expressed as follows:
where are the observed covariate values for the ith observation, and represents the intercept. The regression coefficients quantify the impact of each predictor on the log odds of the event.
The inverse of the logit transformation provides the predicted probability as follows:
To assess the reliability of the estimated regression coefficients (β0, β1, ..., βU), 95% confidence intervals were calculated. These intervals provide a range of plausible values for the true parameters with 95% confidence, thereby offering important insights into the statistical significance and robustness of each predictor’s effect on COPD severity.
3.1. Data Quality Control and Preprocessing
Prior to statistical modeling and exploratory analysis, a comprehensive data quality control process was conducted to ensure the reliability and consistency of the dataset. The dataset, sourced from the UCL rehabilitation program for COPD patients, was first examined for completeness. All variables were found to have 100% validity, with no missing values identified, thereby eliminating the need for imputation techniques.
Outlier detection was performed using both statistical summaries and visual inspection through density plots for continuous variables (e.g., age, FEV1, Forced Vital Capacity (FVC), six-minute walking test distance (MWT), pack history, and St. George’s Respiratory Questionnaire (SGRQ) score). These plots facilitated the identification of potential anomalies or skewness in the data distribution. For example, pack history displayed a right-skewed distribution, which informed our choice of transformation methods in subsequent analysis. However, no extreme outliers or implausible values requiring removal were detected.
Logical and clinical consistency checks were also applied. Continuous measures were reviewed to ensure they fell within physiologically plausible ranges, and categorical variables were confirmed to be properly coded and internally consistent.
Together, these data-cleaning steps ensured a high-quality analytical dataset, supporting the robustness of the descriptive and inferential analyses that follow.
As the classification strategy was influenced by data distribution characteristics and model performance constraints, a comprehensive rationale for adopting a binary classification approach over a multi-class model is presented in the Section 5.
3.2. Modeling Approach
The residual sum of squares (RSS) for the kth model is defined as follows:
where represents the estimated mean vector, and is the least-squares estimate of the parameter vector βk.
In the context of nested models, the residual sum of squares, denoted as , tends to decrease as more parameters are added. However, simply minimizing SSEk across different models does not necessarily lead to the optimal model, as it may result in overfitting.
Instead, a more informative metric is
which represents the expected squared distance between the true mean μ and its estimate . This measure provides a reliable indication of how accurately approximates μ.
Although increasing the number of parameters typically leads to a lower SSEk, it does not guarantee a better model. Therefore, model selection should balance goodness of fit and generalizability by considering both and .
The optimal model is ideally the one that minimizes , the expected squared distance between the true mean vector, and its estimate. However, because depends on unknown population parameters, it cannot be computed directly. Therefore, an estimate must be obtained, and the model corresponding to the smallest (for k = 1, …, K) is selected. If the minimum is achieved , then the corresponding estimate is considered the most accurate approximation of the mean vector.
To obtain a reliable estimate of , criteria such as Akaike’s Final Prediction Error (FPE) and Mallows are commonly used. After fitting multiple models to a given dataset, evaluating their performance, and considering their complexity, the final step in model selection is to choose the one that balances goodness of fit with parsimony. This principle applies to both supervised machine learning models (e.g., regression or classification) and unsupervised learning models (e.g., clustering).
Extensive research has explored numerous strategies for model selection, drawing upon contributions from various academic disciplines. Among the most widely used approaches are the Akaike Information Criterion (AIC) and the Bayesian Information Criterion (BIC). These criteria incorporate factors such as the model’s log-likelihood, the number of estimated parameters, and the principle of minimum description length (MDL) derived from information theory.
The BIC is formally defined as
where is the estimated variance of the residuals, n is the number of observations, and is the number of parameters in the kth model. Lower BIC values indicate a more optimal balance between model fit and complexity. The AIC is defined as
where is the estimated variance of residuals, n represents the number of observations, and is the number of parameters in the kth model. Lower AIC values indicate models that achieve a favorable trade-off between goodness of fit and complexity.
An important consideration in our model development was interpretability, particularly due to the clinical nature of the application. GLMs were chosen not only for their flexibility and statistical grounding, but also because their coefficients provide direct insights into the direction and strength of association between covariates and the outcome variable. In the final model, each covariate’s estimated coefficient was reviewed for clinical plausibility, and the significance levels were interpreted in the context of existing domain knowledge.
To evaluate the model’s generalizability and reduce the risk of overfitting, an internal validation process was conducted using a 70/30 train–test split. Additionally, cross-validation techniques such as k-fold cross-validation were considered to further assess the model’s predictive performance across different data partitions. Both cross-validation (CV) and generalized cross-validation (GCV) are well-established methods for estimating the prediction error associated with the kth fitted model, thereby offering insight into the model’s expected performance on unseen data. Although detailed CV and GCV results are not included in this manuscript, their use supports the model’s robustness and reliability.
Model parameter estimation was carried out using maximum likelihood estimation (MLE), a method that maximizes the conditional likelihood of the observed data given the model parameters. While the log-likelihood function does not constitute a probability distribution itself, it plays a crucial role in model fitting by guiding the selection of coefficients that best reflect the underlying structure of the training data. The resulting log-likelihood value serves as a central metric for evaluating model fit and comparing competing models.
To enhance the interpretability and practical applicability of the proposed methodology, particularly for clinicians, a visual flowchart outlining the sequential steps of model development, from data acquisition to risk prediction, has been included in Figure 1. This schematic representation helps clarify the underlying statistical framework and offers an intuitive guide for implementing the model in both clinical and research contexts.

Figure 1.
Visual workflow of the COPD Severity Prediction Model.
3.3. Clinical Implementation and Decision Support
While the current study focuses on developing and validating a statistical model for predicting COPD severity, its ultimate value lies in real-world clinical application. The proposed model can be integrated into a digital decision-support system, enabling physicians to input patient-specific clinical data and receive an immediate risk estimate regarding disease severity. Such a tool would reduce reliance on manual calculations and enhance usability for healthcare professionals, particularly in time-constrained environments.
In practice, this system could be deployed as a web-based interface or integrated into existing electronic health record (EHR) platforms. Upon identifying a patient at elevated risk of progressing to a more severe stage of COPD, the tool could generate automated clinical prompts such as recommending spirometry retesting, intensification of pulmonary rehabilitation, medication review, or scheduling follow-up visits. By providing timely and interpretable outputs, the model would support early intervention strategies and individualized patient management.
4. Exploratory Data Analysis
EDA is a critical step in the data analysis process that involves examining datasets to uncover underlying patterns, detect anomalies, and identify relationships between variables [36]. Utilizing statistical techniques and hypothesis testing, EDA provides a valuable means of discovering hidden insights within the data. The process typically includes several key stages: defining the research question, preparing the data, conducting analysis, and presenting results.
By performing EDA, analysts gain a comprehensive understanding of the dataset’s characteristics, enabling them to identify outliers, spot anomalies, and recognize potential trends or associations among variables. EDA lays the groundwork for more advanced statistical analysis and facilitates data-driven decision-making. The central aim of EDA is to offer a systematic and unbiased approach to understanding the dataset eschewing assumptions and generating insights that are fundamental to rigorous data interpretation [37].
For this study, the dataset was sourced from UCL repositories and made available via (Kaggle.com 2022). It includes data collected from a group of 101 individuals diagnosed with COPD, all of whom were invited to participate in a rehabilitation program. The primary objective of the program was to support participants in managing and maintaining control over their COPD condition.
The dataset comprises 24 variables encompassing a wide range of information, including patient demographics, disease status, lung function, mental health, and quality of life indicators. Table 1 summarizes these variables. Continuous variables include age, lung function metrics such as FEV1 and FVC, and physical performance indicators such as MWT1 and MWT2. Categorical variables include gender and COPD severity stage (COPDSEVERITY). Furthermore, the dataset captures mental health status using the Hospital Anxiety and Depression (HAD) scale, which assesses levels of anxiety and depression.

Table 1.
Variables for dataset.
The following is a summary of the dataset’s measures and features, as revealed through descriptive analysis. To illustrate the distribution of numerical variables, density plots were employed. These density plots facilitate the identification of skewness, modality, and potential outliers in the dataset, providing a foundational understanding necessary for subsequent modeling and hypothesis testing.
Density charts were generated for the following key continuous variables, as outlined in Table 1:
- Age;
- FEV1;
- FVC;
- Best MWT;
- Pack history (smoking history in pack years);
- SGRQ.
Table 2 presents the summary statistics and density plot for the age variable, offering a comprehensive overview of its distribution. The data demonstrated 100% validity with no missing values, ensuring a reliable basis for analysis. The density plot displayed in Figure 1 indicates a distribution that approximates normality, although it is slightly right-skewed, with a greater concentration of values toward the higher end of the age spectrum.
Table 2.
Age variable descriptive statistics.
The mean age of participants was 70.1 years, with a standard deviation (SD) of 7.86, suggesting moderate dispersion around the mean. The minimum and maximum age values were 44 and 88, respectively. The 25th percentile (Q1) was 65, the median (Q2) was 71, and the 75th percentile (Q3) was 75. These percentile values suggest that a majority of patients fall within the 65–75 age range, highlighting a central cluster in the dataset and a relatively smaller proportion of patients younger than 65 or older than 75.
Figure 2 complements Table 2 by visually reinforcing the summary statistics, confirming the observed distribution, and emphasizing the age concentration around the mid-60s to mid-70s range.
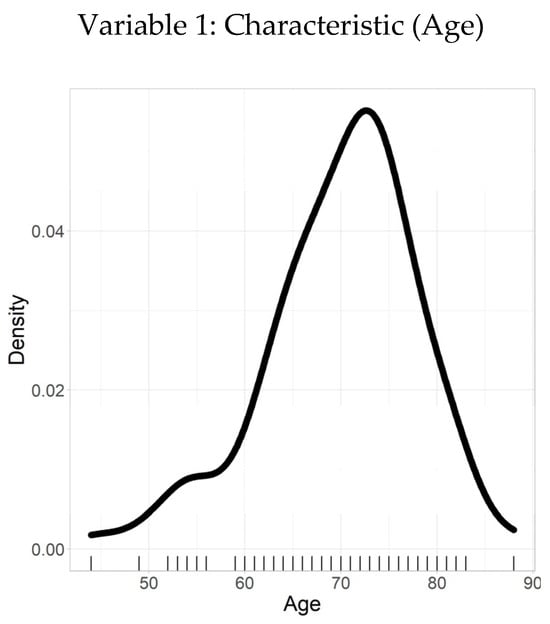
Figure 2.
Density plot–age.
Table 3 summarizes the descriptive statistics for FEV1, a continuous variable representing the volume of air (in liters) that an individual can forcibly exhale in one second—a key indicator of lung function. The analysis revealed a mean FEV1 value of 1.6 L, with a SD of 0.67 L, suggesting moderate variability around the mean.
Table 3.
FEV1 variable descriptive statistics.
The distribution of FEV1 values ranged from a minimum of 0.45 L to a maximum of 3.18 L. The 25th percentile (Q1) was 1.1 L, the median (Q2) was 1.6 L, and the 75th percentile (Q3) was 1.96 L, indicating a moderately right-skewed distribution with the bulk of observations concentrated between 1.1 and 1.96 L.
The data showed 100% validity with no missing values, ensuring that the results are robust and reliable. The density plot illustrated in Figure 3 complements the statistical summary by visually depicting the distribution of FEV1 values. The smooth curve reflects the frequency of observations across the range of values, highlighting the central tendency and spread, while aligning closely with the calculated mean and quantile ranges.
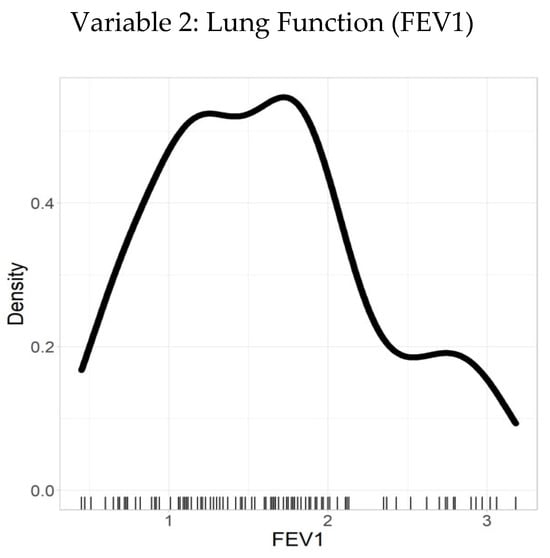
Figure 3.
Density plot–FEV1.
Figure 4 presents the density plots of key variables, illustrating their distributions and highlighting potential skewness. These visualizations guided the selection of appropriate transformation methods for subsequent analyses.
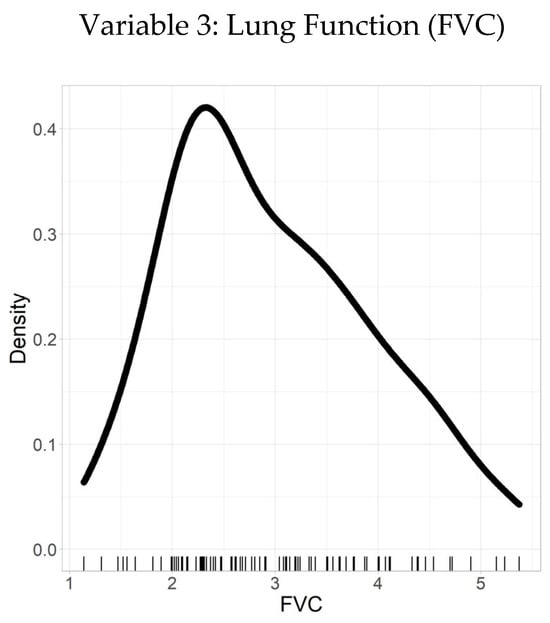
Figure 4.
Density plot–FVC.
Table 4 summarizes the statistical description of a sample of observations for a variable of interest. The sample had a mean value of 2.95 and a SD of 0.97. To further characterize the distribution, quantiles were calculated: the minimum value was 1.14, the 25th percentile was 2.27, the median (50th percentile) was 2.77, the 75th percentile was 3.63, and the maximum value was 5.37.
Table 4.
Descriptive statistics with FVC variables.
Based on the relationship between the mean and median, the distribution appears to be right-skewed, as the mean (2.95) is greater than the median (2.77). This indicates the presence of relatively more large values than small values in the sample, resulting in a longer tail on the right side of the distribution, with most values concentrated on the left.
The statistical summary offers valuable insights into the variable’s distribution, demonstrating a right-skewed pattern. These descriptive statistics, along with the quantiles, provide a comprehensive understanding that can inform further statistical analyses and decision-making processes.
The ability to walk, as measured by the MWT, serves as a critical functional indicator within the patient cohort. Table 5 presents the descriptive statistics of the MWT data, which is complete and free from missing or inconsistent values, underscoring the dataset’s high quality.
Table 5.
Best MWT variable descriptive statistics.
The mean MWT distance is 399.11 m, with a SD of 106.55 m, indicating a moderate spread of walking distances around the average. The quantiles further characterize the distribution: the minimum value is 120 m, the 25th percentile is 167 m, the median (50th percentile) is 378 m, the 75th percentile is 593 m, and the maximum value reaches 699 m. These quantiles offer insight into the distribution of walking ability across the cohort, showing that while most patients walk distances clustered near the median, there is variability extending towards both lower and higher extremes.
Figure 5 complements these statistics with a density plot, visually illustrating the distribution of MWT distances. This plot facilitates the identification of patterns such as clustering around the median and potential skewness, enabling a more intuitive understanding of the functional capacity within the group.
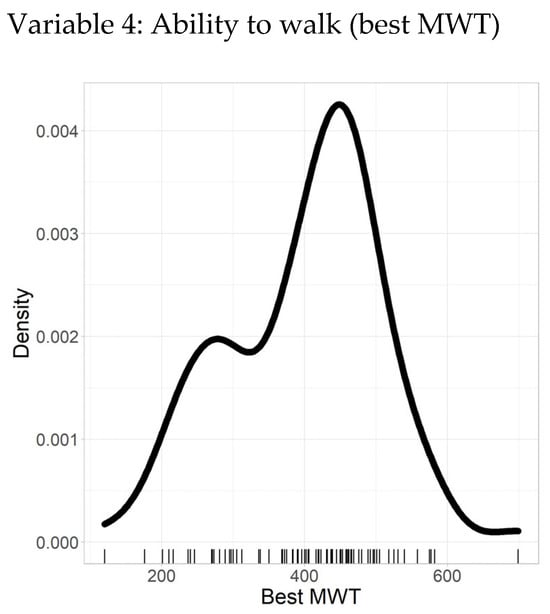
Figure 5.
Density plot–best MWT.
Figure 6 illustrates the density plot of pack history, providing a clear visual representation of the distribution of smoking exposure among the study participants. The plot highlights the frequency and concentration of pack-year values, showing that while most individuals have a moderate smoking history, a smaller subset exhibits significantly higher lifetime tobacco exposure.
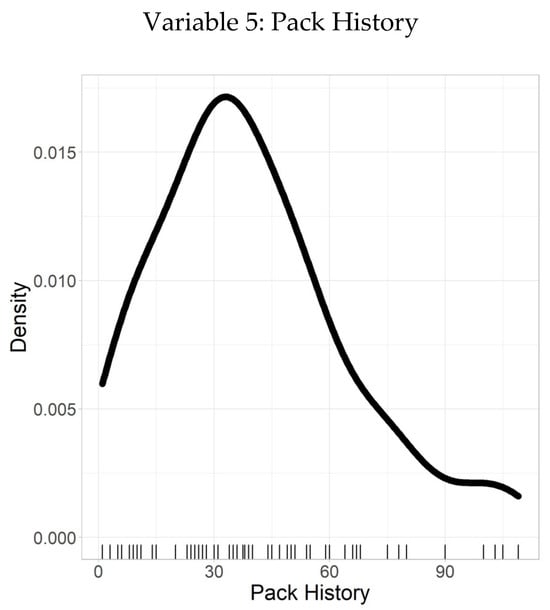
Figure 6.
Density plot–pack history.
Following this, Table 6 summarizes the descriptive statistics of pack history, defined as the number of packs of cigarettes smoked per day over one year. The dataset is complete with 100% validity, containing no missing or inconsistent values, which underscores its reliability. The mean pack history is 39.7, indicating the average cumulative exposure, with a SD of 24.4, reflecting considerable variability around the mean. A larger SD denotes a wider spread of pack history values, while a smaller SD would indicate values more tightly clustered near the mean.
Table 6.
Pack history variable descriptive statistic.
The quantiles further characterize the distribution: the minimum value is 1, the 25th percentile is 20, the median (50th percentile) is 36, the 75th percentile is 54, and the maximum value reaches 109. These quantiles provide a detailed understanding of how pack history varies across individuals, with most participants falling below 54 pack years, while a few have substantially higher values.
Figure 7 presents the density plot of the SGRQ scores, providing a clear visualization of health-related quality of life among individuals with chronic respiratory conditions. The distribution is slightly skewed toward the lower-to-moderate score range, indicating that a substantial portion of the study population experiences a moderate level of symptom burden and activity limitation. This visualization enables clinicians to quickly identify typical score ranges and detect potential outliers or clusters of patients with greater impairment.
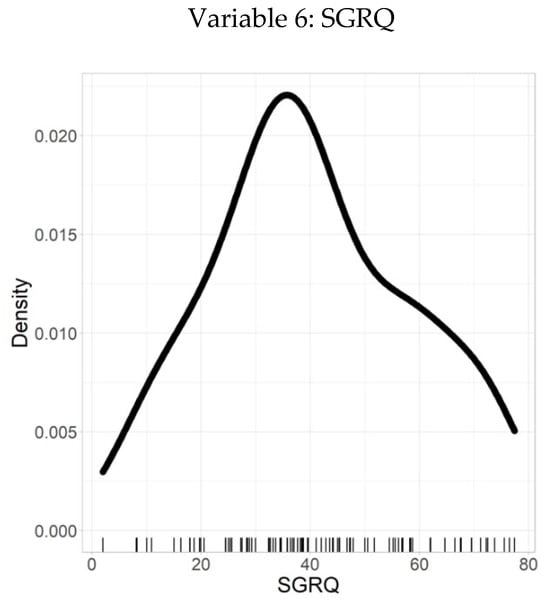
Figure 7.
Density plot–SGRQ.
Supporting these observations, Table 7 details the descriptive statistics relating to the SGRQ scores and their distribution. The dataset demonstrates 100% validity, with no missing or inconsistent values, reinforcing its reliability. The mean SGRQ score is 40.2, representing the average health-related quality of life within the cohort. The SD of 18.1 reflects the variability in individual scores, with a larger SD indicating a wider spread of values around the mean.
Table 7.
Probability distribution of values.
Further insight is provided by the quantiles: the minimum score is 2, the 25th percentile is 28.4, the median (50th percentile) is 38.2, the 75th percentile is 55.2, and the maximum score reaches 77.4. These quantiles offer a comprehensive understanding of how SGRQ scores are distributed, highlighting that most individuals fall within the moderate range, with some experiencing higher symptom severity.
In conclusion, the dataset is of high quality, with no missing values, and provides valuable information regarding the relationship between density and quality of life as measured by the SGRQ. The mean and standard deviation offer a clear understanding of the central tendency and variability of the data, while the quantiles further describe its distribution.
It is evident that each of the six variables approximately follows a normal distribution with only slight skewness. The normal density function shown below represents the probability density function of a normal distribution:
5. Results and Analysis
During the development phase, the established model was initially evaluated using the four levels of COPD severity defined by the GOLD classification system. However, due to the limited number of records available for certain GOLD stages, the multi-class classification approach demonstrated suboptimal performance on this dataset. This limitation primarily stemmed from pronounced class imbalance, where some severity stages had substantially fewer instances than others. Such imbalance can bias the model towards predicting the more prevalent classes, thereby reducing predictive reliability and generalizability across all categories.
To address these challenges, the GOLD stages were reclassified into two clinically meaningful severity groups—mild-to-moderate and severe-to-very-severe—as detailed in Table 8. This binary stratification aligns with established clinical practice and improves model stability and interpretability while mitigating the effects of class imbalance. This approach is supported by previous COPD management guidelines that emphasize the clinical relevance of simplified classifications for prognosis and treatment decisions [38]. By simplifying the classification task, the model achieves more reliable predictions of COPD severity that are directly applicable to clinical decision-making.
Table 8.
GOLD stages for COPD severity values.
Subsequently, the dataset was partitioned into a training set comprising 70% of the records and a testing set comprising the remaining 30%. This split was employed to develop and evaluate the binary classification model effectively.
GLM was developed using the logit link function. The model had a residual deviance of 2.663 × 10⁻⁷ and 69 degrees of freedom. The estimated coefficient values for the predictors used in the GLM are presented in Table 9.
Table 9.
Coefficient values for dataset GLM.
Based on these coefficients, the regression equation is expressed as follows:
ηi = 5402.416 − 39.548 × AGE − 14.406 × PackHistory − 1.516 × MWT1Best − 1459.890 × FEV1 − 244.128 × FVC + 1567.497 × gender1 + 179.916 × smoking2 + 655.898 × hypertension1
In this equation, β0, β1, ..., β11 represent the intercept and coefficients associated with each independent variable listed in the table.
In addition to estimating the coefficients, 95% confidence intervals were computed for each predictor to quantify the uncertainty around these estimates. These intervals provide a range within which the true value of each coefficient is likely to fall, offering greater transparency and robustness in interpreting the influence of individual predictors.
Following the 70/30 split, the model achieved a predictive accuracy of 86.7%. This level of accuracy highlights the influence of each independent variable on the dependent variable, namely COPD severity. Among the predictors, Gender1, representing males, was found to significantly influence the model, while Gender0, representing females, had a coefficient value of zero. Similarly, the predictor Smoking2, indicative of individuals who smoke, contributed to the model, whereas Smoking1, denoting non-smokers, did not. This suggests that smoking history plays a critical role only when the individual is a smoker. Additionally, the variable Hypertension1, representing the presence of a hypertension diagnosis, affected the model, while a value of zero had no effect.
The relative information value of the model was assessed using the AIC. AIC is based on the maximum likelihood estimate, which quantifies the likelihood of the observed data given the model parameters. The formula used to compute AIC is as follows:
Here, L denotes the maximum value of the likelihood function, and K represents the number of parameters in the model. The log-likelihood is calculated as the sum of the natural logarithms of the predicted probabilities for the observed values. For illustrative purposes, K is assumed to be 2. Therefore, a model with one independent variable would have an AIC value of 3, and a model with two variables would yield a value of 4.
The AIC is a fundamental metric for comparing competing models. A difference in more than two AIC units between models generally indicates that one model offers a substantially better fit. In this study, ten different AIC-based models were developed, each demonstrating satisfactory performance. To ensure meaningful comparisons, AIC scores must be evaluated across models trained on the same dataset.
6. Relationship Among Variables in the Dataset
To evaluate the relationships between continuous variables in the dataset, the cor() function was utilized in R. This function accepts input in the form of a matrix or data frame and outputs a correlation matrix. The computed correlations between all continuous variables are illustrated in Figure 8 and detailed in Table 10.
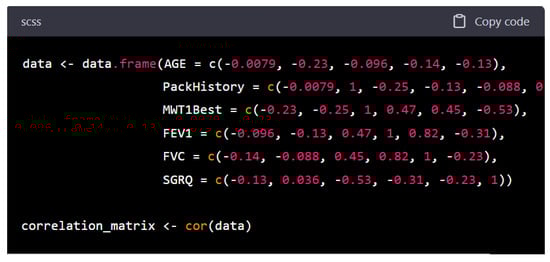
Figure 8.
COPD factors correlation matrix.
Table 10.
Correlation for the dataset.
Figure 8 and Table 10 together illustrate the interrelationships among key clinical and functional variables relevant to COPD. Figure 7 visually depicts the strength and direction of correlations using a matrix format, while Table 10 provides the exact Pearson correlation coefficients, enabling more precise interpretation.
A key observation is the limited role of AGE and PackHistory, which show weak and mostly negative correlations with other variables. While both are traditional risk factors for COPD, their weak linear associations with functional outcomes, like lung function (FEV1, FVC) and exercise tolerance (MWT1Best), suggest that once the disease is established, these variables may not directly reflect the severity of current physiological impairment.
In contrast, MWT1Best, a measure of exercise capacity shows moderate positive correlations with FEV1 (r = 0.47) and FVC (r = 0.45). This finding supports the notion that patients with better-preserved lung function tend to have higher physical performance. More notably, MWT1Best is moderately negatively correlated with SGRQ (r = −0.53), indicating that reduced symptom burden and better health-related quality of life are associated with greater functional capacity. This highlights MWT1Best as a potentially integrative marker of overall disease impact, spanning both objective and subjective domains.
FEV1 and FVC show a strong positive correlation (r = 0.82), consistent with their shared physiological basis as indicators of pulmonary function. This relationship is further visualized in Figure 9, where the linear association is evident. FEV1 also correlates positively with MWT1Best and negatively with SGRQ (r = −0.31), suggesting that lung function is not only linked to physical capacity but also to patients’ perceived health status.
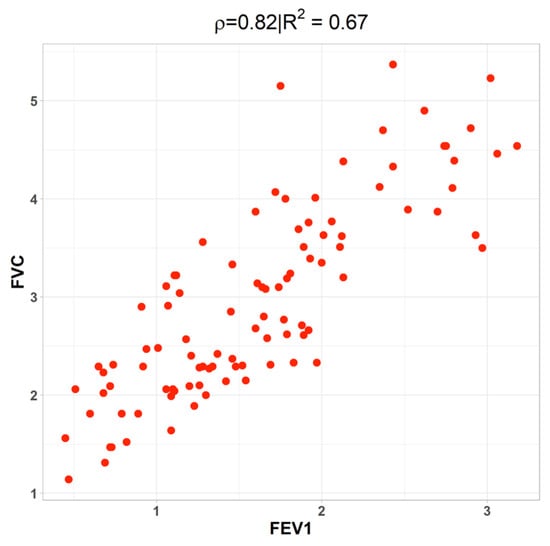
Figure 9.
The connection between FEV1 and FVC as measured by correlation.
Interestingly, SGRQ is negatively correlated with all functional variables (FEV1, FVC, MWT1Best), reinforcing its role as a subjective measure that captures the overall burden of disease as experienced by patients. Lower SGRQ scores (indicating better health status) are associated with better lung function and greater walking distance, emphasizing the interplay between objective and subjective disease dimensions.
A closer examination of FEV1 reveals moderate positive associations with MWT1Best and AGE, a weak negative correlation with PackHistory, and a strong positive correlation with FVC. This strong relationship is visualized in Figure 9, which depicts a scatter plot demonstrating the linear association between FEV1 and FVC.
Establishing the correlation between FEV1 and FVC is particularly important, as FEV1, the forced expiratory volume in one second, is a critical measure of pulmonary function and is expected to be associated with FVC. These measures collectively reflect the volume of air a patient can forcefully exhale, making their interdependence clinically and statistically relevant.
To further assess the strength of relationships and independence among variables, Pearson’s chi-square test was applied. The chi-square statistic was calculated using the following formula:
where Oi represents observed frequencies and Ei the expected frequencies.
The chi-square test results revealed several statistically significant associations:
- AGE and PackHistory: χ2 = 1056.7, df = 980, p = 0.04418;
- PackHistory and MWT1Best: χ2 = 2107.8, df = 1925, p = 0.002065;
- PackHistory and FVC: χ2 = 2232.2, df = 2100, p = 0.02226;
- PackHistory and SGRQ (quality of life): χ2 = 2450, df = 2240, p = 0.001128;
- MWT1Best and SGRQ: χ2 = 3850, df = 3520, p = 6.557 × 10⁻⁵;
- FVC and SGRQ: χ2 = 4200, df = 3840, p = 3.253 × 10⁻⁵.
7. Discussion
7.1. Clinical Applicability
These findings support the integrative role of clinical variables such as smoking history, walking ability, lung function, and quality of life in the context of COPD assessment. The use of both correlation matrices and chi-square tests provides a comprehensive statistical foundation, which is visually and numerically presented in Figure 7 and Figure 8 and Table 10, directly supporting the analytical conclusions of the study.
The overarching objective of this study was to develop a predictive framework for stratifying COPD severity that is not only methodologically sound but also translatable to routine clinical practice. The use of GLMs was motivated by their inherent interpretability, statistical robustness, and compatibility with structured clinical data. Unlike more opaque machine learning algorithms, GLMs yield coefficients that are directly interpretable, facilitating their integration into evidence-based decision-making processes.
To operationalize this framework in clinical environments, the model is envisioned to be embedded within a digital decision-support tool—such as a web-based platform or a mobile application. Such an interface would enable clinicians to input patient-specific covariates (e.g., age, FEV1, pack-year history, six-minute walk distance, smoking status) and obtain real-time estimates of COPD severity. This would obviate the need for manual computation and streamline risk assessment workflows in outpatient and primary care settings.
From a clinical management perspective, identifying patients at elevated risk of transitioning to more severe stages of COPD enables earlier intervention. Physicians can leverage the model’s predictions to initiate intensified treatment regimens, optimize pulmonary rehabilitation strategies, or recommend targeted lifestyle modifications. By integrating predictive analytics into routine assessment protocols, healthcare providers are better equipped to anticipate disease progression and tailor management accordingly.
7.2. Limitations
While the proposed framework demonstrates favorable predictive performance, several limitations merit consideration. First, the dataset employed was relatively small and institution-specific, which may constrain the external validity of the model. Although internal validation was performed via a stratified train–test split and considered cross-validation strategies, independent validation using larger, heterogeneous, and multi-center cohorts is essential to confirm generalizability.
Second, the evaluation metrics employed, namely AIC and overall accuracy, provide an initial assessment of model performance but do not fully capture clinical discriminability. Future work should incorporate complementary performance metrics such as sensitivity, specificity, area under the receiver operating characteristic curve (AUC-ROC), F1 score, and precision–recall analysis to more comprehensively evaluate clinical utility.
Lastly, the model assumes linear relationships between covariates and the outcome, which may oversimplify the underlying biological and clinical complexity of COPD. However, the current GLM framework cannot fully capture nonlinear relationships, temporal progression, and latent confounders. Parametric studies will be crucial in future research to systematically evaluate the sensitivity and robustness of model parameters, identify key thresholds, and enhance personalized risk stratification. These analyses will enable the development of more flexible predictive models that better align with the complex clinical course of COPD.
8. Conclusions and Future Work
This study introduces an interpretable regression-based framework for predicting the severity stages of COPD using GLMs. The model leverages clinically relevant covariates, including age, gender, FEV1, pack-year smoking history, six-minute walking distance, and comorbidities to yield a statistically grounded and transparent estimation of disease severity. The approach achieved a predictive accuracy of 86.7%, underscoring its potential utility as a clinically viable decision-support tool. The emphasis on model interpretability addresses a key barrier to the adoption of data-driven approaches in healthcare by aligning statistical outputs with clinical reasoning.
In future work, several enhancements are planned to extend the applicability and robustness of the proposed framework. First, the model will undergo external validation using larger, multi-institutional datasets to assess generalizability across diverse patient populations. Second, advanced machine learning models such as Random Forests and XGBoost will be explored to capture nonlinear effects and potential higher-order interactions. These models will be augmented with explainable artificial intelligence (XAI) techniques, such as SHAP or LIME, to preserve transparency in clinical interpretation. Additionally, parametric studies will be conducted to systematically evaluate the sensitivity and robustness of model parameters, identify critical thresholds, and enhance personalized risk stratification. These analyses are expected to address the limitations of the current linear modeling framework and improve predictive accuracy by better capturing the complex, nonlinear dynamics of COPD progression.
Third, and most crucially from a translational standpoint, a digital interface will be developed to facilitate the practical deployment of the model. This platform will be designed to support real-time input of patient data and immediate risk stratification, enabling point-of-care application by physicians. Such a tool has the potential to enhance early detection of disease progression, inform individualized treatment planning, and ultimately improve long-term patient outcomes in COPD management.
Author Contributions
Conceptualization, M.S.S.; Methodology, L.S.; Software, L.S.; Validation, L.S.; Formal analysis, L.S.; and H.A.; Resources, M.S.S.; Data curation, H.A.; Writing—original draft, L.S.; Writing—review & editing, H.A. and M.S.S.; Visualization, H.A.; Supervision, M.S.S. All authors have read and agreed to the published version of the manuscript.
Funding
This research received no external funding.
Data Availability Statement
The data used to support the findings of this study is available upon request from the first author.
Conflicts of Interest
The authors declare no conflict of interest.
References
- Srivastava, A.; Jain, S.; Miranda, R.; Patil, S.; Pandya, S.; Kotecha, K. Deep learning based respiratory sound analysis for detection of chronic obstructive pulmonary disease. PeerJ Comput. Sci. 2021, 7, e369. [Google Scholar] [CrossRef] [PubMed]
- Jung, T.; Vij, N. Early diagnosis and real-time monitoring of regional lung function changes to prevent chronic obstructive pulmonary disease progression to severe emphysema. J. Clin. Med. 2021, 10, 5811. [Google Scholar] [CrossRef] [PubMed]
- Liu, J.; Ran, Z.; Wang, F.; Xin, C.; Xiong, B.; Song, Z. Role of pulmonary microorganisms in the development of chronic obstructive pulmonary disease. Crit. Rev. Microbiol. 2021, 47, 1–12. [Google Scholar] [CrossRef]
- Song, S.; Xue, X.; Zhao, Y.C.; Li, J.; Zhu, Q.; Zhao, M. Short-video apps as a health information source for chronic obstructive pulmonary disease: Information quality assessment of TikTok videos. J. Med. Internet Res. 2021, 23, e28318. [Google Scholar] [CrossRef]
- Battineni, G.; Sagaro, G.G.; Chinatalapudi, N.; Amenta, F. Applications of machine learning predictive models in the chronic disease diagnosis. J. Pers. Med. 2020, 10, 21. [Google Scholar] [CrossRef] [PubMed]
- Fernández, A.D.R.; Fernández, D.R.; Iglesias, V.G.; Jorquera, D.M. Analyzing the use of artificial intelligence for the management of chronic obstructive pulmonary disease (COPD). Int. J. Med. Inform. 2022, 158, 104640. [Google Scholar] [CrossRef]
- Sidhaye, V.K.; Nishida, K.; Martinez, F.J. Precision medicine in COPD: Where are we and where do we need to go? Eur. Respir. Rev. 2018, 27, 180022. [Google Scholar] [CrossRef]
- Agustí, A.; Faner, R. COPD beyond smoking: New paradigm, novel opportunities. Lancet Respir. Med. 2018, 6, 324–326. [Google Scholar] [CrossRef]
- Lin, H.; Qian, Z.; Guo, Y.; Zheng, Y.; Ai, S.; Hang, J.; Wang, X.; Zhang, L.; Liu, T.; Guan, W.; et al. The attributable risk of chronic obstructive pulmonary disease due to ambient fine particulate pollution among older adults. Environ. Int. 2018, 113, 143–148. [Google Scholar] [CrossRef]
- Koul, A.; Bawa, R.K.; Kumar, Y. Artificial intelligence in medical image processing for airway diseases. In Connected e-Health: Integrated IoT and Cloud Computing; Springer: Berlin/Heidelberg, Germany, 2022; pp. 217–254. [Google Scholar]
- Schuster, A.K.; Erb, C.; Hoffmann, E.M.; Dietlein, T.; Pfeiffer, N. The diagnosis and treatment of glaucoma. Dtsch. Ärzteblatt Int. 2020, 117, 225. [Google Scholar] [CrossRef]
- Jarhyan, P.; Hutchinson, A.; Khaw, D.; Prabhakaran, D.; Mohan, S. Prevalence of chronic obstructive pulmonary disease and chronic bronchitis in eight countries: A systematic review and meta-analysis. Bull. World Health Organ. 2022, 100, 216. [Google Scholar] [CrossRef]
- Badulescu, D.; Simut, R.; Badulescu, A.; Badulescu, A.-V. The relative effects of economic growth, environmental pollution and non-communicable diseases on health expenditures in European Union countries. Int. J. Environ. Res. Public Health 2019, 16, 5115. [Google Scholar] [CrossRef] [PubMed]
- Dhanaraj, R.K.; Rajkumar, K.; Hariharan, U. Enterprise IoT modeling: Supervised, unsupervised, and reinforcement learning. In Business Intelligence for Enterprise Internet of Things; Springer: Cham, Switzerland, 2020; pp. 55–79. [Google Scholar]
- Saravanan, R.; Sujatha, P. A state of art techniques on machine learning algorithms: A perspective of supervised learning approaches in data classification. In Proceedings of the 2018 Second International Conference on Intelligent Computing and Control Systems (ICICCS), Madurai, India, 14–15 June 2018; IEEE: Piscataway, NJ, USA, 2018. [Google Scholar]
- de Souza Nascimento, E.; Ahmed, I.; Oliveira, E.; Palheta, M.P.; Steinmacher, I.; Conte, T. Understanding development process of machine learning systems: Challenges and solutions. In Proceedings of the 2019 ACM/IEEE International Symposium on Empirical Software Engineering and Measurement (ESEM), Porto de Galinhas, Brazil, 19–20 September 2019; IEEE: Piscataway, NJ, USA, 2019. [Google Scholar]
- Cao, L. Data science: A comprehensive overview. ACM Comput. Surv. (CSUR) 2017, 50, 1–42. [Google Scholar]
- Perlmutter, D.H. Alpha-1 antitrypsin deficiency. In Schiff’s Diseases of the Liver; John Wiley & Sons Ltd.: Hoboken, NJ, USA, 2017; pp. 843–866. [Google Scholar]
- Moll, M.; Qiao, D.; Regan, E.A.; Hunninghake, G.M.; Make, B.J.; Tal-Singer, R.; McGeachie, M.; Castaldi, P.J.; Estepar, R.S.J.; Washko, G.R.; et al. Machine learning and prediction of all-cause mortality in COPD. Chest 2020, 158, 952–964. [Google Scholar] [CrossRef] [PubMed]
- Chaieb, S.; Mrad, A.B.; Hnich, B. From personal observations to recommendation of tailored interventions based on causal reasoning: A case study of falls prevention in elderly patients. Int. J. Med. Inform. 2022, 163, 104765. [Google Scholar] [CrossRef] [PubMed]
- Morales, D.R.; Flynn, R.; Zhang, J.; Trucco, E.; Quint, J.K.; Zutis, K. External validation of ADO, DOSE, COTE and CODEX at predicting death in primary care patients with COPD using standard and machine learning approaches. Respir. Med. 2018, 138, 150–155. [Google Scholar] [CrossRef]
- Bunnell, B.E.; Barrera, J.F.; Paige, S.R.; Turner, D.; Welch, B.M. Acceptability of telemedicine features to promote its uptake in practice: A survey of community telemental health providers. Int. J. Environ. Res. Public Health 2020, 17, 8525. [Google Scholar] [CrossRef]
- Baumes, A.; Čolić, M.; Araiba, S. Comparison of telehealth-related ethics and guidelines and a checklist for ethical decision making in the midst of the COVID-19 pandemic. Behav. Anal. Pract. 2020, 13, 736–747. [Google Scholar] [CrossRef]
- Goto, T.; Camargo, C.A., Jr.; Faridi, M.K.; Yun, B.J.; Hasegawa, K. Machine learning approaches for predicting disposition of asthma and COPD exacerbations in the ED. Am. J. Emerg. Med. 2018, 36, 1650–1654. [Google Scholar] [CrossRef]
- Amaral, J.L.; Lopes, A.J.; Faria, A.C.; Melo, P.L. Machine learning algorithms and forced oscillation measurements to categorise the airway obstruction severity in chronic obstructive pulmonary disease. Comput. Methods Programs Biomed. 2015, 118, 186–197. [Google Scholar] [CrossRef]
- Bing, Z.; Lemke, C.; Cheng, L.; Huang, K.; Knoll, A. Energy-efficient and damage-recovery slithering gait design for a snake-like robot based on reinforcement learning and inverse reinforcement learning. Neural Netw. 2020, 129, 323–333. [Google Scholar] [CrossRef] [PubMed]
- Hao, X.; Wang, R.; Guo, Y.; Xiao, Y.; Yu, M.; Wang, M.; Chen, W.; Zhang, D. Multimodal Self-Paced Locality-Preserving Learning for Diagnosis of Alzheimer’s Disease. IEEE Trans. Cogn. Dev. Syst. 2023, 15, 832–843. [Google Scholar] [CrossRef]
- Deng, R.; Chen, Z.M.; Chen, H.; Hu, J. Learning to refine object boundaries. Neurocomputing 2023, 557, 126742. [Google Scholar] [CrossRef]
- Bodduluri, S.; Newell, J.D.; Hoffman, E.A.; Reinhardt, J.M. Registration-based lung mechanical analysis of chronic obstructive pulmonary disease (COPD) using a supervised machine learning framework. Acad. Radiol. 2013, 20, 527–536. [Google Scholar] [CrossRef] [PubMed]
- Stieler, F.; Rabe, F.; Bauer, B. Towards domain-specific explainable ai: Model interpretation of a skin image classifier using a human approach. In Proceedings of the IEEE/CVF Conference on Computer Vision and Pattern Recognition, Nashville, TN, USA, 20–25 June 2021. [Google Scholar]
- Vilone, G.; Longo, L. Notions of explainability and evaluation approaches for explainable artificial intelligence. Inf. Fusion 2021, 76, 89–106. [Google Scholar] [CrossRef]
- Nabulsi, Z.; Sellergren, A.; Jamshy, S.; Lau, C.; Santos, E.; Kiraly, A.P.; Ye, W.; Yang, J.; Pilgrim, R.; Kazemzadeh, S.; et al. Deep learning for distinguishing normal versus abnormal chest radiographs and generalization to two unseen diseases tuberculosis and COVID-19. Sci. Rep. 2021, 11, 15523. [Google Scholar] [CrossRef]
- Liu, J.; Takanobu, R.; Wen, J.; Wan, D.; Li, H.; Nie, W.; Li, C.; Peng, W.; Huang, M. Robustness testing of language understanding in task-oriented dialog. arXiv 2020, arXiv:2012.15262. [Google Scholar]
- Sahoo, K.; Samal, A.K.; Pramanik, J.; Pani, S.K. Exploratory data analysis using Python. Int. J. Innov. Technol. Explor. Eng. (IJITEE) 2019, 8, 2019. [Google Scholar] [CrossRef]
- Das, N.; Topalovic, M.; Janssens, W. Artificial intelligence in diagnosis of obstructive lung disease: Current status and future potential. Curr. Opin. Pulm. Med. 2018, 24, 117–123. [Google Scholar] [CrossRef]
- Haass, M.; Kitzman, D.W.; Anand, I.S.; Miller, A.; Zile, M.R.; Massie, B.M.; Carson, P.E. Body mass index and adverse cardiovascular outcomes in heart failure patients with preserved ejection fraction: Results from the Irbesartan in Heart Failure with Preserved Ejection Fraction (I-PRESERVE) trial. Circ. Heart Fail. 2011, 4, 324–331. [Google Scholar] [CrossRef] [PubMed]
- Luo, L.; Li, J.; Lian, S.; Zeng, X.; Sun, L.; Li, C.; Huang, D.; Zhang, W. Using machine learning approaches to predict high-cost chronic obstructive pulmonary disease patients in China. Health Inform. J. 2020, 26, 1577–1598. [Google Scholar] [CrossRef] [PubMed]
- Rabe, K.F.; Hurd, S.S.; Anzueto, A.; Barnes, P.J.; Buist, S.; Calverley, P.M.A.; Fukuchi, Y.; Jenkins, C.; Rodríguez-Roisín, R.; van Weel, C.; et al. Global strategy for the diagnosis, management, and prevention of chronic obstructive pulmonary disease: GOLD executive summary. Am. J. Respir. Crit. Care Med. 2007, 176, 532–555. [Google Scholar] [CrossRef] [PubMed]
Disclaimer/Publisher’s Note: The statements, opinions and data contained in all publications are solely those of the individual author(s) and contributor(s) and not of MDPI and/or the editor(s). MDPI and/or the editor(s) disclaim responsibility for any injury to people or property resulting from any ideas, methods, instructions or products referred to in the content. |
© 2025 by the authors. Licensee MDPI, Basel, Switzerland. This article is an open access article distributed under the terms and conditions of the Creative Commons Attribution (CC BY) license (https://creativecommons.org/licenses/by/4.0/).