Article

Levelized Cost of Energy (LCOE) of Different Photovoltaic Technologies

by
Maria Cristea
*,
Ciprian Cristea
,
Radu-Adrian Tîrnovan
and
Florica Mioara Șerban
Faculty of Electrical Engineering, Technical University of Cluj-Napoca, 26–28 G. Barițiu Street, 400027 Cluj-Napoca, Romania
*
Author to whom correspondence should be addressed.
Appl. Sci. 2025, 15(12), 6710; https://doi.org/10.3390/app15126710
Submission received: 14 May 2025 / Revised: 5 June 2025 / Accepted: 11 June 2025 / Published: 15 June 2025
(This article belongs to the Topic Clean Energy Technologies and Assessment, 2nd Edition)

Abstract

Renewable energy sources are critical to the global effort to achieve carbon neutrality. Alongside hydropower, wind and nuclear plants, the photovoltaic (PV) systems developed greatly, with new PV technologies emerging in recent years. Although the conversion efficiencies are improving and the materials used have a lower impact on the environment, the feasibility of these technologies is required to be assessed. This paper proposes a levelized cost of energy (LCOE) model to assess the feasibility of five PV technologies: high-efficiency silicon heterojunction cells (HJT), N-type monocrystalline silicon cells (N-type), P-type passivated emitter and rear contact cells (PERC), N-type tunnel oxide passivated contact cells (TOPCon) and bifacial TOPCon. The LCOE considers capital investment, government incentives, operation and maintenance costs, residual value of PV modules and total energy output during the PV system’s life span. To determine the influence of PV system’s capacity over the LCOE values, three systems are analyzed for each technology: 3 kW, 5 kW and 7 kW. The results show that the largest PV systems have the lowest LCOE values, ranging from 2.39 c€/kWh (TOPCon) to 2.92 c€/kWh (HJT) when incentives are accessed, and ranging from 6.05 c€/kWh (TOPCon) to 6.51 c€/kWh (HJT) without subsidies. The 3 kW and 5 kW PV systems have higher LCOE values due to lower energy output during lifetime.

1. Introduction

Renewable energy sources are an undisputed necessity towards low-carbon economic growth and a net-zero emissions transition [1]. The share of renewable energy sources in global energy production has increased in the last ten years, from 22.1% in 2014 to 32.1% in 2024 [2], as shown in Figure 1. In this period, renewable hydropower is the main source of clean electricity, ranging from 16% to 14%, with a slight decrease in the last years. Even though wind and solar photovoltaic (PV) power sources had a small share in 2014, 3% and 1%, they highly developed until 2024, producing over 8% and 7% of the total energy provided by renewable energy sources [2].
The International Energy Agency (IEA) predicts that by the end of 2030 more than 45% of the global electricity will be produced by renewable energy sources. Moreover, wind and solar PV power sources will have a share of 13.4%, respectively 16% of the total energy production, while hydropower source will slightly decrease its share to 13.1%. The other renewables, including bioenergy and geothermal energy will remain unchanged, with a share around 3% [2].
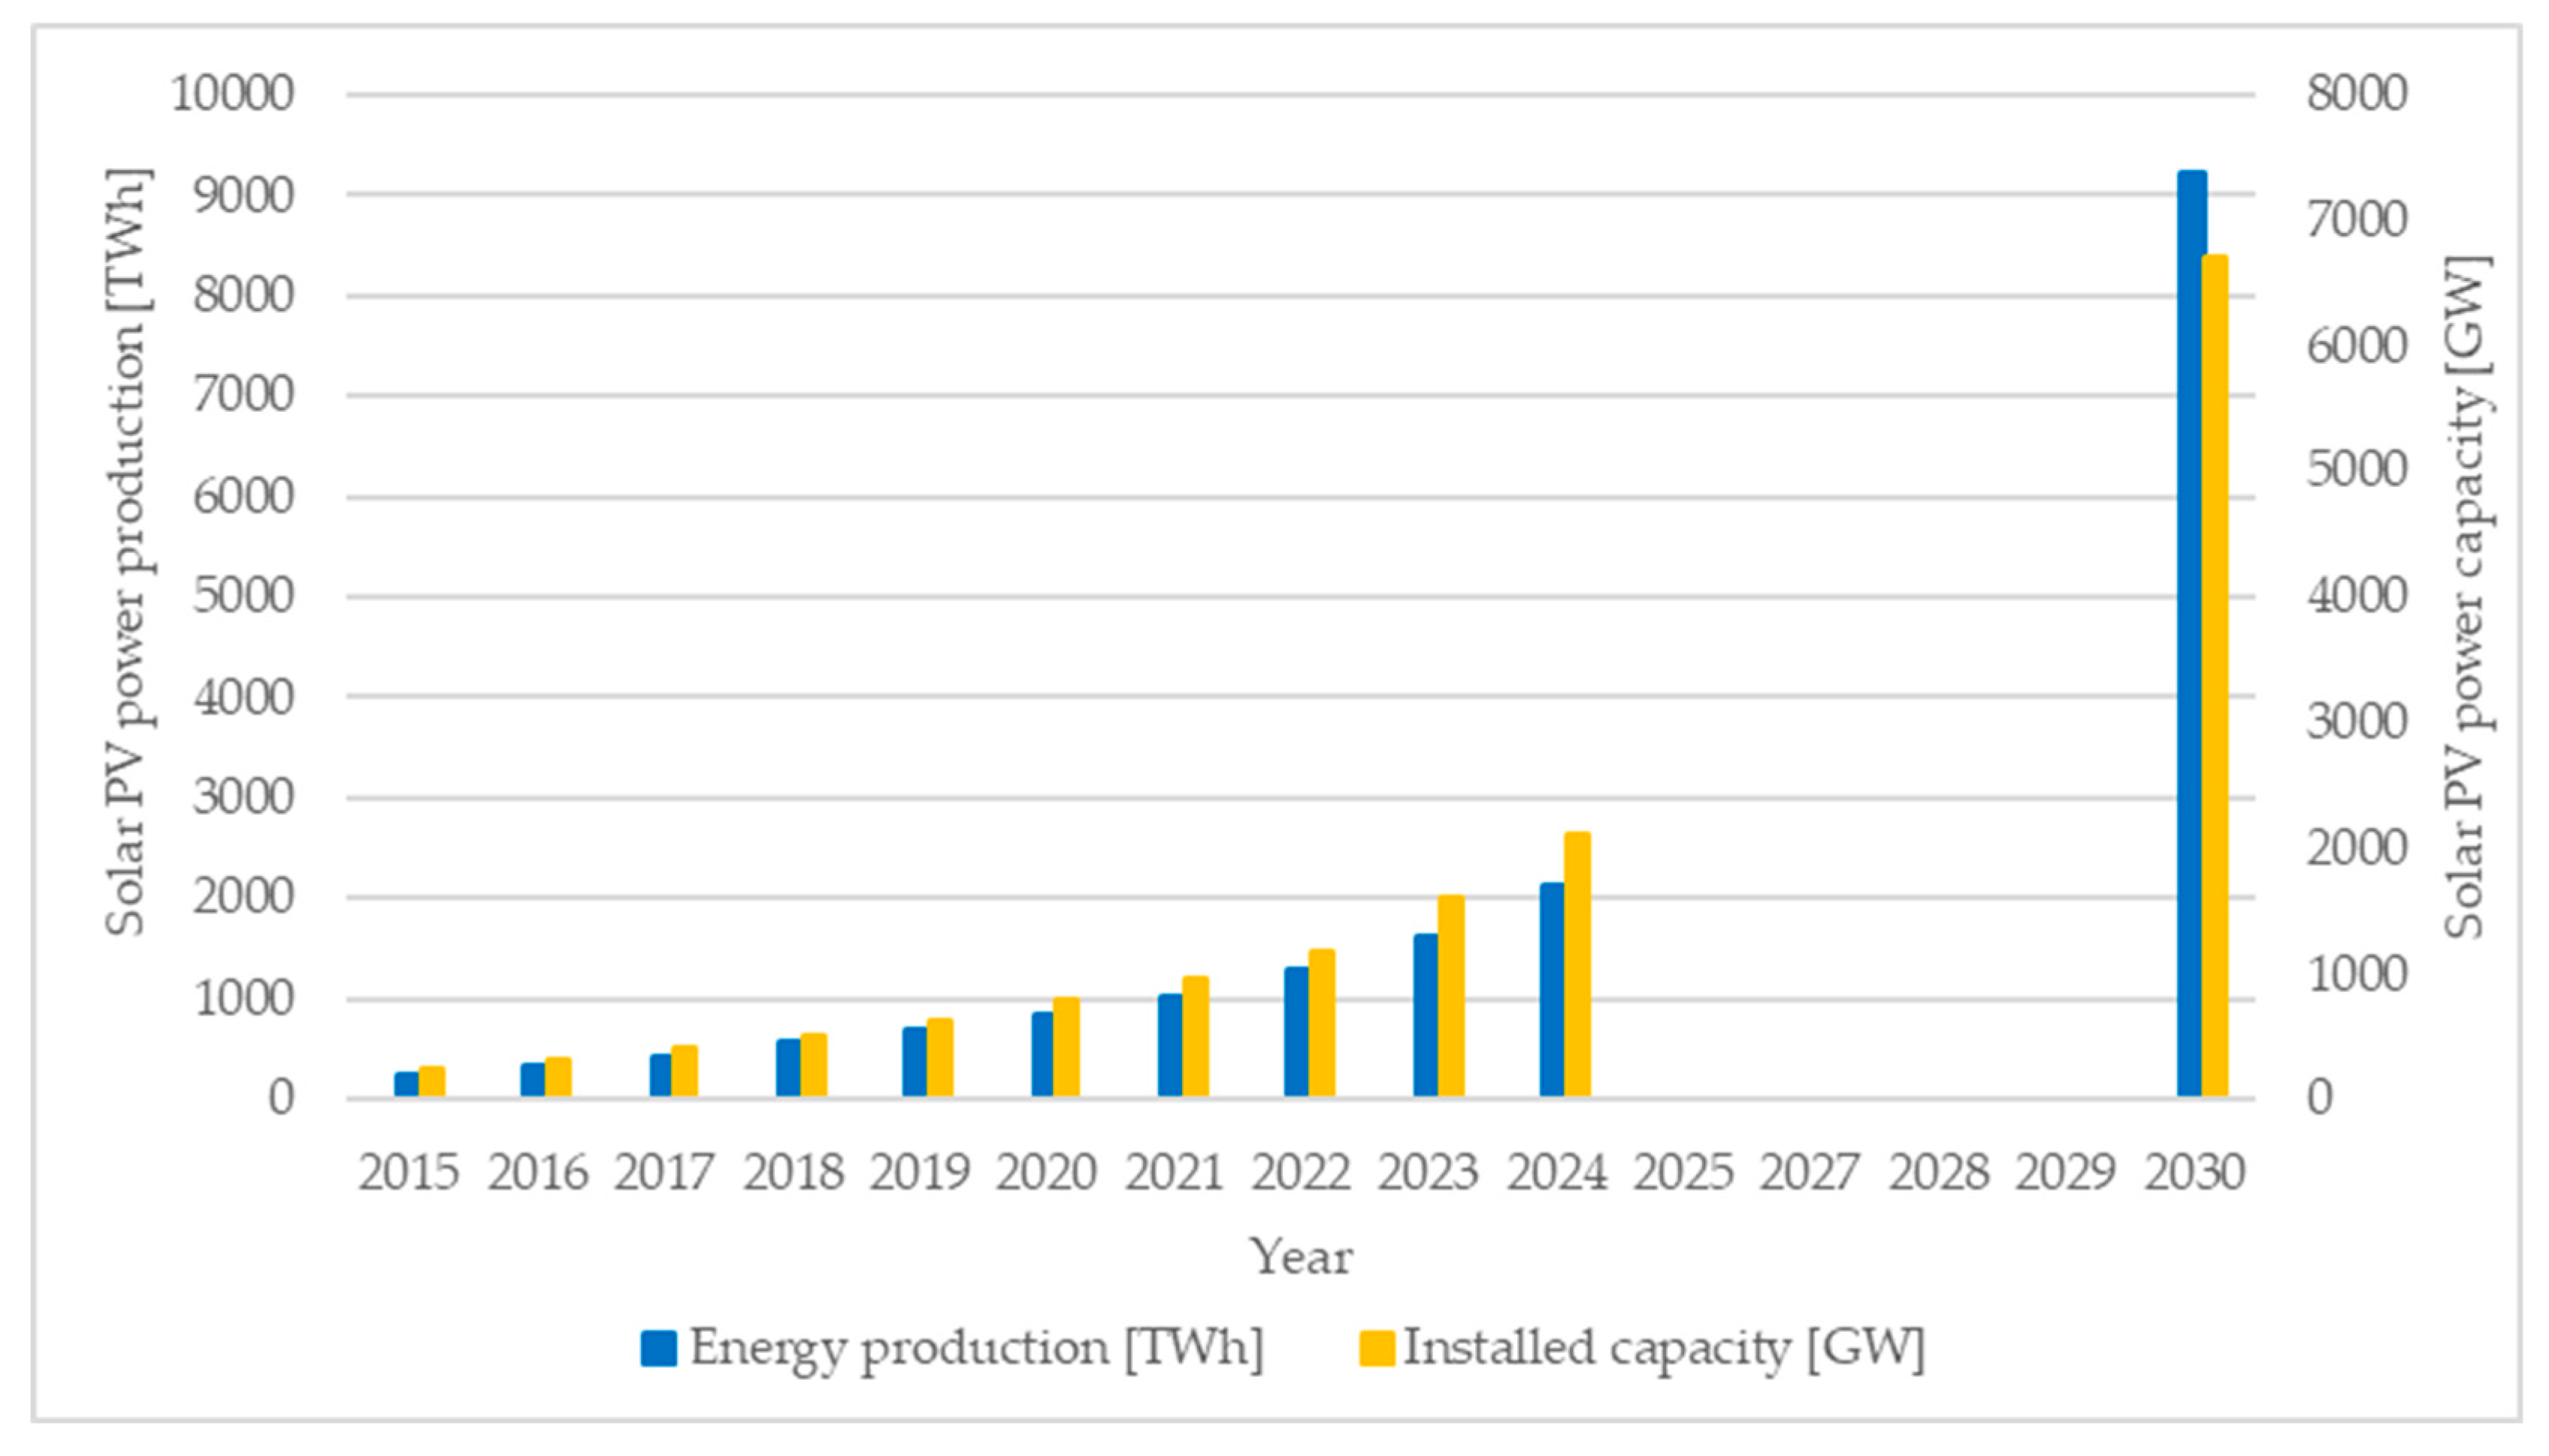
Thus, solar PV power is set to become the largest renewable energy source by 2030 in the Net Zero Emissions (NZE) Scenario by 2050. With an increase in energy production of around 25% in 2023 compared to the previous year, solar PV power begun the acceleration towards the 2030 objective of approximately 9200 TWh, as presented in Figure 2. The global installed capacity in solar PV power increased from 1177 GW in 2022, to 1603 GW in 2023 and 2105 GW in 2024, paving the way to achieve 6700 GW by 2030 in an NZE Scenario [2].
This continuous increase in installed capacity of solar PV power is supported by a decrease in global PV modules and additional equipment prices, incentives granted by the authorities and technology development, emerging new and more efficient designs [2]. The financial feasibility of these designs should be determined to maintain the competitive cost advantage of PV systems. Different methods have been used to evaluate the economic efficiency of PV systems, like Life Cycle Assessment and Life Cycle Costing [3], Simple Payback Period and Levelized Cost of Energy (LCOE) [4], LCOE, Net present Value and Investment Payback Period [5], LCOE and Internal Rate of Return [6].
This paper assesses emerging PV module technologies by using LCOE method, which quantifies lifetime costs [€] and divides them to the cumulated energy produced by the PV system [kWh]. The LCOE model is often used to optimize the functioning of renewable energy systems [7]. Moreover, the method allows the comparison of different technologies with unequal life spans, installed power, efficiencies, capital cost and return of investment [8].
The LCOE method is used in [9] to assess two PV technologies: organic and perovskite absorber layers. The proposed model determines the LCOE values considering the losses, module cost and initial efficiency of grid-scale PV systems located in Fiji and compare them to the electricity generation from traditional sources. The obtained values for LCOE are 0.1461 $/kWh and 0.2178 $/kWh (0.13–0.19 €/kWh), at a 10% discount rate, 2.1% inflation and 25 years system lifetime. However, these values are much higher than the cost of energy generation given in Pacific Power Association report, 0.1240 $/kWh, and the small business tariff of Energy Fiji Limited of 0.1849 $/kWh.
In [10] LCOE is used to evaluate five solar photovoltaic power plants located in India, with an installed power of 1 MW, 5 MW, 10 MW, 25 MW and 151 MW, considering different parameters and their effect on LCOE like interest and inflation rates, lifetime and cumulative utilization factor. The results show that the early installed plants have a higher LCOE than the later ones, because of the decreasing cost of PV systems, which quantifies around 50% of the capital investment. Another factor that affects the LCOE is the size of the plant; the higher the capacity is, the lower the LCOE is. The obtained values for LCOE are 11.33 Rs, 6.14 Rs, 7.08 Rs, 5.76 Rs and 5.96 Rs (approximately 0.12, 0.063, 0.073, 0.059, 0.061 €/kWh) for 1 MW, 5 MW, 10 MW, 25 MW and 151 MW plants. Moreover, the LCOE increases when the inflation rate and interest rate are varied and decreases when the cumulative utilization rate increases.
Same method, but with a different approach, is addressed in [11] to evaluate with a more accurate approach the economic feasibility of 648 PV power generation projects from 30 provincial-level administrative regions in China, considering the economic performance as well as the environmental impact. The System LCOE (S-LCOE) approach integrates the balancing and grid costs into conventional LCOE framework and compares the obtained values with local desulfurized coal electricity price do determine the economic competitiveness of each region. The value of S-LCOE varies between 0.557–1.267 CNY/kWh (0.067–0.15 €/kWh), which is much higher than local desulfurized coal electricity price with values between 0.228–0.453 CNY/kWh (0.028–0.055 €/kWh), so China should put more efforts to become global cost competitive in solar technology.
A review of solar photovoltaic LCOE is presented in [12], where various systems located in North America are assessed assuming the choice of discount rate, average system cost, financing method, average system lifetime and degradation rate of PV system during lifetime. The results show that the values of LCOE for residential PV systems are estimated at 0.15–0.86 $/kWh (0.13–0.76 €/kWh), for commercial PV systems are between 0.1 and 0.5 $/kWh (0.088–0.44 €/kWh) and for utility scale PV systems are ranging from 0.062 to 0.456 $/kWh (0.055–0.04 €/kWh).
In addition to LCOE, net present value (NPV) and internal rate of return (IRR) are used in [13] to evaluate solar power plants located in South Australia and Southern California (United States). The results indicate that concentrated solar power plants have a higher LCOE, with values varying between 0.108–0.177 $/kWh (0.095–0.1 €/kWh) in South Australia and 0.138–0.192 $/kWh (0.12–0.17 €/kWh) in Southern California, while PV plants have a LCOE between 0.059–0.145 $/kWh (0.052–0.13 €/kWh) in South Australia and 0.055–0.089 $/kWh (0.049–0.079 €/kWh) in Southern California. Moreover, the solar plants specifically designed to optimize the profits lead to important differences compared to the standard LCOE approach.
This paper studies five PV module technologies, high-efficiency silicon heterojunction cells (HJT), N-type monocrystalline silicon cells (N-type), P-type passivated emitter and rear contact cells (PERC), N-type tunnel oxide passivated contact cells (TOPCon) and bifacial TOPCon, and assesses the feasibility by calculating the LCOE for 15 PV systems, located in the Northwestern Romania, with installed power of 3 kW, 5 kW and 7 kW for each technology, to determine if the capacity of the system influences the LCOE values.
This study has a different approach than others. All the technical and economic parameters were obtained by conducting a market analysis and proposes a LCOE model, which includes the standard parameters (investment costs, operational and maintenance costs) and adds the residual value of the PV system at the end of lifetime. Moreover, the cumulative energy produced by the PV system throughout its lifetime is approximated based on annual sum of global irradiation, module area, number of modules, modules and inverter yields. This approach simplifies the process of determining the LCOE for a PV system and shortens the time frame needed to obtain the results. Finally, a sensitivity analysis is conducted to assess the effect of the uncertainties on LCOE values, by fluctuating the main factors.
The rest of the paper is structured as follows: the next section presents the five PV technologies and the proposed LCOE model to determine the feasibility of each technology; the third section describes the results and shows the applicability of the proposed model; moreover, it details the obtained LCOE values for the considered 15 PV systems and compares them with the values obtained in other studies; the next section presents the sensitivity analysis results and points out the parameters with an important influence on the LCOE values; finally, in the last section the conclusions are drawn.

2. Materials and Methods

In this section, the five PV module technologies are described and compared based on their technical parameters. The data used was obtained from market analysis and over 50 module samples were studied, produced and distributed by different firms. Then, the proposed LCOE model is presented, and all the variables are explained in detail.

2.1. PV Module Technologies Description

In recent years, there have been several emerging PV technologies with higher efficiency and lower costs that dominate the mass production of PV supply chains [14]. All commercial PV module technologies reached conversion efficiencies over 20%, being used in numerous applications, including residential and commercial buildings, off-grid power and spacecraft [15].
One of those technologies is HJT, which is known for low temperature coefficient, superior open circuit voltage and reduced wafer thickness. Considering their structure, these modules have a streamlined production process, which involves fewer manufacturing operations leading to lower production costs and material usage [16].
As presented in Table 1, the efficiency of HJT technology varies between 21.6–25.6%, with a lifetime of 30 years. However, the life span can be affected by their ultraviolet (UV) irradiation and humidity sensitivity, which can worsen the annual degradation rate of HJT modules [16].
N-type technology has a conversion efficiency of 21–23.1%, and a lifetime around 25–30 years, as shown in Table 1. These characteristics are closely related to oxygen and carbon concentration and metallic impurities. An increase in oxygen content gradually decreases the lifetime of silicon material. Moreover, the metal impurities may form a recombination center which decreases the minority carrier lifetime of monocrystalline silicon. Other characteristics include low efficiency degradation, high impurity tolerance and opportunities for conversion efficiency enhancement [17].
PERC cells main feature is the back dielectric passivation with local contact openings to reduce surface recombination and increase light absorption. In recent years, PERC technology made significant progress by improving their performance, with the silicon wafer reaching over 20% efficiency in mass production, as seen in Table 1. However, to sustainably implement this technology, alternative manufacturing processes are evaluated to reduce production cost as well as enhance their conversion efficiency by over 22% and increase module power. Even though their life span reaches only 25 years, PERC modules perform better in high temperatures and low-light conditions [18].
TOPCon technology represents great interest due to their structure, since the wafer is not in direct contact with the metal. Its structure includes an ultra-thin silicon dioxide layer and a polycrystalline silicon layer, which form together a “tunnel oxide passivated contact”, facilitating efficient extraction of charge carriers and reduces recombination losses, by boosting conversion efficiency. The commercial TOPCon modules can reach an efficiency of 22.8%, while laboratory modules can achieve over 25% efficiency, which demonstrates a great advancement of passivation technology. However, there are several challenges that this technology confronts with, like high impurities concentration and defects at the semiconductor/metal interface [19].
Bifacial cells have a structure made from transparent substrates, with a front-side p-n junction and a rear-side surface with metal contacts and an emitter, which maximizes the light collection. This ensures higher efficiency [20]. Moreover, their design permits them to absorb more light from front and rear surfaces, resulting in an increased energy production. Bifacial technology is particularly useful in environments with high albedo coefficient (reflectivity), ground-mounted and rooftop systems and elevated structures [21]. Bifacial TOPCon technology can reach 23% efficiency and a lifetime of 30 years, according to Table 1.
Each presented PV module technology has its own advantages and disadvantages. By comparing their technical characteristics, it can be observed that the most efficient PV module technology is HJT, with a conversion efficiency that can reach 25.6%. It is followed by N-type and bifacial TOPCon modules, with efficiencies that are around 23%. The installed power of each module varies from around 400 W to over 700 W, depending on the application requirements.
Besides their technical specifications, the economic parameters are important in the decision-making process. The initial investment cost, operation and maintenance costs and other factors can influence the benefits of selecting a PV module technology.

2.2. Proposed LCOE Methodology

To determine the feasibility of each PV module technology, an LCOE model is proposed. The LCOE determines the price of each kWh produced by the PV system during its lifetime. The considered costs are initial investment, which is reduced by incentives (if granted by the government), yearly operation and maintenance costs and the residual value of PV modules.
The initial capital investment cost (CI) [€] is determined as the sum of the PV modules cost (CPV) [€], which differs for each PV technology and includes the value added tax and transportation costs, invertor cost (Cinv) [€] and the installation and commissioning services cost (Cs) [€], which may differ depending on the installed power of the PV system. Thus, the CI is determined using Equation (1):
C I = C P V + C i n v + C s
To reduce the value of CI, government incentives (SPV) [€] may be accessed, if granted. Most European Union countries offer incentives through governmental programs to expand the capacity of renewable energy sources, including PV systems. These grants can be up to 90% of the total costs (up to 6027 € for both PV system and battery system, at a currency conversion rate of 4.9774 RON for 1 EUR on 8 April 2025), the rest of the value must be covered by the prosumer [22].
The yearly operation and maintenance costs (OM) [€/year] are independent of PV technology but correlated with the installed power of the PV system; the larger the system is, the highest the price is. Moreover, OM are determined considering the life span of the PV system (n) [years] and are discounted considering a discount rate (i) [%].
The residual value of the PV system (Vres) [€/kg] is the estimated value at the end of its lifetime. The recycling policy in European Union countries specifies that all producers or importers are required to implement waste management techniques or contract non-profit organizations or other companies’ services to recover at least 75% (by weight) of the modules and to recycle at least 65% (by weight) of them [23]. Valuable materials may be recovered, such as silver, aluminium, silicon, copper and lead [24]. Some companies offer revenues for the PV system, which may generate additional revenue for the owner.
All these costs are summed up and then divided by the cumulated energy produced by the system during its lifetime. The yearly energy output (Wout) [kWh] is determined by mathematical calculation [25] and then is discounted by rate i, considering the life span of the PV system.
First, the solar energy captured by the PV system (Ws) [kWh/year] is determined, considering the annual sum of global irradiation (Gt) [kWh/year/m2], specific to each location, the area of the PV module (S) [m2], presented in the technical sheet provided by the producer, and the number of PV modules (nPV) [pcs] of the system, which depends on the installed power of the system. Ws is calculated with Equation (2), as follows:
W s = G t · S · n P V
Then, the direct current (DC) energy (WDC) [kWh/year] is computed considering Ws and the conversion efficiency of the PV modules (ηPV) [%], a different value for each PV technology, as in expression (3):
W D C = W s · η P V
To determine the alternative current (AC) energy (WAC) [kWh/year], the conversion efficiency of the inverter (ηinv) [%] is considered, as it can be seen in Equation (4):
W A C = W D C · η i n v
Based on the relations (2)–(4) stated above, the equation of Wout can be formulated as:
W o u t = G t · S · n P V · η P V · η i n v
Finally, considering the parameters described, LCOE can be determined with the following equation:
L C O E = C I S P V + t = 1 n O M t ( 1 + i ) t V r e s t = 1 n W o u t , t ( 1 + i ) t

3. LCOE Results and Discussion

The proposed LCOE model is used to determine the feasibility of the analyzed five PV technologies, considering 15 PV systems, with an installed power of 3 kW, 5 kW and 7 kW. Their main technical parameters are presented in the previous section. Moreover, to complete the PV systems, Huawei hybrid three phase inverters are used. For the 3 kW PV system the inverter has a power of 4 kW, with a conversion efficiency of 98.3%, for the 5 kW systems an inverter of 6 kW is used and for the 7 kW PV systems the inverter’s power is 8 kW, both with a conversion efficiency of 98.6%.
For this case study, the location of the systems is Cluj-Napoca town, situated in the Northwest region of Romania, which is one of the largest cities in the country. The Gt is around 1300 kWh/year/m2 [26], which is a medium value, according to Table 2, where Gt of the main Romanian cities is presented. These values were obtained by employing the PV*SOL Premium software, used in designing and evaluating PV systems.
The economic parameters values were obtained based on market analysis and include the value added tax (VAT) specific to Romania [27]. To identify the representative values for each PV module technology, the interquartile range (IQR) was employed. The IQR excludes the outliners and points out the values between the first and third quartile, indicating the data’ median [28]. Then the average (Avg) of IQR is computed to represent the representative values of CI, OM and SPV for each PV system. The range values, IQR and Avg are presented in Table 3.
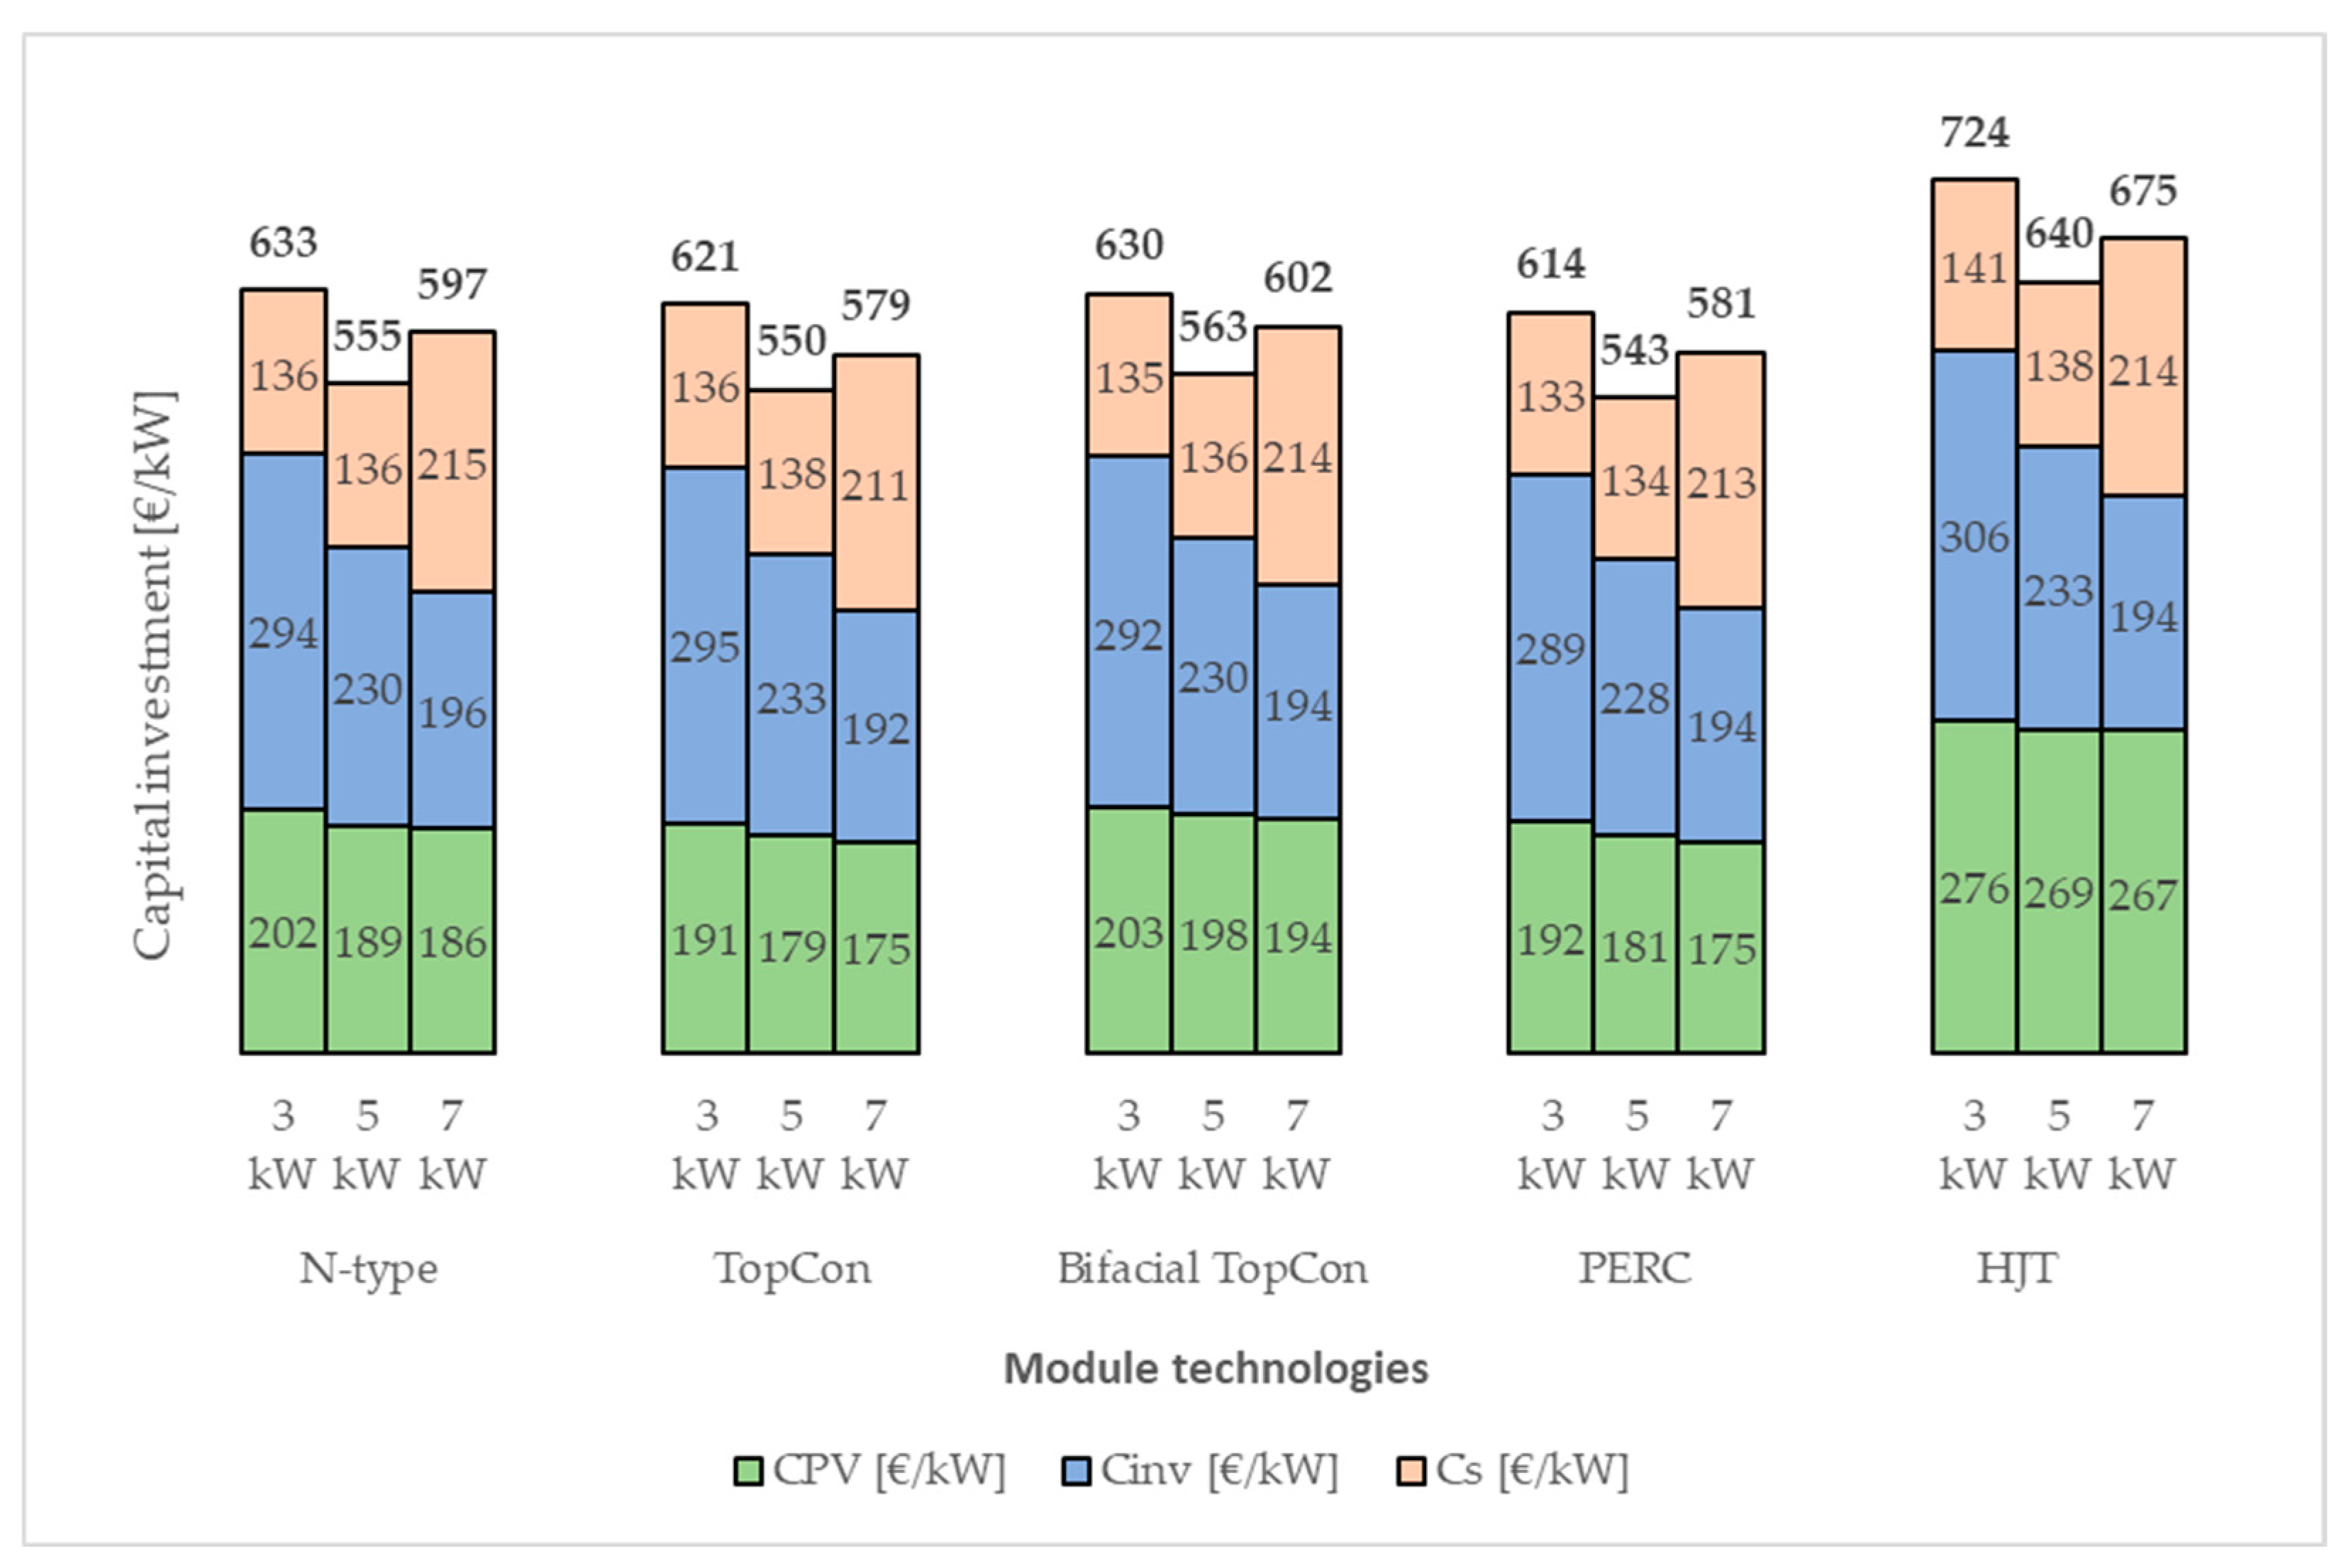
It can be observed that the CI costs depend on both PV module technology and installed power. The cost components of CI are presented in Figure 3, where the average values of CPV, Cinv, Cs for the 15 PV systems are presented.
The capital invest costs can be reduced by accessing the incentives offered by the Romanian government to promote renewable energy systems installation. The current program named “Green House 2024” is addressed to residential consumers to install rooftop PV systems with a minimum 3 kW power and a 5 kWh energy storage system by financing up to 90% of the total eligible costs (approximately 6030 €) [29]. The SPV is 4018 € for all studied PV systems, which represents two thirds of the government grant of 6027 €, one third being reserved for the costs of integrating the mandatory 5 kWh battery energy storage system, considering the capital expenditure of around 220 €/kWh for lithium–ion batteries [30].
Regarding the residual value of the PV system at the end of its lifetime, Vres is considered null, as the owner does not receive any form of monetary gratification for returning the PV modules to the producer/distributor to be recycled.
The yearly operation and maintenance costs depend only on the capacity of the PV system and not on the technology. The higher the installed power of the system is, the higher the OM costs are, with values of 132 €/year for the 3 kW systems, respectively 203 €/year for the 5 and 7 kW systems. To determine the total OM costs for the life span of the PV system, an 8.5% [31] discount rate is considered.
As shown in Figure 3, the modules and inverter costs decrease as the installed power increases. The more energy PV systems produce, the cheaper the kWh is. The most expensive PV technology is HJT with an average of 276 €/kW for the 3 kW system, 269 €/kW for the 5 kW system, respectively 267 €/kW for the 7 kW system. The cheapest one is TOPCon with the averages of 191, 179 and 175 €/kW for the 3 kW, 5 kW and 7 kW PV systems. Regarding the inverter costs, the values are similar for the analyzed PV technologies and vary between 289–306 €/kW for the 3 kW systems, 228–233 €/kW for the 5 kW systems and 192–196 €/kW for the 7 kW systems.
For the 3 kW and 5 kW systems, the installation and commissioning costs are similar with values between 133–141 €/kW, respectively 134–138 €/kW. However, the values for the 7 kW systems are much higher, due to the higher number of PV modules and vary from 211 to 215 €/kW.
Based on the proposed LCOE model, two values were determined, one (LCOE1) including the incentives received through “Green House 2024” program, and the second one (LCOE2) without considering the subsidies from the Romanian government for PV system acquisition.
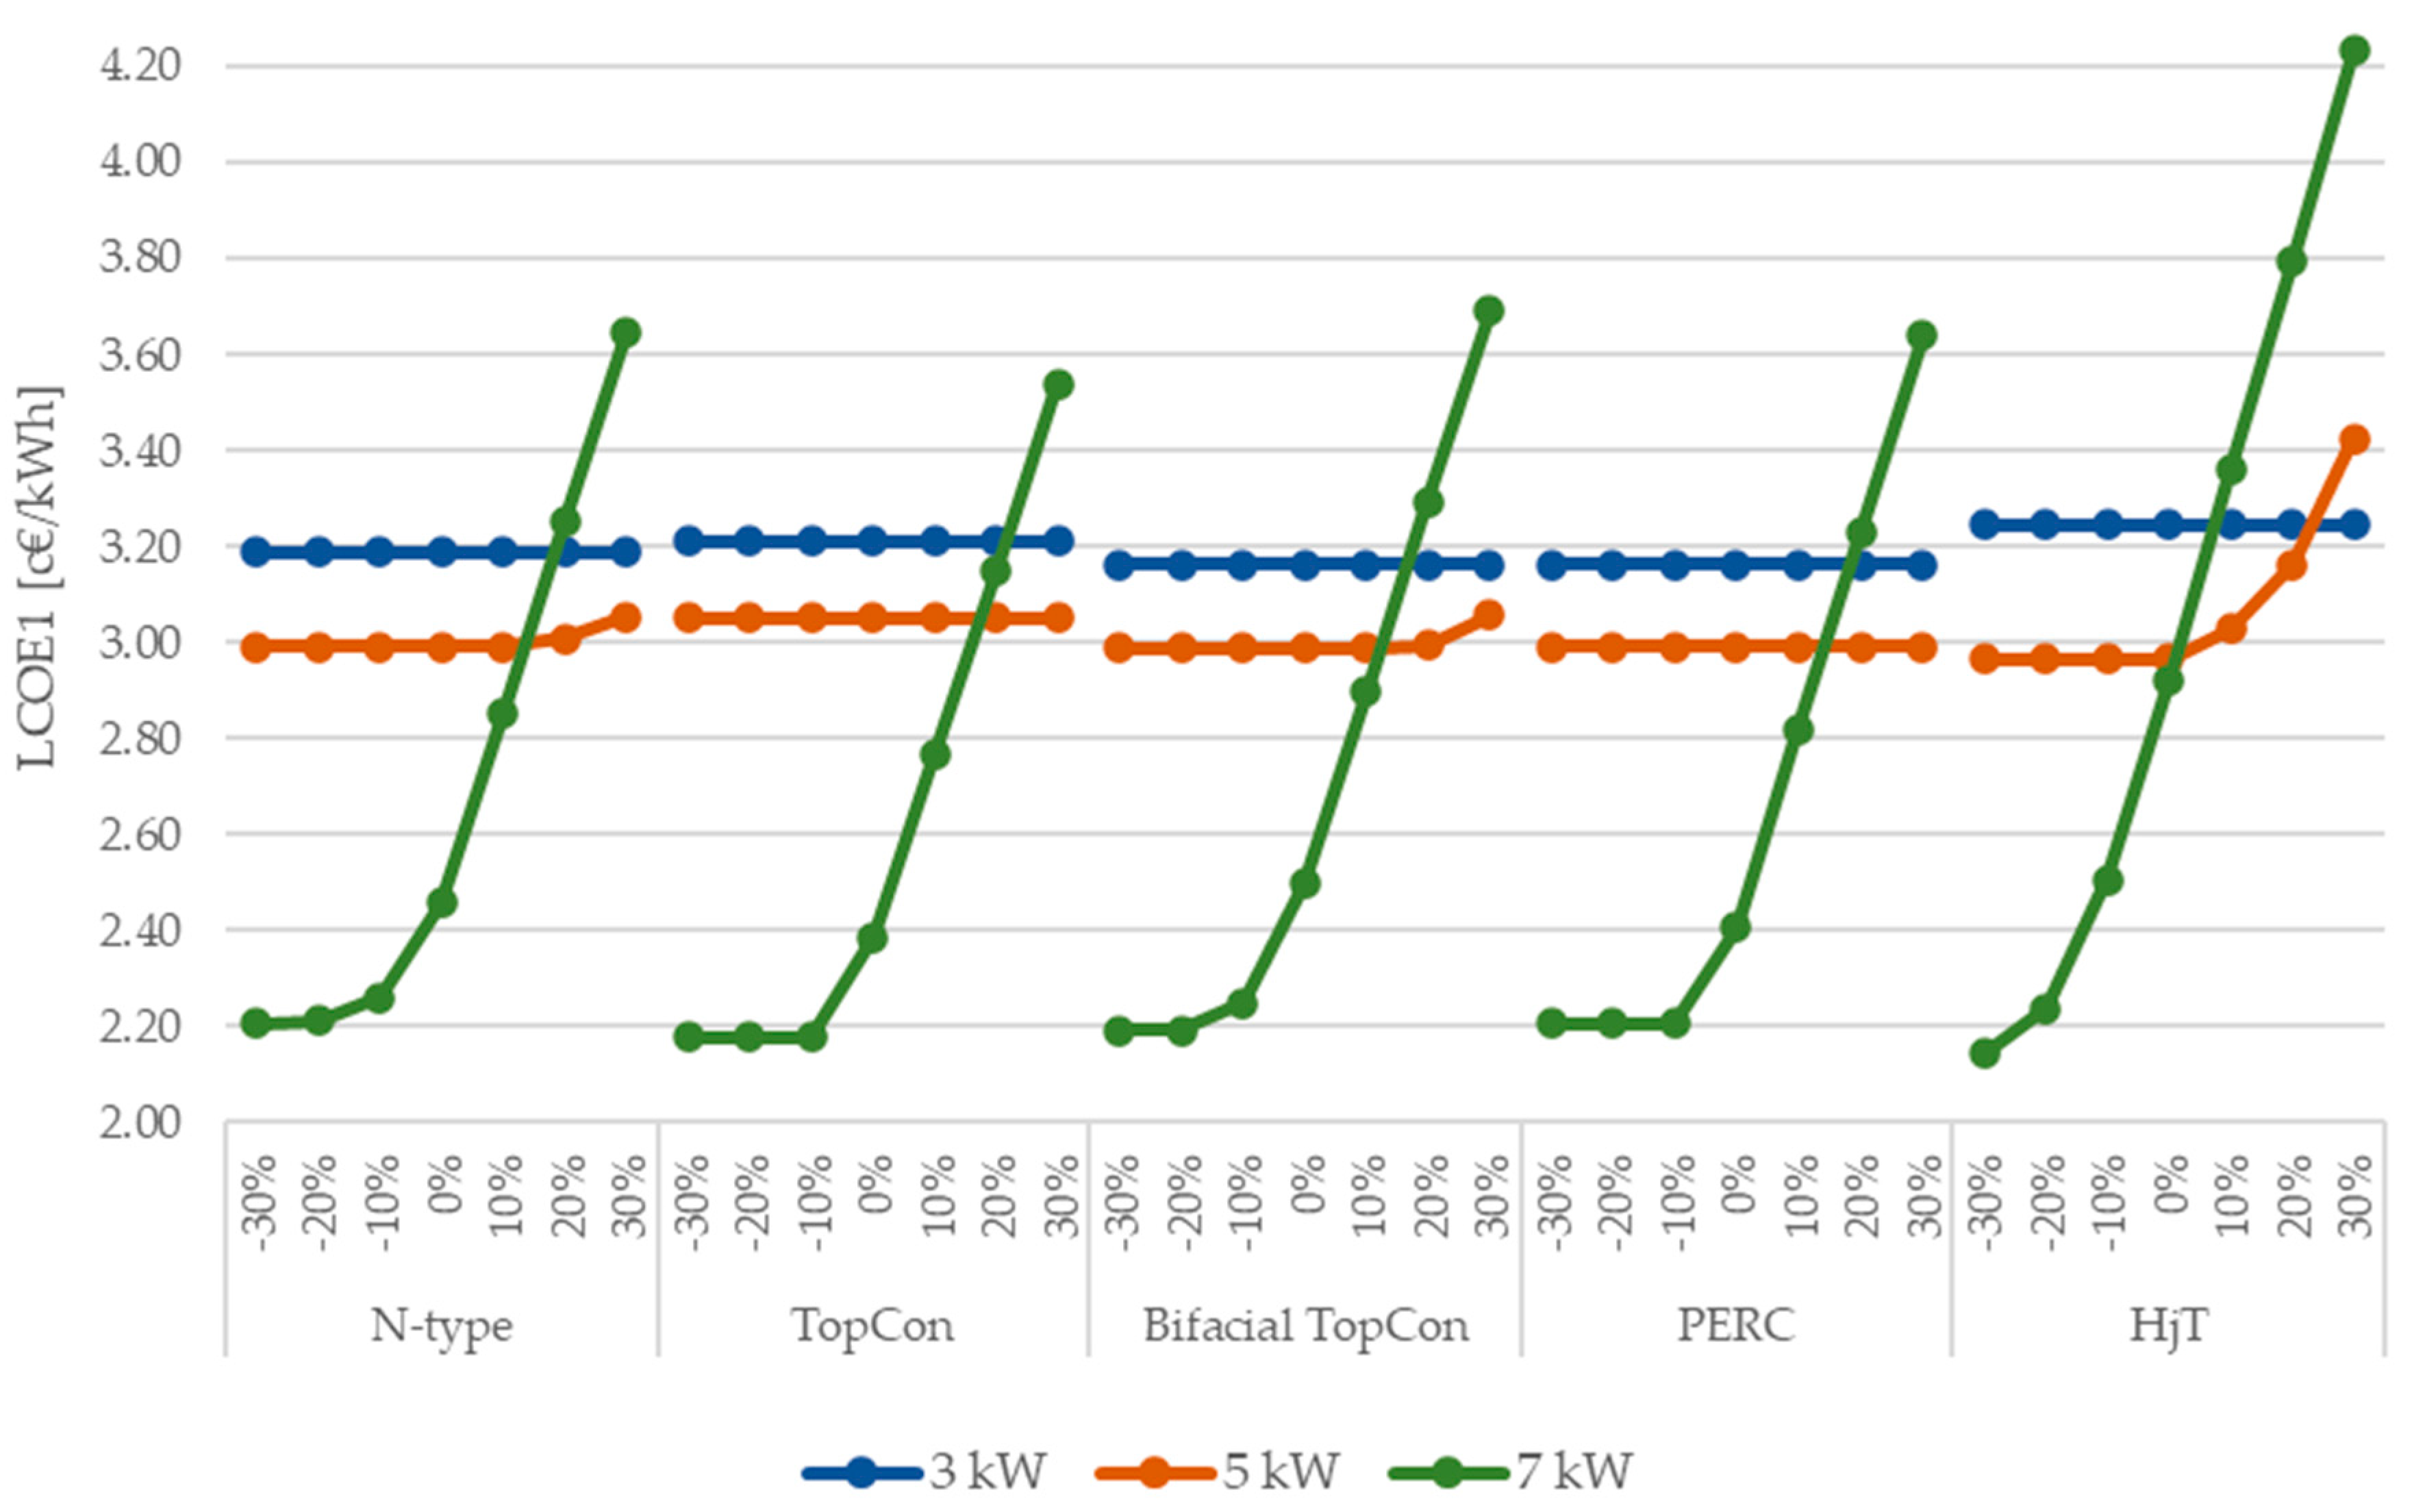
The LCOE1 values are presented in Figure 4. As shown, the 3 kW systems have the highest values, ranging from 3.16 c€/kWh for PERC and bifacial TOPCon technologies to 3.24 c€/kWh for the HJT technology. The values are close since the capital investment costs are covered by the incentives granted by the Romanian government, and the LCOE1 mainly reflects the OM costs during the lifetime of the PV system divided by the total energy production. Lower results are obtained for 5 kW systems for all PV technologies, with values around 3.00 c€/kWh.
For the 7 kW systems, LCOE1 has the lowest values. HJT technology has a high value compared to the other technologies, of 2.92 c€/kWh, due to its capital investment costs, that are not fully covered by the subsidies.
In Figure 5, the LCOE2 values are presented. The lack of subsides has an impact on the feasibility of the five PV technologies studied. HJT technology has the highest LCOE2 values, with 6.51, 7.10 and 7.94 c€/kWh for 3 kW, 5 kW and 7 kW PV systems, reflecting the high capital investment. It is followed by PERC technology with LCOE2 ranging from 6.32 to 7.52 c€/kWh for the three PV systems, due to its shorter lifetime of 25 years, compared to around 30 years, specific to the other PV technologies.
The most feasible PV technology depends on the installed power of the system. For the 3 kW, the lowest LCOE2 is obtained by bifacial TOPCon technology, 7.33 c€/kWh, due to its medium capital investment and high energy production. For the 5 kW system, the cheapest PV technology is N-type with a value of 6.68 c€/kWh, because of its advancements in increasing the conversion efficiency, achieving 23.1%. Finally, for the 7 kW system, the most efficient technology is TOPCon, with an average value of 6.05 c€/kWh for LCOE2, considering it has the lowest capital investment.
The LCOE results clearly demonstrate that the capacity of the PV system can influence its feasibility. The systems with higher installed power are more efficient, even if the initial capital investment is greater. Moreover, the incentives granted by the government can substantially reduce the capital investment and lower the LCOE values. HJT and PERC technologies have the highest LCOE values regardless of the installed power of the system, while the other PV technologies have the lowest LCOE, but only for some systems: N-type for the 5 KW system, TOPCon for the 3 kW and bifacial TOPCon for 7 kW system.
The LCOE values are compared in Table 4 with other results from similar studies presented in the Introduction section. As can be observed, the lowest LCOE values are obtained with the proposed LCOE model when considering the incentives granted by the Romanian government. Without the subsidies, the LCOE values of the five PV technologies are similar with the ones obtained in [13] in Southern California (United States), in [11] where the analyzed projects are in China and with the solar farms from India, analyzed in [10]. The values obtained in [9] and [12] and are higher, due to high capital investment costs.

4. Sensitivity Analysis

A sensitivity analysis was performed to observe the influence of the main cost parameters on the LCOE values. CI and OM costs varied from −30% to +30%, considering a ±10% variation.
First, CI was varied. The LCOE1 values are presented in Figure 6. The 3 kW PV systems are not influenced by the variation of the CI, because of the incentives received from the Romanian government, which cover all the initial costs. Even if CI increases by 30%, the subsidies are enough to sustain the acquisition of the PV system, maintaining LCOE1 values around 3.2 c€/kWh.
Similar results are obtained for the 5 kW systems. TOPCon and PERC technologies’ LCOE1 values are not influenced by any variation in the CI cost, keeping their approximately values of 3 c€/kWh. N-type and bifacial TOPCon LCOE1 values increase only when CI cost is varied by 30%. Meanwhile, HJT LCOE1 values are affected by the slight increase in CI cost, which means that the subsidies barely cover the initial investment of HJT systems. An increase in CI may generate additional costs for the owners which chose HJT modules for their PV system, the LCOE1 values reaching almost 3.5 c€/kWh at a +30% variation.
For 7 kW systems, the variation in CI has a great impact on the LCOE1 values of the studied PV technologies. A decrease in CI cost lowers the LCOE1 for each PV technology, the incentives covering a larger percentage of the initial costs, even cover all the expenses as in the case of TOPCon and PERC technologies at any variation, where the LCOE1 values get as lower as 2.2 c€/kWh. Meanwhile, the increase in CI cost generates higher LCOE1 values for each PV technologies, making them less profitable for potential investors. The highest values are achieved by HJT technology, with 4.23 c€/kWh at a +30% variation.
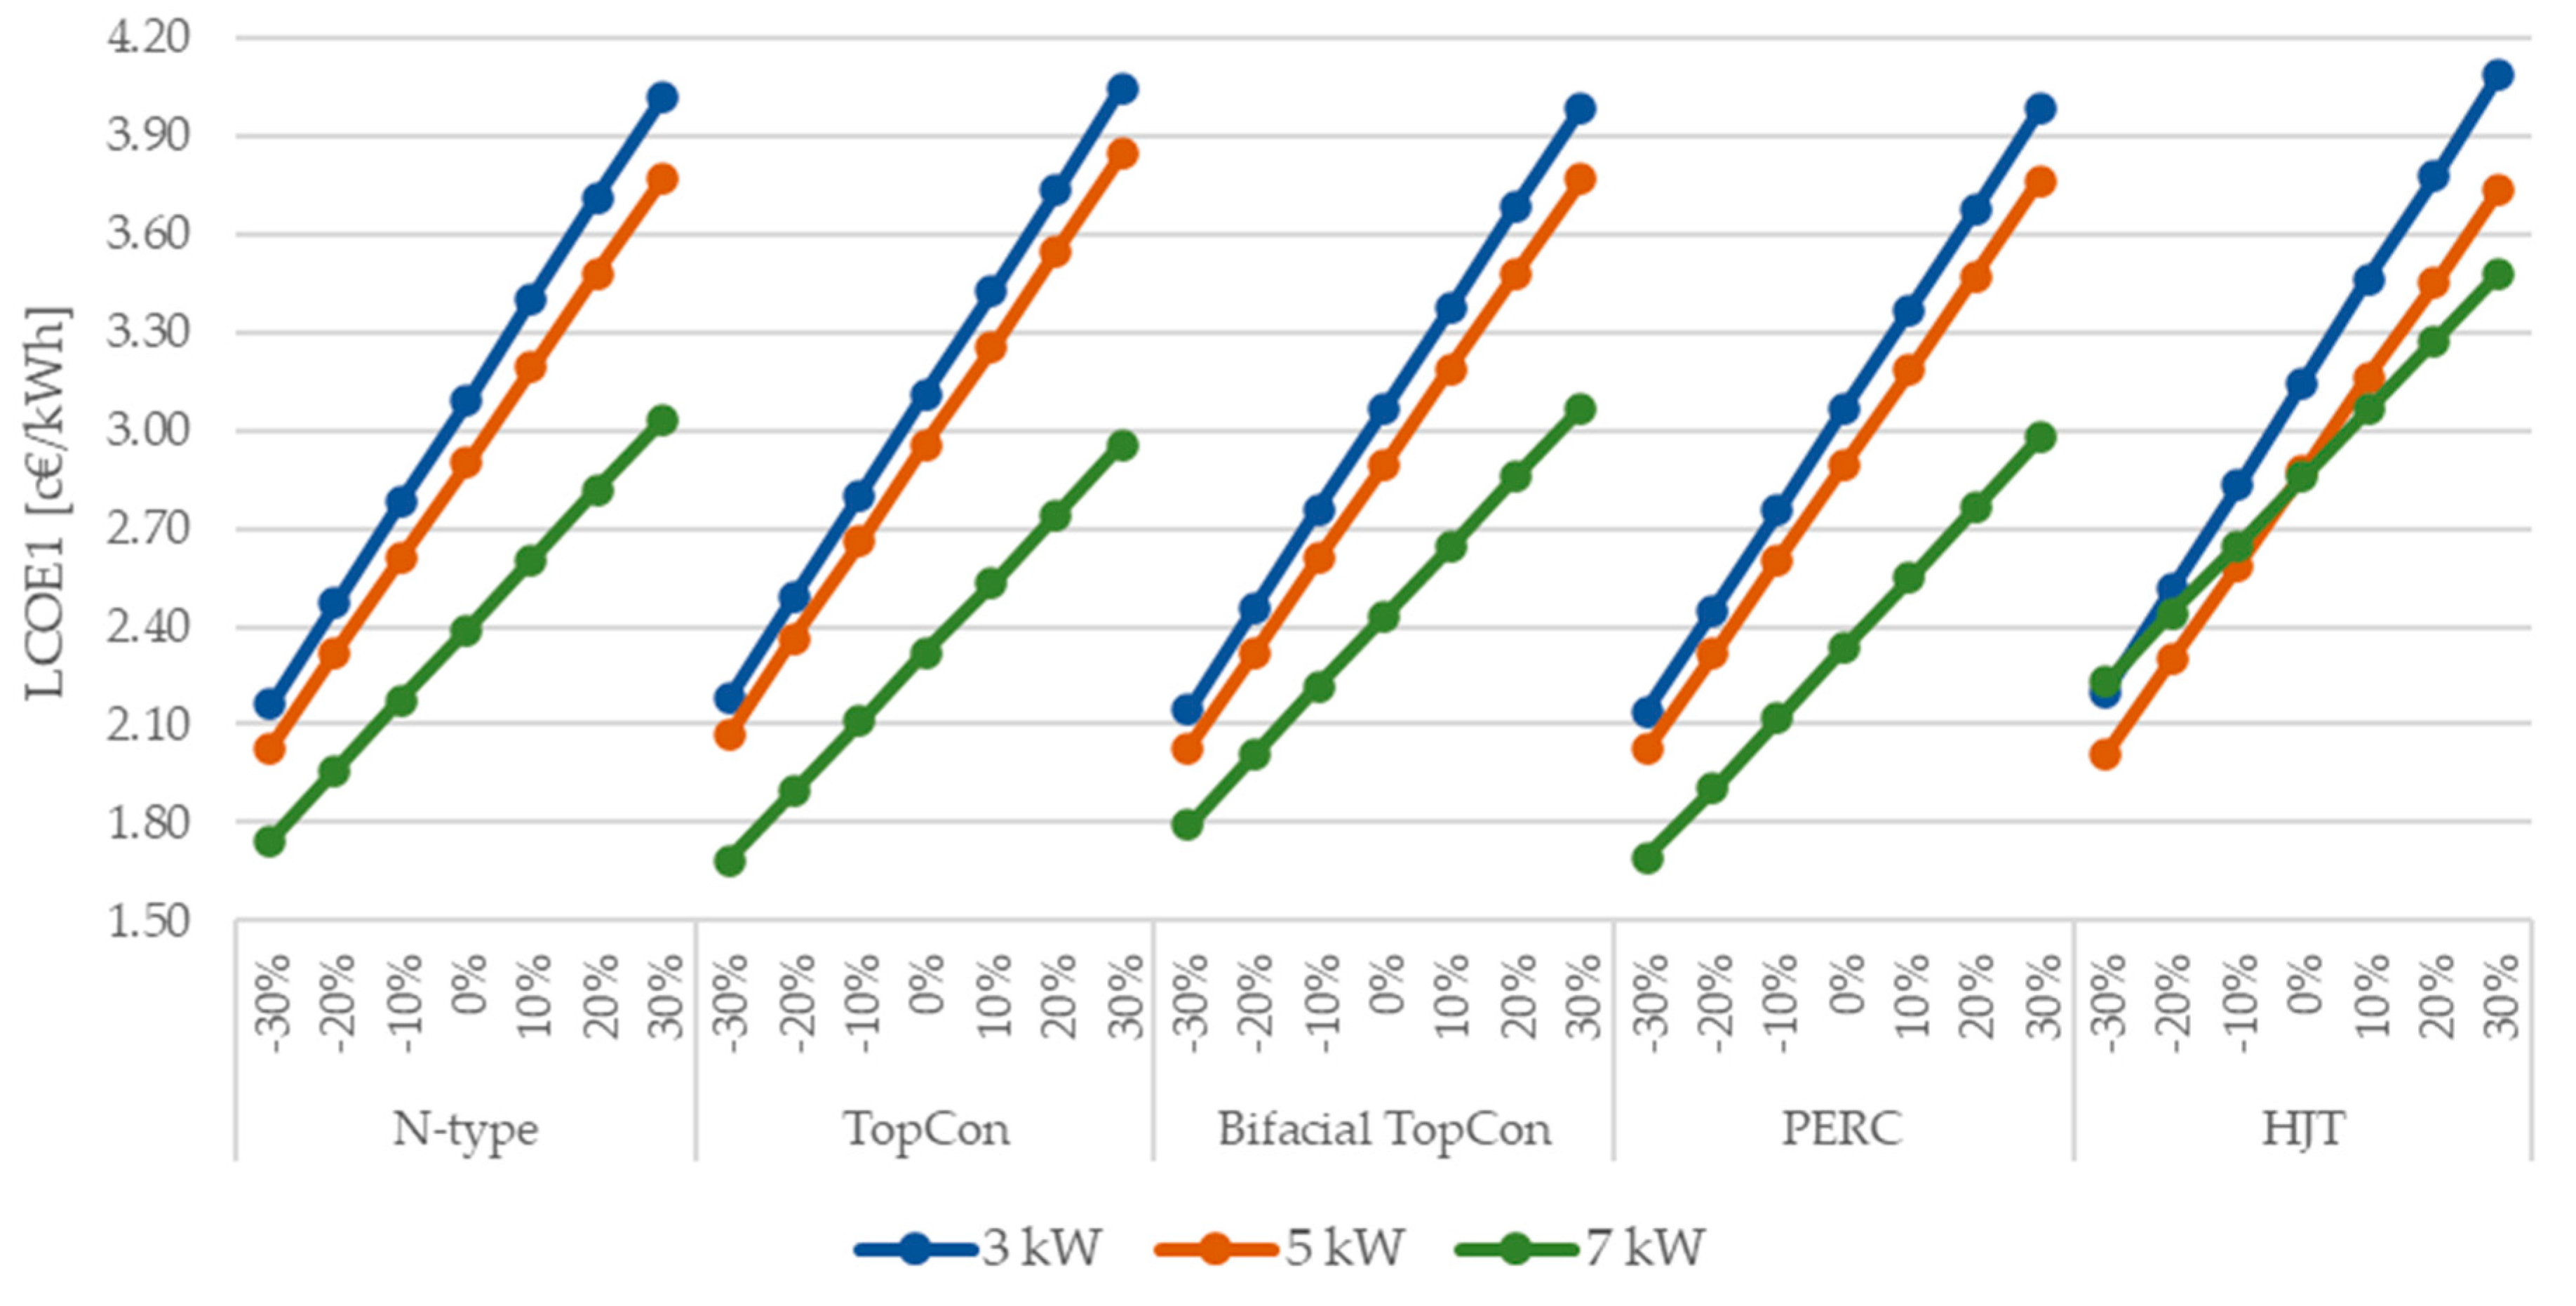
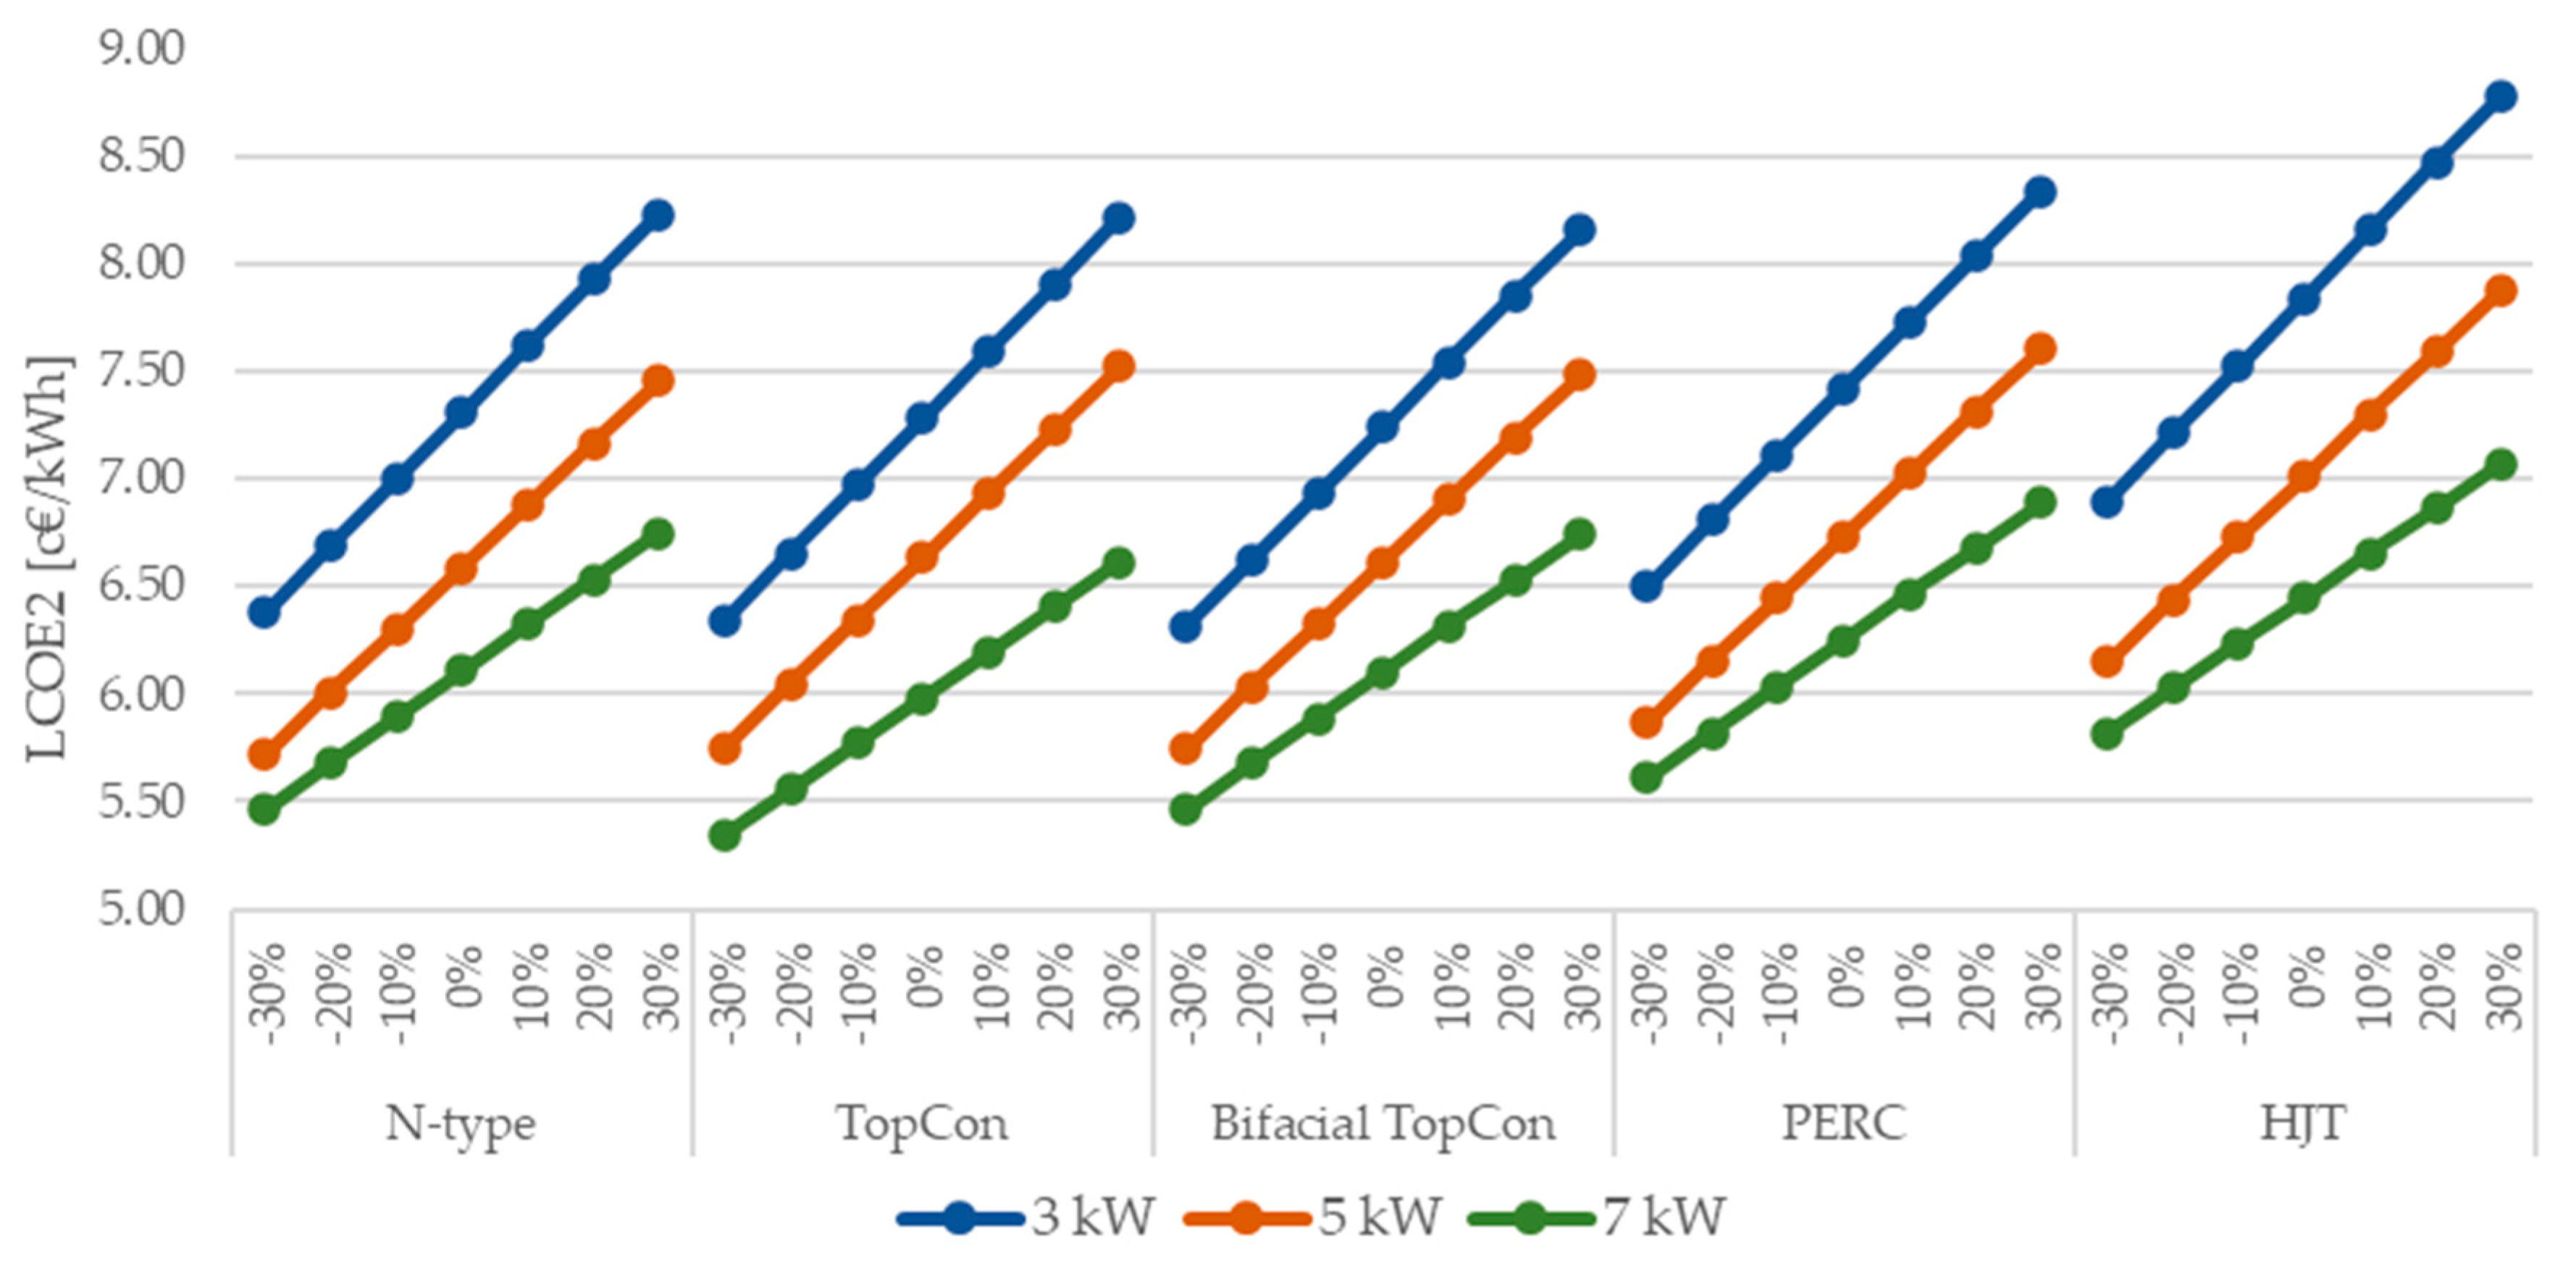
Without subsidies granted by the government, a variation in CI affects all the 15 PV systems studied, even if OM costs remain the same. As presented in Figure 7, a decrease in CI lowers LCOE2 values for all the PV technologies, regardless of their installed power, making the investment more profitable and attracting new investors. The lowest values are obtained for 7 kW systems, with an LCOE2 value of around 5 c€/kWh.
However, an increase in CI cost increases also the LCOE2 values, making the potential investors rethink their investment strategies. All the LCOE2 values exceed 7 c€/kWh for the 7 kW systems and reach 9 c€/kWh for 3 kW systems.
The OM costs were also varied. The LCOE1 values are presented in Figure 8. As shown, LCOE1 values depend on the OM costs, considering that the CI are covered by government incentives, in most cases. The bigger the variation in OM costs, the smaller the LCOE1 values. At -30% variation it can go below 2 c€/kWh for the 7 kW systems for almost all PV technologies, except for HJT technology. Meanwhile, the highest LCOE1 values are obtained at a +30% variation by the 3 kW systems, with values around 4 c€/kWh.
The LCOE2 values are also dependable on the OM costs, as presented in Figure 9. Less affected by the changing of these costs are 7 kW systems, which present lower variations of LCOE2 values, ranging from around 5.5 c€/kWh at a −30%, to 6.8–7 c€/kWh at a +30%. A stiff increase in LCOE2 values is achieved by 3 kW systems, being more affected by the increase in OM costs. The LCOE2 values are around 8–9 c€/kWh for a +30% variation. These values are lower than the ones obtained by changing the CI cost, concluding that the CI cost influences LCOE2 values more than the OM costs.

5. Conclusions

This paper proposed an LCOE model to assess the feasibility of five emerging PV technologies: N-type, TOPCon, bifacial TOPCon, PERC and HJT, considering three installed powers for each one: 3 KW, 5 kW and 7 kW. The PV systems are evaluated based on their technical performance and economic parameters. The proposed approach considers initial capital investment, government incentives, end-of-life residual value of the system, operation and maintenance costs and divides them to the total energy out of the PV system. The energy produced by each system during its lifetime is determined by calculation, depending on the location of the system and its performance.
The results show that the LCOE values depend on the capacity of the system, the higher the capacity is, the lower the LCOE values are. Moreover, government incentives cover the capital investment costs in most cases, the values ranging between 2.39–3.21 c€/kWh for TOPCon, 2.41–3.16 c€/kWh for PERC, 2.46–3.19 c€/kWh for N-type, 2.50–3.16 c€/kWh for bifacial TOPCon and 2.92–3.24 c€/kWh for HJT. Without subsidies, the LCOE values are higher from 6.05–7.38 c€/kWh for TOPCon, 6.17–7.33 c€/kWh for bifacial TOPCon, 6.18–7.40 c€/kWh for N-type, 6.32–7.52 c€/kWh for PERC to 6.51–7.94 c€/kWh for HJT. Nevertheless, based on these values the most feasible PV technology is TOPCon, while the most expensive one is HJT.
The sensitivity analysis concluded that the LCOE values depend on the capital investment and operation and maintenance costs. When incentives are granted, the 3 kW and the majority of 5 kW systems are not affected when the capital investment costs vary. The LCOE values of the 7 kW systems, however, increase and decrease alongside the percentage change in capital investment costs. Similar situations are employed when the operation and maintenance costs present variations, with the smaller systems being more affected than the larger ones.
The analysis performed in this study is valuable to the decision makers and can assist the household consumers to select the optimal solution for their PV system, indicating the installed power and the PV module technology. Moreover, to the authors knowledge, there are few studies that assess emerging PV technologies, the results showcasing the correlation between PV technology improvements and capital investments costs. Our findings are valuable for further investigations that analyze the same PV module technologies worldwide.
Due to new emerging technologies and continuous PV efficiency improvements, the PV technologies must be assessed from an economic point of view for an objective and current analysis. Thus, the learning curve concept might be implemented in future work to analyze the behavior of performance improvements in the studied PV module technologies. Moreover, future work may also include the assessment of commercial and utility scale PV systems with the proposed LCOE model, to highlight significant economic differences between the five PV module technologies.

Author Contributions

Conceptualization, M.C. and C.C.; methodology, M.C.; validation, C.C., R.-A.T. and F.M.Ș.; formal analysis, M.C.; investigation, C.C.; resources, R.-A.T.; data curation, M.C. and F.M.Ș.; writing—original draft preparation, M.C.; writing—review and editing, C.C. and R.-A.T.; visualization, M.C. and C.C.; supervision, C.C. and R.-A.T.; project administration, M.C. All authors have read and agreed to the published version of the manuscript.

Funding

This research received no external funding.

Institutional Review Board Statement

Not applicable.

Informed Consent Statement

Not applicable.

Data Availability Statement

The raw data supporting the conclusions of this article will be made available by the authors on request.

Acknowledgments

This work was supported by a grant from the National Program for Research of the National Association of Technical Universities—GNAC ARUT 2023, Grant No. 20/01.07.2024.

Conflicts of Interest

The authors declare no conflicts of interest.

References

  1. International Renewable Energy Agency. Renewable Energy in Climate Change Adaptation: Metrics and Risk Assessment Framework. 2025. Available online: www.irena.org (accessed on 23 April 2025).
  2. International Energy Agency. Renewables. 2024. Available online: www.iea.org (accessed on 22 April 2025).
  3. Kousovista, G.; Iakovides, G.; Petridis, S.; Chairopoulos, N.-C.; Skembris, A.; Fotopoulou, M.; Antipa, D.; Nikolopoulos, N.; Rakopoulos, D. Comparative Lifecycle Assessment of Renewable Energy Investments in Public Buildings: A Case Study of an Austrian Kindergarten Under Atypical Operational Conditions. Appl. Sci. 2025, 15, 2330. [Google Scholar] [CrossRef]
  4. Almasri, R.A.; Eid, A.; Almarshoud, A.F.; Almotairy, F.H. Assessment of Energy Use and Photovoltaic Energy Potential in Saudi Arabian Governmental Schools. Appl. Sci. 2025, 15, 3809. [Google Scholar] [CrossRef]
  5. Başaran, K.; Özdemir, M.T.; Bayrak, G. Sizing and Techno-Economic Analysis of Utility-Scale PV Systems with Energy Storage Systems in Factory Buildings: An Application Study. Appl. Sci. 2025, 15, 3876. [Google Scholar] [CrossRef]
  6. Fratean, A.; Dobra, P. Technical and economic viability of greenfield large scale photovoltaic plants in Romania. Sustain. Energy Technol. Assess. 2022, 53, 102486. [Google Scholar] [CrossRef]
  7. Yang, Q.; Li, H.; Li, T.; Zhou, X. Wind farm layout optimization for levelized cost of energy minimization with combined analytical wake model and hybrid optimization strategy. Energy Convers. Manag. 2021, 248, 114778. [Google Scholar] [CrossRef]
  8. Obi, M.; Jensen, S.M.; Ferris, J.B.; Bass, R.B. Calculation of levelized costs of electricity for various electrical energy storage systems. Renew. Sustain. Energy Rev. 2017, 67, 908–920. [Google Scholar] [CrossRef]
  9. Nieto-Díaz, B.A.; Crossland, A.F.; Groves, C. A levelized cost of energy approach to select and optimise emerging PV technologies: The relative impact of degradation, cost and initial efficiency. Appl. Energy 2021, 299, 117302. [Google Scholar] [CrossRef]
  10. Bano, T.; Rao, K.V.S. Levelized Electricity Cost of Five Solar Photovoltaic Plants of Different Capacities. Procedia Technol. 2016, 24, 505–512. [Google Scholar] [CrossRef][Green Version]
  11. Chong, S.; Wu, J.; Chang, I.-S. Cost accounting and economic competitiveness evaluation of photovoltaic power generation in China——based on the system levelized cost of electricity. Renew. Energy 2024, 222, 119940. [Google Scholar] [CrossRef]
  12. Branker, K.; Pathak, M.J.M.; Pearce, J.M. A review of solar photovoltaic levelized cost of electricity. Renew. Sustain. Energy Rev. 2011, 15, 4470–4482. [Google Scholar] [CrossRef]
  13. Manzolini, G.; Gentile, G.; Pilotti, L.; Martelli, E.; Picotti, G.; Binotti, M.; Cholette, M.E. Limitations of using LCOE as economic indicator for solar power plants. Renew. Sustain. Energy Rev. 2025, 209, 115087. [Google Scholar] [CrossRef]
  14. Wang, Q.; Guo, K.; Gu, S.; Huang, W.; Peng, H.; Wu, W.; Ding, J. Electrical Performance, Loss Analysis, and Efficiency Potential of Industrial-Type PERC, TOPCon, and SHJ Solar Cells: A Comparative Study. Prog. Photovolt. Res. Appl. 2024, 32, 889–903. [Google Scholar] [CrossRef]
  15. Lazaroiu, A.C.; Osman, M.G.; Strejoiu, C.-V.; Lazaroiu, G. A Comprehensive Overview of Photovoltaic Technologies and Their Efficiency for Climate Neutrality. Sustainability 2023, 15, 16297. [Google Scholar] [CrossRef]
  16. Ren, J.; Zhao, W.; Shi, J.; Yan, Z.; Chen, S.; Luo, Y.; Wang, G.; Han, A.; Shi, Q.; Xia, Z.; et al. Predicting the lifetime of HJT modules towards the outdoor real-world environment. Sol. Energy Mater. Sol. Cells 2024, 272, 112885. [Google Scholar] [CrossRef]
  17. Li, D.; Liu, P.; Fu, N.; Wu, G.; Ju, X. The Research and Development of N Type Monocrystalline Silicon Wafer for High Efficiency Solar Cells. In Proceedings of the 2016 China Semiconductor Technology International Conference (CSTIC), Shanghai, China, 13–14 March 2016; IEEE: Piscataway, NJ, USA, 2016. [Google Scholar]
  18. Metz, A.; Adler, D.; Bagus, S.; Blanke, H.; Bothar, M.; Brouwer, E.; Dauwe, S.; Dressler, K.; Droessler, R.; Droste, T.; et al. Industrial high performance crystalline silicon solar cells and modules based on rear surface passivation technology. Sol. Energy Mater. Sol. Cells 2014, 120 Part A, 417–425. [Google Scholar] [CrossRef]
  19. Banerjee, S.; Sarkar, K.; Das, H.S.; Maity, H.; Bidwe, R.V. A Brief Review of TOPCon Solar Cell and its Future Perspectives. In Proceedings of the 2024 IEEE International Conference on Communication, Computing and Signal Processing, IICCCS 2024, Asansol, India, 19–20 September 2024; Institute of Electrical and Electronics Engineers Inc.: Piscataway, NJ, USA, 2024. [Google Scholar] [CrossRef]
  20. Mahim, T.M.; Rahim, A.H.M.A.; Rahman, M.M. Review of Mono-and Bifacial Photovoltaic Technologies: A Comparative Study. IEEE J. Photovolt. 2024, 14, 375–396. [Google Scholar] [CrossRef]
  21. Wang, L.; Tang, Y.; Zhang, S.; Wang, F.; Wang, J. Energy yield analysis of different bifacial PV (photovoltaic) technologies: TOPCon, HJT, PERC in Hainan. Solar Energy 2022, 238, 258–263. [Google Scholar] [CrossRef]
  22. Kılıç, U.; Kekezoğlu, B. A review of solar photovoltaic incentives and Policy: Selected countries and Turkey. Ain Shams Eng. J. 2022, 13, 101669. [Google Scholar] [CrossRef]
  23. Chowdhury, M.S.; Rahman, K.S.; Chowdhury, T.; Nuthammachot, N.; Techato, K.; Akhtaruzzaman, M.; Tiong, S.K.; Sopian, K.; Amin, N. An overview of solar photovoltaic panels’ end-of-life material recycling. Energy Strategy Rev. 2020, 27, 100431. [Google Scholar] [CrossRef]
  24. Sah, D.; Chitra; Kumar, S. Recovery and analysis of valuable materials from a discarded crystalline silicon solar module. Sol. Energy Mater. Sol. Cells 2022, 246, 111908. [Google Scholar] [CrossRef]
  25. Duffie, J.A.; Beckman, W.A.; Blair, N. Solar Engineering of Thermal Processes, Photovoltaics and Wind; Wiley: Hoboken, NJ, USA, 2020. [Google Scholar] [CrossRef]
  26. Valentin Software. PV*SOL Premium 2025, Valentin Software: R5. Available online: https://valentin-software.com/en/products/pvsol-premium/ (accessed on 2 April 2025).
  27. The National Agency for Fiscal Administration (ANAF). Law No. 227/2015 on the Fiscal Code, as Later Amended and Expanded, Romania. 2015. Available online: https://static.anaf.ro/static/10/Anaf/legislatie/L_227_2015.htm#T7C8 (accessed on 8 June 2025).
  28. Mostafa, M.H.; Aleem, S.H.E.A.; Ali, S.G.; Ali, Z.M.; Abdelaziz, A.Y. Techno-economic assessment of energy storage systems using annualized life cycle cost of storage (LCCOS) and levelized cost of energy (LCOE) metrics. J. Energy Storage 2020, 29, 101345. [Google Scholar] [CrossRef]
  29. Romanian Government. Order No. 2045/2024 of the Ministry of Environment, Water, and Forests of Romania for the Amendment of the Program Regarding the Installation of Photovoltaic Panel Systems for the Production of Electricity, in Order to Cover the Consumption Needs and Deliver the Surplus to the National Grid. 2024. Available online: https://www.afm.ro/sisteme_fotovoltaice_ghid_finantare.php (accessed on 3 May 2025).
  30. Cristea, M.; Cristea, C.; Tîrnovan, R.-A.; Botezan, A.; Şerban, F.; Balog, E. Analysis of Levelized cost of storage for a prosumer—Case study: Romania. In Proceedings of the EPEi 2024—Proceedings of the 2024 13th IEEE International Conference and Expositions on Electric and Power Engineering, Iasi, Romania, 17–19 October 2024; Institute of Electrical and Electronics Engineers Inc.: Piscataway, NJ, USA, 2024; pp. 693–696. [Google Scholar] [CrossRef]
  31. The Official Gazette of Romania. Order No. 3694/785/2024 on the Revision of the Discount Rate to be Used in the Public Procurement Contracts in 2025. 2025. Available online: https://lege5.ro/Gratuit/ge3dcmbqgyyti/ordinul-nr-3694-785-2024-privind-revizuirea-ratei-de-actualizare-ce-va-fi-utilizata-la-atribuirea-contractelor-de-achizitie-publica-in-anul-2025 (accessed on 13 May 2025).
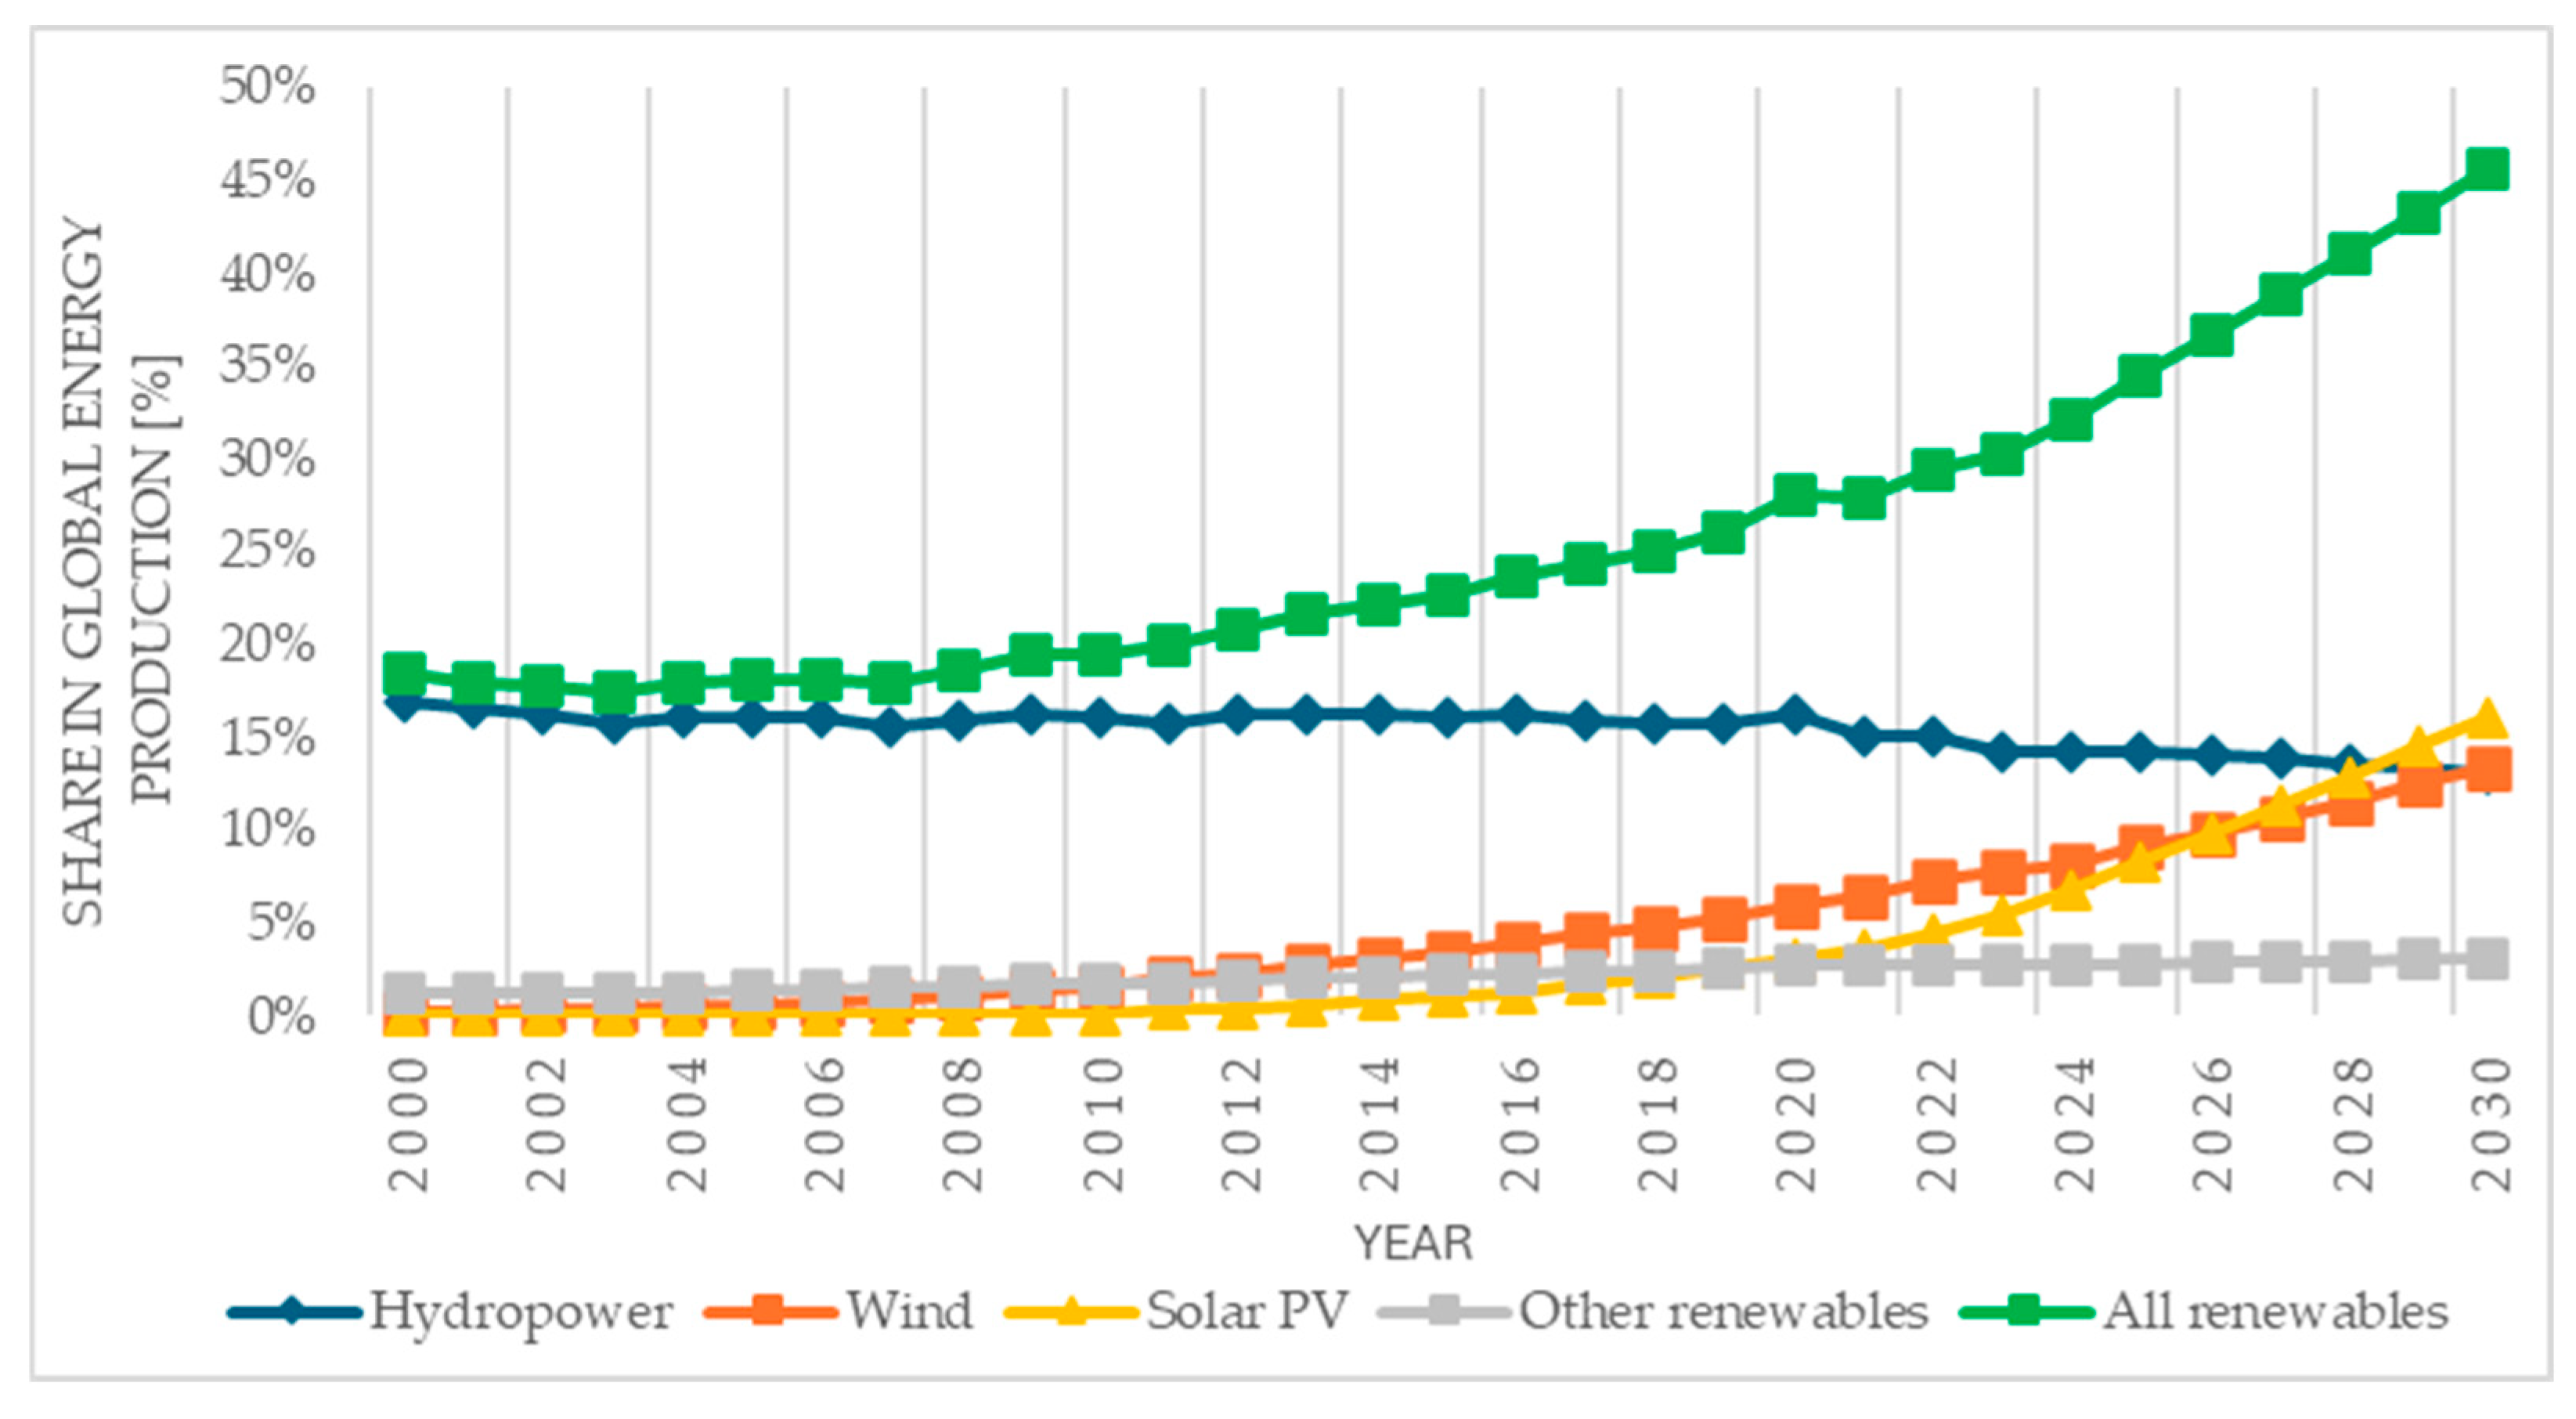
Figure 1. Global share of renewable energy sources from 2000 to 2030 [2].
Applsci 15 06710 g001
Figure 2. Solar PV generation and installed capacity for 2015-2030 [2].
Applsci 15 06710 g002
Figure 3. The average values of the main costs for the analyzed PV systems.
Applsci 15 06710 g003
Figure 4. The average LCOE1 values for each analyzed PV technology.
Applsci 15 06710 g004
Figure 5. The average LCOE2 values for the five PV technologies studied.
Applsci 15 06710 g005
Figure 6. Results obtained for LCOE1 based on change in CI cost.
Applsci 15 06710 g006
Figure 7. Results obtained for LCOE2 based on variation in CI cost.
Applsci 15 06710 g007
Figure 8. LCOE1 values obtained based on variation in OM costs.
Applsci 15 06710 g008
Figure 9. LCOE2 values obtained based on change in OM costs.
Applsci 15 06710 g009
Table 1. Technical parameters of the analyzed PV module technologies.
HJTN-TypePERCTOPConBifacial TOPCon
Module installed power [W]430–710415–600550–670435–615430–700
Efficiency [%]21.6–25.621–23.1021.2–21.721.1–22.822–23
Module area [m2]1.95–3.111.95–2.632.51–3.111.95–2.701.95–3.11
Number of PV modules [pcs]3 kW5–75–85–65–75–7
5 kW8 -129–138–108–129–12
7 kW14–1712–1711–1310–1712–17
Calendar life [years]3025–302525–3030
Table 2. The annual sum of global irradiation of the main Romanian cities [26].
CityAnnual Sum of Global Irradiation [kWh/Year/m2]
Arad1278
Bacău1299
Baia Mare1253
Bistrița1295
Botoșani1266
Brașov1384
București1410
Buzău1362
Călărași1410
Câmpulung Moldovenesc1241
Caransebeș1325
Cluj-Napoca1300
Constanța1443
Craiova1408
Drobeta-Turnu Severin1357
Galași1398
Iași1342
Oradea1264
Râmnicu Vâlcea1391
Satu Mare1253
Sibiu1360
Suceava1260
Sulina1413
Tîrgu Mureș1335
Timișoara1326
Tulcea1398
Table 3. Economic parameters of the analyzed PV module technologies.
CI [€/kW]OM [€/Year]SPV [€]
RangeIQRAvg
HJT3 kW643–8317337241324018
5 kW573–739634640203
7 kW606–764662675203
N-Type3 kW587–771620633132
5 kW511–670548555203
7 kW562–698592597203
PERC3 kW577–679611614132
5 kW495–594544543203
7 kW555–611577581203
TOPCon3 kW551–672632621132
5 kW519–590545550203
7 kW538–604583579203
Bifacial TOPCon3 kW572–688632630132
5 kW517–656552563203
7 kW550–667597602203
Table 4. Summary of LCOE values.
Model
Year
LCOE
[c€/kWh]
Installed PowerPV TechnologyCountry
[9]
2021
135.5 MWorganic absorber layersFiji
19perovskite absorber layers
[10]
2016
121 MWnot specifiedIndia
6.35 MW
7.310 MW
5.925 MW
6.1151 MW
[11]
2024
6.7–15 around 100 MW not mentionedChina
[12]
2011
7.6–13residentialnot specifiedNorth America
8.8–44commercial
5.5–40utility scale
[13]
2025
5.2–13variablenot mentionedSouth Australia
4.9–7.9variableSouthern California (United States)
Proposed—with incentives2.46–3.197 kW
5 kW
3 kW
N-typeRomania
2.39–3.21TOPCon
2.50–3.16Bifacial TOPCon
2.41–3.16PERC
2.92–3.24HJT
Proposed—without incentives6.18–7.407 kW
5 kW
3 kW
N-typeRomania
6.05–7.38TOPCon
6.17–7.33Bifacial TOPCon
6.32–7.52PERC
6.51–7.94HJT
Disclaimer/Publisher’s Note: The statements, opinions and data contained in all publications are solely those of the individual author(s) and contributor(s) and not of MDPI and/or the editor(s). MDPI and/or the editor(s) disclaim responsibility for any injury to people or property resulting from any ideas, methods, instructions or products referred to in the content.