Article

A New Look at the Stress State Across the Bohai Strait, China

1
School of Engineering and Technology, China University of Geosciences Beijing, Beijing 100083, China
2
Institute of Geomechanics, Chinese Academy of Geological Sciences, Beijing 100081, China
3
Technology Innovation Center for In-Situ Stress, Ministry of Natural Resources, Beijing 100081, China
*
Author to whom correspondence should be addressed.
Appl. Sci. 2025, 15(12), 6708; https://doi.org/10.3390/app15126708 (registering DOI)
Submission received: 7 May 2025 / Revised: 11 June 2025 / Accepted: 13 June 2025 / Published: 15 June 2025
(This article belongs to the Section Earth Sciences)

Abstract

:
The Bohai Strait is a special tectonic region in North China, characterized by strong fault activity and frequent seismic events. In this study, we analyzed the stress state across the Bohai Strait in detail by integrating the stress data derived from the hydraulic fracturing measurements in four boreholes along the strait (i.e., Pingdu, Xiangli, Changdao, and Gaizhou from south to north) and evaluated its implications for seismicity. The results reveal that the gradient coefficients of the maximum (SH) and minimum horizontal stresses (Sh) with depth in Xiangli and Changdao are over 1.59 and 1.87 times the corresponding stresses of the North China Block. However, the SH and Sh in Pingdu and Gaizhou do not exceed 50.2% and 59.4% of those of the North China Block. The stress values increase as the distance approaches the interaction of the regional faults in the Bohai Strait. The SH orientation in the Bohai Strait region is N68.67 ± 9.30° E, consistent with the prevailing NEE–E-W regional stress direction. According to the Coulomb friction failure criterion, the friction coefficients of the four boreholes range from 0.24 to 0.52, lower than the theoretically critical limit for inducing fault slip in the upper crust (i.e., Byerlee’s law). The faults in the strait region are considered to be contemporarily stable but need to be further evaluated, considering more influencing factors. This study provides a new, instructive understanding of the variations in the stress state in the Bohai Strait region.

1. Introduction

In-situ stress, a crucial aspect of geomechanics research, directly drives crustal deformation and fault activity [1,2] and can also induce the failure of rock masses in engineering [3,4]. Thus, estimation of in-situ stress field is essential for understanding the mechanisms of earthquakes [5,6], solving geomechanical issues in energy exploration [7,8], assessing the geological safety of engineering projects [9], and predicting [10,11] and mitigating geohazards [12].
The Bohai Strait is located in the northeastern section of North China. It is partitioned by the Zhangjiakou–Bohai Fault Zone (ZBFZ) and the Tan-Lu Fault Zone (TLFZ), the two major seismogenic faults in North China. Therefore, the Bohai Strait and adjacent regions suffer from intense fault activity and earthquakes [13,14]. For example, large earthquakes, such as the Tancheng earthquake in 1668 [15], the Haicheng earthquake in 1975 [16], and the Tangshan earthquake in 1976 [17], all occurred in this region and caused great casualties. Given the dense population and cities, developed economy, seismic risk, and the potential cross-sea corridor, a thorough understanding of the stress state across the Bohai Strait has been an attractive topic for decades [18,19]. The stress field in the Bohai Strait and adjacent regions has been preliminarily studied by several scholars. For example, Qi [20] and Zheng et al. [21] pointed out that the Bohai Strait is under an NE-NEE trending regional compression stress field by integrating stress data around the Bohai Sea. Zhang et al. [22] estimated the stress state in the Pingdu area, Shandong Province, based on in situ stress data obtained from a deep borehole. Their estimation revealed that the maximum horizontal stress is oriented to E-W, and the stress level is low, far from the typical limit inducing fault activity in the upper crust. Zhang et al. [23] further analyzed the stress state in the Gaizhou area in the Liaodong Peninsula. They found that vertical stress plays a dominant role in the current stress field, and the maximum principal stress is oriented to NE-NEE, which is conducive to the occurrence of right-lateral strike-slip faulting on the Jinzhou Fault. Li et al. [24] analyzed the stress state in the nearshore areas of Penglai and the sea areas near Changdao. They noted that the maximum principal stress orientation ranges from NEE to E-W, and the horizontal stress increases with depth at greater gradient coefficients than vertical stress. Therefore, the faults intersect the principal stress orientation at a high angle and are in a contemporary stable state. Feng et al. [25] estimated the stress state of the Shandong–Bohai–Liaoning section of the TLFZ using measured stress data around the Bohai Sea. They noted that the stress is oriented in N68° E in the Bohai section, and the stress accumulation level in the Bohai section is lower than that of the Shandong section but higher than that of the Liaoning section. The results also indicate that the stress state exhibits consistency with the fault kinematics. Wang et al. [26] identified a reverse stress regime in the southern Bohai Sea, with a strike-slip regime in the northern area, though the SH orientations in the two regions are all NE-trending.
These studies provide valuable insights into the stress state around the Bohai Strait but mainly focus on stress state either at a single borehole scale or regional scale; therefore, these studies do not thoroughly characterize the stress state across the Bohai Strait, especially the variation of stress state. It is argued that the seismicity in the Bohai Strait is dominantly controlled by the tectonic interactions between the TLFZ and ZBFZ [27,28]. Moreover, the intersection of faults striking in different directions and the fault activity may lead to notable variations in stress state [2,8,29], which in turn affects the assessment of fault reactivation potential. Considering the complex geological setting and the faulting framework, it is necessary to perform a more detailed estimation of the stress state across the Bohai Strait using the enriched stress data in this region. Thus, the purpose of this study is to thoroughly analyze the stress state across the Bohai Strait, especially its variation, by integrating existing stress data and newly obtained stress data.
In this study, we first introduce the geological context of the Bohai Strait region. Then, we present the methods and in-situ stress data used, including the existing ones (Pingdu and Gaizhou) and the data derived from recent hydraulic fracturing measurements (Xiangli and Changdao). Thereafter, we analyze the stress state characteristics by creating a stress profile across the Bohai Strait and estimate its variations. Finally, we discuss its implications for fault reactivation potential. The new understandings obtained can be applied to seismic risk estimation and to optimize subsea tunnels through evaluation of rockburst or large deformation risks.

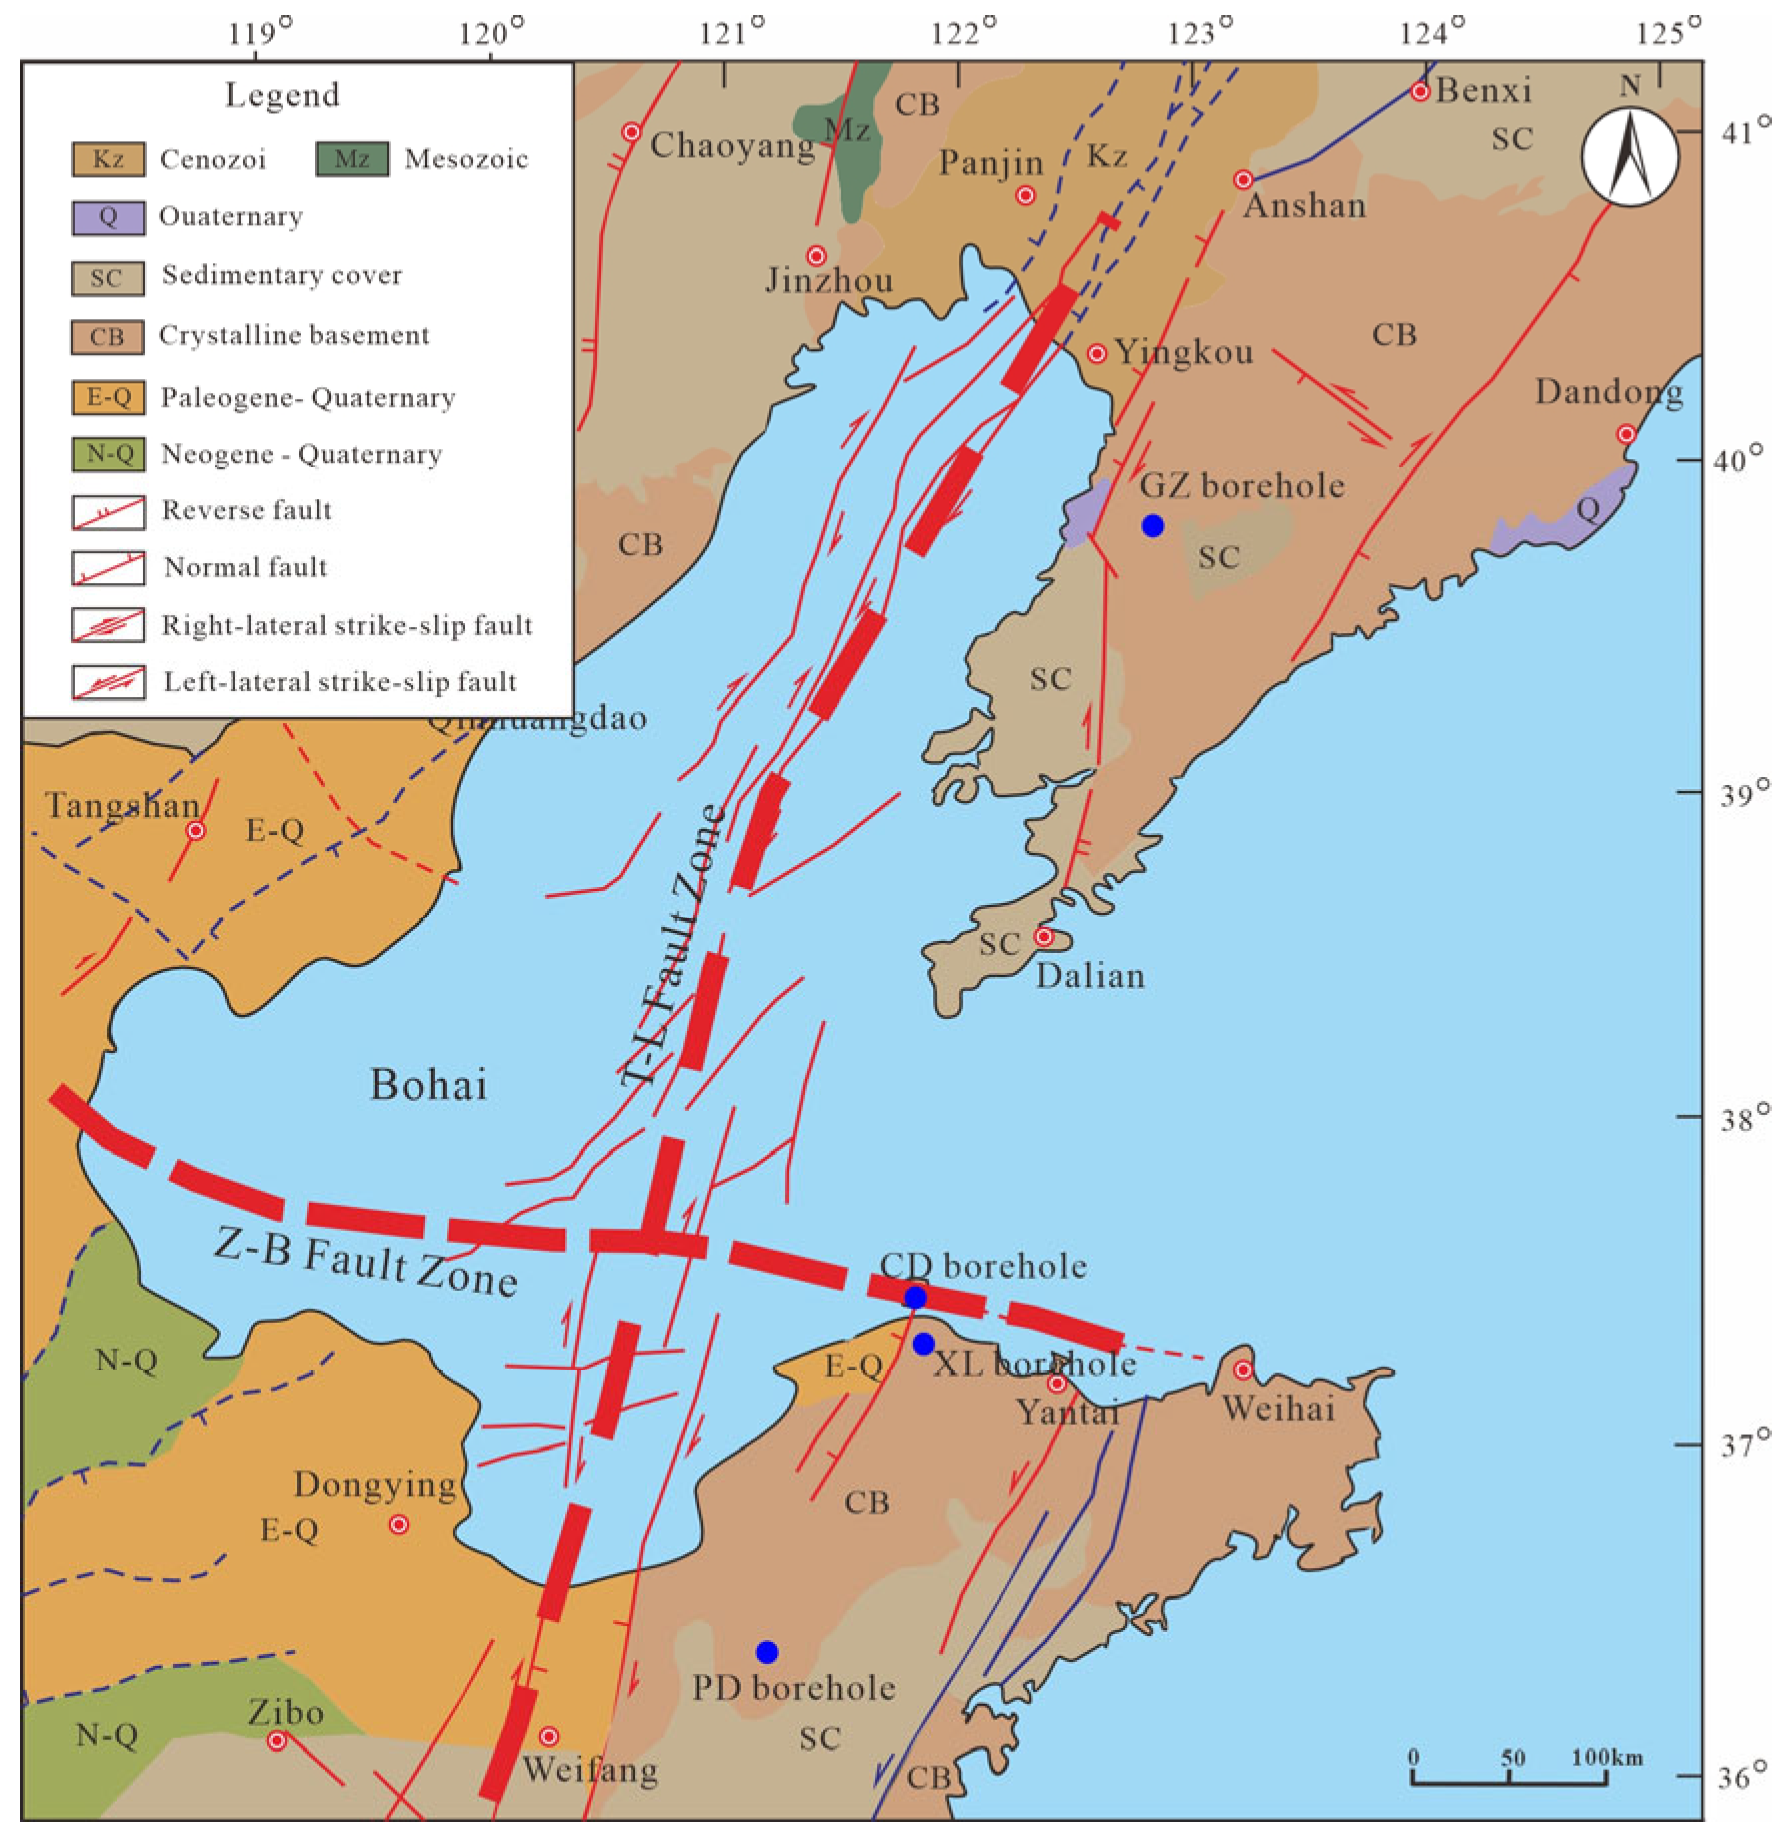
2. Geological Setting

The Bohai Strait is located in the eastern margin of the Bohai subsidence belt and is spatially embedded within the Jiao–Liao Uplift-Fold Belt tectonic unit. The northern and southern boundaries of the Bohai Strait are adjacent to the Liaodong Uplift and the Jiaodong Uplift, respectively (Figure 1) [30]. The Bohai Strait is demarcated from the Bohai Basin by the TLFZ in the west and extends eastward into the North Yellow Sea Basin [12,31,32]. The Bohai Strait and adjacent region have undergone a prolonged and complex tectonic evolution, with a dynamic and intricate geological history [33,34]. It has exhibited typical neotectonic features since the Mesozoic. Under the tectonic action of the Jiao–Liao ancient Block (in the Supplementary materials), with the neotectonic movement dominated by fault depression activity, the study region finally formed a complex tectonic geomorphology system with a near east-west trench-island distribution [26,35]. The current vertical differential movement in Miaodao Island, which is in the Bohai Strait, exhibits a southern uplift–northern subsidence configuration [36].
The TLFZ [25] and ZBFZ [27] are not monolithic structures but comprise multiple subsidiary faults. The major fault belt and the subsidiary faults collectively form composite zones, with these secondary structures constituting integral components of their respective systems. It is stated that sustained non-uniform uplift is mainly controlled by the synergistic interaction between the Yingkou–Weifang fault, a branch of the TLFZ, and the Penglai–Weihai fault, a branch of the ZBFZ (Figure 1). These two regional faults not only govern the long-term tectonic evolution of the strait basement during the Meso-Cenozoic [37] but also demonstrate significant Quaternary activity [38]. The TLFZ intersects the ZBFZ within the Bohai Strait area, thereby forming a complex tectonic framework. The TLFZ is a mega-tectonic structure in eastern China [39], and plays a key role in the stratigraphic evolution and tectonic movement within its interior and surrounding regions [40]. Consequently, a seismically active zone characterized by frequent earthquakes forms in the region adjacent to this fault [41,42]. The Bohai segment of the TLFZ is predominantly characterized by NNE-striking strike-slip secondary faults [43,44]. The ZBFZ is an NW-trending major lithospheric fault with frequent strong earthquakes [45]. It has exhibited left-lateral strike-slip faulting activity since the Late Quaternary. Seismic activity exhibits a progressive attenuation with increasing distance from the major fault [46]. In addition, a series of faults are generated within the Bohai Strait and adjacent region, including the NNE-, E-W-, and NW-trending faults. The NNE-trending faults are mainly distributed within Laizhou Bay, central Bohai Sea, and Liaodong Bay, spatially aligned with the strike of the Bohai segment of the TLFZ, and can be defined as the secondary faults of this major fault system. The NW-trending faults are concentrated in Bohai Bay and the central Bohai Sea, corresponding to the Bohai segment of the ZBFZ as subsidiary faults. The E-W-trending faults mainly distribute in the eastern Bohai Sea [25] and are inherited and evolved from pre-existing E-W-trending faults [47,48].

3. Materials and Methods

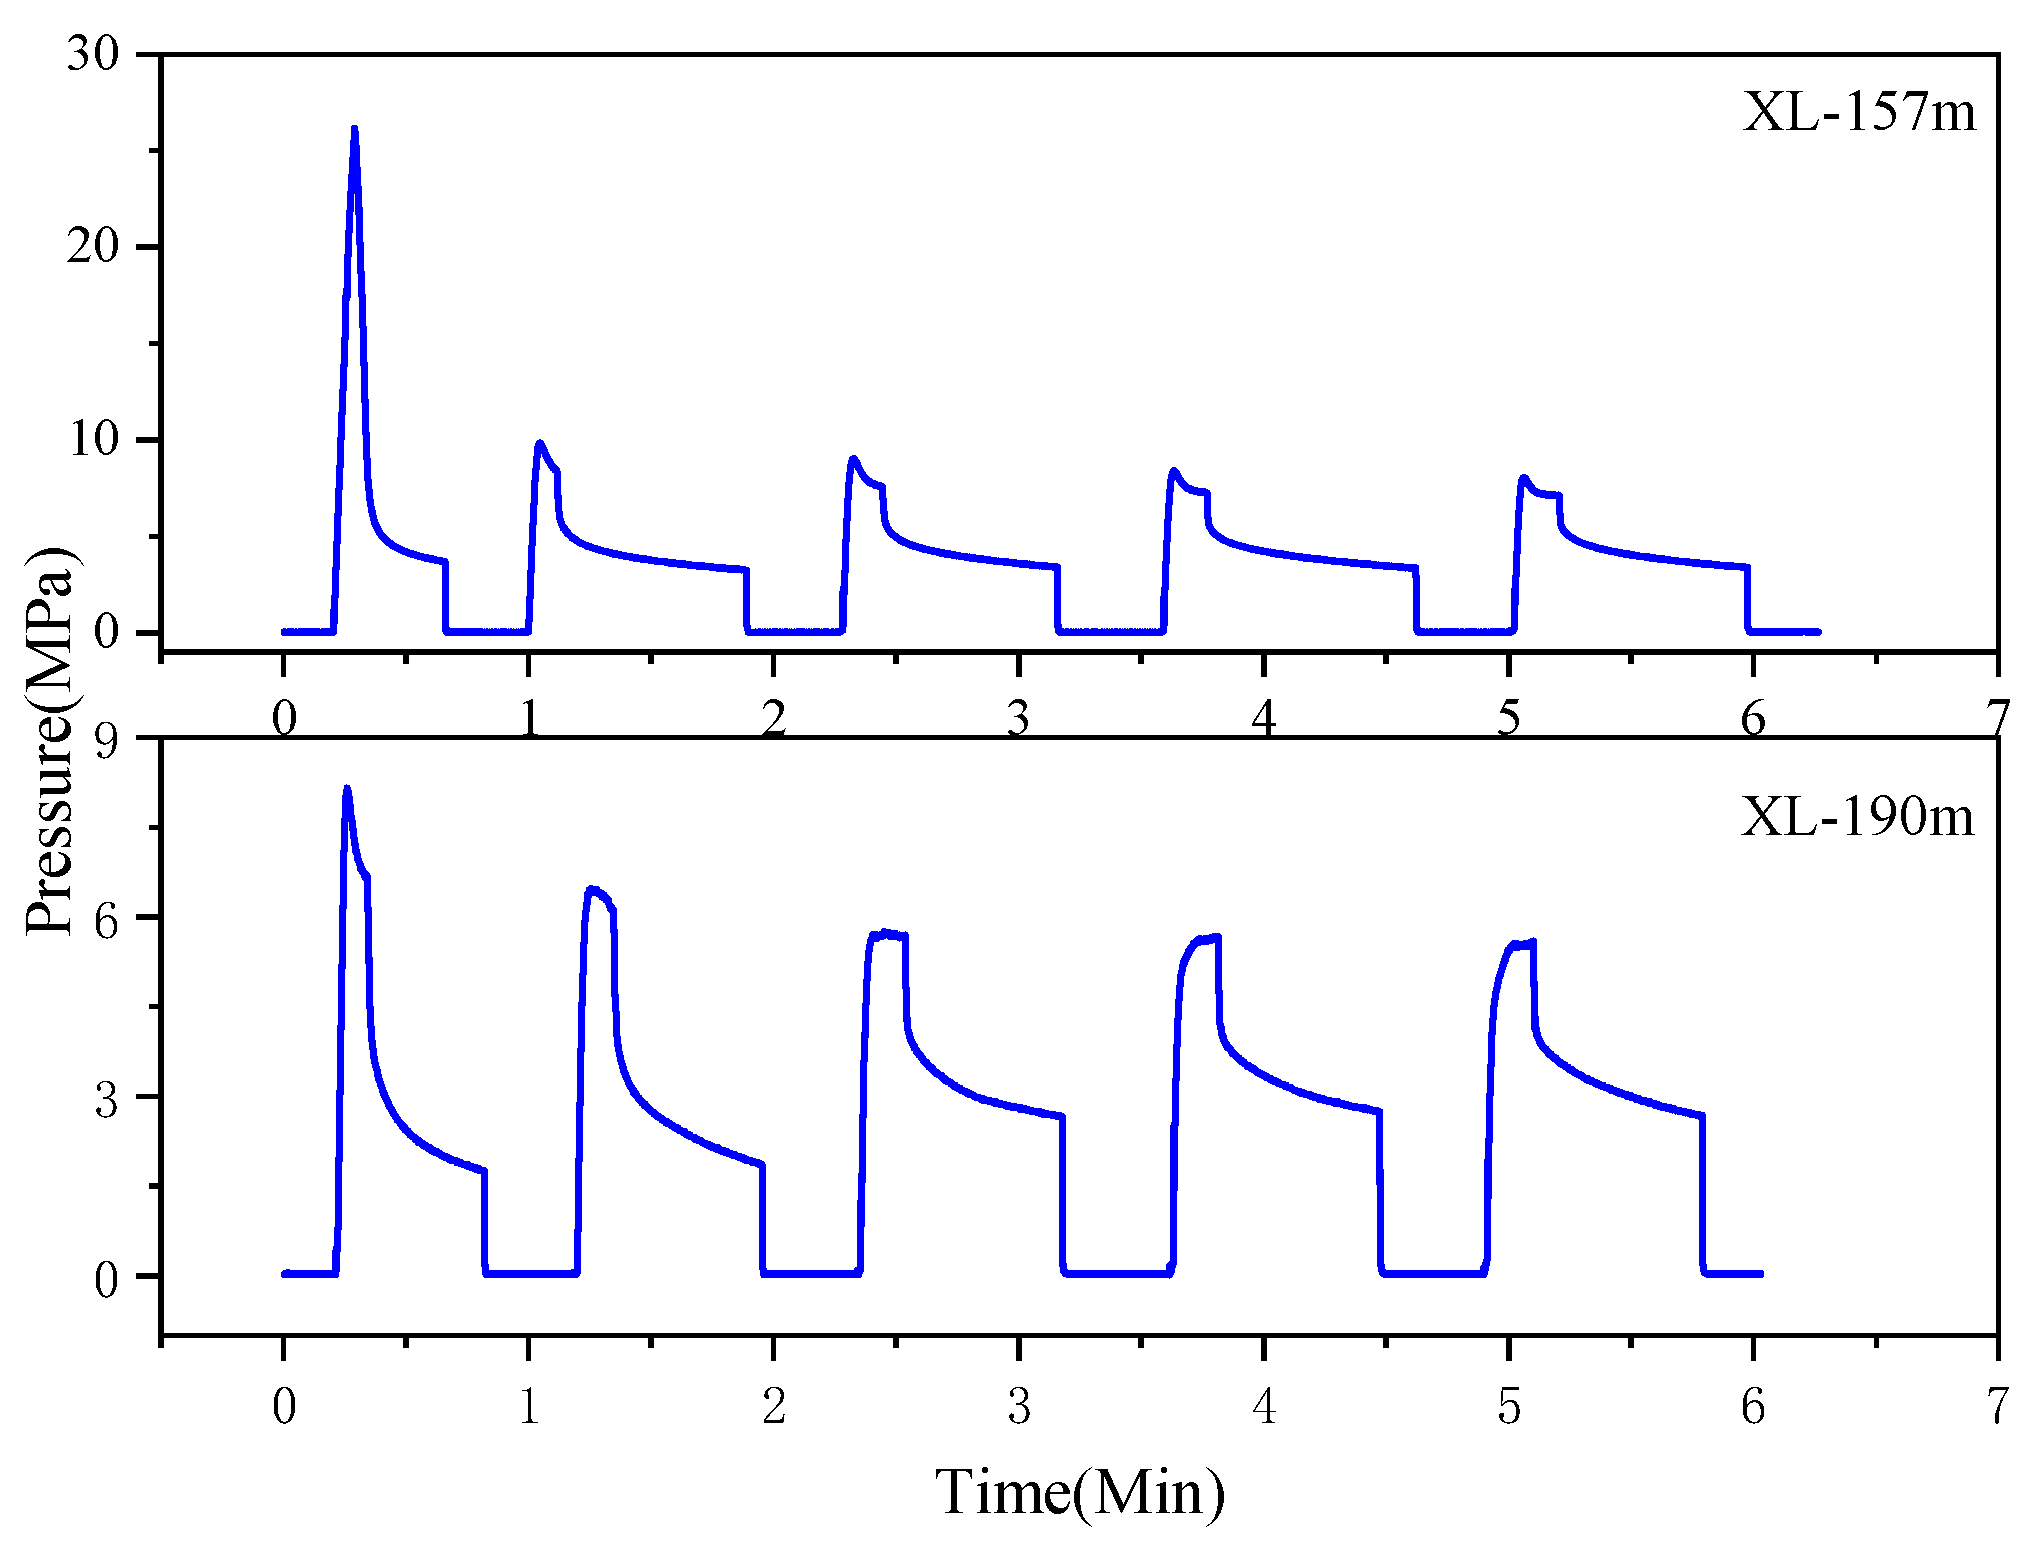
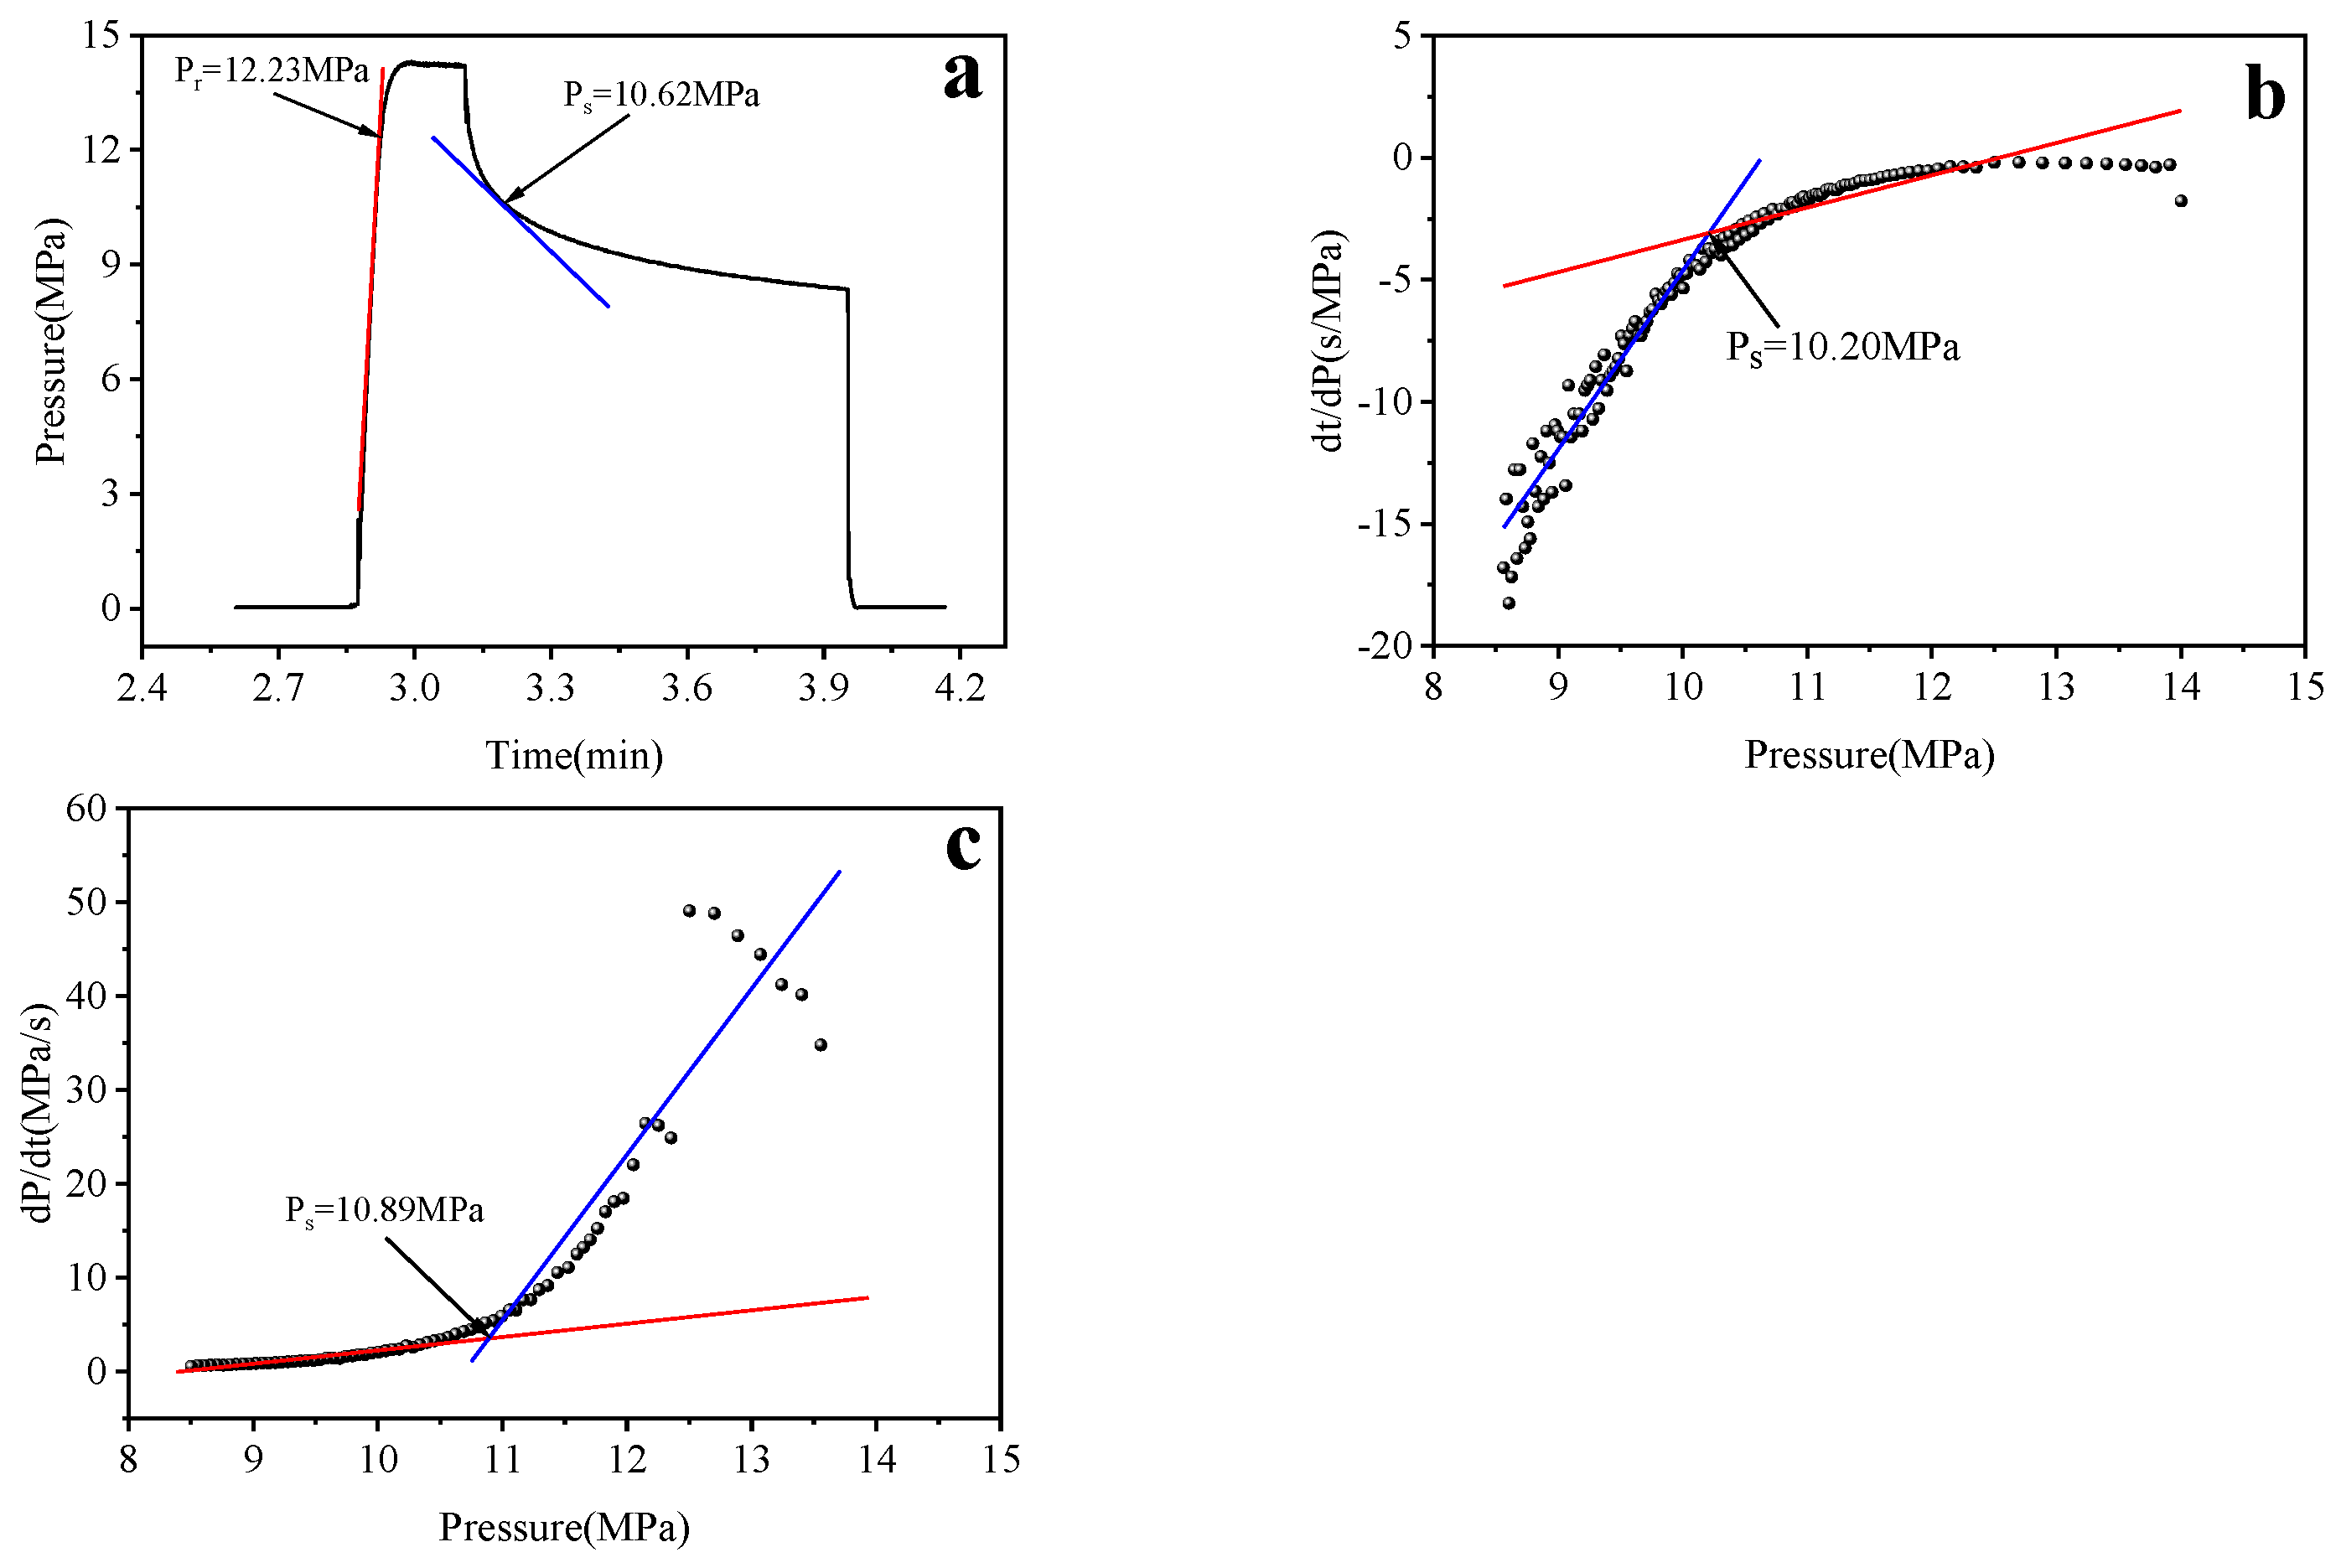
3.1. Hydraulic Fracturing

Hydraulic fracturing, or the mini-frac (HF) method, is a widely used technique for directly measuring in-situ stress magnitude and orientation, in particular for vertical or slightly inclined (less than ±15°) boreholes [49,50]. The reliability and accuracy of the HF method have been extensively validated both in theory and practice [50,51,52]. The basic concept of the HF method is to induce tensile fractures in an intact rock interval free of joints or fractures by injecting high-pressure fluid (usually water), thereby enabling stress determination.
Under the assumption that the rock is linearly elastic, homogeneous, and isotropic, and one of the principal stresses is parallel to the borehole axis, three stress components, the vertical stress (Sv), the minimum (Sh), and maximum horizontal stress (SH), can be determined from the HF test. For vertical boreholes, Sv is conventionally equivalent to the overburden weight [49,50], while the SH and Sh are determined from the pressure–time recordings of the HF test. Generally, the calculation formulas for SH, Sh, and Sv in vertical boreholes are as follows:
S h = P s
S H = 3 S h P r P 0
S v = ρ g h
where Pb is the breakdown pressure, Ps is the instantaneous shut-in pressure, Pr is the reopening pressure, and P0 is pore pressure. The parameters ρ, g, and h denote the mean density of overlying strata, the gravitational acceleration (~10 m/s2), and the measurement depth, respectively. In this study, the mean density is set to 2.65 g/cm3 based on experiments on the tested rocks. P0 is usually considered equivalent to hydrostatic pressure in low-permeability rock formations [1,53,54].
It was confirmed that the azimuth of the fractures induced by the HF test corresponds to the SH orientation. To determine the orientation of SH, methods such as the impression test or borehole ultrasonic logging are commonly used to identify the induced fracture traces [50,52,55]. In this study, the SH orientations were all determined using the impression tests.

3.2. HF Measurements in Xiangli and Changdao

To obtain stress data near the key structural region of the strait and construct a cross-strait stress transect, we conducted HF tests in two boreholes (i.e., Changdao and Xiangli) drilled recently. The Xiangli (XL) and Changdao (CD) boreholes were drilled in the southern area of the Bohai Strait (Figure 1). The XL borehole, located in Xiangli Village, Penglai City, Shandong Province, is approximately 10,000 m south of the Bohai Sea. It is located on the east side of the Shandong segment of the TLFZ and the south side of the ZBFZ. The topography around the XL borehole is a low-relief hilly terrain with elevation variations of less than 20 m. The depth of this borehole is 500.10 m, with a diameter of 76 mm. The strata of the XL borehole are primarily composed of plagioclase gneiss, granitic gneiss, and granite. The CD borehole is located in a small basin on South Changdao Island, Changdao County, Shandong Province, with minor topographic variation of less than 50 m. It is located on the eastern side of the TLFZ but near the southern margin of the ZBFZ. The depth of the CD borehole is 100 m, with a diameter of 95 mm. Drill cores and loggings reveal that no faults were exposed. The strata are primarily composed of amphibole–plagioclase gneiss and relatively intact core samples. The strata in these two boreholes (also the PD and GZ boreholes) are granitic rocks. According to rock mechanics experiments on the rocks, the rocks in the XL and CD boreholes exhibit slight anisotropy; therefore, the rocks can be considered nearly elastic, homogeneous, and isotropic, largely aligning with the assumptions of the HF method. In addition, the two boreholes are subvertical, with dips less than 5°, meaning that the vertical stress can be considered to be parallel to the axis of the borehole. These conditions initially ensure the reliability of HF testing in these boreholes.
HF field tests in this study were conducted by using a single-loop HF system [56], which consists of an automated control pump (35 MPa max. pressure; 15 L/min max. flow rate), a downhole shut-in valve, a 1.0 m test interval, pressure transducers, and a flowmeter. HF tests were immediately conducted after drilling was completed. Before the HF test, target intervals were preselected based on integrated analysis of optical televiewer logs and core samples, with exclusion of zones including natural fractures or faults. In detail, the test intervals were selected free of fractures, microcracks, and veins, and are far away from fractured zones over 2 m, referring to previous practices [56]. The testing procedures in these two boreholes followed the ISRM recommendations, through which non-conforming hydraulic fracturing curves and unclear impression images were excluded, resulting in ISRM-compliant datasets. During the HF test, pressure/flow curves are displayed in real-time on the control system and digitally recorded at 20 Hz. After the fracturing test, an impression packer with an automatic orientation device is run down to the same depth (within the same fracturing test interval). Under pressure, the rubber wall of the packer is forcibly pressed into the fracture, thus recording a fracture imprint on the packer surface to determine the SH direction.
Finally, 15 valid and 4 valid HF tests were conducted in the XL and CD boreholes, respectively. Representative pressure–time curves obtained from the XL borehole are presented in Figure 2. It can be found that the HF curves obtained conform to ISRM specifications for HF test protocols [50]. Using the impression test method, five and two traces of the induced fractures were obtained from the XL and CD boreholes, respectively (Figure 3).
To determine the magnitudes of SH and Sh using Equations (2) and (3), Ps and Pr should be calculated reliably and accurately. Ps is acknowledged as the most critical parameter because it directly equals Sh and is then used to estimate the value of SH. Many methods that derive Ps from the HF pressure–time curve have been proposed and studied [49,50]. Of these methods, the inflection point method draws a straight line tangent to the pressure–time curve from the point where the pump is closed and defines such a point at which the line leaves the curve as the shut-in pressure [57]. This procedure is based on the closure theory of the fracture and has been widely completed by computer, effectively reducing subject uncertainty. The dt/dP vs. P method [58] and the dP/dt vs. P method [59] are based on rigorous mechanical theory, that is, the pressure decay in the test interval during the fracture closure stage exhibits an exponential of time. According to this theory, the closure procedure can be divided into three (dt/dP vs. P) or two (dP/dt vs. P), and the shut-in pressure is defined as the inflection point of the curves analyzed using the functions. Previous studies indicate that the three methods provide slightly different shut-in points relative to the entire closure procedure, and the applicability is different for different types of rock. The ISRM recommends using at least two methods to calculate the Ps to ensure the reliability of the determination of shut-in pressure and improve accuracy [50]. In this study, the inflection point method [57], the dt/dP vs. P method [58], and the dP/dt vs. P method [59] were adopted to calculate the Ps magnitude. The mathematical mean of the three methods is taken as the final value of the shut-in pressure. Figure 4 elucidates the determination of Ps values using the three methods, with a case at the 208.5 m depth in the XL borehole as an example. The magnitude of Ps for the 208.5 m interval is 10.57 ± 0.28 MPa; therefore, the uncertainty of SH, which is three times that of Sh, does not exceed ± 0.84 MPa under the assumption that Pr is reliably derived from the pressure–time curve, consistent with the allowable accuracy range of the HF method [51]. We also calculated the uncertainties of all Sh for the XL borehole and found that the maximum uncertainty of Sh is less than ±0.30 MPa, under a Sh in the range of 5.31–17.84 MPa [56]. For the determination of Pr, the tangent method was utilized [59], which is achieved by using automatic software to reduce the subjectivity uncertainty. The results of the HF measurements in the XL and CD boreholes are summarized in Table 1.

3.3. In-Situ Stress Data Compilation

In addition to the newly obtained stress data from the XL and CD boreholes, we also collected stress data from the Pingdu (PD) and Gaizhou (GZ) sites. The PD borehole is located south of the XL borehole, meaning that it is on the eastern side of the TLFZ but farther from the ZBFZ compared with the XL borehole. The GZ borehole is in the northern part of the strait and is also situated on the eastern side of the TLFZ. It should also be noted here that both the PD and GZ boreholes are predominantly composed of granite. These four boreholes collectively create a borehole profile across the Bohai Strait (Figure 1). The in-situ stress data of these four boreholes are summarized in Table 1.

4. Results

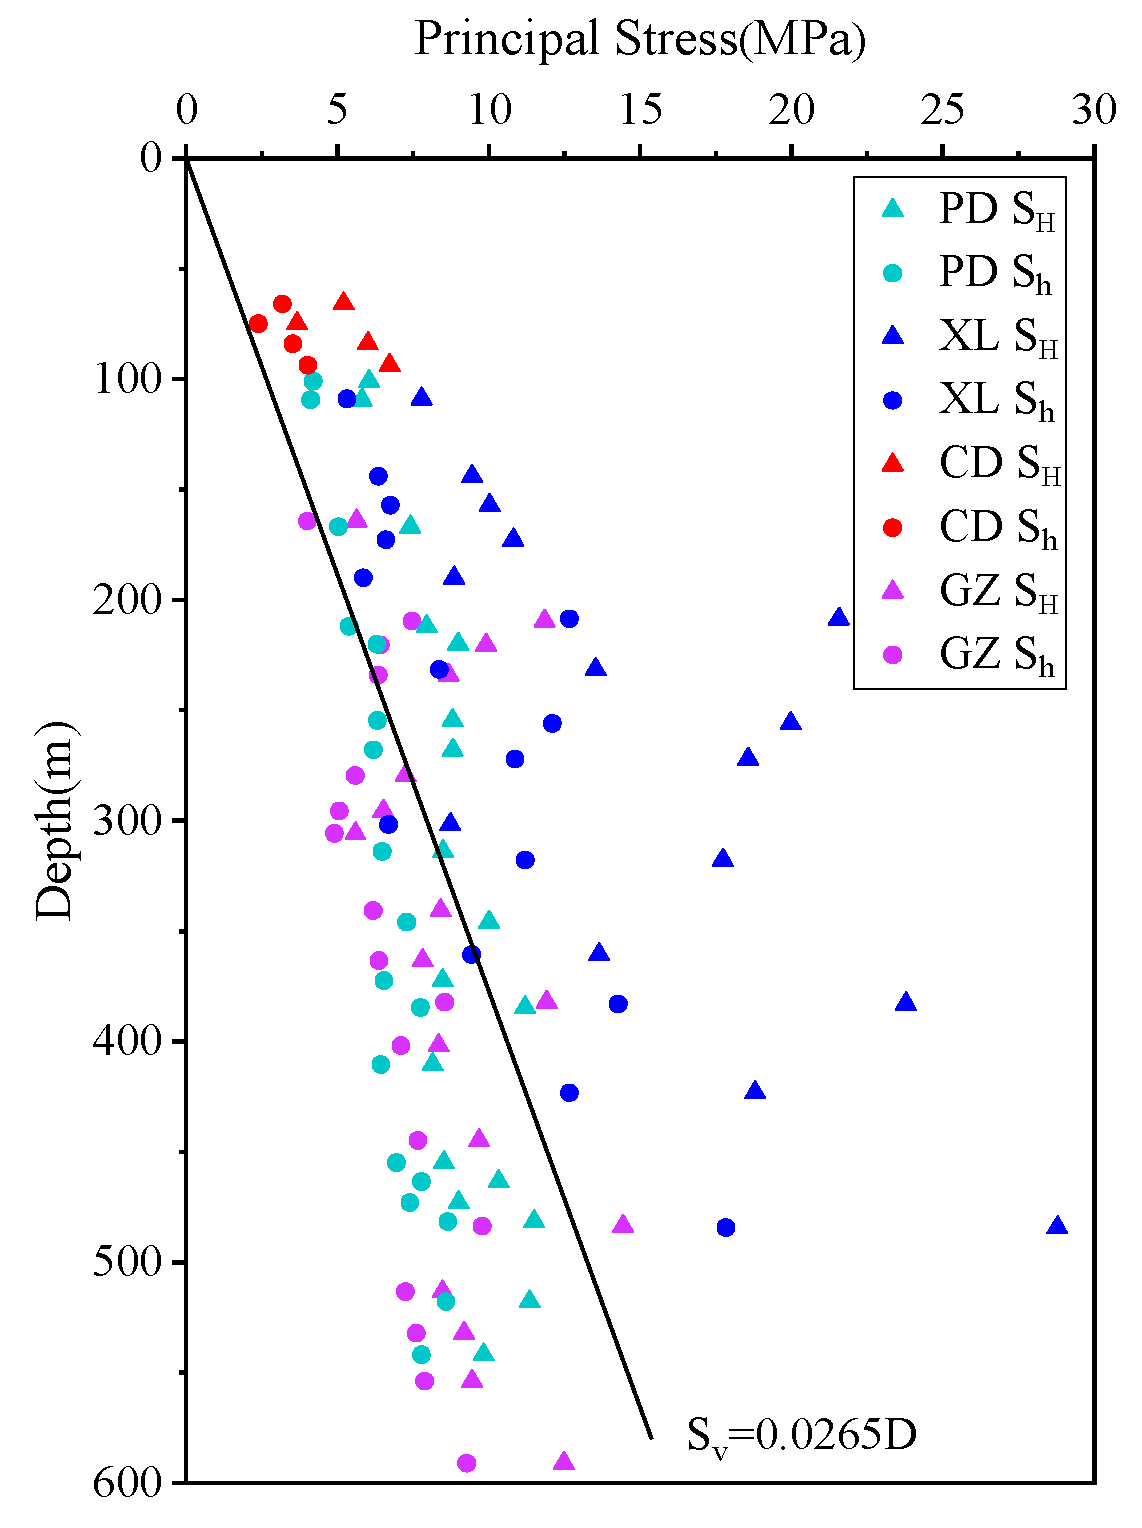
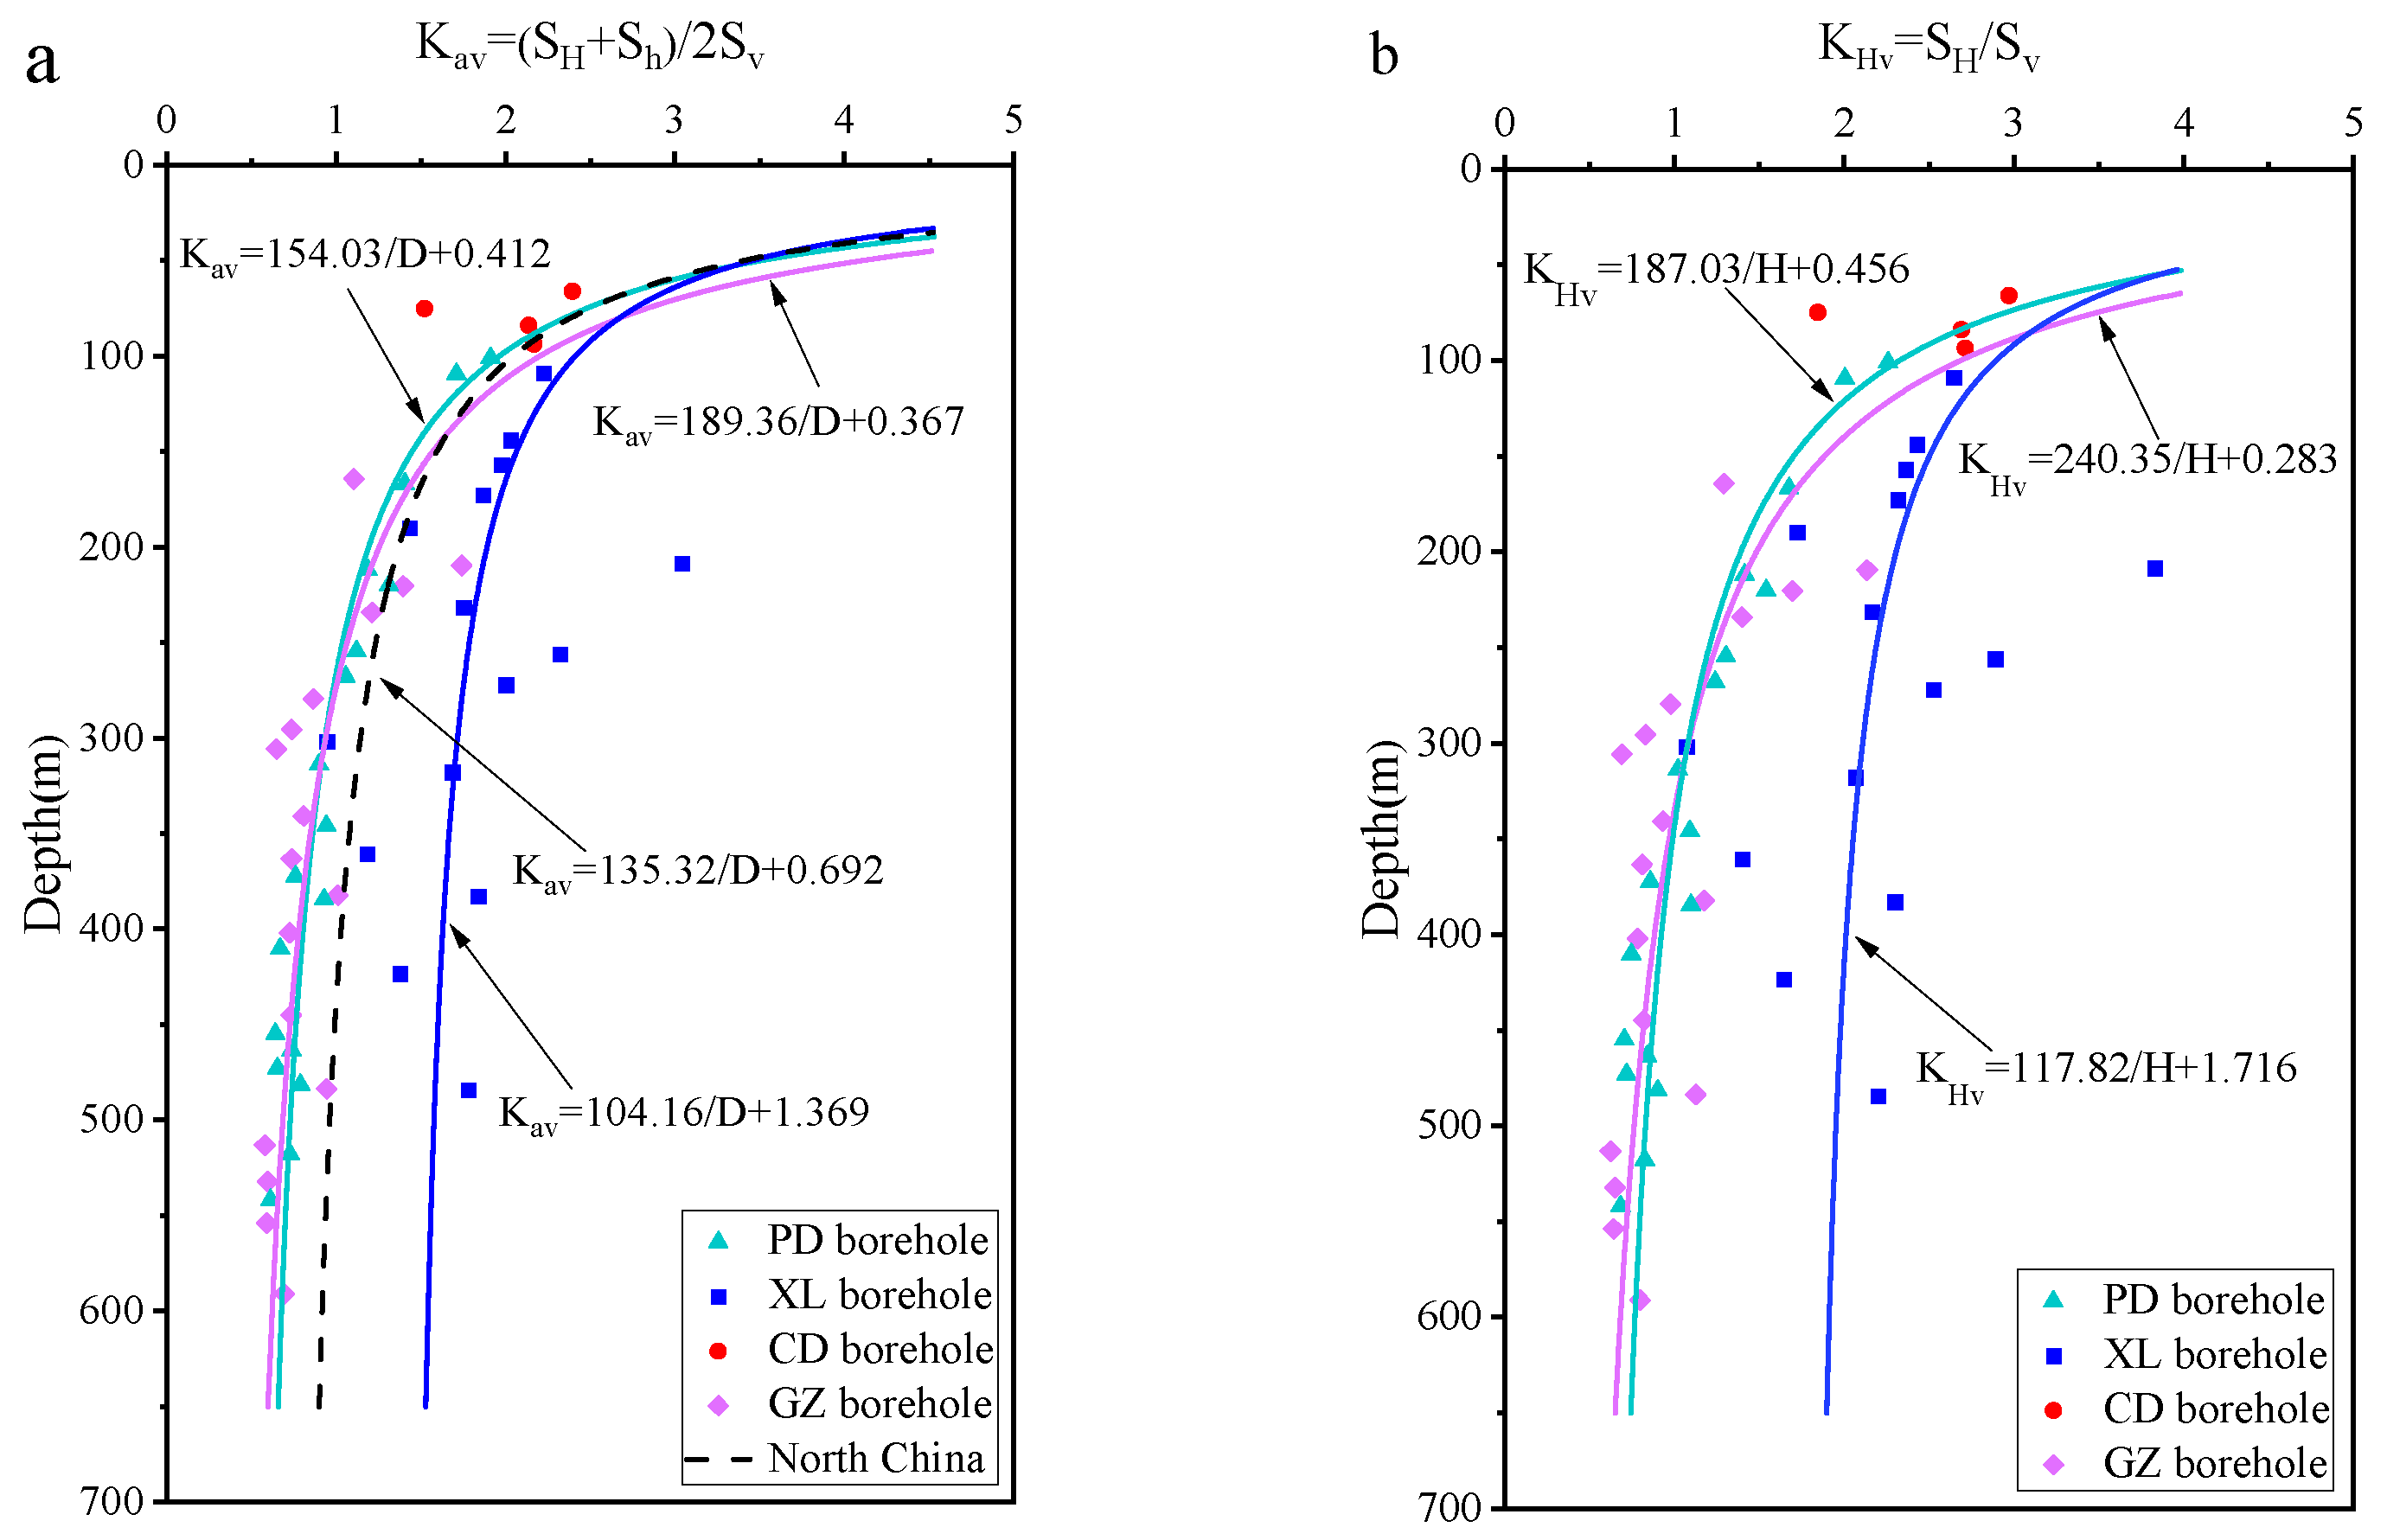
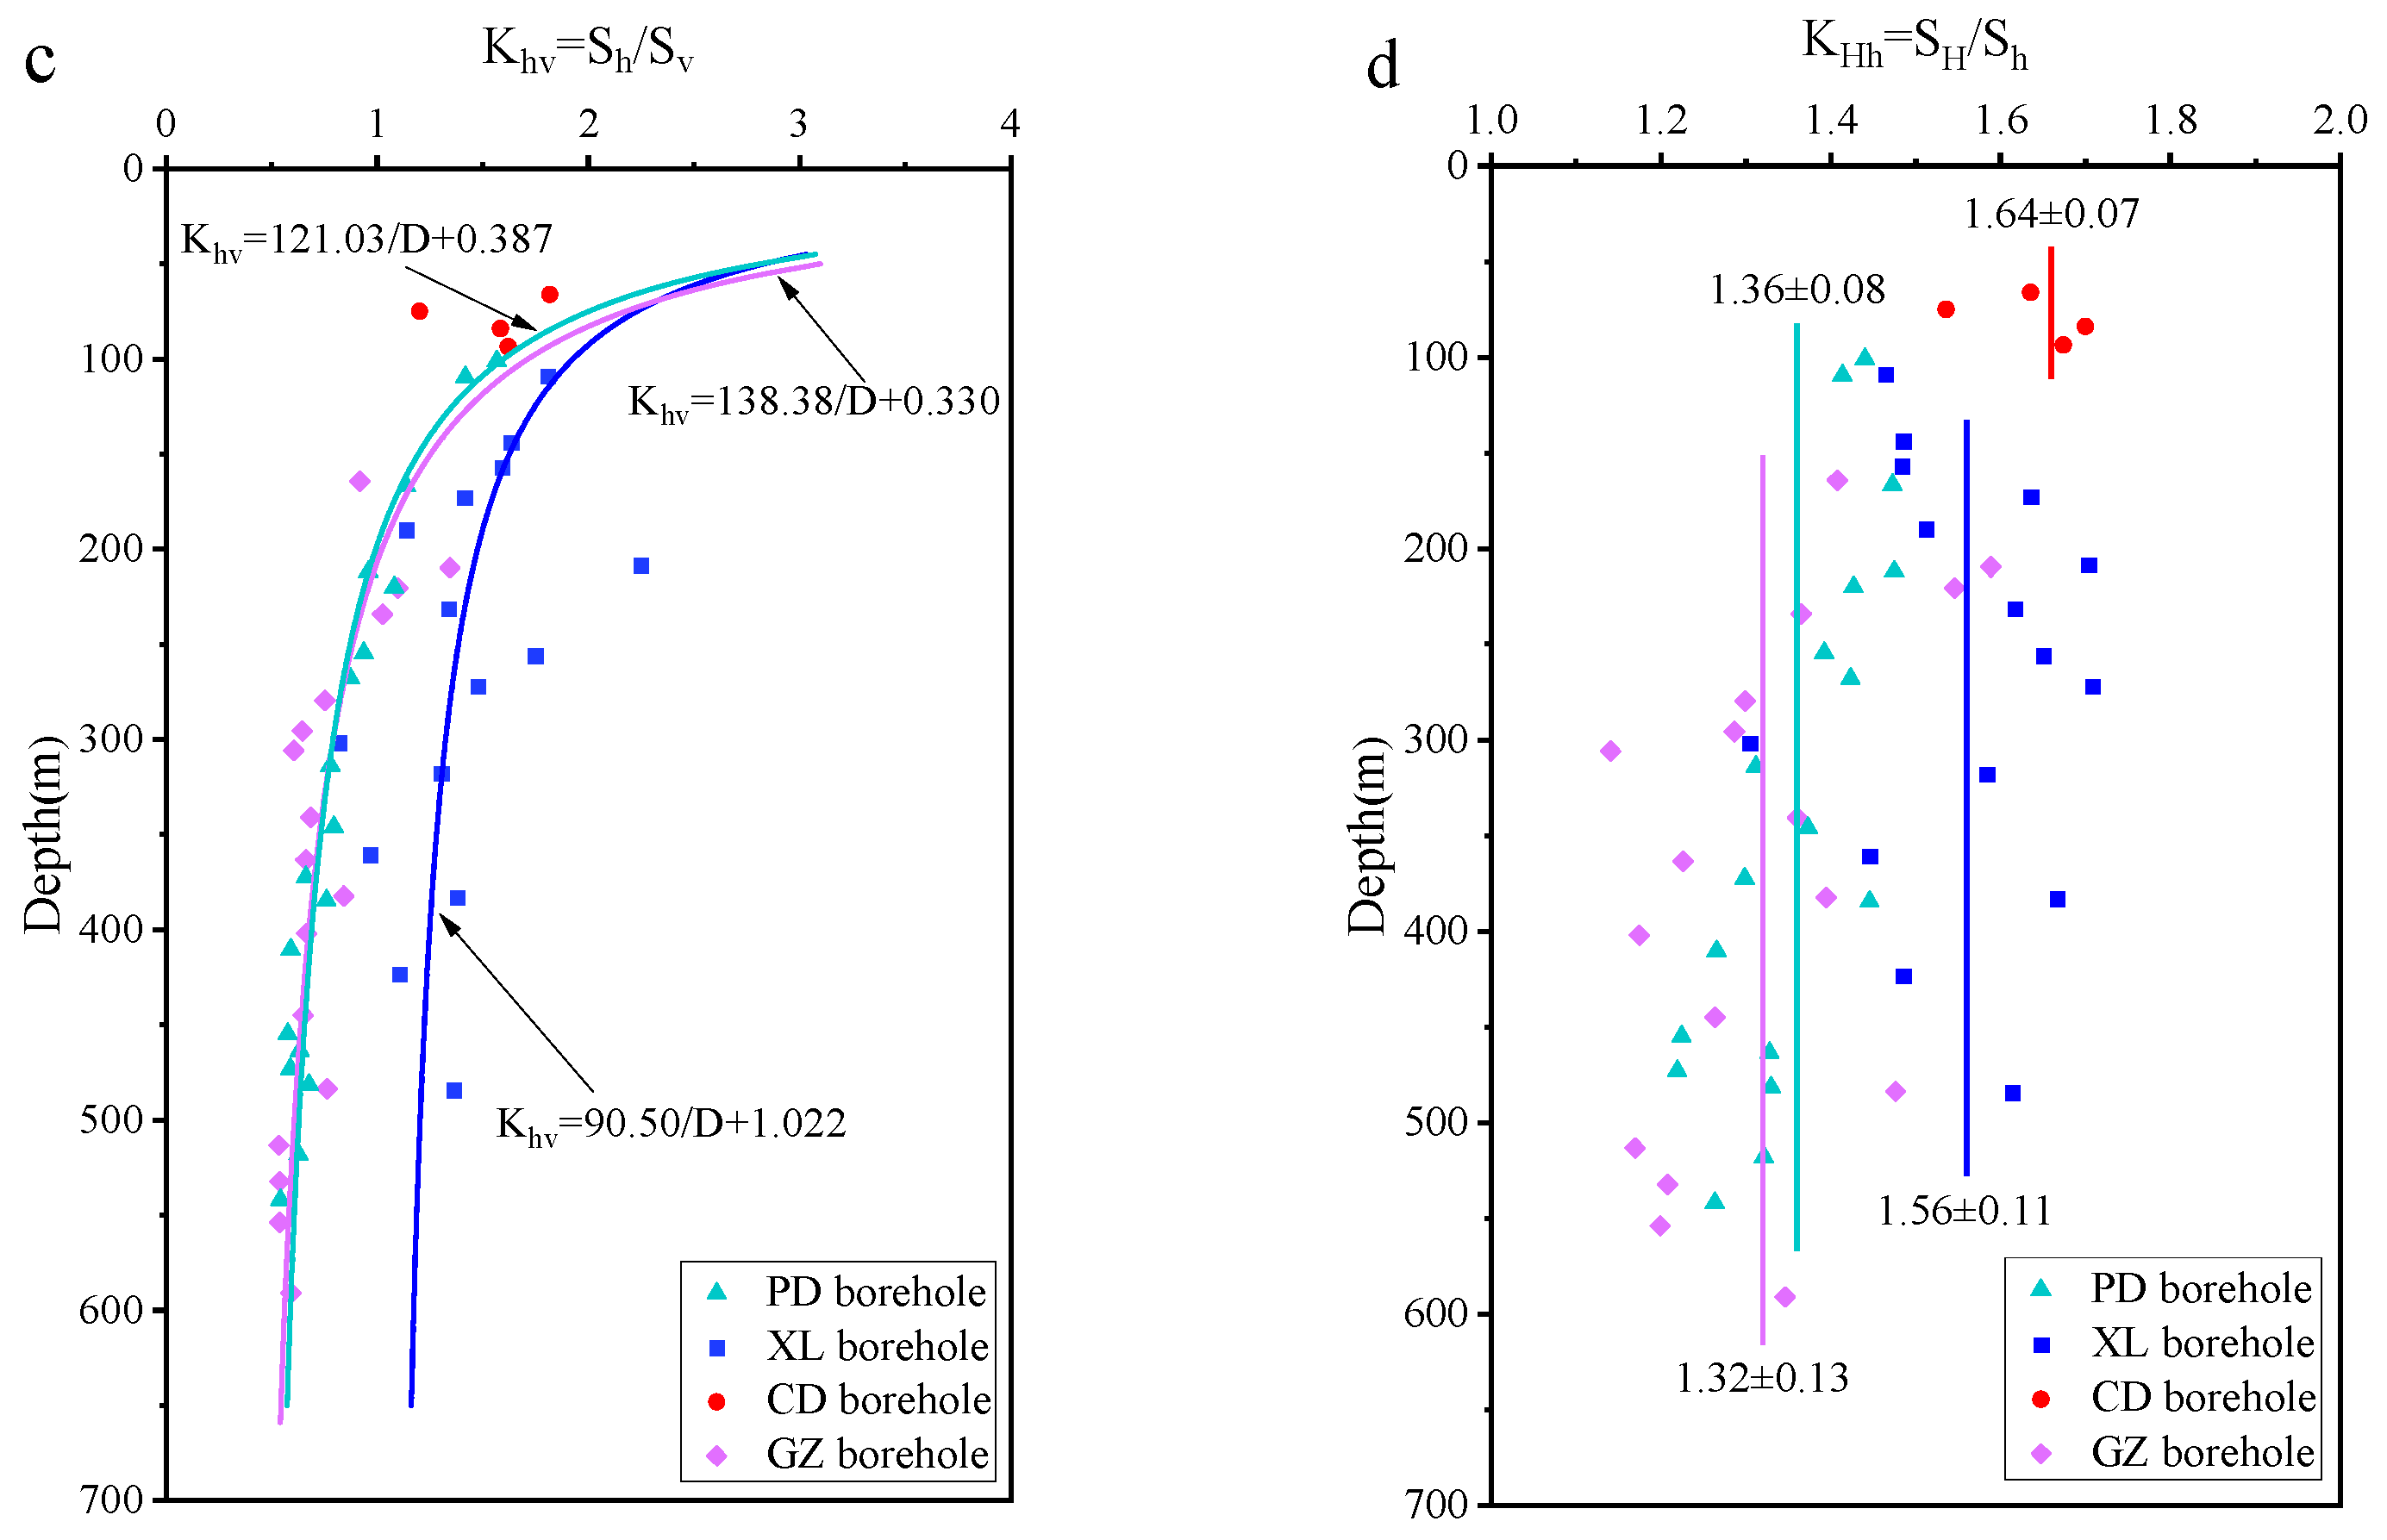
4.1. Stress Magnitudes

Based on the above in-situ stress data, we first analyzed the distribution characteristics of principal stresses with depth across the Bohai Strait. Linear regression was applied to calculate the depth-dependent variations of SH and Sh (Table 2 and Figure 5). The CD borehole dataset is limited, introducing some uncertainty in its results. However, its stress distribution trend aligns with other boreholes, supporting the reliability of our data. The results show that SH and Sh in the PD borehole range from 5.81 to 11.49 MPa and from 4.11 to 8.59 MPa, with the gradients of 0.90 MPa/100 m and 0.86 MPa/100 m, respectively. SH and Sh in the GZ borehole range from 4.38 to 14.44 MPa and from 3.10 to 9.78 MPa, with the gradients of 1.15 MPa/100 m and 1.01 MPa/100 m, respectively. SH and Sh in the XL borehole range from 7.78 to 28.79 MPa and from 5.31 to 17.84 MPa, with the gradients of 4.29 MPa/100 m and 2.70 MPa/100 m, respectively. SH and Sh in the CD borehole range from 3.67 to 6.73 MPa and from 2.39 to 4.02 MPa, with the gradients of 7.58 MPa/100 m and 4.01 MPa/100 m, respectively.
We compared the depth-dependent variations of stress in the Bohai Strait with the North China Block, where SH and Sh exhibit gradients of 2.29 MPa/100 m and 1.70 MPa/100 m, respectively. It was found that the gradients of SH and Sh for the PD borehole is only 39.3% and 50.6% of those of the North China Block, respectively. The gradients of SH and Sh for the GZ borehole are approximately 50.2% and 59.4% of those of the North China Block. In contrast, the gradients of SH and Sh for the XL and CD boreholes are 187.3% and 158.8% and 331.0% and 235.8% larger than the North China Block, respectively. This indicates that the stress values in the XL and CD sites are higher than those of the PD and GZ within the same depth range. Moreover, the stress level gradually increases from the PD to the XL and then to the CD, i.e., from south to north. In detail, the gradients of SH for the CD and XL boreholes are 8.42 and 4.77 times that of the PD borehole, and the gradients of Sh for the CD and XL boreholes are 4.66 and 3.14 times that of the PD borehole. Considering the tectonic framework and fault pattern in the Bohai Strait (Figure 1), it is evident that the stress value gradually increases from the outer region of the strait to the inner area of the strait.
We further analyzed the stress state across the Bohai Strait using several commonly adopted parameters, including the lateral stress coefficient Kav, as shown in Equation (4) [60], the horizontal stress ratios KHv (Equation (5)) and Khv (Equation (6)), and the parameter KHh (Equation (7)), which indirectly reflects the stress difference in the horizontal direction. The fitting results of these four parameters are plotted in Figure 6. It should be noted here that these fitting equations were not applied to the CD borehole because of the insufficient data availability but are presented as points in the corresponding figure. Undoubtedly, this may raise uncertainties on the comparison, but given that these parameters usually show a relatively large distribution pattern near the surface, this may not overturn the findings drawn in this study.
K a v = S H + S h S v
K H v = S H S v
K h v = S h S v
K H h = S H S h
The results indicate that Kav values for the PD, CD, and GZ boreholes gradually increase with depth and finally approach 0.37, 0.41, and 1.37, respectively (Figure 6a). Comparison between these three boreholes and the North China Block, which approaches 0.69 [61], reveals that the Kav values for the GZ and PD boreholes were only 53.7% and 59.4% of those in the North China Block, respectively, while the XL exhibits a Kav value 1.99 times higher than that of the North China Block. It can also be seen that the Kav values in the CD site are larger than the North China Block, even though they were just plotted in scatter form in Figure 6b. The Kav features obtained here are consistent with those of SH and Sh values.
As shown in Figure 6b, the KHv values are mainly in the range of 0.68–2.26, with a best-fitting constant of 0.46 in the PD borehole, and the KHv values are mainly in 0.62–3.46, with a best-fitting constant of 0.49 in the GZ borehole. However, the KHv values are mainly in 1.09–3.90, with a best-fitting constant of 1.72 in the XL borehole, which is larger than those of the PD and GZ boreholes. The KHv values in the CD borehole are mainly in 1.85–2.97, also larger than those in PD and GZ. The Khv values are mainly in 0.53–1.57, with a best-fitting constant of 0.38 in the PD borehole, and KHv values are mainly in 0.53–2.37, with a best-fitting constant of 0.41 in the GZ borehole, while the KHv values are mainly in 0.58–2.29, with a best-fitting constant of 1.02 in the XL borehole. The Khv values are mainly in 1.20–1.82 in the CD borehole (Figure 6c), larger than the other three sites. It can be seen here that the distributions of the KHv and Khv show similar features to those of the stress values of SH and Sh, and the parameter Kav, that is, the closer to the intersection of the TLFZ and ZBFZ, the larger the values.
KHh shows different features and cannot be fitted using the approach used for the above three parameters because they are considerably scattered, as shown in Figure 6d. Therefore, we adopted the mean values to analyze their distribution patterns. The mean values of KHh of the GZ, PD, XL, and CD boreholes are 1.32, 1.36, 1.56, and 1.64, respectively, revealing a similar feature as the above-mentioned parameters. This reflects that the differential stress in the horizontal direction increases as it approaches the intersection of the two large faults.

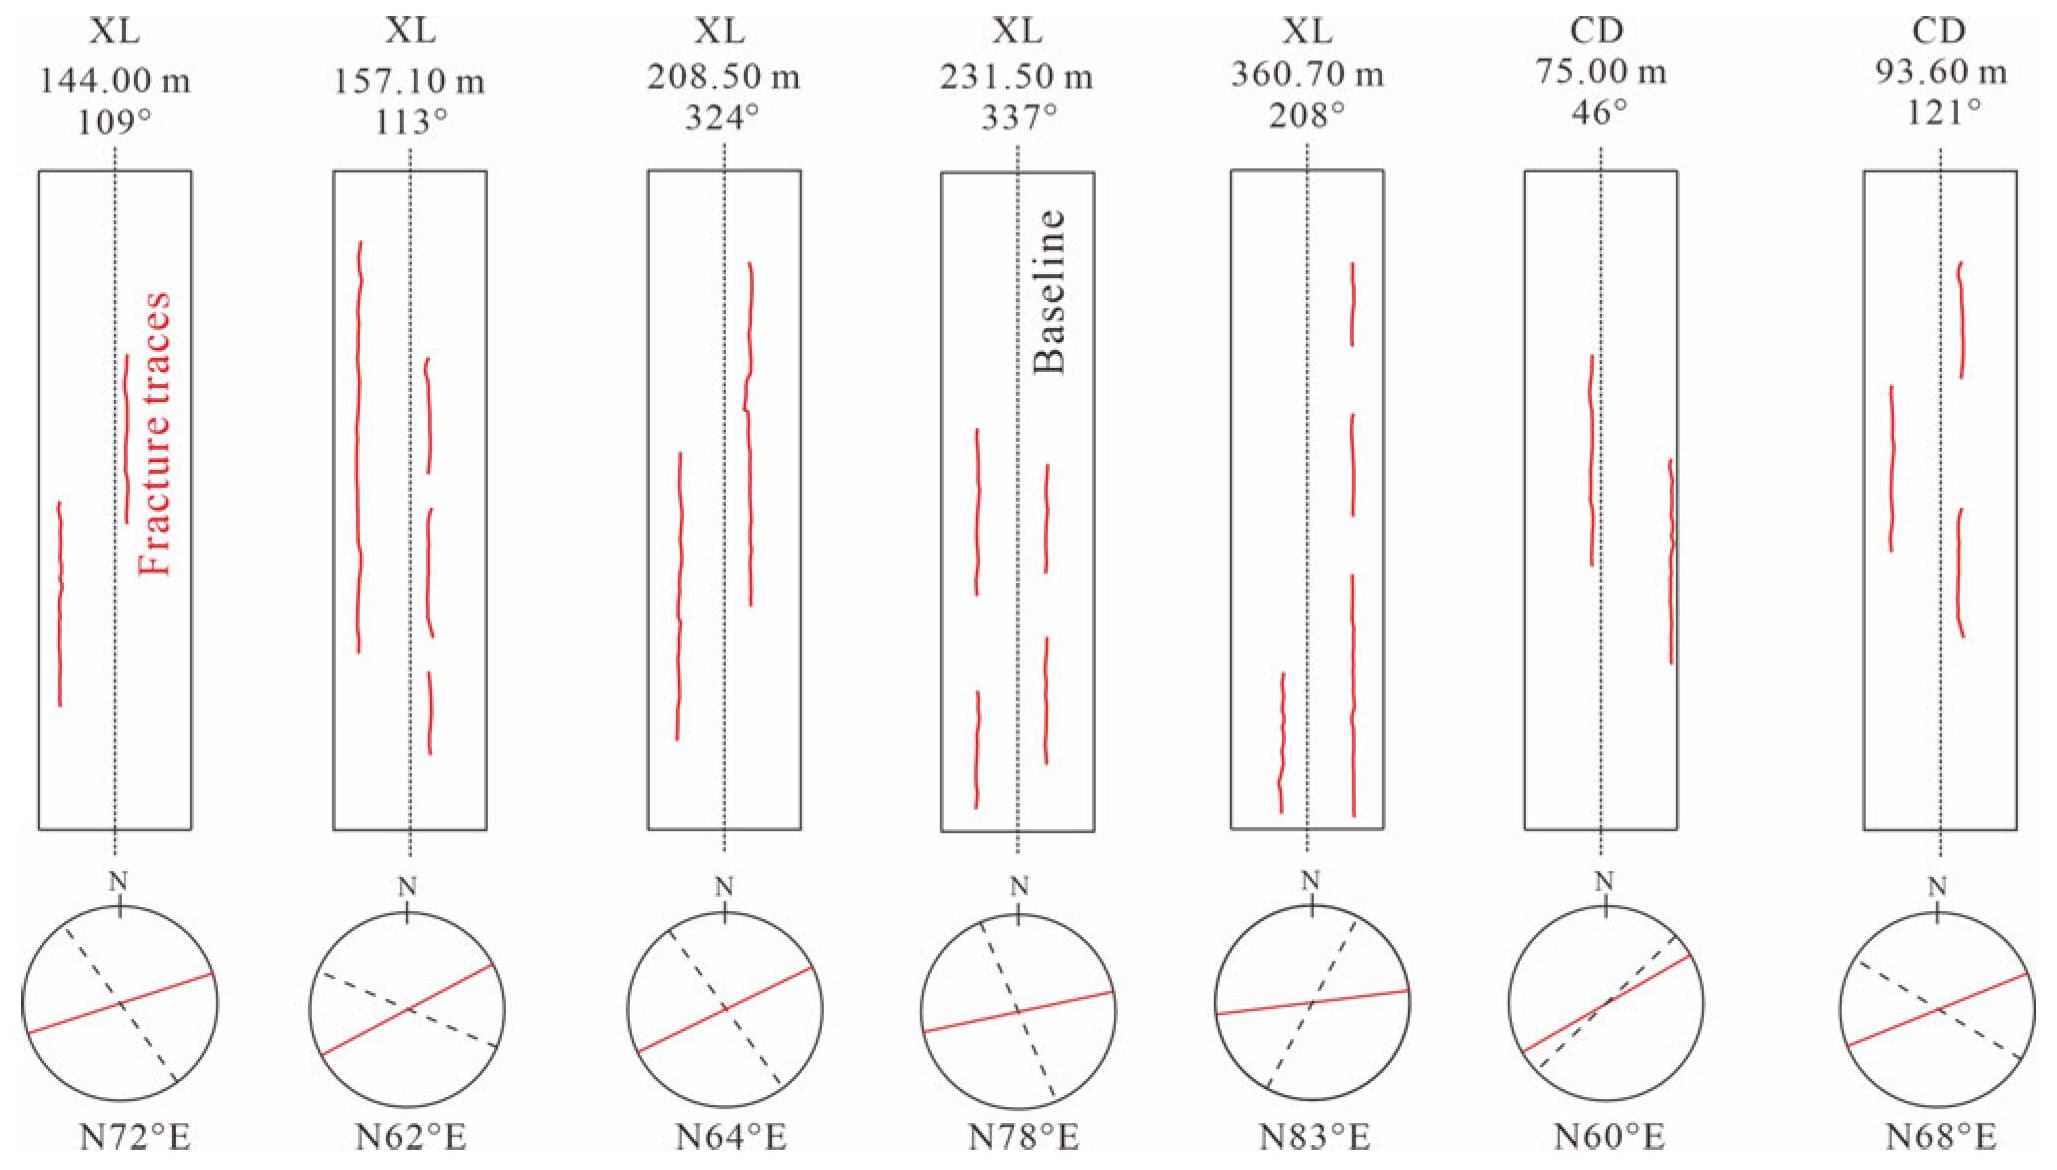
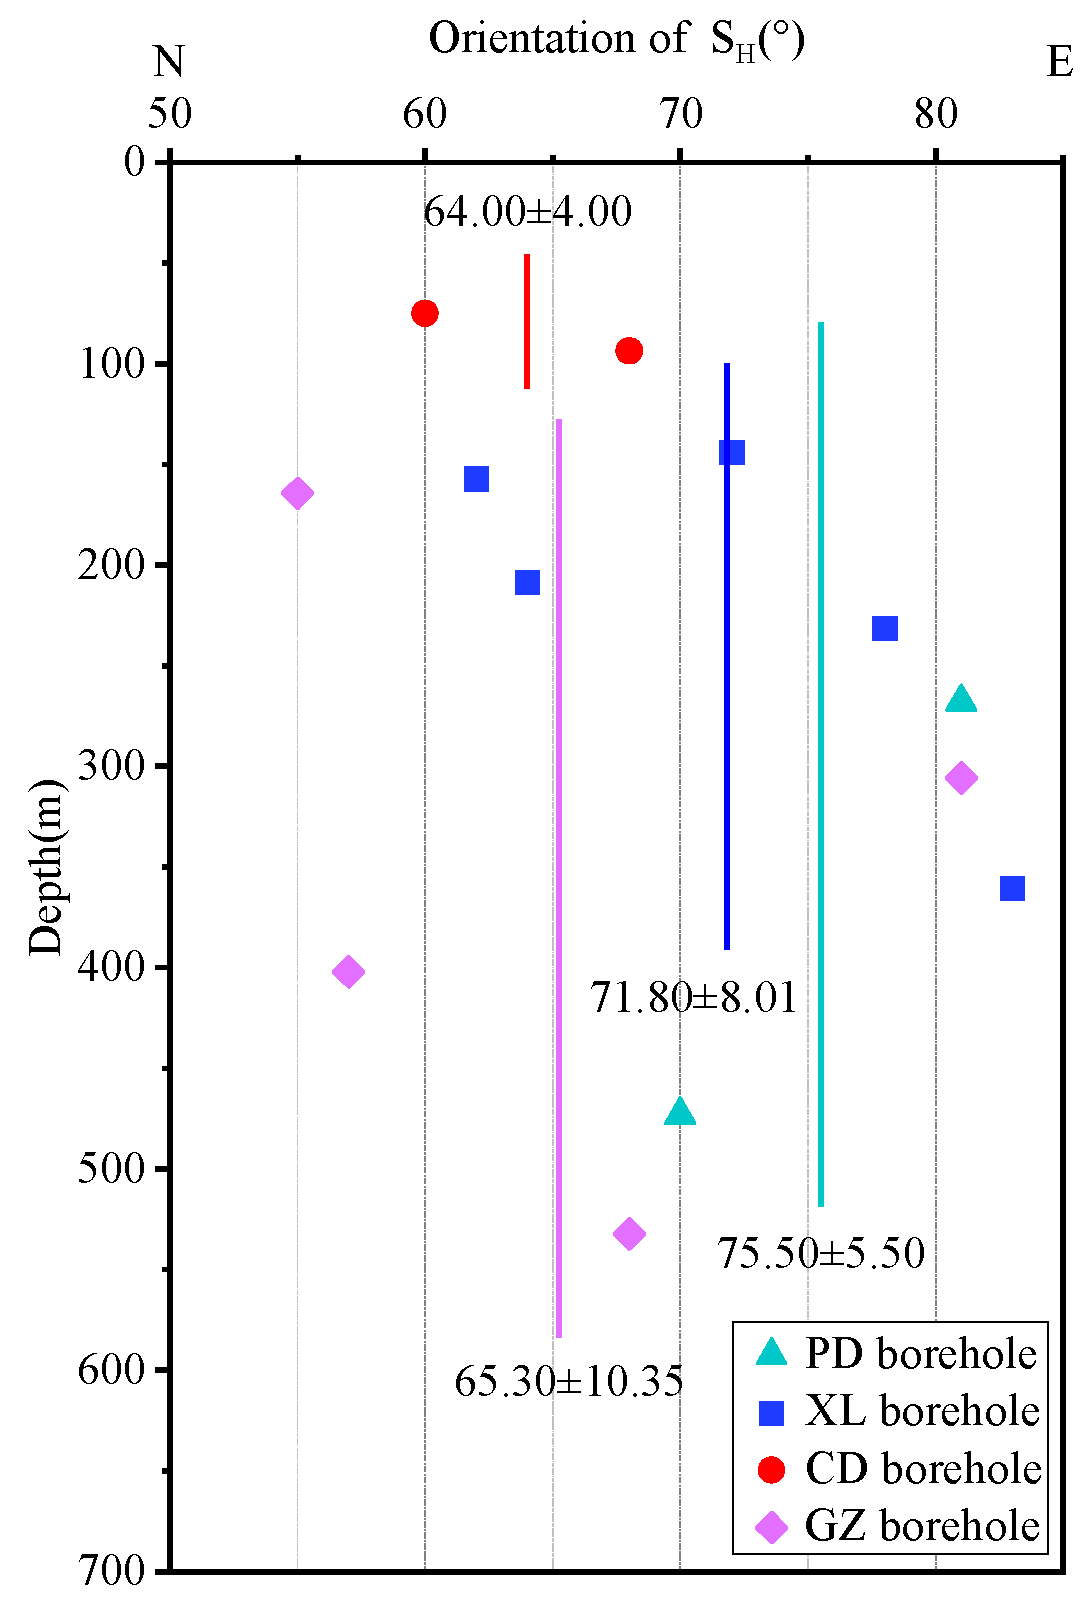
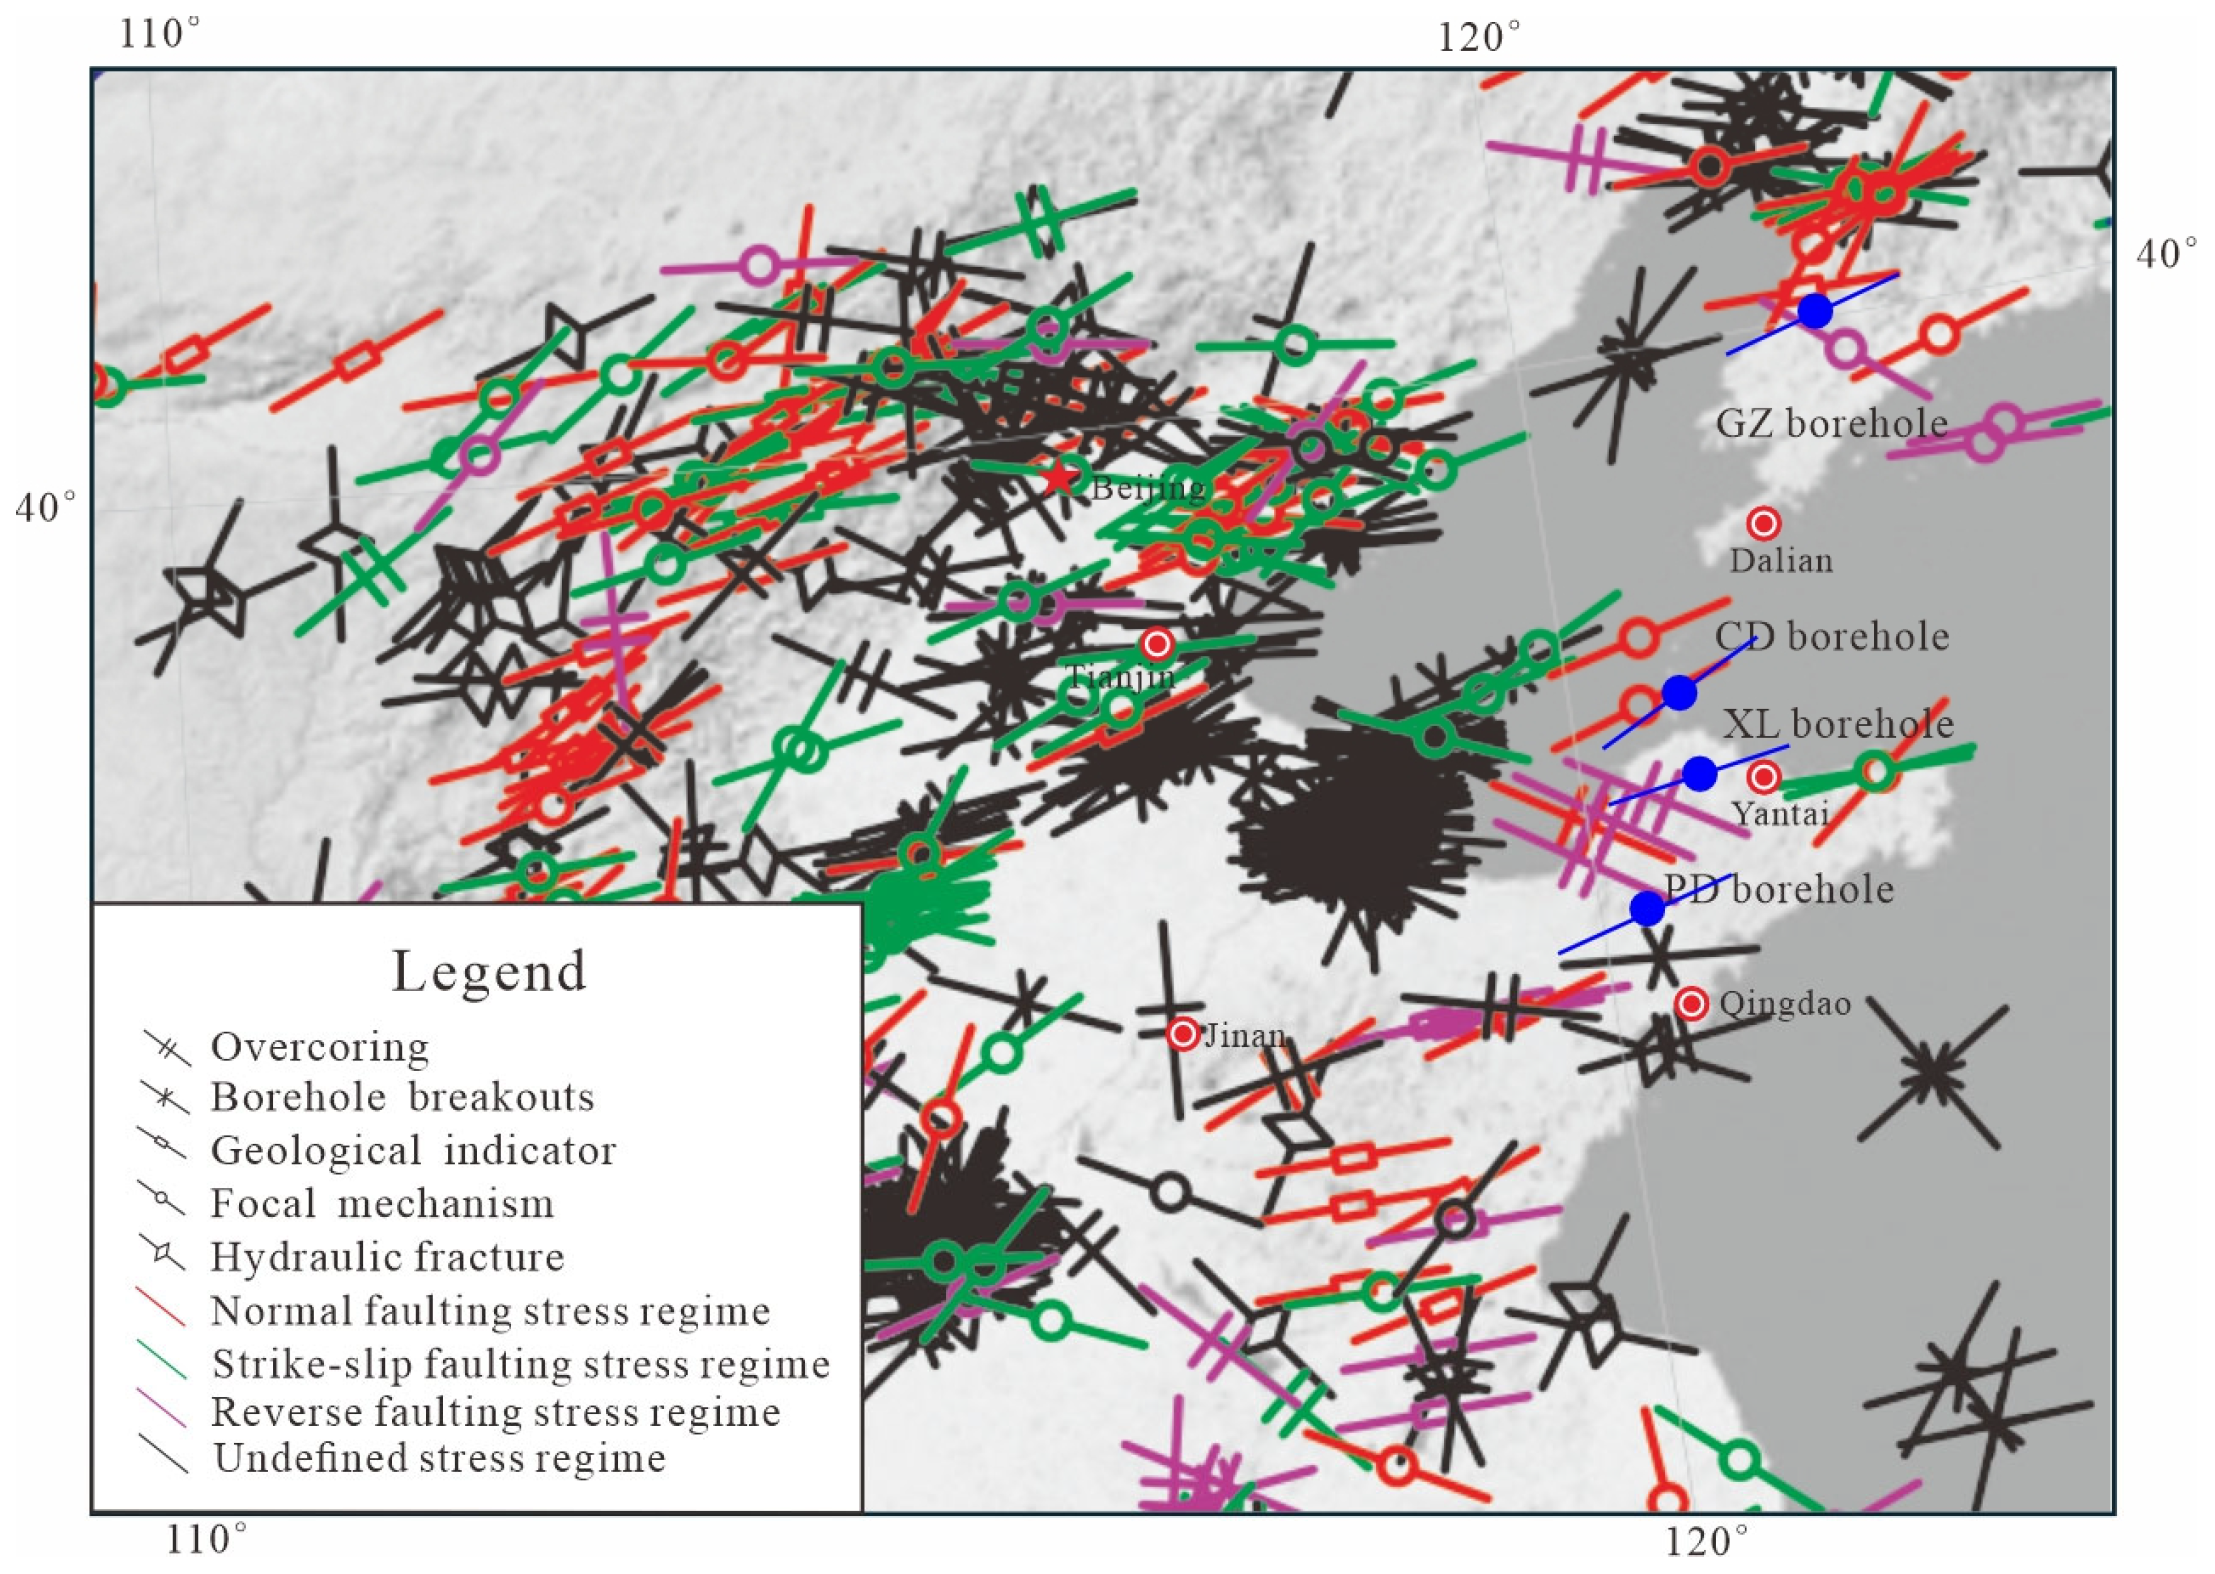
4.2. Stress Orientations
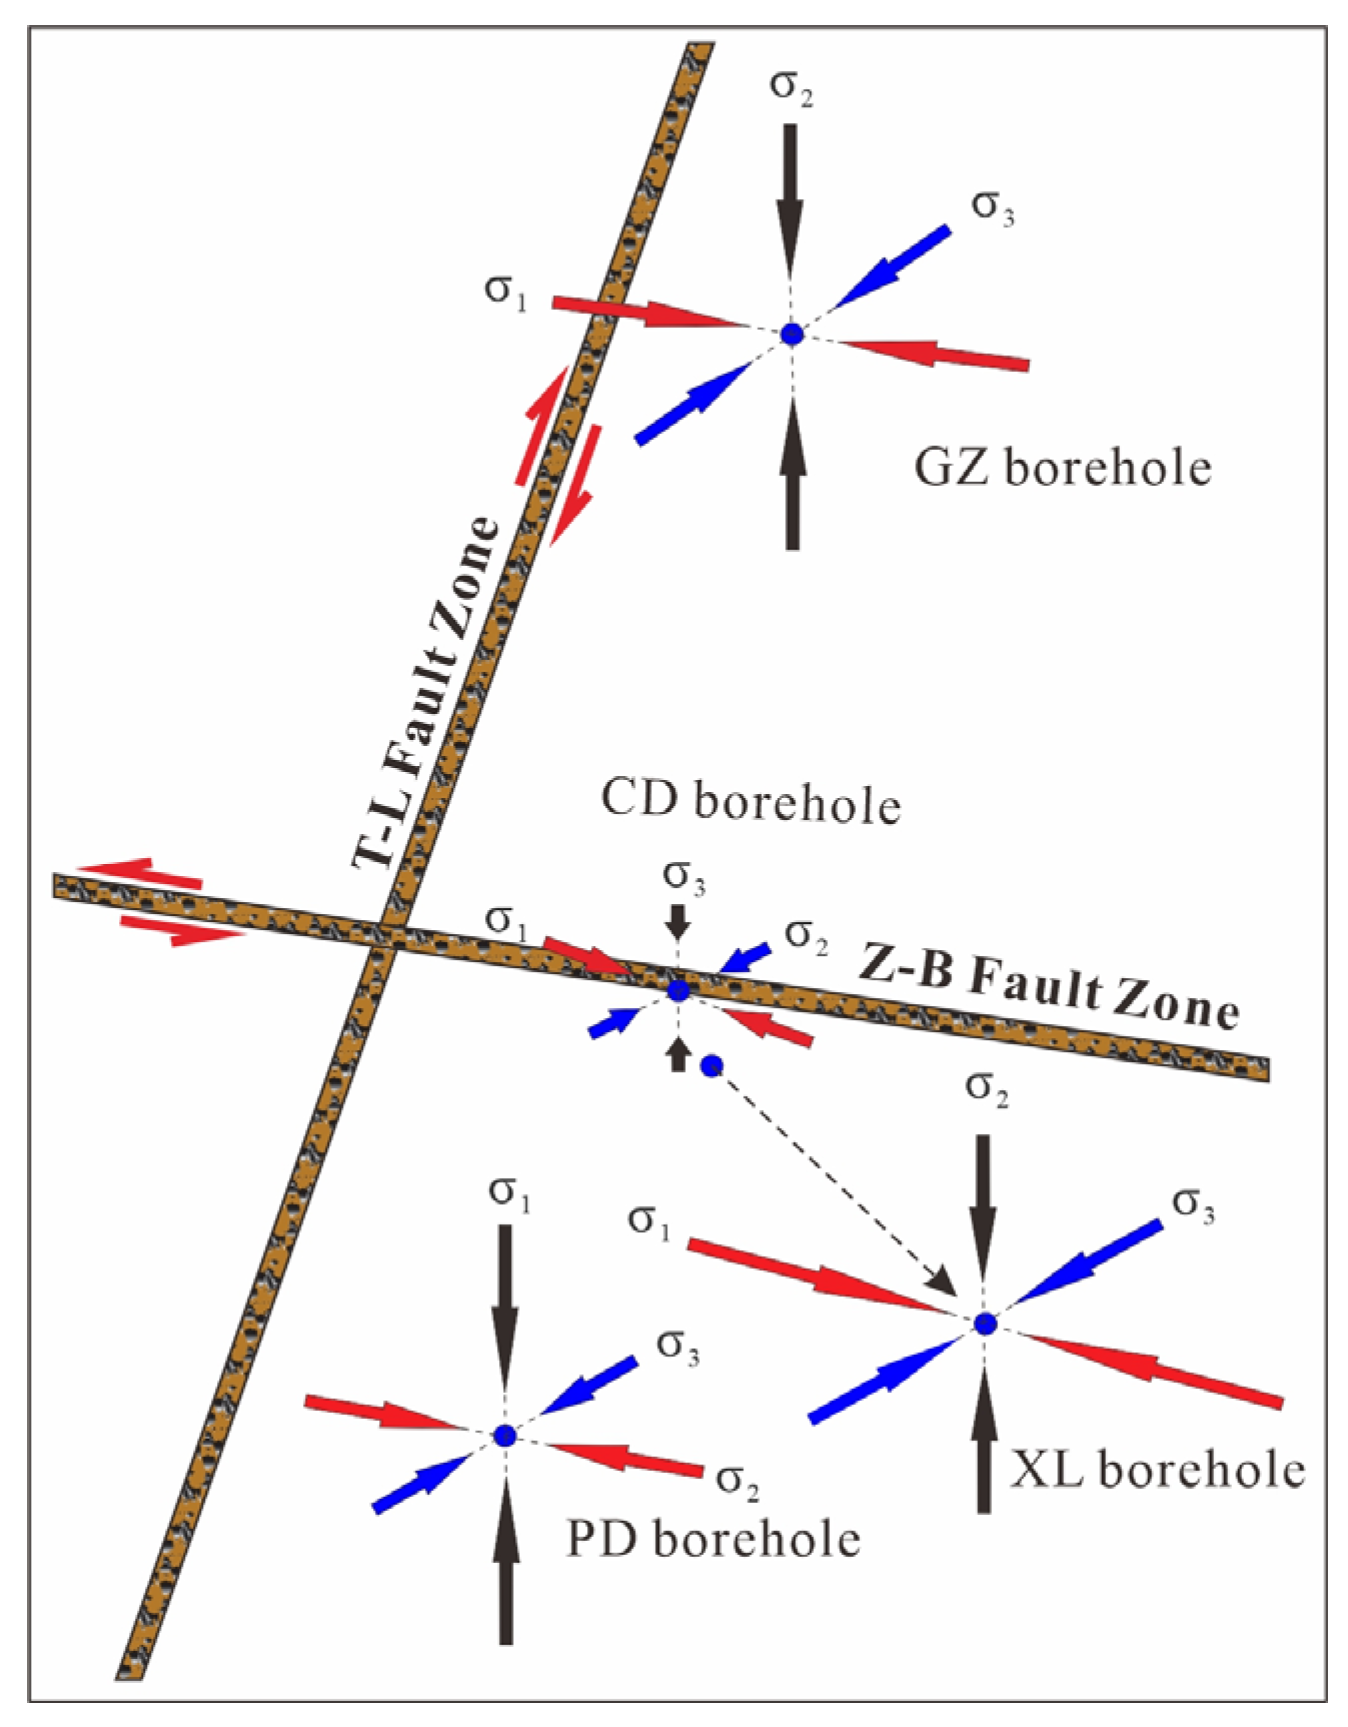
We summarized all the SH orientations obtained from HF tests and plotted them in a vertical profile (Figure 7). The results revealed that the SH orientations for PD, XL, CD, and GZ are N75.50 ± 5.50° E, N71.80 ± 8.01° E, N64.00 ± 4.00° E, and N65.30 ± 10.35° E, respectively. The overall mean azimuth of SH is N68.67 ± 9.30° E, i.e., NE–NEE, except for two test intervals in the PD borehole, which are in an NWW orientation (Table 1). We did not plot these two data points on Figure 7, even though they are ~E-W oriented, which is also consistent with the regional stress. The mean azimuth of SH for the four boreholes is also plotted in Figure 7. We further compared the SH azimuths obtained in this study with the regional stress field, as shown in Figure 8, with emphasis on the mean orientation of the horizontal stress. The results indicate that the SH orientation in this study is consistent with the regional stress field in the North China region (i.e., NEE–~E-W) [62], which is determined using multiple stress indicators.

4.3. Stress Regimes

We estimated the stress regime for the Bohai Strait according to the Andersonian stress regime classification. Following this theory, the stress state can be classified as normal (Sv > SH > Sh), strike-slip (SH > Sv > Sh), and reverse (SH > Sh > Sv) faulting regimes [63]. The depth-dependent variation in horizontal stresses concerning the vertical stress (see Figure 8) reveals that the relationship between the principal stresses exhibits distinct types across all four boreholes. The relationship between the principal stresses in the PD borehole can be divided into SH > Sh > Sv at depths less than 220 m, SH > Sv > Sh at medium depths (250–390 m), and Sv > SH > Sh at depths below 410 m. It is argued that changes in stress regime in the PD site are attributed to the joints and fractures around and intersecting the borehole [22]. The GZ borehole exhibits SH > Sh > Sv at shallow depths (<235 m) and Sv > SH > Sh below 280 m depth. Stress variations in the GZ borehole are mainly controlled by regional tectonic stresses [23]. This finding aligns with current research showing normal faulting in the northern segment of the Jinzhou Fault Zone. In contrast, the XL and CD boreholes consistently show SH > Sh > Sv within the test depth, revealing a reverse faulting stress regime. The variation of stress regimes aligns well with the trend of the principal stresses and the characteristic parameters, but it is inconsistent with the regional feature (see Figure 8), which may be attributed to the data source.

5. Discussion

5.1. Relationship Between the Stress State and Tectonic Feature

In-situ stress mainly originates from tectonic stress [64], gravity [65], thermal stress [66], etc. It is influenced by topography [67,68], faulting [69,70,71], and lithological strength variations [72,73,74]. It is noted that stress states across different scales are governed by distinct conditions [2]. For the four boreholes in this study, the variation in topography is small. In detail, PD and XL show elevation differences of <20 m; the CD and GZ exhibit max. evaluation variations of <50 m. Previous studies [68,75] found that the influence of topographic relief is primarily controlled by elevation differences; therefore, its effect on the four boreholes in this study can be neglected. Additionally, core samples are mainly granitoid rocks and show no significant lithological variations along the entire depth. Combined with existing studies [56], the influence of lithology is also negligible. Thus, variations in stress states are likely associated with the tectonic framework, fault activity, etc., in the Bohai Strait region. We discuss the relation between the stress state and the tectonic framework of the Bohai Strait region. Previous studies reveal that the Bohai segment of the TLFZ currently exhibits dextral strike-slip motion, accompanied by a thrust component [25]. The Holocene activity intensity in the central Bohai segment is greater than that in the Liaodong segment to the north and the Laizhou Bay segment to the south. The ZBFZ exhibited dextral strike-slip activity from the Mesozoic to the Early Paleogene and has transitioned into sinistral strike-slip since the Late Paleogene [76] or the Neogene [77,78]. The current stress field in North China is predominantly characterized by NEE compressive stress, which is induced by the lateral subduction of the Pacific Plate beneath the Eurasian Plate in conjunction with NW-directed compression from the Philippine Plate. Under such an NEE-oriented stress field, the NWW-trending ZBFZ is more prone to strike-slip motion, whereas the NNE-trending TLFZ exhibits a weaker compressive pattern, due to the relatively weak regional compressive stress, as proven by Chen et al. [17] and Huang et al. [79]. Moreover, the stress is likely to accumulate in the intersection region of the TLFZ and ZBFZ, particularly in the southeastern and southwestern quadrants of the intersection zone. Among the four boreholes, the GZ and PD boreholes are located far from the fault intersection zone, resulting in minimal deviations in stress magnitude and stress regime from the regional stress field. In contrast, the XL and CD boreholes, situated in the southeastern quadrant of the fault intersection zone, exhibit higher stress magnitudes. The stress regimes in the XL and CD sites, which are predominantly reverse faulting regimes, contrast with the strike-slip and normal faulting stress regimes that dominate in North China.
Furthermore, we estimated the maximum horizontal shear stress, i.e., (τ = S1S3)/2 at 500 m depth across the Bohai Strait, based on the measured stress data. The results indicate that a progressive decrease in the maximum horizontal shear stress is observed with increasing proximity to the ZBFZ (Figure 9). The shear stresses decrease from 8.57 MPa in the CD site (i.e., closest to the ZBFZ) to 1.17 MPa in the GZ site (i.e., farthest from the ZBFZ), showing an 86.3% reduction. This is contrary to the findings in the San Andreas fault and the Longmenshan fault belt [80]. We speculate that such uniqueness is related to the intersection of the TLFZ and ZBFZ, since previous studies have focused on the single major fault zones, but the Bohai Strait area is influenced by two interacting faults. A quantitative study using numerical simulation method, which is to be performed in the future, will further verify the inference. The stress distribution patterns observed here are consistent with the seismicity feature across the Bohai Strait and the adjacent region. Earthquakes mainly cluster near the southern margin of the strait and concentrate within fault intersection zones. To further illustrate the relation between the stress state and the geological framework across the Bohai Strait, we express the stress state and its relative locations of the faults in a schematic form (Figure 10). The diagram is plotted by normalizing horizontal stress values against vertical stress as a reference. It was found that the variation in stress state across the Bohai Strait aligns with the vertical deformation rate along the NE-NEE-trending faults from south to north. In detail, it reveals an enhancement of compressive stress from north to south and a trend of increasing activity of NW-trending faults from west to east [81]. Collectively, it was concluded that the variations in stress state across the Bohai Strait are mainly controlled by the intersection of the TLFZ and the ZBFZ.

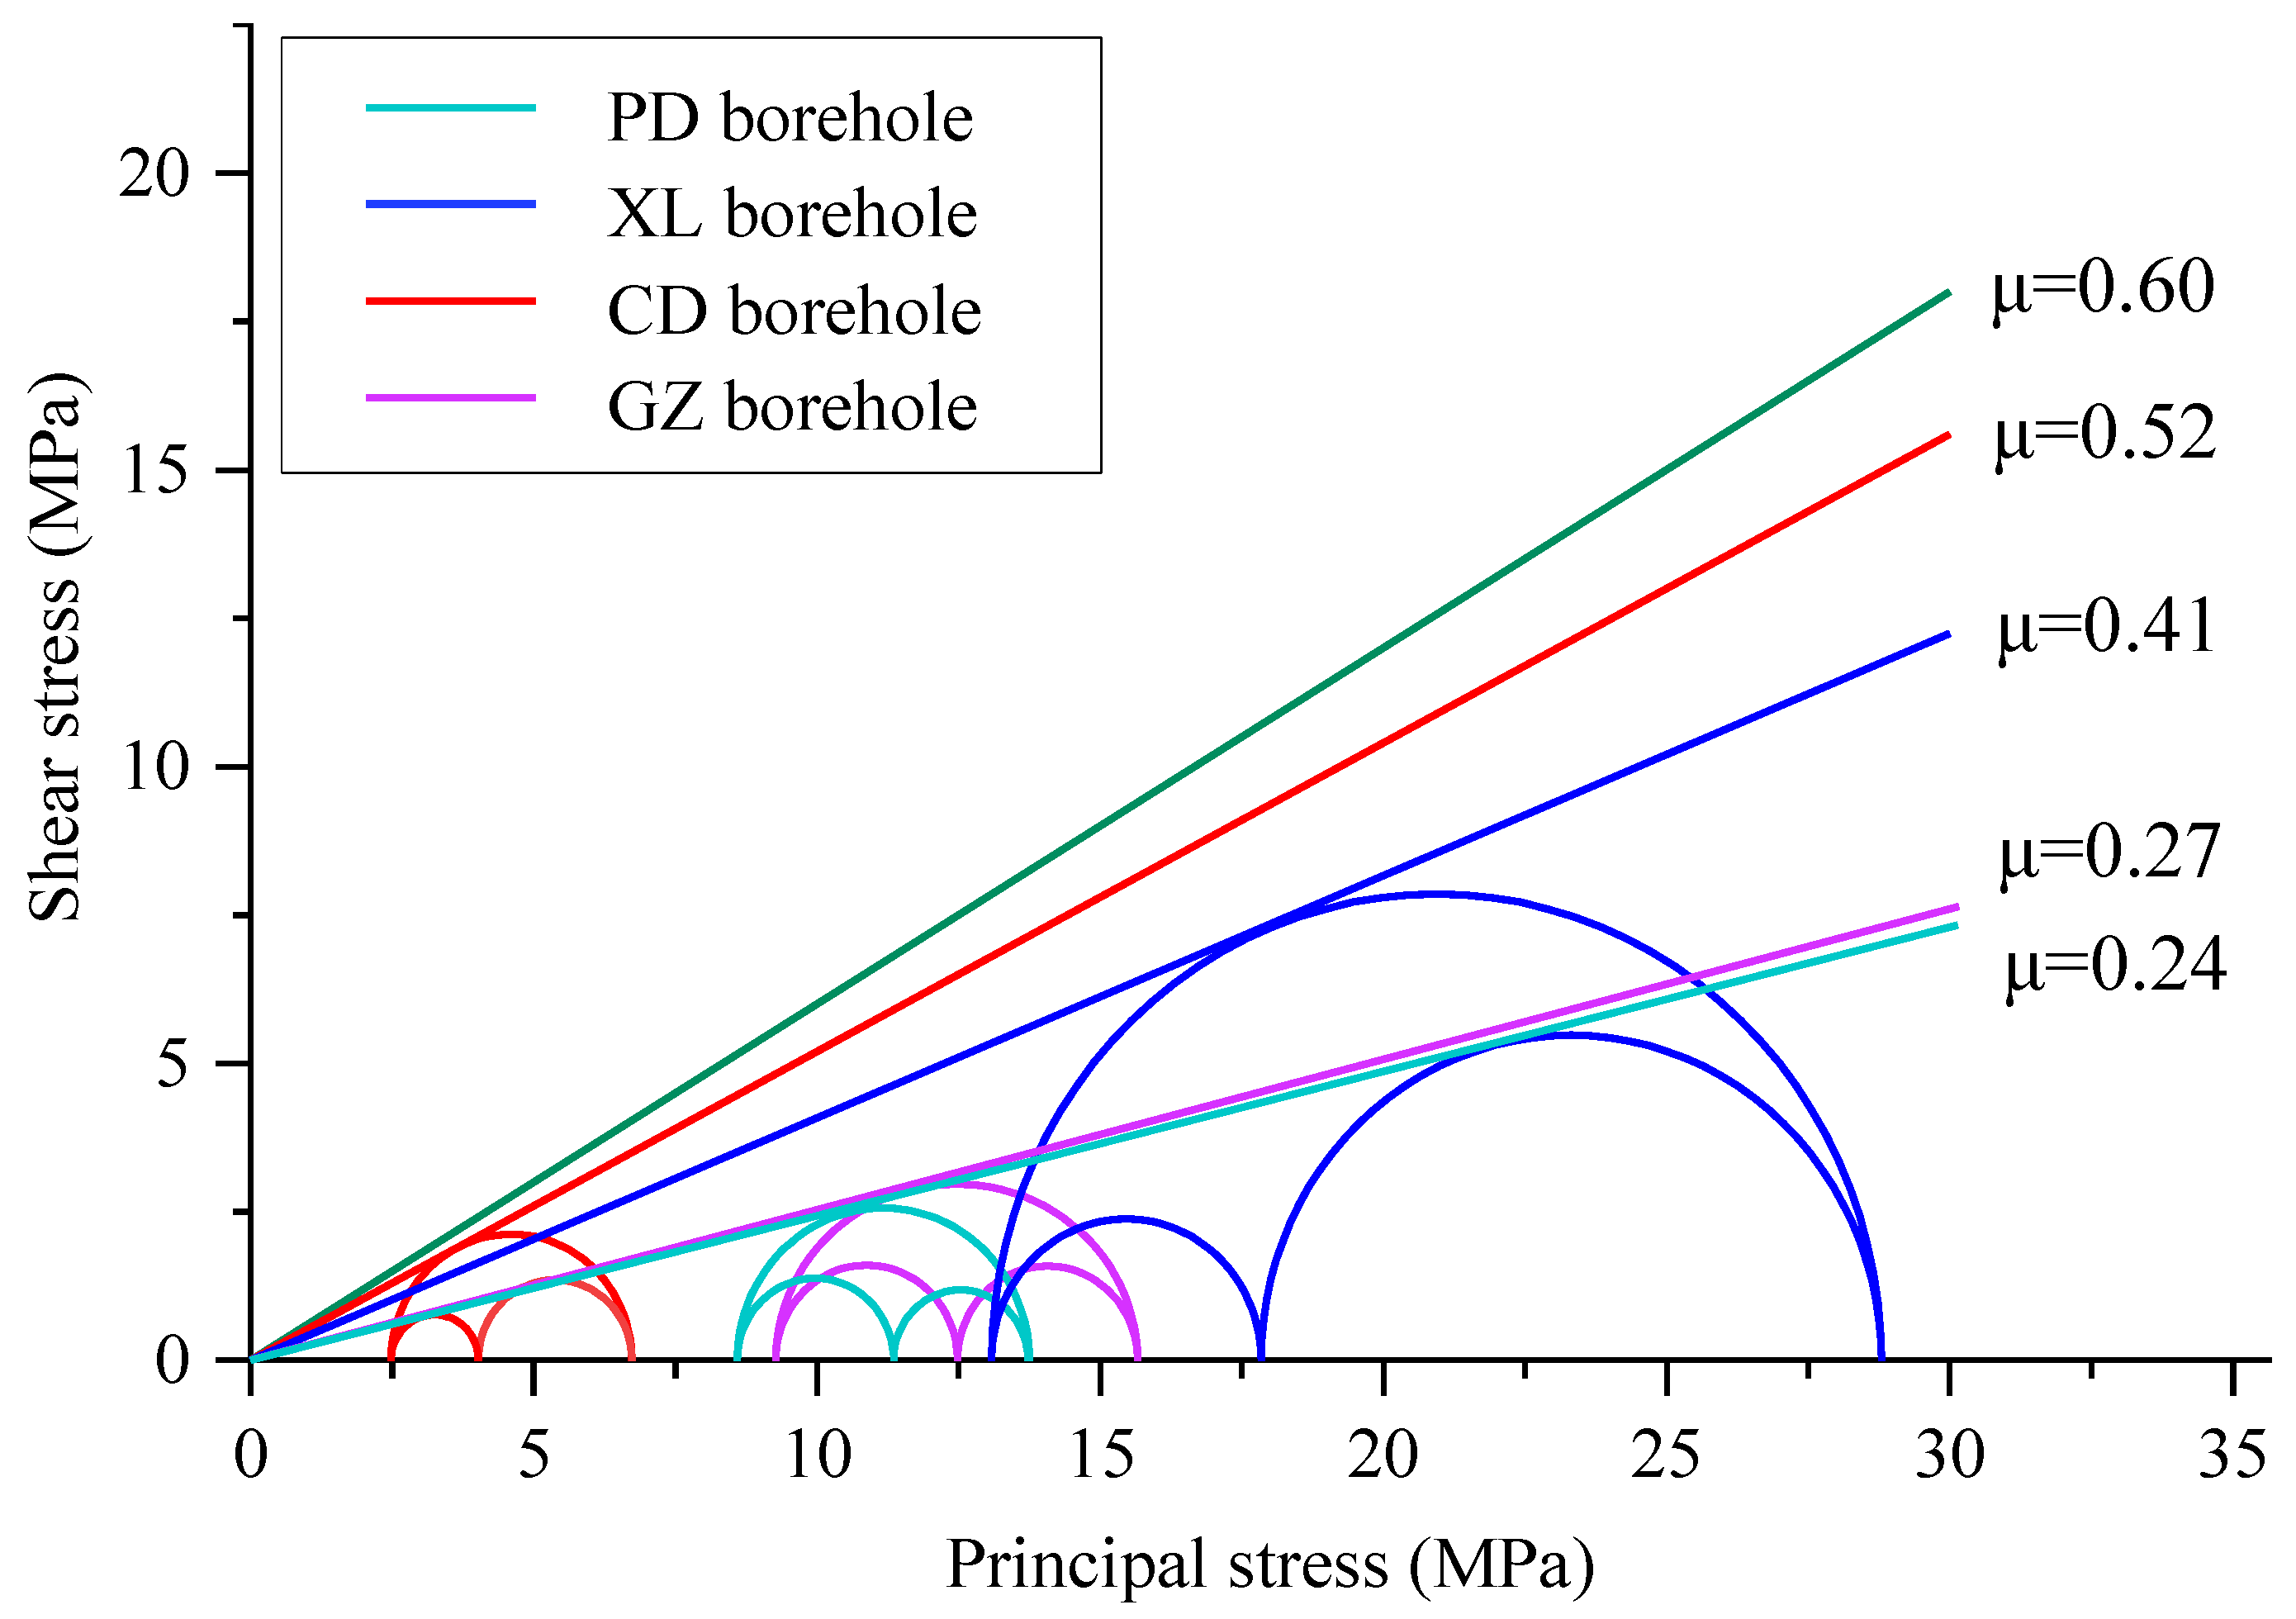
5.2. Implications for Fault Reactivation

The Earth’s crust contains faults, fractures, and geological discontinuities on various scales and orientations. It is widely accepted that the strength of the crust is controlled by the strength of these discontinuities and is maintained at a critical failure state [1,3,7]. By summarizing the measured stress data from deep boreholes worldwide, Zoback and Townend [82] noted that the stress state in the upper crust, i.e., several kilometers, can be described using the Coulomb friction criterion. Generally, the Coulomb friction criterion is as follows:
τ   =   μ S n   +   C ,
where τ is the shear stress, Sn is the effective normal stress, μ is the coefficient of friction, and C is cohesion.
The normal stress and shear stress acting on a fault plane can be expressed using the following formulas:
τ = 1 2 ( S 1 S 3 ) sin 2 θ
S n = 1 2 S 1 + S 3 + 1 2 ( S 1 S 3 ) cos 2 θ
where θ is the angle between the fault normal. S1S3 are the maximum, intermediate, and minimum principal stresses, respectively, and can be determined from the measured stresses by considering the stress regime.
Assuming C = 0, the Coulomb friction criterion can be expressed by the following equations:
S 1 P 0 S 3 P 0 = ( μ 2 + 1 + μ ) 2 ,
θ = 1 2 ( π 2 + tan 1 μ )
where P0 is the pore pressure, which is usually equivalent to hydrostatic pressure [82,83].
Based on experiments on various intact rocks, Byerlee [84] noted that μ mainly ranges from 0.6 to 1.0, which is commonly referred to as Byerlee’s law. Both theories and extensive deep borehole measurement data demonstrate that Byerlee’s law and the Coulomb friction criterion are suitable for analyzing the shallow crustal stress state [1,3,82]. Therefore, this study adopts the commonly accepted range of 0.6 to 1.0. If the value of the left side of Equation (11) is equal to or greater than the limit on the right side, that is, determined using a μ of 0.6, the optimally oriented fault will reactivate and slip. On the contrary, when the value of the left side is lower than this limit, the fault is in a temporary stability state. We estimated the stress state of the four boreholes and plotted the results in Figure 11. The results indicate that the stress state in the four boreholes has not reached the critical failure threshold yet (i.e., the line marked μ = 0.6 in Figure 11). This implies that faults in the Bohai Strait region, regardless of whether they are optimally or non-optimally oriented, are temporarily in a stable state and have a low chance of slipping. It was also found that the apparent values of μ for the PD and GZ boreholes are much lower than those of the XL and CD boreholes. The CD and XL boreholes are closer to the threshold that induces fault slipping, revealing a consistent feature with the stress level and seismic activities in the Bohai Strait region. Thus, the stress state in the Bohai Strait is temporarily far from the critical failure limit, and the faults show low reactivation potential. It should be noted here that the estimation of the potential reactivation of faults in this study does not consider the possible influence of pore pressure variation, thermal effects, or fault heterogeneity, which are crucial factors and may lead to reassessment of the slipping tendency. Without sufficient and reliable data that match the scale of this study at present, research including these factors may be performed in the future.
Moreover, the above estimation is upon based on certain values of in-situ stress. Indeed, the stress values show uncertainties, as noted in Section 3.3, the effect of which could be considered during the slipping tendency analysis. Thus, we simply discussed such an issue by limiting the stress ranges through the standard deviation shown in Section 3.3. The results indicate that the apparent friction coefficients for the PD, XL, CD, and GZ boreholes are 0.22–0.25, 0.40–0.41, 0.51–0.53, and 0.24–0.28, respectively. The apparent friction coefficients from all boreholes show a narrow range, revealing a slight effect of the uncertainties of stress measurements on the estimation of fault reactivation. In addition, the actual friction coefficient of the fault may be lower than the value derived from laboratory settings (i.e., 0.6–1.0), even less than 0.2–0.4, due to variations in fault structures and composition, and thermal and fluid conditions in the upper crust [7,85,86,87], thereby notably affecting the estimation results. Considering the above discussions, the possibility of fault reactivation may significantly increase, especially in the XL and CD sites, i.e., the intersection region of the ZBFZ and TLFZ. It is argued that the reactivation potential of faults is also governed by the fault geometry [88,89], influenced by the inhomogeneous stress field [90] and fluid pressure variation, and changed by loading raised from adjacent tectonic events [91,92]. Thus, the slipping tendency of faults in the Bohai Strait region should be continuously evaluated, based on the enriched in-situ stress, fault, fluid, and thermal data.

6. Conclusions

In this study, we determined the stress state across the Bohai Strait using stress data derived from hydraulic fracturing measurements in four boreholes, followed by a discussion on implications for potential fault reactivation. The main conclusions are drawn below.
The gradients for SH and Sh values versus depth in the PD and GZ boreholes are only 39.3–50.2% and 50.6–59.4% of those of the North China Block (i.e., 2.29 MPa/100 m and 1.70 MPa/100 m), respectively. The gradients for SH and Sh values versus depth in the XL and CD boreholes are 187.3–331.0% and 158.8–235.8% of the North China background level. This indicates that the stress value gradually increases from the outer region (PD and GZ sites) to the inner region (XL and CD sites) of the Bohai Strait. Moreover, the stress on the southern side of the Bohai Strait gradually increases as it approaches the intersection of the TLFZ and ZBFZ. The variation in the stress values across the Bohai Strait is preliminarily attributed to the interaction between the ZBFZ and TLFZ.
The PD and GZ boreholes, which are far from the strait, exhibit stress regimes changing from the reverse or strike-slip faulting to normal faulting. However, the XL and CD boreholes, which are near the Strait core, consistently show a reverse faulting stress regime. The changes in stress regime reveal a stress increase pattern as one approaches the strait from south to north. The mean azimuth of the SH orientations derived from HF tests across the Bohai Strait is N68.67 ± 9.30° E, that is, in the NEE direction. This is consistent with the regional stress field in North China determined using multiple stress indicators.
The stress state across the Bohai Strait is estimated by using the Coulomb friction criterion, incorporating Byerlee’s law, but without considering the potential influence arising from variations in pore pressure and thermal conditions, and the fault heterogeneity. The results indicate that the stress values in the PD and GZ sites are lower than the limit determined using a friction coefficient of ~0.27, while the stress values in the XL and CD boreholes range between 0.41 and 0.52. The stress values in the four boreholes are all lower than the theoretical limit that induces fault slip, indicating that the faults in the Bohai Strait region exhibit low reactivation potential but need to be further evaluated, considering more influencing factors.

Supplementary Materials

The following supporting information can be downloaded at https://www.mdpi.com/article/10.3390/app15126708/s1.

Author Contributions

Conceptualization, Z.L. and X.Q.; methodology, X.Q., G.Y. and C.Z.; formal analysis, Z.L., Y.Z., Z.G. and Y.C.; investigation, X.Q. and C.Z.; writing—original draft preparation, Z.L.; writing—review and editing, Z.L. and X.Q.; project administration, X.Q.; funding acquisition, X.Q. All authors have read and agreed to the published version of the manuscript.

Funding

This research was funded by the National Science and Technology Major Project (grant number 2024ZD1000706), the Central Public-interest Scientific Institution Basal Research Fund (grant number DZLXJK202408), and the China Geology Survey Projects (grant number DD20230014).

Institutional Review Board Statement

Not applicable.

Informed Consent Statement

Not applicable.

Data Availability Statement

The original contributions presented in this study are included in the article.

Conflicts of Interest

The authors declare no conflicts of interest.

References

  1. Townend, J.; Zoback, M.D. How Faulting Keeps the Crust Strong. Geology 2000, 28, 399–402. [Google Scholar] [CrossRef]
  2. Heidbach, O.; Rajabi, M.; Cui, X.F.; Ziegler, M.O.; Reiter, K. The World Stress Map Database Release 2016: Crustal Stress Pattern Across Scales. Tectonophysics 2018, 744, 484–498. [Google Scholar] [CrossRef]
  3. Zang, A.; Stephansson, O. Stress Field of the Earth’s Crust; Springer: Heidelberg, Germany, 2010. [Google Scholar] [CrossRef]
  4. Hoek, E. Practical Rock Engineering; Rocscience: Toronto, ON, Canada, 2007; Available online: https://www.rocscience.com (accessed on 15 April 2025).
  5. Wang, J. On area-specific underground research laboratory for geological disposal of high-level radioactive waste in China. J. Rock Mech. Geotech. Eng. 2014, 6, 99–104. [Google Scholar] [CrossRef]
  6. Tobin, H.J.; Saffer, D.M.; Castillo, D.A.; Hirose, T. Direct Constraints on In Situ Stress State from Deep Drilling into the Nankai Subduction Zone, Japan. Geology 2022, 50, 1229–1233. [Google Scholar] [CrossRef]
  7. Zoback, M.D. Reservoir Geomechanics; Cambridge University Press: Cambridge, UK, 2007. [Google Scholar]
  8. Zhang, C.Y.; Xu, J.D.; Wang, H.J.; Li, X. Evaluating In-Situ Stress State and Stress Heterogeneity by Hydraulic Fracturing and Image Logging in Changcun Coalbed Methane Area, North China. Rock Mech. Rock Eng. 2025, 58, 1723–1738. [Google Scholar] [CrossRef]
  9. Shang, Y.J.; Park, H.D.; Shi, Y.Y.; Yuan, G.X.; Sun, Y.C. Some large values of in-situ stress and related engineering geological problems in China. Geosci. J. 2010, 14, 135–153. [Google Scholar] [CrossRef]
  10. Tapponnier, P.; Xu, Z.; Roger, F.; Meyer, B.; Arnaud, N. Oblique stepwise rise and growth of the Tibet Plateau. Science 2001, 294, 1671–1677. [Google Scholar] [CrossRef]
  11. Clair, J.S.; Moon, S.; Holbrook, W.S.; Perron, J.T.; Riebe, C.S.; Martel, S.J.; Carr, B.; Harman, C.; Singha, K.; Richter, D.B. Geophysical imaging reveals topographic stress control of bedrock weathering. Science 2015, 350, 534–538. [Google Scholar] [CrossRef] [PubMed]
  12. Li, P.; Guo, Q.; Cai, M. Contemporary stress field in and around a gold mine area adjacent to the Bohai Sea, China, and its seismological implications. Bull. Eng. Geol. Environ. 2022, 81, 86. [Google Scholar] [CrossRef]
  13. Sai, M.; Chu, H.X.; Dong, L.Y.; Fang, Z.H.; Li, P.F.; Zhang, F.F. Influencing factors and evaluation application of regional crustal stability in the Bohai Strait. China Geol. 2019, 2, 354–363. [Google Scholar] [CrossRef]
  14. Wang, P.T.; Wang, Y.C.; Wang, Z.C.; Gao, Y.; Sun, L.; Li, H.; Shi, J. Tsunami free oscillations excited by potential local earthquake sources in Bohai Sea, China. Ocean Eng. 2022, 266, 112949. [Google Scholar] [CrossRef]
  15. Wang, J.; Main, I.G. Strong historical earthquakes and their relationships with the Tan-Lu fault system and modern seismicity in eastern China. Nat. Hazards 2023, 115, 539–564. [Google Scholar] [CrossRef]
  16. Sun, Q.S.; Bai, L.S.; Wang, L.; Wang, J.Y.; Yang, S.C.; Li, E.L. Fault structures of the Haichenghe fault zone in Liaoning, China from high-precision location based on dense array observation. J. Seismol. 2024, 28, 1293–1307. [Google Scholar] [CrossRef]
  17. Chen, F.C.; Guo, L.Q.; Zheng, Z.J. Research on activity of Zhangjiakou-Bohai fault zone based on GPS observations. Seismol. Geol. 2020, 42, 95–108. [Google Scholar]
  18. Li, X.R.; Wang, J.; Zeng, Z.X.; Dai, Q. Spatial variations of current tectonic stress field and its relationship to the structure and rheology of lithosphere around the Bohai Sea, North China. J. Asian Earth Sci. 2016, 139, 83–94. [Google Scholar] [CrossRef]
  19. Xue, Y.G.; Qu, C.Q.; Su, M.X.; Qiu, D.H.; Li, X.; Ma, X. Comprehensive and quantitative evaluation of subsea tunnel route selection: A case study on Bohai Strait. KSCE J. Civ. Eng. 2025, 25, 3540–3555. [Google Scholar] [CrossRef]
  20. Qi, J.F.; Zhou, X.H.; Deng, R.J.; Zhang, K.X. Structural characteristics of the Tan-Lu fault zone in Cenozoic basins offshore the Bohai Sea. Sci. China Ser. D Earth Sci. 2008, 51, 20–31. [Google Scholar] [CrossRef]
  21. Zheng, H.X.; Zhang, X.H.; Zhao, T.H.; Qi, J. In-situ stress field and geological analysis of Bohai Trait. Period. Ocean Univ. China 2015, 45, 81–91. [Google Scholar] [CrossRef]
  22. Zhang, P.; Qin, X.H.; Feng, C.; Sun, W.F.; Tan, C.X. In-Situ Stress Measurement of Deep Borehole in Shandong Segment of Tan-Lu Fracture Belt and Analysis of Its Activity. Rock Soil Mech. 2013, 34, 2329–2336. [Google Scholar]
  23. Zhang, P.; Feng, C.; Sun, W.; Tan, C. In-Situ Stress Measurement of Deep Borehole in North Segment of Jinzhou Fracture Belt and Analysis on Its Activity. Earth Sci. 2014, 39, 1295–1306. [Google Scholar] [CrossRef]
  24. Li, B.; Ding, L.F.; Wang, J.X.; Hou, Y.H.; Xie, F.R. The state of the in-situ stress and fault stability evaluation of the Penglai coast. J. Geomech. 2022, 25, 459–466. [Google Scholar] [CrossRef]
  25. Feng, C.J.; Zhang, P.; Meng, J.; Qi, B.S.; Qin, X.H.; Niu, L.L.; Sun, D.S.; Sun, W.F.; Tan, C.X.; Chen, Q.C. Recent tectonic stress field at the shallow Earth’s crust near the Tan-Lu Fault Zone. Geosciences 2017, 3, 45–58. [Google Scholar]
  26. Wang, J.S.; Peng, H. Measurement of 3D In-Situ Stress in the Sea Area of Trans-Bohai Strait Passage Engineering Region. Rock Soil Mech. 2024, 45, 245–256. [Google Scholar] [CrossRef]
  27. Peng, J.S.; Wei, A.J.; Sun, Z.; Chen, X.L.; Zhao, D.J. Sinistral strike slip of the Zhangjiakou-Penglai Fault and its control on hydrocarbon accumulation in the northeast of Shaleitian Bulge, Bohai Bay Basin, East China. Pet. Explor. Dev. 2018, 45, 215–226. [Google Scholar] [CrossRef]
  28. Jia, N.; Liu, C.Y.; Wang, J.Q.; Fu, X.F.; Huang, L.; Yang, H.F.; Wang, H.X.; Ma, J.H.; Li, D. New insights into Cenozoic evolution of the Shijiutuo uplift, Bohai Bay basin, China: Constraints from apatite fission track analysis and seismic data. Mar. Pet. Geol. 2024, 164, 106808. [Google Scholar] [CrossRef]
  29. Meng, W.; Chen, Q.C.; Zhao, Z.; Li, S.; Zhang, Y. Characteristics and Implications of the Stress State in the Longmen Shan Fault Zone, Eastern Margin of the Tibetan Plateau. Tectonophysics 2015, 656, 1–19. [Google Scholar] [CrossRef]
  30. Editorial Board for Lithospheric Dynamics Atlas of China; State Seismological Bureau. Lithospheric Dynamics Atlas of China; China Cartographic Publishing House: Beijing, China, 1989. (In Chinese)
  31. Xue, Y.D.; Lyu, D.Y.; Hu, Z.W.; Huang, J.B.; Ren, J. Tectonic development of subtle faults and exploration in mature areas in Bohai Sea, East China. Pet. Explor. Dev. 2021, 48, 269–285. [Google Scholar] [CrossRef]
  32. Chen, A.L.; Chen, X.H. Origin of the Bohai Sea Basin, North China Craton, and implications for bidirectional back-arc extension in the East Asian continental margin. Solid Earth 2025, 16, 63–80. [Google Scholar] [CrossRef]
  33. Qi, J.; Yang, Q. Cenozoic structural deformation and dynamic processes of the Bohai Bay basin province, China. Mar. Pet. Geol. 2010, 27, 757–771. [Google Scholar] [CrossRef]
  34. Li, S.Z.; Suo, Y.H.; Dai, L.M.; Liu, L.P.; Jiao, Q. Development of the Bohai Bay Basin and destruction of the North China Craton. Earth Sci. Front. 2010, 17, 64–89. [Google Scholar]
  35. Liu, C.; Li, P.; Sun, J.; Hou, F.; Chu, H.; Qi, J.; Yang, Y.; Chen, S. High-resolution seismic sequence characteristics and its paleoenvironmental evolution in the Bohai Straits. Prog. Geophys. 2020, 35, 2373–2383. [Google Scholar] [CrossRef]
  36. Ding, D. Natural conditions of the Trans-Bohai Strait Passage. Mar. Geol. Dyn. 1994, 2, 4–6. [Google Scholar]
  37. Guo, L.; Li, S.; Suo, Y.; Ji, Y.; Dai, L.; Yu, S.; Somerville, I.D. Experimental study and active tectonics on the Zhangjiakou-Penglai fault zone across North China. J. Asian Earth Sci. 2015, 114, 18–27. [Google Scholar] [CrossRef]
  38. Zhao, R.; Zheng, J.; Cui, H.; Ji, D. Analysis on the Seismogenic Mechanism of Changdao Earthquake Swarm in Shandong Province. In Advances in Civil Engineering: Structural Seismic Resistance, Monitoring and Detection; CRC Press: Boca Raton, FL, USA, 2022; pp. 727–734. [Google Scholar]
  39. Zhang, J.D.; Hao, T.Y.; Dong, S.W.; Chen, X.H.; Cui, J.J.; Yang, X.Y.; Liu, C.Z.; Li, T.J.; Xu, Y.; Huang, S.; et al. The structural and tectonic relationships of the major fault systems of the Tan-Lu fault zone, with a focus on the segments within the North China region. Asian Earth Sci. 2015, 110, 85–100. [Google Scholar] [CrossRef]
  40. Li, W.; Li, J.; Wu, W.Q.; Zhang, T.J.; Chen, X.P.; Meng, M.F.; Cao, M.Y.; Zhang, Q. Time limit of dextral strike-slip in Cenozoic of Liaodong Bay section of Tan-Lu Fault Zone. Earth Sci. 2024, 49, 2071–2084. [Google Scholar] [CrossRef]
  41. Zhu, G.; Hu, W.; Song, L.H.; Liu, B. Quaternary activity along the Tan-Lu Fault Zone in the Bohai Bay, East China: Evidence from seismic profiles. Asian Earth Sci. 2015, 114, 5–17. [Google Scholar] [CrossRef]
  42. Qu, J.H.; Yang, Y.Y.; Liu, Y.G. Causative structure of the 2013 Laizhou earthquake sequence. China Earthq. Eng. J. 2015, 37, 546–552. [Google Scholar]
  43. Wang, D.M.; Hu, J.M.; Zhang, Z.G.; Yan, J.Y.; Hu, Y. Kinematic history of the Tan-Lu fault zone constrained by the Late Mesozoic-Cenozoic tectono-sedimentary evolution of basins in the Luxi Block, eastern North China Craton. J. Asian Earth Sci. 2022, 225, 105041. [Google Scholar] [CrossRef]
  44. Yuan, H.W.; Dai, K.; Zhang, C.; Liu, L.; Jing, T.; Li, J.; Zhao, W.; Chen, F. Cenozoic sedimentary archives of a strike-slip fault zone in the Tanhai Region, Bohai Bay Basin, Northeastern China. J. Struct. Geol. 2024, 186, 105203. [Google Scholar] [CrossRef]
  45. Fu, Z.X.; Liu, J.; Liu, G.P. On the long-term seismic hazard analysis in the Zhangjiakou–Penglai seismotectonic zone, China. Tectonophysics 2004, 390, 75–83. [Google Scholar] [CrossRef]
  46. Scholz, C.H. The critical slip distance for seismic faulting. Nature 1988, 336, 761–763. [Google Scholar] [CrossRef]
  47. Li, S.Z.; Zhao, G.C.; Dai, L.M.; Zhou, L.H.; Liu, X.; Suo, Y.H.; Santosh, M. Cenozoic faulting of the Bohai Bay Basin and its bearing on the destruction of the eastern North China Craton. J. Asian Earth Sci. 2012, 47, 80–93. [Google Scholar] [CrossRef]
  48. Tao, Y.; Chen, A.Q.; Hou, M.C.; Niu, C.M.; Wang, Q.B. Characteristic of the Bodong segment of the Tanlu Fault Zone, Bohai Sea Area, Eastern China: Implications for hydrocarbon exploration and regional tectonic evolution. J. Pet. Sci. Eng. 2021, 201, 108478. [Google Scholar] [CrossRef]
  49. Amadei, B.; Stephansson, O. Rock Stress and Its Measurement; Chapman & Hall: London, UK, 1997. [Google Scholar]
  50. Haimson, B.C.; Cornet, F.H. ISRM Suggested Methods for Rock Stress Estimation—Part 3: Hydraulic Fracturing (HF) and/or Hydraulic Testing of Pre-existing Fractures (HTPF). Int. Rock Mech. Min. Sci. 2003, 40, 1011–1020. [Google Scholar] [CrossRef]
  51. Ljunggren, C.; Chang, Y.; Janson, T.; Christiansson, R. An Overview of Rock Stress Measurement Methods. Int. Rock Mech. Min. Sci. 2003, 40, 975–989. [Google Scholar] [CrossRef]
  52. Schmitt, D.R.; Currie, C.A.; Zhang, L. Crustal stress determination from boreholes and rock cores: Fundamental principles. Tectonophysics 2012, 580, 1–26. [Google Scholar] [CrossRef]
  53. Huenges, E.; Erzinger, J.; Kuck, J.; Engeser, B.; Kessels, W. The permeable crust: Geohydraulic properties down to 9101 m depth. J. Geophys. Res. 1997, 102, 18255–18265. [Google Scholar] [CrossRef]
  54. Coyle, B.J.; Zoback, M.D. In situ permeability and fluid pressure measurements at approximately 2-km in the Cajon Pass research well. Geophys. Res. Lett. 1988, 15, 1029–1032. [Google Scholar] [CrossRef]
  55. Desroches, J.; Peyret, E.; Gisolf, A.; Wilcox, A.; Di Giovanni, M.; Schram de Jong, A.; Sepehri, S.; Garrard, R.; Giger, S. Stress measurement campaign in scientific deep boreholes: Focus on tool and methods. In Proceedings of the SPWLA 62nd Annual Logging Symposium, Virtual Event, 19–23 June 2021. Paper ID SPWLA-2021-0056. [Google Scholar] [CrossRef]
  56. Qin, X.H.; Zhao, X.G.; Zhang, C.Y.; Li, P.F.; Chen, Q.C.; Wang, J. Measurement and assessment of the in-situ stress of the Shazaoyuan rock block, a candidate site for HLW disposal in northwest China. Rock Mech. Rock Eng. 2024, 57, 4011–4031. [Google Scholar] [CrossRef]
  57. Gronseth, J.M.; Kry, P.R. Instantaneous Shut-in Pressure and Its Relationship to the Minimum In-Situ Stress. In Hydraulic Fracturing Stress Measurements; National Academy Press: Washington, DC, USA, 1983; pp. 55–60. [Google Scholar]
  58. Hayashi, K.; Haimson, B.C. Characteristics of Shut-in Curves in Hydraulic Fracturing Stress Measurements and Determination of In Situ Minimum Compressive Stress. Geophys. Res. Solid Earth 1991, 96, 18311–19321. [Google Scholar] [CrossRef]
  59. Lee, M.Y.; Haimson, B.C. Statistical Evaluation of Hydraulic Fracturing Stress Measurement Parameters. Int. J. Rock Mech. Min. Sci. Geomech. Abstr. 1989, 26, 447–456. [Google Scholar] [CrossRef]
  60. Brown, E.T.; Hoek, E. Trends in Relationship Between Measured In-Situ Stresses and Depth. Int. J. Rock Mech. Min. Sci. Geomech. Abstr. 1978, 15, 211–215. [Google Scholar] [CrossRef]
  61. Yang, S.X.; Yao, R.; Cui, X.F.; Chen, Q.C.; Huang, L.Y. Analysis of the characteristics of measured stress in Chinese mainland and its active blocks and North-South seismic belt. Chin. J. Geophys. 2012, 55, 708–718. [Google Scholar] [CrossRef]
  62. Xie, F.R. Recent Tectonic Stress Map of China and Its Adjacent Areas; Sinomaps Press: Nanjing, China, 2015. (In Chinese) [Google Scholar]
  63. Anderson, E.M. The Dynamics of Faulting and Dyke Formation with Application to Britain; Oliver and Boyd: Edinburgh, UK, 1951. [Google Scholar]
  64. Bott, M.H.P.; Kusznir, N.J. The origin of tectonic stress in the lithosphere. Tectonophysics 1984, 105, 1–13. [Google Scholar] [CrossRef]
  65. Sagaseta, C. Mechanics of jointed and faulted rock: Rossmanith, HP (Ed.): Proceedings of the International Conference, Vienna, April 1990. AA Balkeme, Rotterdam. Rock Mech. Rock Eng. 1992, 25, 63. [Google Scholar]
  66. Magnenet, V.; Cornet, F.H.; Fond, C. A nontectonic origin for the present-day stress field in the Paris Basin (France). J. Geophys. Res. Solid Earth 2017, 122, 9313–9327. [Google Scholar] [CrossRef]
  67. Heidbach, O.; Iaffaldano, G.; Bunge, H.P. Topography growth drives stress rotation in the central Andes: Observation and models. Geophys. Res. Lett. 2008, 35, L08301. [Google Scholar] [CrossRef]
  68. Oliva, S.J.; Ebinger, C.J.; Rivalta, E.; Williams, C.A.; Wauthier, C.; Currie, C.A. State of stress and stress rotations: Quantifying the role of surface topography and subsurface density contrasts in magmatic rift zone (Eastern Rift, Africa). Earth Planet. Sci. Lett. 2022, 584, 117478. [Google Scholar] [CrossRef]
  69. Su, S.R.; Zhu, H.H.; Wang, S.T.; Stephansson, O. The effect of fracture properties on stress field in the vicinity of a fracture. Northwest Univ. (Nat. Sci. Ed.) 2002, 32, 655–658. [Google Scholar]
  70. Rajabi, M.; Tingay, M.; King, R.; Heidbach, O. Present-day stress orientation in the Clarence-Moreton Basin of New South Wales, Australia: A new high density dataset reveals local stress rotations. Basin Res. 2017, 29, 622–640. [Google Scholar] [CrossRef]
  71. Reiter, K. Stress rotation-impact and interaction of rock stiffness and faults. Solid Earth 2021, 12, 1287–1307. [Google Scholar] [CrossRef]
  72. Su, S.R.; Zhu, H.H.; Wang, S.T.; Stephansson, O. Effect of physical and mechanical properties of rocks on stress field in the vicinity of fractures. Chin. J. Rock Mech. Eng. 2003, 24 (Suppl. 2), 2431–2436. [Google Scholar] [CrossRef]
  73. Roche, V.; van der Baan, M. Modeling of the in situ stress state in elastic layered rock subject to stress and strain-driven tectonic forces. Solid Earth 2017, 8, 479–498. [Google Scholar] [CrossRef]
  74. Harper, T. Dependence of stress state on the histories of burial, erosion, mechanical properties, pore pressure, and faulting. Int. J. Rock Mech. Min. Sci. 2020, 136, 104523. [Google Scholar] [CrossRef]
  75. Tan, C.X.; Wang, R.J.; Sun, Y.; Lei, W.; Wu, S.; Yang, M.; Sun, W. Numerical modeling estimation of the ‘tectonic stress plane’ (TSP) beneath topography with quasi-U-shaped valleys. Int. J. Rock Mech. Min. Sci. 2004, 41, 303–310. [Google Scholar] [CrossRef]
  76. Hou, G.T.; Ye, L.X.; Du, Q.E. Tectonic mechanism and geological significance of the Bozhang fault zone. Chin. Geol. 1999, 34, 123–135. [Google Scholar]
  77. Xu, J.; Song, C.Q.; Chu, Q.Z. Primary study of the seismotectonic characteristics of the Zhangjiakou-Penglai fault zone. Seismol. Geol. 1998, 20, 146–154. [Google Scholar]
  78. Wang, R.B.; Gu, G.H.; Xu, J. Discussion on characteristics of crustal deformation along the Zhangjiakou-Bohai seismotectonic zone. Seismol. Geol. 2004, 26, 456–468. [Google Scholar]
  79. Huang, L.; Liu, C.Y.; Kusky, T.M. Cenozoic evolution of the Tan-Lu Fault Zone (East China)—Constraints from seismic data. Gondwana Res. 2015, 28, 1079–1095. [Google Scholar] [CrossRef]
  80. Feng, C.J.; Zhang, P.; Qin, X.H.; Meng, W.; Tan, C.X.; Chen, Q.C. Near-surface stress measurements in the Longmenshan fault belt after the 2008 Wenchuan Ms 8.0 earthquake. Int. J. Rock Mech. Min. Sci. 2015, 77, 358–377. [Google Scholar] [CrossRef]
  81. Liu, Z.Y.; Peng, X.M.; Zhao, T.H.; Sun, J. Fault activity and characteristics of earthquake distribution in the engineering area of Bohai Strait cross-sea channel. Geosciences 2017, 31, 860–868. [Google Scholar] [CrossRef]
  82. Zoback, M.D.; Townend, J. Implications of hydrostatic pore pressures and high crustal strength for the deformation of intraplate lithosphere. Tectonophysics 2001, 336, 19–30. [Google Scholar] [CrossRef]
  83. Barton, C.A.; Zoback, M.D.; Moos, D. Fluid flow along potentially active faults in crystalline rock. Geology 1995, 23, 683–686. [Google Scholar] [CrossRef]
  84. Byerlee, J.D. Friction of rocks. Pure Appl. Geophys. 1978, 116, 615–626. [Google Scholar] [CrossRef]
  85. Byerlee, J. Friction, overpressure and fault normal compression. Geophys. Res. Lett. 1990, 17, 2109–2112. [Google Scholar] [CrossRef]
  86. Carpenter, B.M.; Marone, C.; Saffer, D.M. Weakness of the San Andreas Fault revealed by samples from the active fault zone. Nat. Geosci. 2011, 4, 251–254. [Google Scholar] [CrossRef]
  87. Zhang, L.; He, C. Frictional properties of natural gouges from Longmenshan fault zone ruptured during the Wenchuan Mw7.9 earthquake. Tectonophysics 2013, 594, 149–164. [Google Scholar] [CrossRef]
  88. Hergert, T.; Heidbach, O.; Reiter, K.; Giger, S.B.; Marschall, P. Stress field sensitivity analysis in a sedimentary sequence of the Alpine foreland, north Switzerland. Solid Earth 2015, 6, 533–552. [Google Scholar] [CrossRef]
  89. Röckel, L.; Ahlers, S.; Müller, B.; Reiter, K.; Heidbach, O.; Henk, A.; Hergert, T.; Schilling, F. The analysis of slip tendency of major tectonic faults in Germany. Solid Earth 2022, 13, 1087–1105. [Google Scholar] [CrossRef]
  90. Zaccagnino, D.; Doglioni, C. Fault slip vs shear stress gradient. Geosyst. Geoenviron. 2023, 2, 10021. [Google Scholar] [CrossRef]
  91. Qin, X.H.; Chen, Q.C.; Tan, C.X.; An, Q.M.; Wu, M.L.; Feng, C.J. Analysis of current geostress state and seismic risk in southwest segment of Longmenshan fracture belt. Chin. J. Rock Mech. Eng. 2013, 32, 2870–2876. [Google Scholar]
  92. Lin, W.R.; Conin, M.; Moore, J.C.; Chester, F.M.; Nakamura, Y.; Mori, J.J.; Anderson, L. Stress state in the largest displacement area of the 2011 Tohoku-Oki earthquake. Science 2013, 339, 687–690. [Google Scholar] [CrossRef] [PubMed]
Figure 1. The geological map of the Bohai Strait and adjacent region (modified after [30]).
Applsci 15 06708 g001
Figure 2. Typical hydraulic fracturing pressure–time curves obtained from the Xiangli borehole.
Applsci 15 06708 g002
Figure 3. The interpreted azimuths and the traces of the induced fractures following the hydraulic fracturing tests in the Xiangli and Changdao boreholes.
Applsci 15 06708 g003
Figure 4. Determination of Ps for the 208.5 m test interval in the Xiangli borehole using different methods: (a) inflection point method, (b) dt/dP vs. P methods, and (c) dP/dt vs. P methods. The mean value of the three methods is set as the final magnitude of the Ps.
Applsci 15 06708 g004
Figure 5. Profile of principal stresses versus depths in the Bohai Strait region.
Applsci 15 06708 g005
Figure 6. Profile of the parameters (a) Kav, (b) KHv, (c) Khv, and (d) KHh versus depths across the Bohai Strait.
Applsci 15 06708 g006aApplsci 15 06708 g006b
Figure 7. Distribution of the SH orientations in the Bohai Strait region.
Applsci 15 06708 g007
Figure 8. Recent tectonic stress map in the Bohai and adjacent area (modified after [62]). The blue circles represent the results resolved from the four boreholes in this study.
Applsci 15 06708 g008
Figure 9. The graph shows the variation in maximum horizontal shear stress across the Bohai Strait as a function of distance from the Zhangjiakou–Bohai Fault.
Applsci 15 06708 g009
Figure 10. Sketch map illustrating the relationship between the stress state across the Bohai Strait and the tectonic framework.
Applsci 15 06708 g010
Figure 11. Estimation of the in-situ stress analysis in the Bohai Strait according to the Coulomb frictional failure criterion with Byerlee’s law.
Applsci 15 06708 g011
Table 1. The summary of the in-situ stress data of the four boreholes across the Bohai Strait.
BoreholeDepth
(m)
Pb
(MPa)
Pr
(MPa)
Ps
(MPa)
P0
(MPa)
SH
(MPa)
Sh
(MPa)
Sv
(MPa)
KavKHvKhvKHhSH
Azimuth
PD [22]101.000.915.574.213.76.054.202.681.912.261.571.44N80° W
109.400.995.644.117.625.814.112.901.712.001.421.41
166.801.576.02511.797.415.034.421.411.681.141.47N87° W
212.002.026.25.3914.437.955.395.621.191.420.961.47
220.102.107.816.310.428.996.35.831.311.541.081.43
254.602.457.716.3211.818.86.326.751.121.300.941.39
268.002.587.186.1911.958.816.197.101.061.240.871.42N81° E
314.003.048.16.4810.688.56.488.320.901.020.781.31
346.003.368.57.2911.3710.017.299.170.941.090.801.37
372.503.637.486.5311.178.486.539.870.760.860.661.30
384.603.758.287.749.411.197.7410.190.931.100.761.45
410.4047.156.4314.368.146.4310.880.670.750.591.27
454.904.457.896.9513.778.516.9512.050.640.710.581.22
463.504.548.477.7812.5610.337.7812.280.740.840.631.33
473.004.638.537.3916.829.017.3912.530.650.720.591.22N70° E
481.604.729.718.6415.0511.498.6412.760.790.900.681.33
517.905.089.348.5914.5611.358.5913.720.730.830.631.32
542.005.328.197.7815.179.837.7814.360.610.680.541.26
XL108.9011.837.065.311.097.785.312.892.272.701.841.47
144.0017.158.196.361.449.456.363.822.072.481.671.49N72° E
157.1027.718.666.751.5710.026.754.162.012.411.621.48N62° E
172.8013.387.296.611.7310.816.614.581.902.361.441.64
190.0010.066.805.851.908.855.855.041.461.761.161.51
208.5019.2514.3212.662.0921.5712.665.533.103.902.291.70N64° E
231.5013.639.268.372.3213.538.376.131.782.211.361.62N78° E
256.0016.5213.7712.102.5619.9712.106.782.362.941.781.65
272.1015.0811.3210.872.7218.5710.877.212.042.581.511.71
301.8012.248.326.693.028.736.698.000.961.090.841.30
317.9017.8812.6811.203.1817.7411.208.421.722.111.331.58
360.7016.4211.069.443.6113.659.449.561.211.430.991.45N83° E
383.0017.5915.2014.273.8323.7814.2710.151.872.341.411.67
423.3018.1414.9412.664.2318.8112.6611.221.401.681.131.49
484.4025.5819.8917.844.8428.7917.8412.841.822.241.391.61
CD66.007.943.703.180.645.203.181.752.402.971.821.64
75.005.682.772.390.733.672.391.991.521.851.201.54N60° E
84.005.493.773.530.826.003.532.232.142.701.591.70
93.607.544.414.020.926.734.022.482.172.711.621.67N68° E
GZ [23]164.3513.054.734.001.645.634.004.361.111.290.921.41N55° E
209.6018.698.437.462.1011.857.465.551.742.131.341.59
220.4512.057.126.412.209.916.415.841.401.701.101.55
234.1315.348.046.352.348.676.356.201.211.401.021.37
279.6015.776.695.582.807.255.587.410.870.980.751.30
295.6512.605.715.062.966.515.067.830.740.830.651.29
305.8117.386.054.903.065.594.908.100.650.690.601.14N81° E
340.7315.876.726.183.418.416.189.030.810.930.681.36
363.4014.777.676.373.637.816.379.630.740.810.661.23
382.2021.899.898.543.8211.918.5410.131.011.180.841.39
402.0017.168.947.104.028.347.1010.650.720.780.671.17N57° E
444.9016.298.857.664.459.687.6611.790.740.820.651.26
483.7122.2510.069.784.8414.449.7812.820.941.130.761.48
513.2713.008.147.255.138.487.2513.600.580.620.531.17
532.2017.908.307.605.329.187.6014.100.590.650.541.21N68° E
553.9017.828.657.885.549.457.8814.680.590.640.541.20
591.0015.569.429.275.9112.489.2715.660.690.800.591.35
Table 2. The fitting results for principal stress with depth in the boreholes across the Bohai Strait.
BoreholeSHR2ShR2SV
GaizhouSH = 0.0115D + 4.670.4448Sh = 0.0101D + 3.030.7237Sv = 0.0265D
ChangdaoSH = 0.0758D − 0.640.4689Sh = 0.0401D + 0.080.4807Sv = 0.0265D
XiangliSH = 0.0429D + 4.000.5447Sh = 0.0270D + 2.580.6479Sv = 0.0265D
PingduSH = 0.0090D + 5.890.6051Sh = 0.0087D + 3.670.8302Sv = 0.0265D
North China BlockSH = 0.0229D + 4.00 Sh = 0.0170D + 2.58 Sv = 0.0272D
Disclaimer/Publisher’s Note: The statements, opinions and data contained in all publications are solely those of the individual author(s) and contributor(s) and not of MDPI and/or the editor(s). MDPI and/or the editor(s) disclaim responsibility for any injury to people or property resulting from any ideas, methods, instructions or products referred to in the content.

