Article

Evaluating the Odor Mitigation Effects of Biochar-Enhanced Bedding Materials in a Simulated Bedded Pack Dairy Barn Environment: A Laboratory-Scale Study

1
Department of Dairy Science, Chungnam National University, Daejeon 34134, Republic of Korea
2
Institute of Agricultural Science, Chungnam National University, Daejeon 34134, Republic of Korea
3
Division of Animal and Dairy Science, Chungnam National University, Daejeon 34134, Republic of Korea
*
Author to whom correspondence should be addressed.
Appl. Sci. 2025, 15(11), 6361; https://doi.org/10.3390/app15116361
Submission received: 21 April 2025 / Revised: 24 May 2025 / Accepted: 3 June 2025 / Published: 5 June 2025
(This article belongs to the Section Agricultural Science and Technology)

Abstract

:
This study evaluated the odor mitigation potential of rice husk biochar in a simulated dairy bedded pack over 21 days. Biochar was incorporated into a dairy manure–sawdust mixture at 5% and 10% dry weight. Emissions of key odorous compounds—ammonia (NH3), sulfur compounds, volatile fatty acids, phenol, p-cresol, and indole—were evaluated. Odor units were assessed to determine perceived odor reduction. Biochar significantly reduced NH3 and dimethyl sulfide (DMS) emissions: NH3 by 27% and 43%, and DMS by 53% and 75%, at 5% and 10% application, respectively. The NH3 reduction was attributed to ammoniacal nitrogen adsorption, while the DMS reduction likely resulted from enhanced air permeability suppressing anaerobic bacterial activity. The 5% biochar treatment, achieving 63% and 70% of the NH3 and DMS reductions attained by the 10% treatment, respectively, offers a more practical and cost-effective option. Other odorous compounds were not significantly affected. A temporary reduction in odor units was observed on day 7. Rice husk biochar contains 14.5% atomic Si, primarily as silica, which supports structural stability but hinders pore development, reducing adsorption efficiency. These findings demonstrate the importance of biochar’s physicochemical properties in odor mitigation. Future research should evaluate long-term field performance, microbial interactions, and silica modification strategies.

1. Introduction

The livestock industry has long faced challenges with odor emissions from manure storage, treatment facilities, and livestock housing. Cattle are well-adapted to cold weather and are therefore typically housed in open or partially open barns to manage humidity and air quality [1]. The reliance on natural ventilation in these barns limits the effectiveness of collection-based odor control systems, such as biofilters and wet scrubbers. Consequently, in-barn approaches to reduce odors, such as applying microbial additives, oxidants, and adsorbents, have become a preferred method for directly targeting odor sources within barns [2].
Biochar has gained significant attention among various odor mitigation agents due to its unique structural and chemical properties that facilitate the removal of odorous compounds [3]. Agyarko-Mintah et al. [4] reported that adding green waste biochar and poultry litter biochar to a composting mixture of poultry litter and straw resulted in a 30% and 44% reduction in ammonia emissions, respectively, when each type of biochar comprised 10% of the total dry weight of the mixture. Zhou et al. [5] investigated the effect of adding cornstalk biochar treated with HNO3 and/or H2O2 on ammonia emissions during layer manure composting. They observed that incorporating 10% (by dry weight) of this treated biochar led to a 46% to 62% reduction in ammonia emissions. Chen et al. [6] demonstrated that surficial treatment of corn stover or red oak biochar on swine manure significantly reduced hydrogen sulfide emissions by 62% to 67%. Ro et al. [7] also reported that a pilot-scale odor removal system filled with pine biomass biochar effectively reduced volatile organic compounds emitted from a swine gestation barn to undetectable levels.
While bedded pack barns offer advantages for livestock welfare, improper management of the bedding’s moisture content can lead to an increased risk of mastitis and odor problems [8]. Given its large pore volume and high water-holding capacity, biochar presents a promising option for improving bedding conditions [9,10,11]. Biochar’s ability to absorb moisture from manure and adsorb odorous compounds can contribute to optimal bedding moisture levels and reduce odor emissions. Despite these potential benefits, few studies have explored the effects of biochar-amended bedding on odor reduction and overall cattle housing environments.
Determining the appropriate biochar addition rate is crucial for effective odor mitigation in cattle barns. Excessive biochar use can significantly increase bedding management costs and produce a substantial volume of manure requiring treatment [2]. Kaikiti et al. [12] reported a reduction in volatile organic compounds (VOCs) in a lab-scale experiment by applying 10% (by weight) of cattle manure biochar to raw cattle manure. However, this approach may pose practical challenges due to increased treatment costs and the need to handle larger manure volumes. Therefore, this study aims to evaluate the effectiveness of rice husk biochar in reducing odor emissions from a bedded pack dairy barn, with a particular focus on the impact of the biochar application rate.

2. Materials and Methods

2.1. Experiment Design

The lactating Holstein cow manure was collected from a bedded pack dairy barn four days before the start of the experiment. The dairy manure was stored at 4 °C and then incubated at 28 °C in a constant-temperature chamber for 48 h prior to the experiment. Each experimental unit consisted of 2.5 kg of dairy manure and 0.225 kg of sawdust. According to the housing standards set by the South Korean government, dairy cows housed in a bedded pack barn require a minimum of 16.5 m2 of space per head [13]. Additionally, the government has set a standard daily manure production rate of 30.1 kg for a 450 kg dairy cow [14]. Given the simulated bedded pack area of 0.031 m2, the average daily production of dairy cattle manure is 0.057 kg. Thus, 2.5 kg of dairy manure is equivalent to the amount accumulated over six weeks. The standard plan for livestock manure treatment facilities in South Korea recommends an optimal bedding material depth of 10 cm [15]. Based on the sawdust bulk density of 0.3 kg L−1 and the simulated bedded pack area of 0.031 m2, the appropriate amount of sawdust was calculated to be 0.94 kg (wet basis). However, to enhance odor emissions and better evaluate the odor mitigation effects of biochar, this study intentionally applied only 0.225 kg of sawdust, which is 24% (wet basis) of the recommended amount. This reduced bedding quantity was intended to simulate a highly loaded bedded pack condition, reflecting a scenario where the bedding has not been replaced for an extended period. Based on the calculated mixing ratio of 2.5 kg of manure to 0.225 kg of sawdust, this composition corresponds to approximately six months of manure accumulation following bedding replacement. Given that applying 10 cm of sawdust bedding and rearing dairy cows for six months results in a manure-to-sawdust weight ratio of approximately 11:1, the same as the ratio used in this study, the experimental conditions can be interpreted as simulating the state of the bedding pack six months after replacement. According to the 2023 Livestock Environment Survey conducted by the Republic of Korea’s Ministry of Agriculture, Food and Rural Affairs [16], the most common manure removal frequency in Korean dairy farms ranges from three to six months, reported by approximately 30% of surveyed operations. Therefore, this setup was designed to simulate a worst-case odor emission scenario under typical field conditions, thereby providing a robust basis for evaluating the mitigation performance of rice husk biochar. The control group consisted of a mixture of dairy manure and sawdust without biochar. Rice husk biochar was incorporated into the control at rates of 5% (35 g) and 10% (70 g) by dry weight, referred to as the 5% biochar treatment and 10% biochar treatment, respectively.
Each mixture was placed into a 14.1 L lab-scale simulated bedded pack chamber, and each experimental group was evaluated in triplicate (Figure 1). The experiment was conducted over 21 days, during which all chambers were placed in a constant-temperature room maintained at 28 °C. This temperature reflects the average maximum summer temperature in the Republic of Korea during the 2011–2020 period (29.1 ± 1.4 °C), aligning the experimental setting with conditions under which odor emissions from bedded pack systems are typically most pronounced [17]. To simulate the accumulation of manure in the barn, 0.4 kg of dairy manure was added to each experimental unit at 7-day intervals, for a total of two additions (on days 7 and 14) over the 21-day experimental period. Manure samples were taken pre- and post-manure addition. Sampling losses represent the sum of the collected sample mass and any residual material on the gloves.
Each chamber had a perforated plate in the lower section to facilitate representative odorous gas and leachate sampling (Figure 1). To simulate the mixing of air within the bedding driven by external winds and the activity of cattle, an air pump (SWT-20, WITHUS AIR, Busan, Republic of Korea) was utilized to replace the internal air of the lab-scale reactor at a ventilation rate of 0.24 L min−1, ensuring that the reactor’s internal volume was exchanged approximately once per hour. External air entered through the air inlet port at the center of the reactor lid, passed through the perforated plate, and exited through the outlet port at the bottom.

2.2. Properties of Raw Materials

The properties of the dairy manure, sawdust, and their mixture used in this study are presented in Table 1. The nitrogen and carbon contents of the samples were measured using an automatic elemental analyzer (FLASH 2000, Thermo Fisher Scientific, Waltham, MA, USA). The samples’ moisture content was measured by drying them at 105 °C for 24 h. The volatile solid (VS) content was analyzed by combusting the dried samples at 550 °C for 8 h. The wet bulk density of the samples was determined by measuring their weight and volume using a 1 L stainless steel bucket. The free air space (FAS) within the samples was calculated using the air-filled porosity equation presented by Ahn et al. [18].
The biochar used in this study, derived from rice husk through pyrolysis at 550 °C, was characterized as shown in Table 2. Thermogravimetric Analysis (TGA) was performed using a Thermal Analyzer (TGA 2, Mettler Toledo, Columbus, OH, USA) to determine the moisture and volatile solid content of the biochar. The TGA was conducted within a temperature range of 25 °C to 950 °C at a heating rate of 10 °C min−1. The nitrogen and carbon contents of rice husk biochar were measured using an automatic elemental analyzer (FLASH 2000, Thermo Fisher Scientific, Waltham, MA, USA). The pH of the rice husk biochar was analyzed using a pH meter (Orion 4 Star, Thermo Scientific, MA, USA). The mixing ratio of biochar to deionized water and the equilibrium time after mixing followed the methods suggested in previous literature [19]. Biochar pore properties were analyzed using a surface area analyzer (ASAP 2420, Micromeritics Instrument Corporation, Norcross, GA, USA) with N2 as the purge gas at 77 K. Specific surface area was calculated using the Brunauer-Emmett-Teller method [20]. Total pore volume was estimated from single-point adsorption at a relative pressure (P/P0) of about 0.99. The micropore surface area and micropore volume of biochar were obtained using the t-plot method [21]. The pore size distribution and average pore diameter were obtained through the Barrett-Joyner-Halenda method using the adsorption branch [22]. To investigate the surface morphological property and chemical composition of rice husk biochar, field-emission scanning electron microscopy (FE-SEM; CLARA, TESCAN, Brno, Czech Republic) coupled with energy-dispersive x-ray spectroscopy (EDS; Ultim Max, Oxford Instruments, Abingdon, United Kingdom) was used. The surface chemical structure of rice husk biochar was analyzed using an infrared spectrometer with a diamond ATR tip (Alpha-P, Bruker, Billerica, MA, USA) in the range of 400–4000 cm−1.

2.3. Analysis of Odorous Compounds

The odor mitigation effect of biochar was evaluated by measuring various odorous compounds. These include ammonia (NH3), sulfur compounds like hydrogen sulfide (H2S), methyl mercaptan (MM), dimethyl sulfide (DMS), dimethyl disulfide (DMDS), and volatile fatty acids (VFAs) such as acetic acid, propionic acid, isobutyric acid, butyric acid, isovaleric acid, and valeric acid. Additionally, phenol, p-cresol, and indole were measured. NH3 was measured using a tunable diode laser spectrometry-based laser gas detector (LGD Compact-A NH3/H2O, Axetris AG, 6056 Kaegiswil, Switzerland). The sulfur compounds were analyzed using a gas chromatograph (CP-3800, Varian Inc., Palo Alto, CA, USA) equipped with a pulsed flame photometric detector, a capillary column (CP-Sil 5 CB, length: 60 m, inner diameter: 0.32 mm, film thickness: 5 μm), and a thermal desorption instrument (UNITY series 1, Markes International Ltd., Bridgend, UK). Under these analytical conditions, with a sample preconcentration volume of 200 mL, the limit of detection (LOD) for sulfur compounds was approximately 0.625 μL m−3. VFAs and other organic compounds (phenol, p-cresol, and indole) were absorbed into Tenax TA-stainless steel tubes using an integrating pump (MP-∑30KNII, Sibata Scientific Technology Ltd., Saitama, Japan) and then analyzed using a thermal desorption instrument (TD100-xr, Markes International Ltd., Bridgend, UK) and a gas chromatograph (7890A, Agilent Technologies Inc., Santa Clara, CA, USA) equipped with a flame ionization detector and a capillary column (DB-Wax Ultra Inert, length: 30 m, inner diameter: 0.25 mm, film thickness: 0.25 μm). The column was heated from 40 °C to 150 °C at a heating rate of 10 °C min−1 and then heated at a rate of 18 °C min−1 up to 240 °C. For VFAs and other target organic compounds, when adsorbing 500 mL onto the Tenax TA tubes and analyzing with split ratios of 20:1, the estimated LOD was 2.5 ng.
Samples for NH3, sulfur compounds, VFAs, phenol, p-cresol, and indole were taken every one to five days. Odor unit samples were collected weekly. Every seven days, additional manure was mixed into the bedded pack, and all target gas samples for analysis were taken before and three hours after mixing to assess its impact on gas emissions. For each measurement, 8 L of gas was sampled from each reactor using a sampling pump (PCXR8, SKC Inc., Eighty Four, PA, USA). The 8 L of gas was collected in polyvinyl fluoride gas sampling bags (Tedlar bag, CEL Scientific Corp., Cerritos, CA, USA).
The emissions of odorous gases were calculated based on the gas concentration, ventilation rate, and gas temperature during each measurement using the following Equation (1):
O d o r o u s   g a s   e m i s s i o n g m 2   d a y 1 = C g a s × V × 273.15 273.15 + T g a s × M W 22,414 ÷ B S A
where:
  • C g a s : C o n c e n t r a t i o n   o f   e a c h   o d o r o u s   g a s   c o m p o u n d   ( m L   m 3 )
  • V : D a i l y   v e n t i l a t i o n   v o l u m e   ( m 3   d a y 1 )
  • T g a s : G a s   t e m p e r a t u r e   ( ° C )
  • M W : M o l e c u l a r   w e i g h t   o f   e a c h   o d o r o u s   g a s   c o m p o u n d   g   m o l 1
  • 22,414 : M o l a r   v o l u m e   o f   a n   i d e a l   g a s   a t   s t a n d a r d   c o n d i t i o n s   ( m L   m o l 1 )
  • B S A : B e d d i n g   s u r f a c e   a r e a   ( m 2 )
A dynamic olfactometry test was also conducted using a dynamic forced-choice olfactometer (SM100i, Scentroid, Whitchurch-Stouffville, ON, Canada) to assess the reduction in perceived odor. At least nine measurements were obtained for each experimental group to ensure a reliable assessment. This involved collecting three representative gas samples from each group and evaluating them at least in triplicate. Retrospective screening of the results was conducted in accordance with the method specified in European standard EN13725:2003 [23]. No personal or health-sensitive data were collected, and no invasive procedures were involved.
Oxygen concentration was measured using a galvanic cell sensor (SO-120, Apogee Instruments Inc., Logan, UT, USA).

2.4. Statistical Analysis

All data related to differences in odorous gas emission were analyzed using a one-way analysis of variance (ANOVA) with Origin pro software (Origin-Lab, version 8.1). Measured odor units were logarithmically transformed before calculating statistical parameters. The significance level was set to 0.05.

3. Results and Discussions
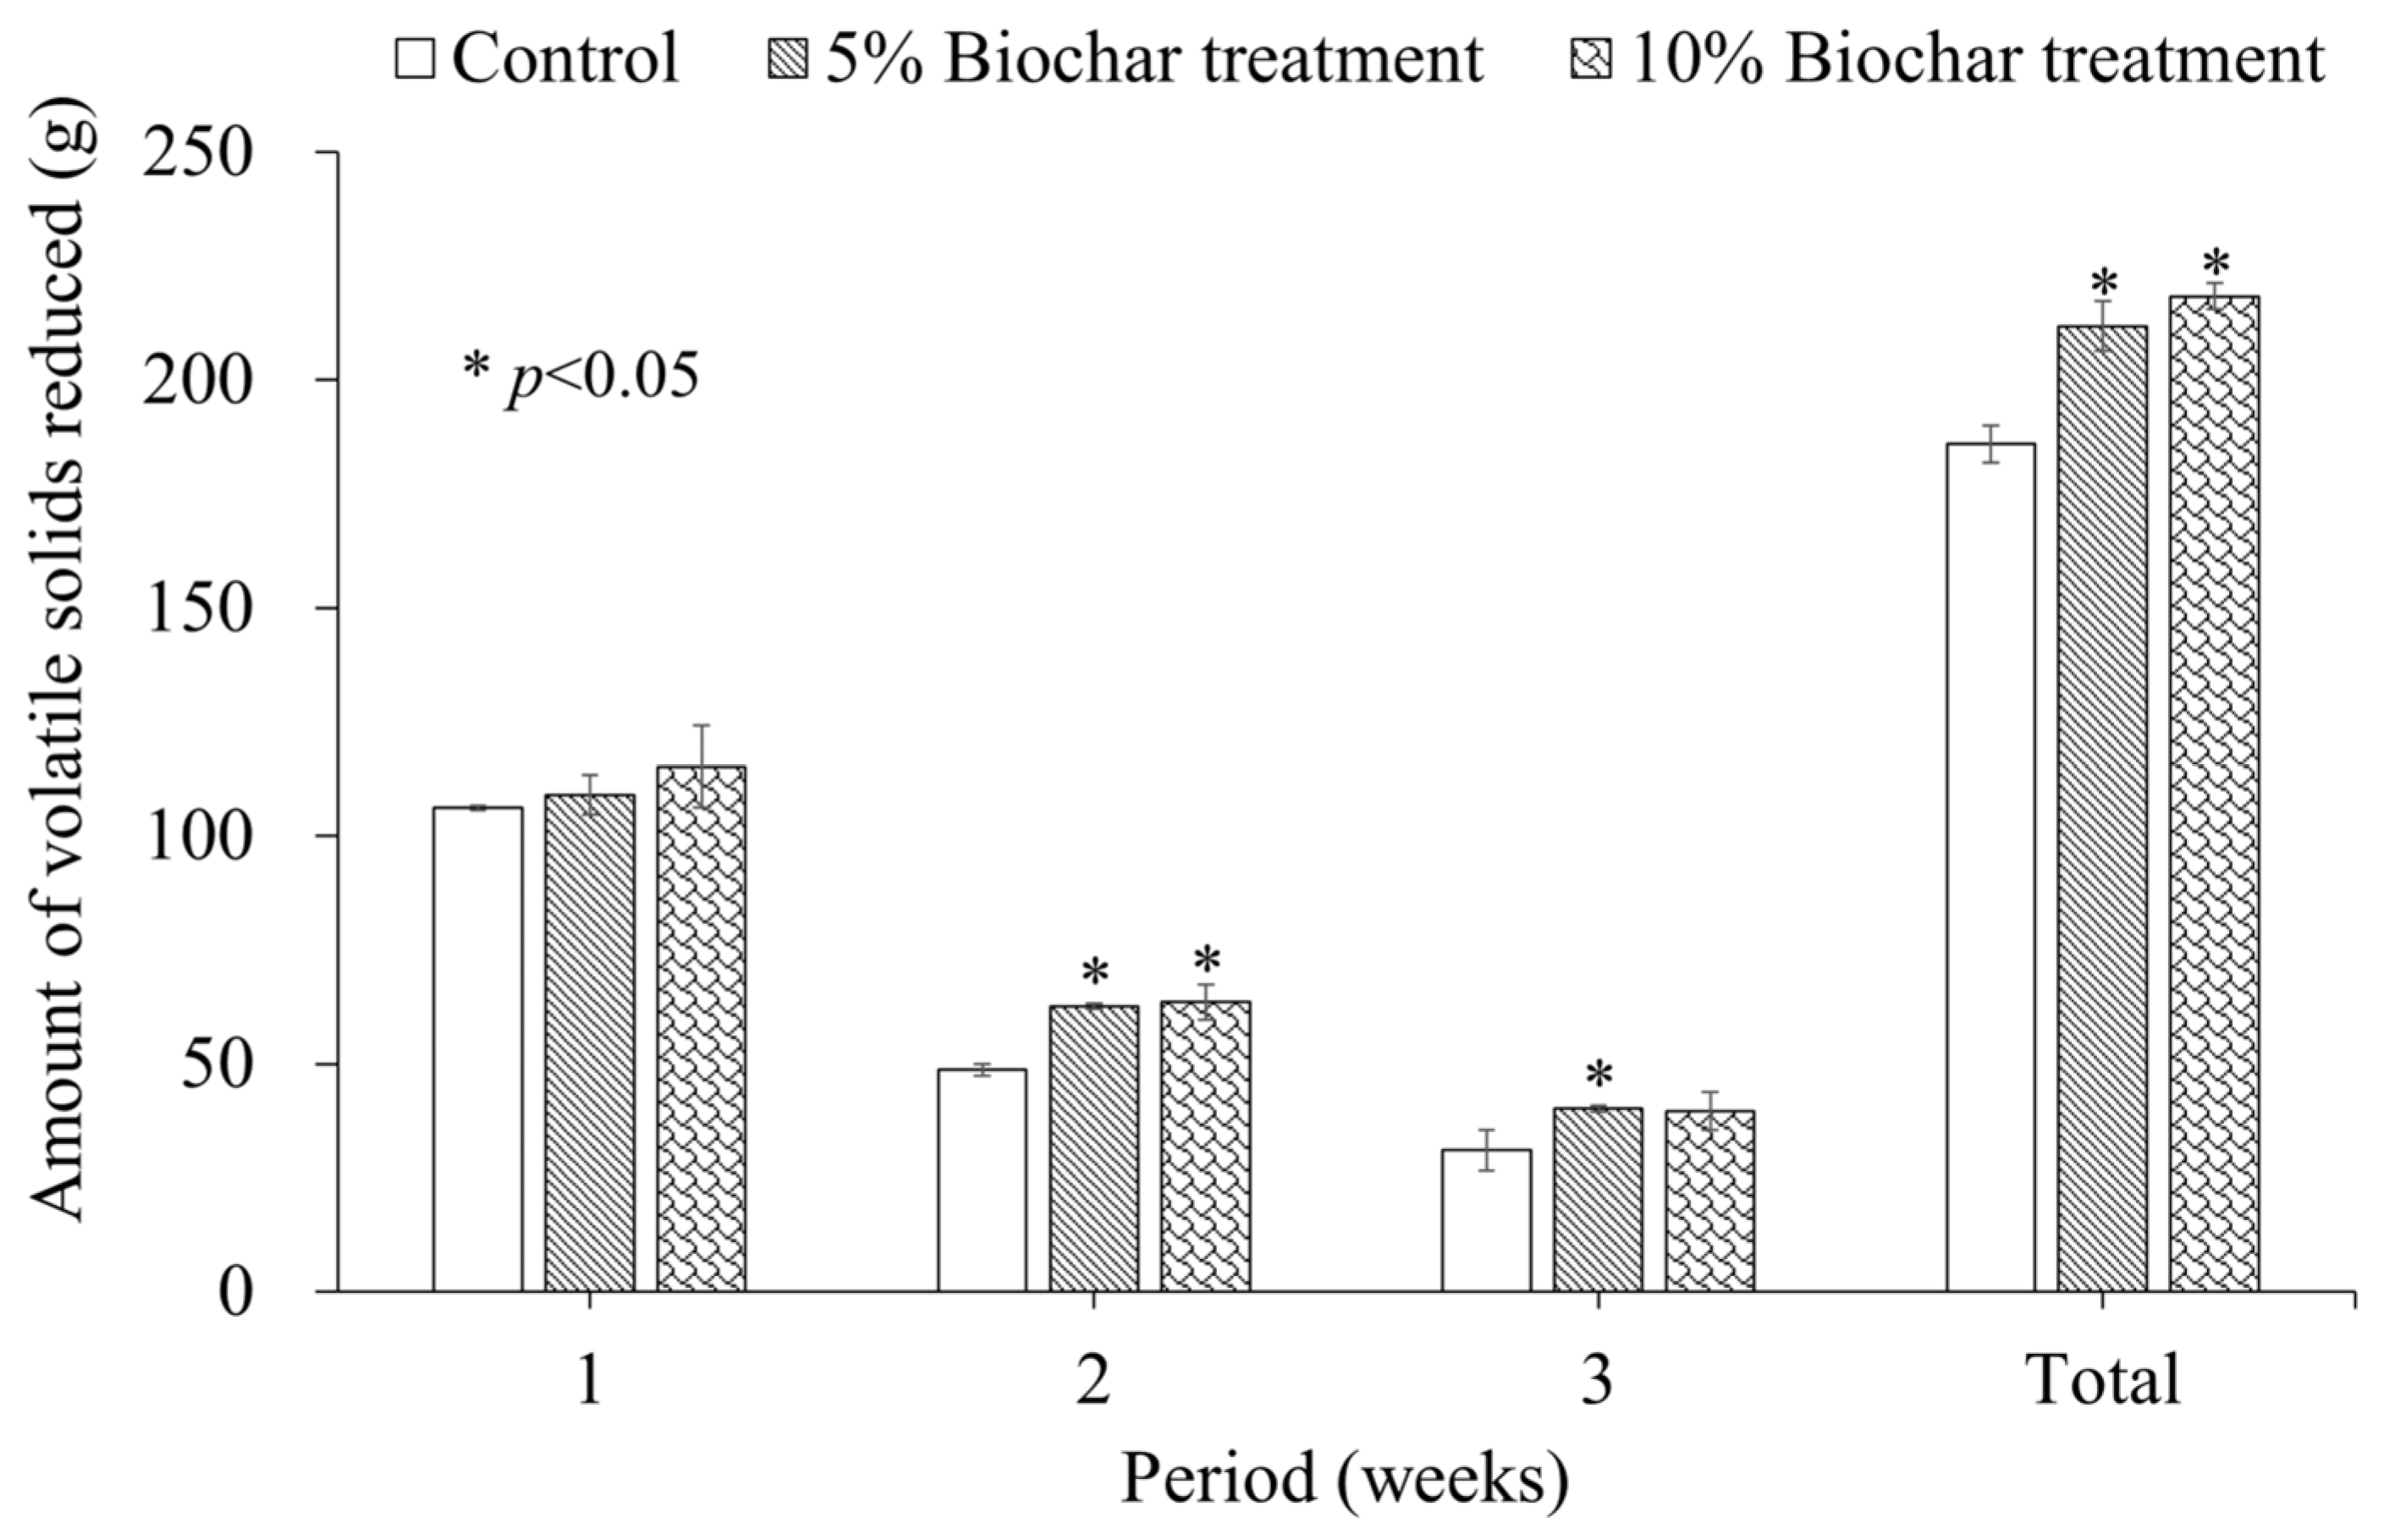
3.1. Biodegradation

The mass balance of volatile solids (VS) decomposition over the entire experimental period is presented in Table 3. At the start of the experiment, the VS content in the simulated bedded pack chamber was 617.7 ± 0.0 g for the control, 630.3 ± 3.1 g for the 5% biochar treatment, and 659.5 ± 1.2 g for the 10% biochar treatment. After 21 days, the VS content had decreased to 408.5 ± 3.6 g, 411.1 ± 3.6 g, and 423.5 ± 1.3 g, respectively. Considering the VS added through weekly manure additions and accounting for VS losses in sampled materials, the calculated VS decomposition was 185.9 ± 4.0 g for the control, 211.8 ± 5.5 g for the 5% biochar treatment, and 218.4 ± 2.9 g for the 10% biochar treatment. The biochar treatments exhibited greater VS decomposition compared to the control, with a 13.9% increase in the 5% biochar treatment and a 17.4% increase in the 10% biochar treatment (p < 0.05). This aligns with previous research, such as Wang et al. [24], who reported a similar increase in organic matter degradation with biochar amendment in sheep manure composting.
Figure 2 illustrates the weekly VS reduction across the experimental groups. During the first week, no significant differences in VS reduction were observed among the groups. However, significant differences emerged in the subsequent weeks. In the second week, VS reduction was significantly greater in both biochar treatments compared to the control. The 5% biochar treatment showed a 28.7% increase, and the 10% biochar treatment showed a 30.5% increase compared to the control (p < 0.05). A similar trend was observed in the third week. The 5% biochar treatment showed a significantly higher VS reduction (29.2%, p < 0.05) compared to the control. In the case of the 10% biochar treatment, the VS reduction (27.5%) was also higher than the control, with a p-value of 0.057. Although this does not meet the conventional threshold for statistical significance (p < 0.05), it may be interpreted as a marginally significant trend, suggesting a potential effect worthy of further investigation.
In composting processes, readily biodegradable materials are decomposed in the initial stages [25]. Similarly, VS decomposition was active in the first week of the experiment due to the high content of easily degradable material in the bedded pack. During this period, over 50% of the total decomposed VS for the entire 21-day experiment period was degraded in all experimental groups. The effect of biochar on enhancing VS decomposition was not noticeable at this stage. However, from the second week, when the VS decomposition rate slowed down, biochar’s effect on enhancing decomposition became more pronounced. This gradual response suggests that time may have been required for the microbial communities to adapt and establish within the biochar-amended environment, thereby enhancing the decomposition process more effectively in the later stages of the experiment [26,27].
The initial free air space (FAS) was 4.6% and 9.6% higher in the 5% and 10% biochar treatment groups, respectively, compared to the control, due to biochar addition (Table 4). Over the 21-day experiment, the control showed a 28.7% reduction in FAS, whereas the 5% biochar treatment exhibited a 30.9% reduction, approximately 1.07 times higher than the control, though not statistically significant. Meanwhile, the 10% biochar treatment showed a further reduction of 32.9%, approximately 1.14 times higher than the control, with statistical significance (p < 0.05). This indicates active organic matter decomposition in the treatment groups. As microbial decomposition progresses, the particle size of the bedded pack tends to decrease. This reduction in particle size is associated with the physical breakdown of organic materials [28,29].
Specifically, adding biochar to the bedded pack can facilitate microbial activity in some regions of the manure, manifesting as an increase in the O2 consumption rate. The O2 concentrations of the treatment groups exhibited a generally lower trend than those in the control over the 21-day experimental period (Figure 3). The tendency of lower O2 concentrations in the treatment groups, which had higher FAS compared to the control, indicates that active decomposition of organic matter by aerobic microorganisms occurred in the treatment groups. Biochar, exhibiting physical properties similar to bulking agents, supports forming a favorable environment for aerobic bacteria to proliferate stably in the bedded pack [30].

3.2. Ammonia

The control emitted 178.3 ± 7.5 mg m−2 day−1 of NH3, while the 5% biochar treatment and 10% biochar treatment emitted 130.8 ± 24.1 mg m−2 day−1 and 101.7 ± 4.5 mg m−2 day−1, respectively, representing reductions of 26.6% and 43.0% compared to the control (p < 0.05, Table 5).
Dividing the entire experimental period into weekly intervals, the effect of rice husk biochar in reducing daily NH3 emissions was observed only up to the first week in the 5% biochar treatment and up to the second week in the 10% biochar treatment (Table 5). The reduction rates of NH3 emissions in the first week were 30.9% in the 5% biochar treatment and 45.6% in the 10% biochar treatment, while the average NH3 reduction rate in the second week for the 10% biochar treatment was 38.9% (p < 0.05).
At the start of the experiment, the total nitrogen (TN) content on a dry basis was 2.1 ± 0.0%. By the end of the experiment, the TN content was 1.4 ± 0.1% for the control, 1.6 ± 0.1% in the 5% biochar treatment, and 1.7 ± 0.1% in the 10% biochar treatment. These values represent reductions of 31.7 ± 4.5% in the control, 20.7 ± 6.8% in the 5% biochar treatment, and 15.1 ± 2.7% in the 10% biochar treatment (p < 0.05). This indicates higher TN retention in the treatment groups compared to the control. The effect of biochar on reducing NH3 volatilization and retaining nitrogen in bedded packs results from its ability to adsorb ammoniacal nitrogen onto its surface [31,32]. Similar findings have been reported in previous studies, demonstrating the effectiveness of biochar in reducing nitrogen losses and enhancing nitrogen retention during composting. Awasthi et al. [33] observed that adding 2–10% bamboo biochar to poultry manure significantly reduced nitrogen losses, with NH3-N emissions decreasing from 47.8% in the control group to 38.7–10.8% in the biochar treated groups. Similarly, TN losses were reduced from 53.5% in the control group to 43.7–12.6% in the biochar treatments. Bello et al. [34] reported that the addition of 10% rice straw biochar resulted in a final compost TN content of 2.2% (dry basis) in the treatment group, compared to 1.9% in the control. These studies collectively support the findings of the present study, indicating that biochar supplementation can effectively mitigate nitrogen losses and improve nitrogen retention during organic waste management.
However, although direct comparisons are challenging because the odor reduction effectiveness of biochar can vary depending on factors such as its feedstock, the matrix to which it is applied, the application method, and any pretreatment [35,36,37,38,39,40], the 10% biochar treatment group exhibited a slightly lower NH3 reduction effect compared to those observed in previous studies. Agyarko-Mintah et al. [4] found that adding 10% green waste biochar or poultry litter biochar to a poultry litter and straw composting mixture reduced ammonia emissions by 58% and 38%, respectively, while increasing nitrogen retention in the finished compost to 84% and 78%, compared to 67% in the control. Zhou et al. [5] also demonstrated that the addition of modified cornstalk biochar reduced NH3 emissions by 46–62% during the composting of layer manure. This difference in NH3 reduction performance can likely be attributed to the moisture content of the feedstock and differences in biochar properties. One significant factor is the initial moisture content; in this study, it was approximately 75%, compared to 60% in Agyarko-Mintah et al. [4] and 50–55% in Zhou et al. [5]. High moisture levels in feedstocks can present a significant challenge to NH3 adsorption efficacy; water vapor may compete with gaseous compounds for adsorption sites on porous materials, thereby limiting the availability of active sites for odorant capture [41]. Manyà et al. [42] demonstrated that water vapor significantly inhibited CO2 adsorption in biochar-packed beds by impeding diffusion into micropores and reducing breakthrough time. Although the exact moisture threshold remains undefined, prior studies suggest that excessive moisture can reduce the accessibility of internal pores and impair gas transport. Additionally, the superior performance reported by Zhou et al. may also reflect differences in biochar physicochemical properties. Their modified biochar exhibited a much larger specific surface area (399–485 m2 g−1) and pore volume (0.15–0.27 cm3 g−1) compared to unmodified rice husk biochar. These enhancements likely increased the number of accessible sorption sites and facilitated mass transfer of NH3 species.

3.3. Sulfur Compounds

Daily DMS emissions, averaged over the entire experimental period, were measured as 7.1 ± 0.8 mg m−2 day−1 for the control, 3.3 ± 0.3 mg m−2 day−1 for the 5% biochar treatment, and 1.8 ± 0.2 mg m−2 day−1 for 10% biochar treatment, showing reductions of 53.1% and 74.5% for the 5% and 10% biochar treatments, respectively, compared to the control (p < 0.05, Table 6). While adding rice husk biochar significantly reduced DMS emissions, it had no apparent impact on H2S, MM, or DMDS levels. Nguyen and Lee [43] reported that amine-modified chicken manure biochar exhibited an adsorption capacity of about 1.1 mg g−1 for DMS in an aqueous solution. In addition, it was found that DMS accounted for about 82–97% of the total sulfur compound emissions in the experimental groups. Tamura et al. [44] reported that H2S and DMDS were not detected during composting of cattle manure, while MM and DMS were continuously detected over 55 days. Aizawa et al. [45] identified that DMS and acetone emitted from dairy cattle manure accounted for about 60% and 90% of the total volatile organic compounds emitted from feces and urine, respectively.
Throughout the experimental period, the reduction effect on daily DMS emissions by rice husk biochar was observed up to the second week in both 5% and 10% biochar treatments (Table 6). The reduction rates of daily DMS emissions during the first week were 54.1% for the 5% biochar treatment and 75.0% for the 10% biochar treatment, while the DMS reduction rates in the second week were 37.6% in the 5% biochar treatment and 69.5% in the 10% biochar treatment, compared to the control (p < 0.05). While the reduction effect diminished from the third week onward, the significant decrease in DMS emissions during the first and second weeks contributed substantially to the overall mitigation effect. Approximately 79% of the total DMS emissions from the control were released within the first three days of the experiment. During the same period, around 58–59% of the total DMS emissions from the 5% biochar treatment and 10% biochar treatment were emitted. The lower DMS emissions in the treatment groups were attributed to the better maintenance of aerobic conditions in the treatment groups compared to the control. During this period, oxygen concentrations in the control remained below 5% (1.7–4.9%) for two consecutive days, indicating anaerobic conditions [46]. In contrast, the treatment groups experienced oxygen levels below 5% for only one day during the same period, with levels reaching 1.6 ± 0.1% in the 5% biochar treatment and 1.4 ± 0.1% in the 10% biochar treatment (Figure 3). This difference was attributed to the addition of biochar, with its porous structure enhancing air permeability and improving aerobic conditions. These improved bedding conditions suppressed anaerobic microorganisms, such as sulfate-reducing bacteria, which played a key role in DMS formation by mineralizing precursors like sulfite (SO32−) and sulfate (SO42−) under anaerobic conditions [47]. Gao et al. [48] reported that approximately 77% of DMS during swine manure composting originates from SO32− and SO42−. Therefore, the enhanced aerobic conditions promoted by biochar addition contributed to the reduction of DMS emissions, and the early reduction of DMS formation in the treatment groups likely played a crucial role in achieving significant overall emission reductions.

3.4. Volatile Fatty Acids & Volatile Organic Compounds

Table 7 summarizes the weekly average emissions of total volatile fatty acids (TVFA) and key volatile organic compounds (VOCs), including phenol, p-cresol, and indole. Contrary to the initial hypothesis that rice husk biochar would mitigate TVFA and VOC emissions, the results revealed complex and sometimes unexpected trends. TVFA emissions fluctuated over the three-week experimental period but did not show significant differences between the control and biochar treatments. This suggests that, under the given conditions, biochar had minimal influence on TVFA emissions. In contrast, phenol emissions increased with biochar addition, particularly in the 10% treatment, which showed a statistically significant rise (p < 0.05). This unexpected increase may be due to the presence of phenolic compounds or their precursors in the biochar itself or changes in microbial activity favoring phenol production. Further investigation is required to determine the mechanisms underlying this response. The effect of biochar on p-cresol emissions appeared time-dependent. While no significant differences were observed in the first two weeks, the 10% biochar treatment significantly reduced p-cresol emissions in the third week (p < 0.05). This suggests a delayed effect, possibly due to biochar-induced changes in microbial communities or bedding properties over time. Indole emissions were only detected in the first week and were undetectable thereafter, likely due to rapid degradation or volatilization. No significant differences were observed between the control and biochar treatments, indicating that biochar did not have a measurable effect on indole emissions.
These findings highlight the complex role of rice husk biochar in TVFA and VOC emissions. While biochar did not significantly impact TVFA and indole emissions, it unexpectedly increased phenol emissions and showed a delayed reduction in p-cresol emissions. These results emphasize the need for further research to clarify the mechanisms driving these changes and assess biochar’s long-term impact on VOC emissions under different environmental conditions.
Previous studies have reported varying effects of biochar on VOC mitigation, likely due to differences in biochar properties, application methods, and manure characteristics. Kaikiti et al. [12] found that applying cattle manure biochar at 10% (w/w) reduced total VOC emissions by more than 50% in a lab-scale sorption experiment. Similarly, Maurer et al. [39] observed a 13% reduction in NH3 emissions when fine biochar (4.57 kg m−2) was applied to stored swine manure. However, their study reported no significant reduction in VFA and VOC emissions (e.g., n-butyric acid, valeric acid, isovaleric acid, p-cresol, indole, and skatole), nor sulfur compound emissions (H2S, DMDS, and Dimethyl trisulfide). These inconsistencies across studies may stem from variations in biochar and manure characteristics, biochar application method, dominant microbial consortia, and environmental conditions [49,50].

3.5. Odor Unit

The logarithmically transformed odor unit values were measured over 21 days to evaluate the effect of biochar application (Table 8). At the beginning of the experiment (day 0), odor unit values in the control and biochar treatments ranged from 2.1 to 2.5. By day 7, odor units had decreased to 1.8–2.0 across all groups, corresponding to an odor reduction of approximately 49.9–68.4% compared to the initial values. The biochar 10% treatment showed a significant 36.1% reduction compared to the control (p < 0.05), while no significant differences were observed in the 5% treatment. From day 14 onward, odor unit values stabilized at approximately 1.4–1.5, reflecting an overall reduction of 80.0–90.0% compared to the initial values. Despite adding fresh manure on days 7 and 14, odor levels remained relatively constant after the second week.
By the end of the experiment (day 21), the odor unit values had further decreased to 1.3–1.5, representing a total reduction of 80.0–93.7% from the initial levels. However, no significant differences were observed among the control, biochar 5%, and 10% treatments at this stage, indicating that the biochar’s initial effect on odor reduction diminished over time.
The observed transient odor reduction can be attributed to the progressive attenuation of the dominant mitigation mechanisms over time. Initially, biochar’s porous structure facilitated the adsorption of volatile odorants such as NH3. At the same time, its low bulk density improved the physical aeration of the bedded pack, thereby inhibiting the formation of anaerobic metabolites like DMS. These synergistic effects—adsorptive and structural—were likely responsible for the significant odor reduction observed during the early phase. However, with continued manure loading, the mitigation efficacy declined. This decrease was likely due to the progressive occupation of biochar’s adsorption sites by organic compounds, approaching saturation over time, alongside gradual pore blockage caused by particulate and dissolved organic matter. Such occlusion may have reduced the accessibility of active sorption sites and impaired the biochar’s capacity to enhance air diffusion.
The observed decline in odor mitigation effectiveness over time is supported by previous studies that highlight mechanisms, such as adsorption site saturation, pore blockage, and the finite effectiveness of single biochar applications, that may contribute to such temporal reductions. Chen et al. [38] observed enhanced odor mitigation through repeated biochar application during swine manure storage. In their 8-week study, bi-weekly surface reapplication of biochar at 2 kg m−2 yielded superior odor reduction compared to one-time applications at 2 kg m−2 and 4 kg m−2. From this, it can be inferred that the continued availability of fresh sorption surfaces may play a critical role in achieving effective odor mitigation. Furthermore, the mechanisms behind the declining efficacy observed in this study are supported by Li et al. [51], which demonstrated that biochar’s adsorption sites can become saturated when exposed to organic compounds, resulting in a marked reduction in adsorption capacity. A complementary explanation is provided by Martin et al. [52], who found that biochar aged in plant-root environments experienced significant pore blockage due to organic exudates and biofilm formation. While mechanistically distinct from direct adsorption site saturation by odorants, this physical occlusion not only limits access to active sorption sites but could also reduce the overall porosity and air permeability of the biochar-amended pack. This multifaceted degradation of biochar’s mitigation capabilities—encompassing both reduced active site and impaired physical structure—accounts for the diminished odor reduction observed under continuous manure loading in this lab-scale study. Therefore, under field conditions where manure continuously accumulates, the pores of biochar, which play a key role in NH3 and DMS adsorption, are likely to become saturated more rapidly. This accelerated saturation could further limit the long-term effectiveness of biochar in mitigating these gaseous emissions in practical dairy bedded pack systems. This highlights the need for strategies to sustain performance, such as periodic reapplication. For instance, given that the 5% biochar application in this study (half the dosage of the 10% treatment) still achieved approximately 63% and 70% of the NH3 and DMS reduction seen with 10% biochar, a phased approach involving two 5% applications at intervals—effectively matching the total 10% dosage—could be a strategic way to provide fresh adsorption surfaces and potentially maintain higher efficacy over time. Moreover, from a practical and economic perspective, the 5% biochar rate may be more feasible for farmers. Applying 10% biochar by dry weight requires a significantly larger quantity of material and labor, increasing both purchase costs and handling burden. In contrast, the 5% treatment reduces the required volume by half, lowering material costs and making field application more manageable—particularly in large-scale operations. Although its odor mitigation performance is slightly lower, the 5% rate offers a more cost-effective, scalable, and sustainable solution for commercial dairy facilities.

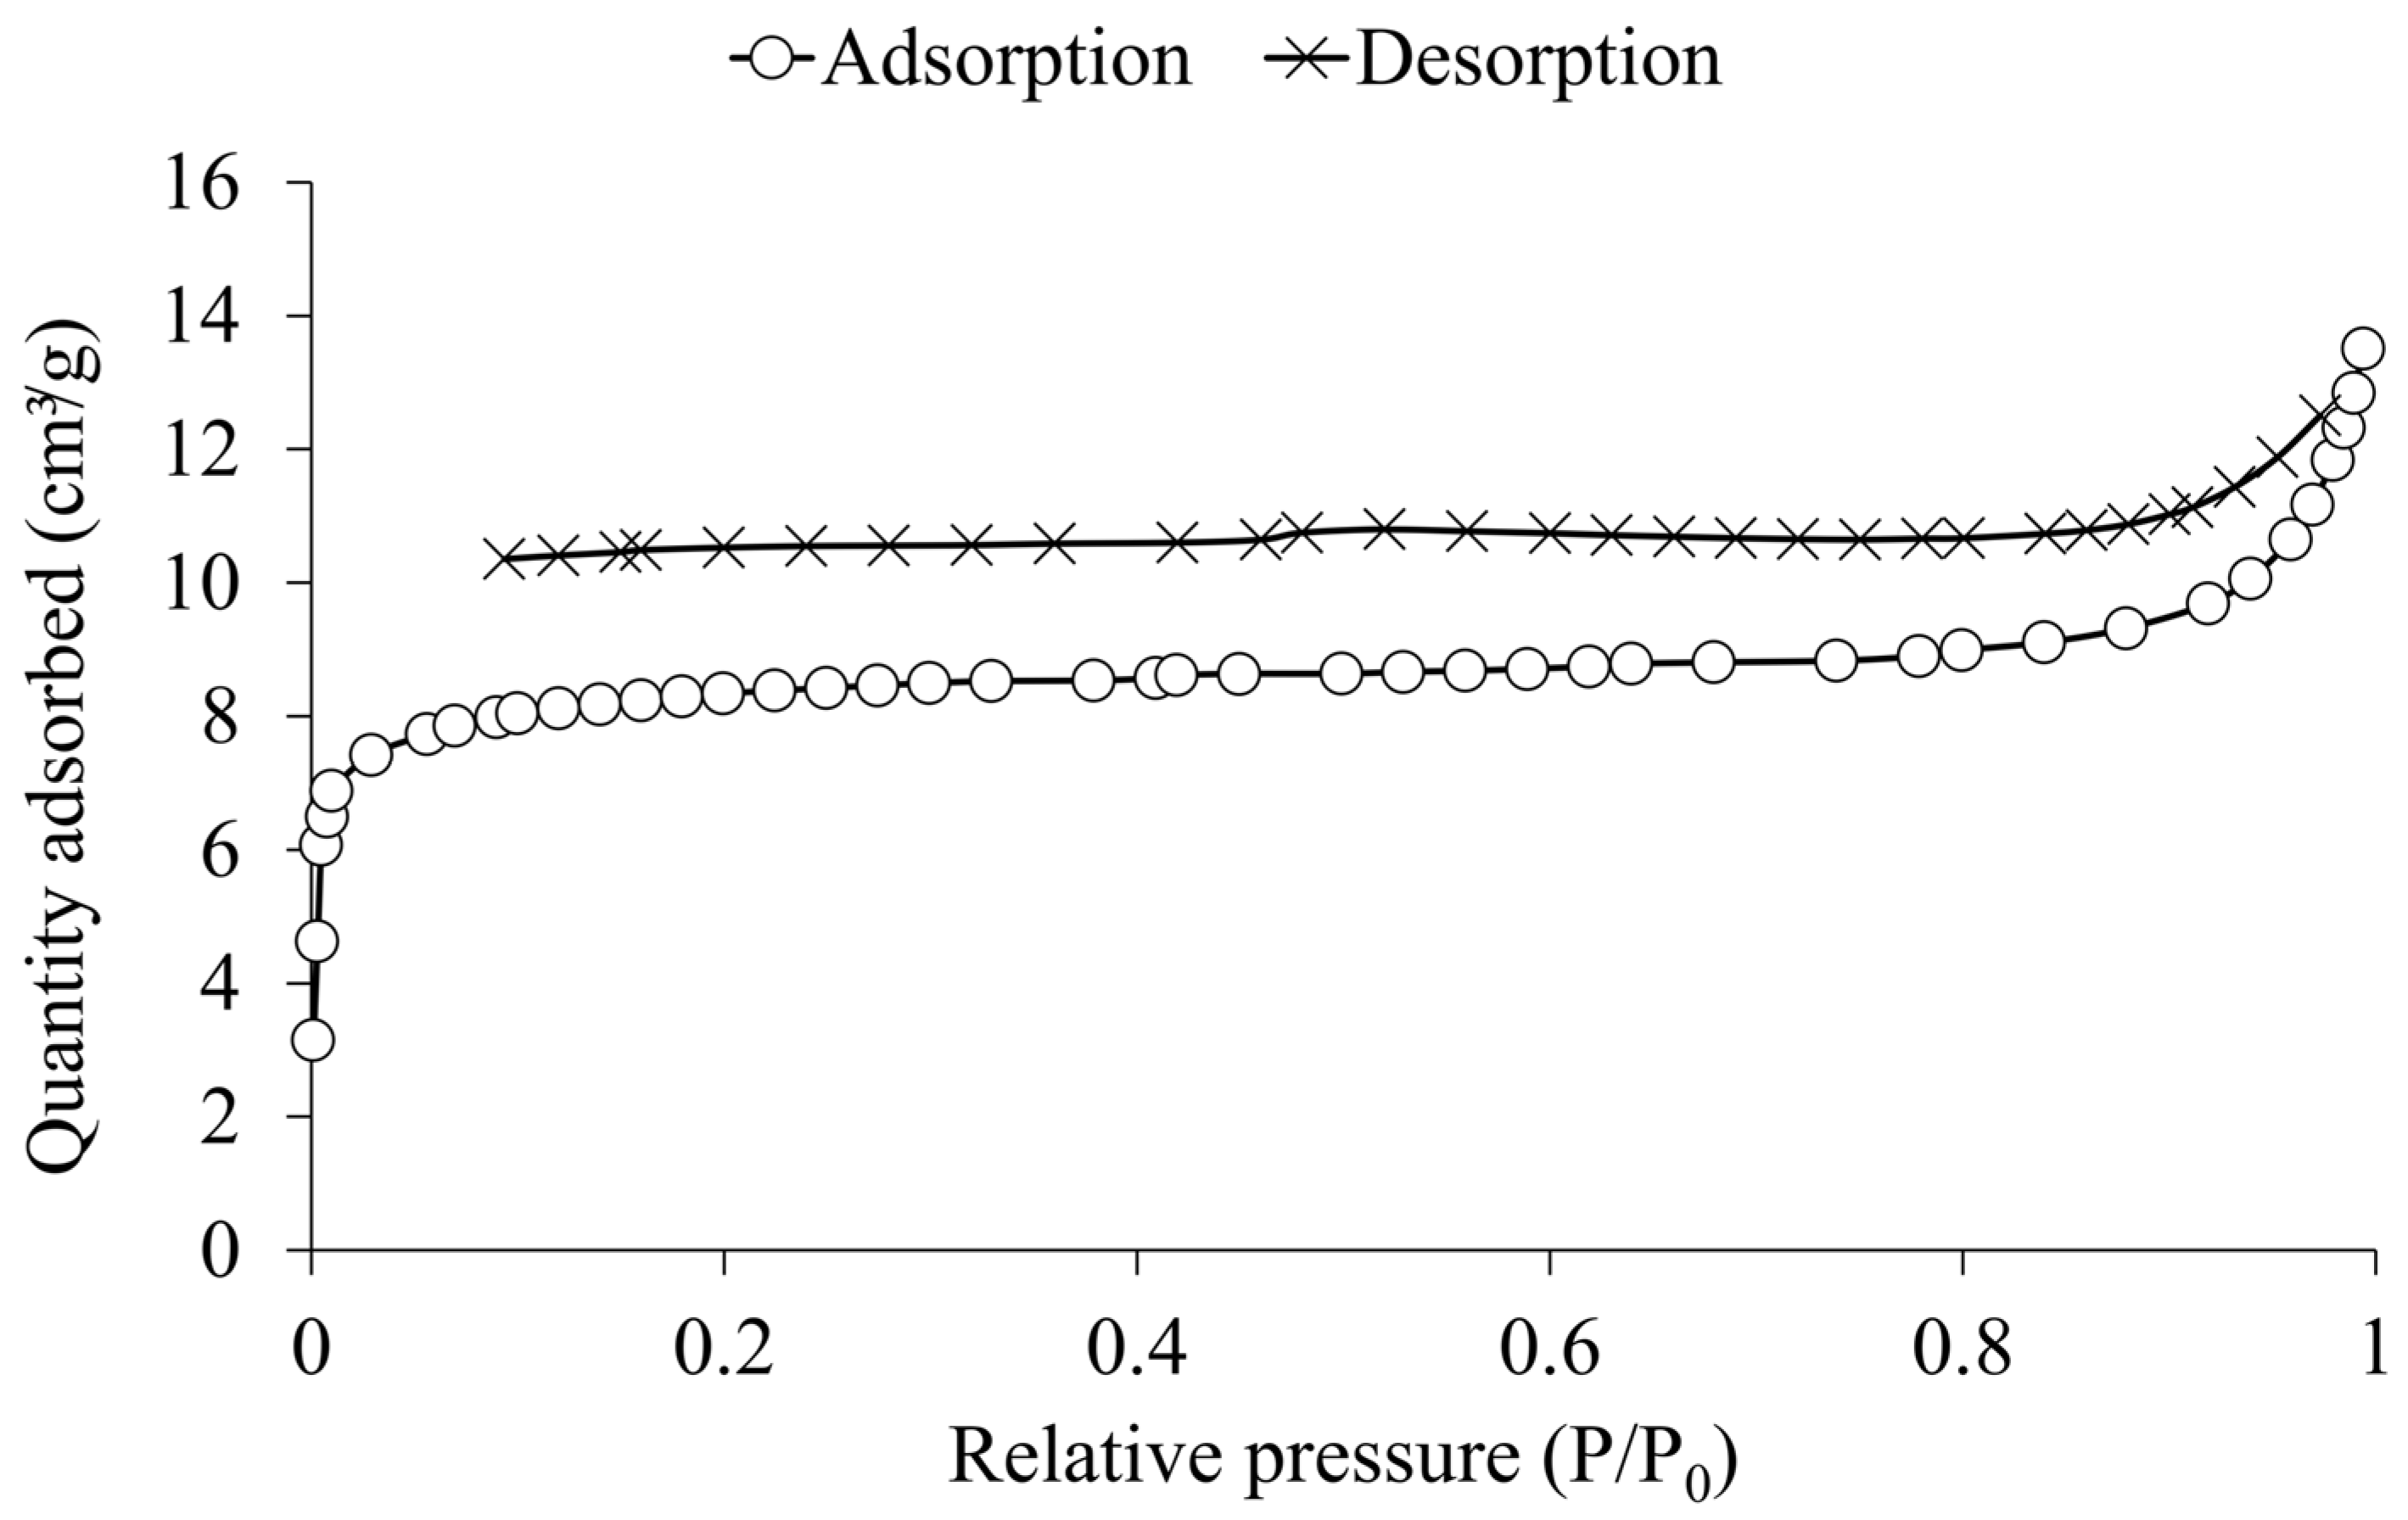
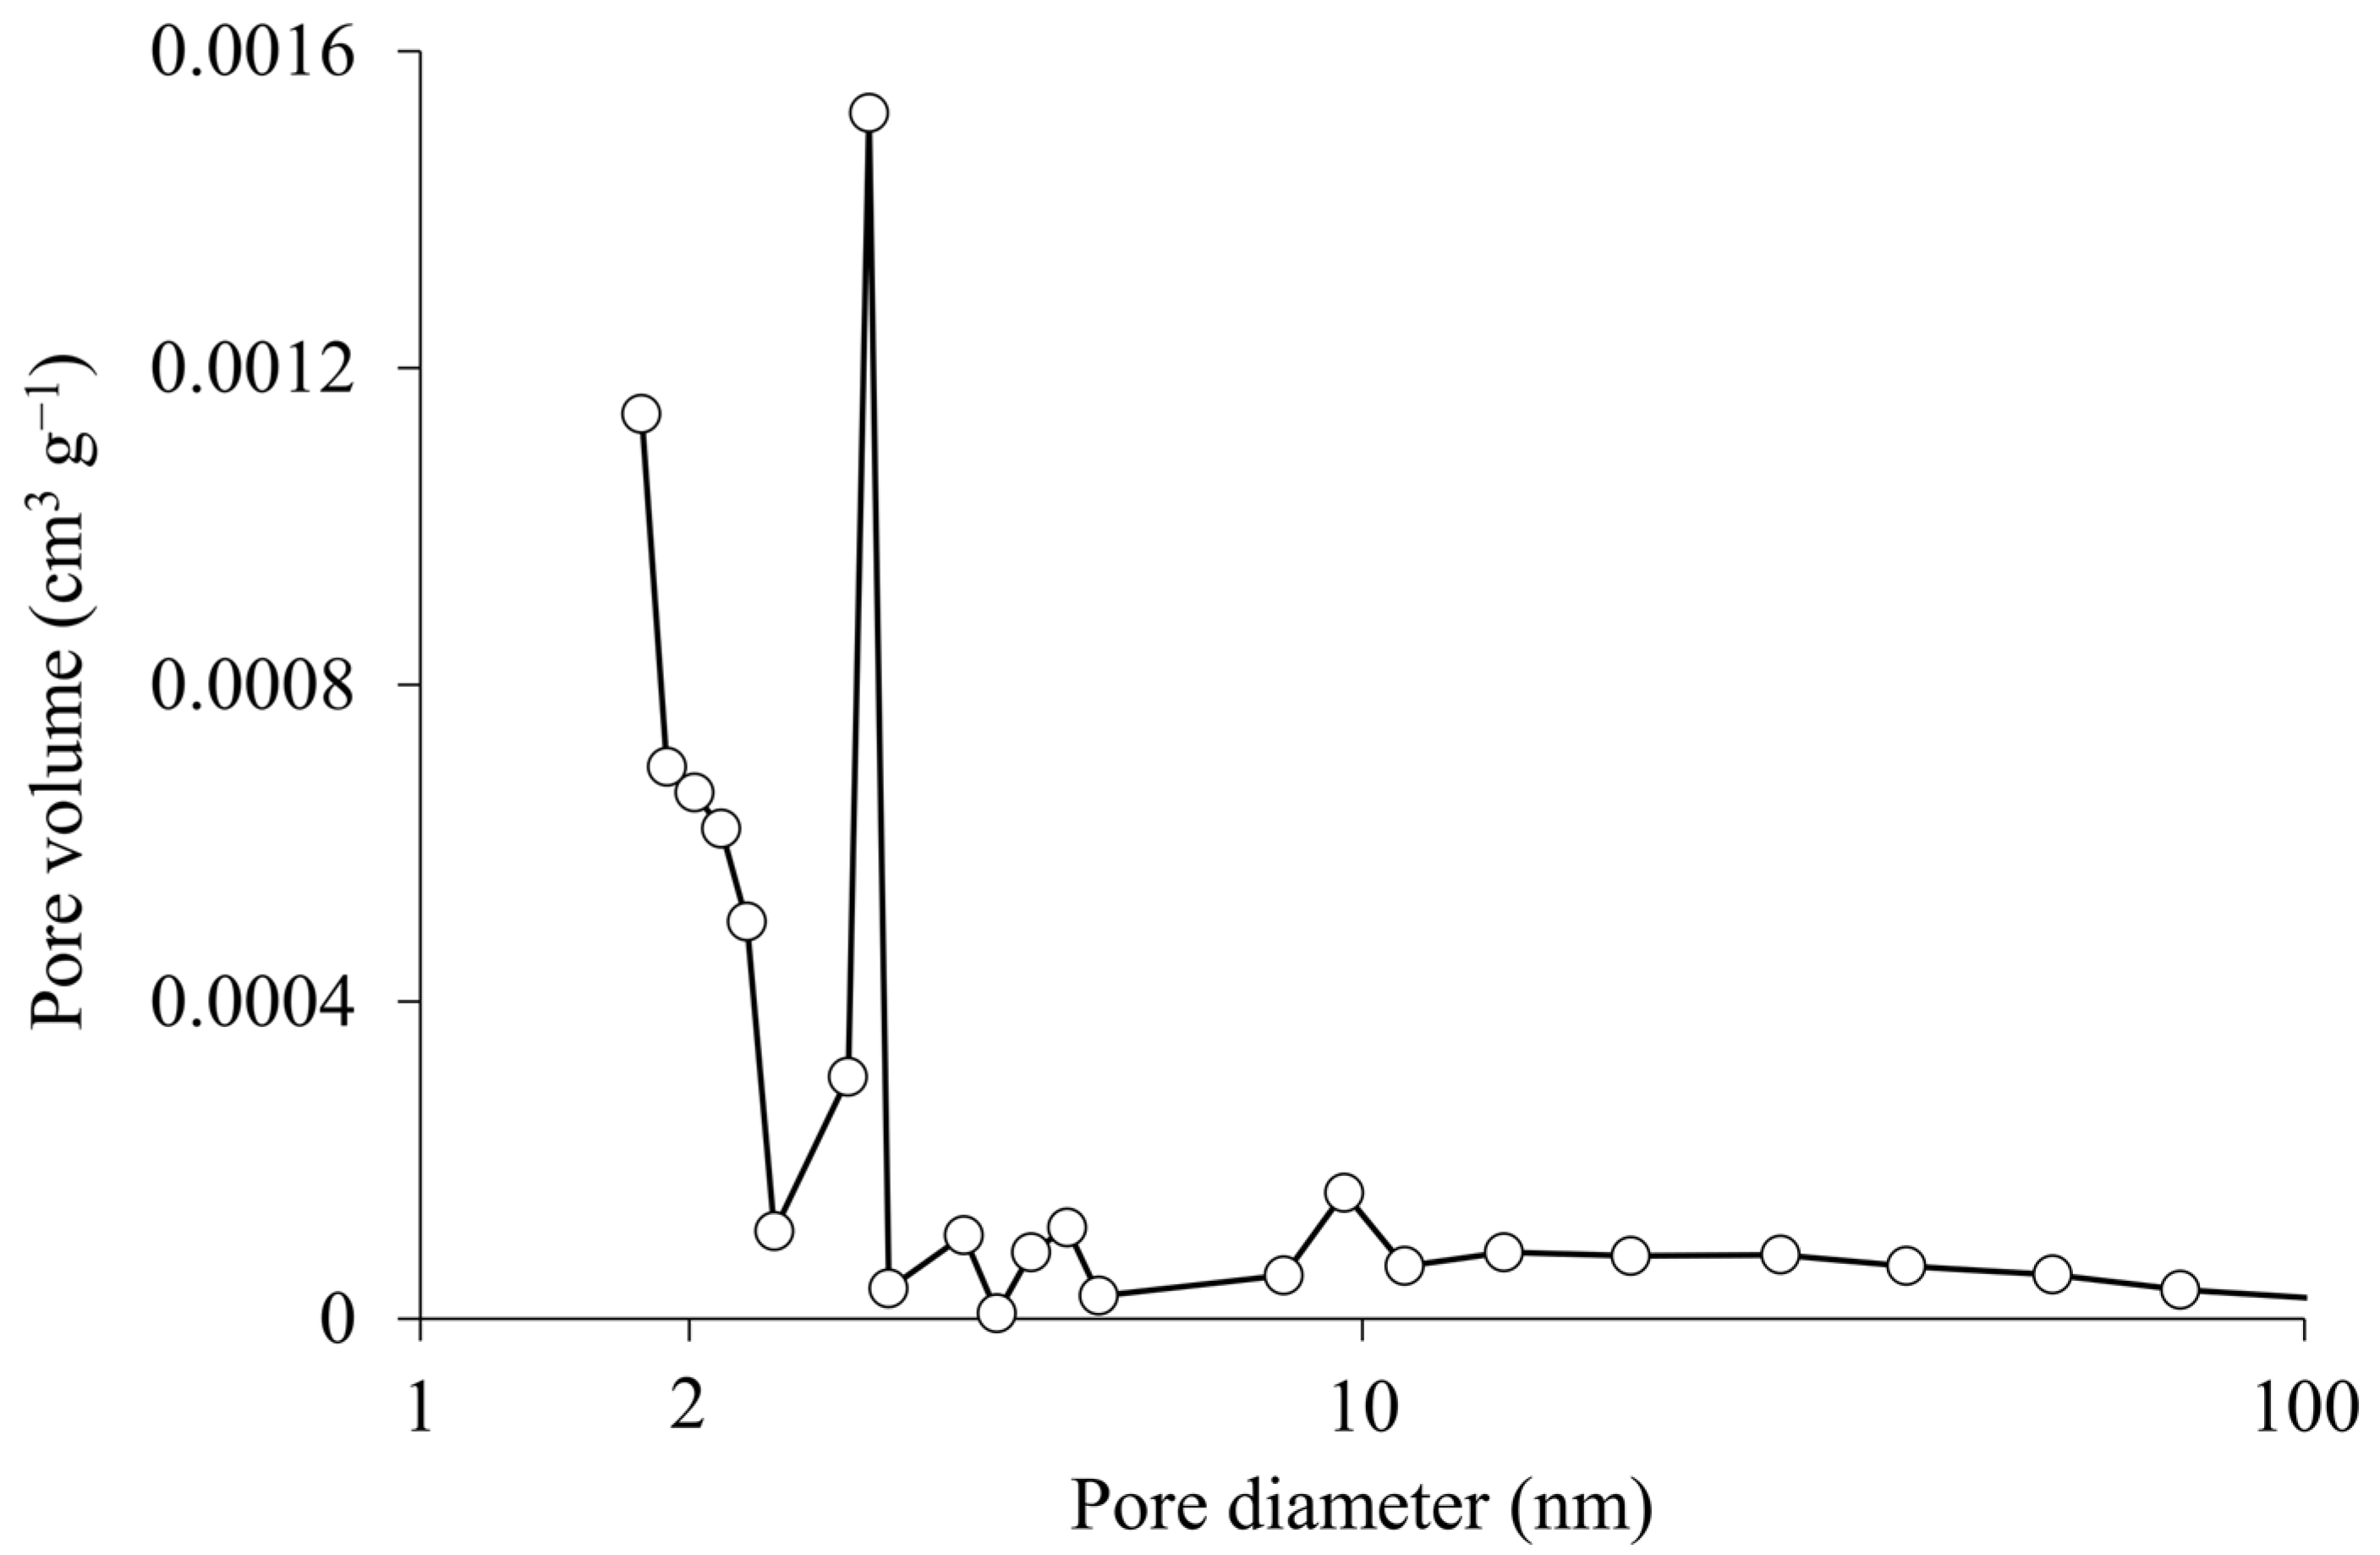
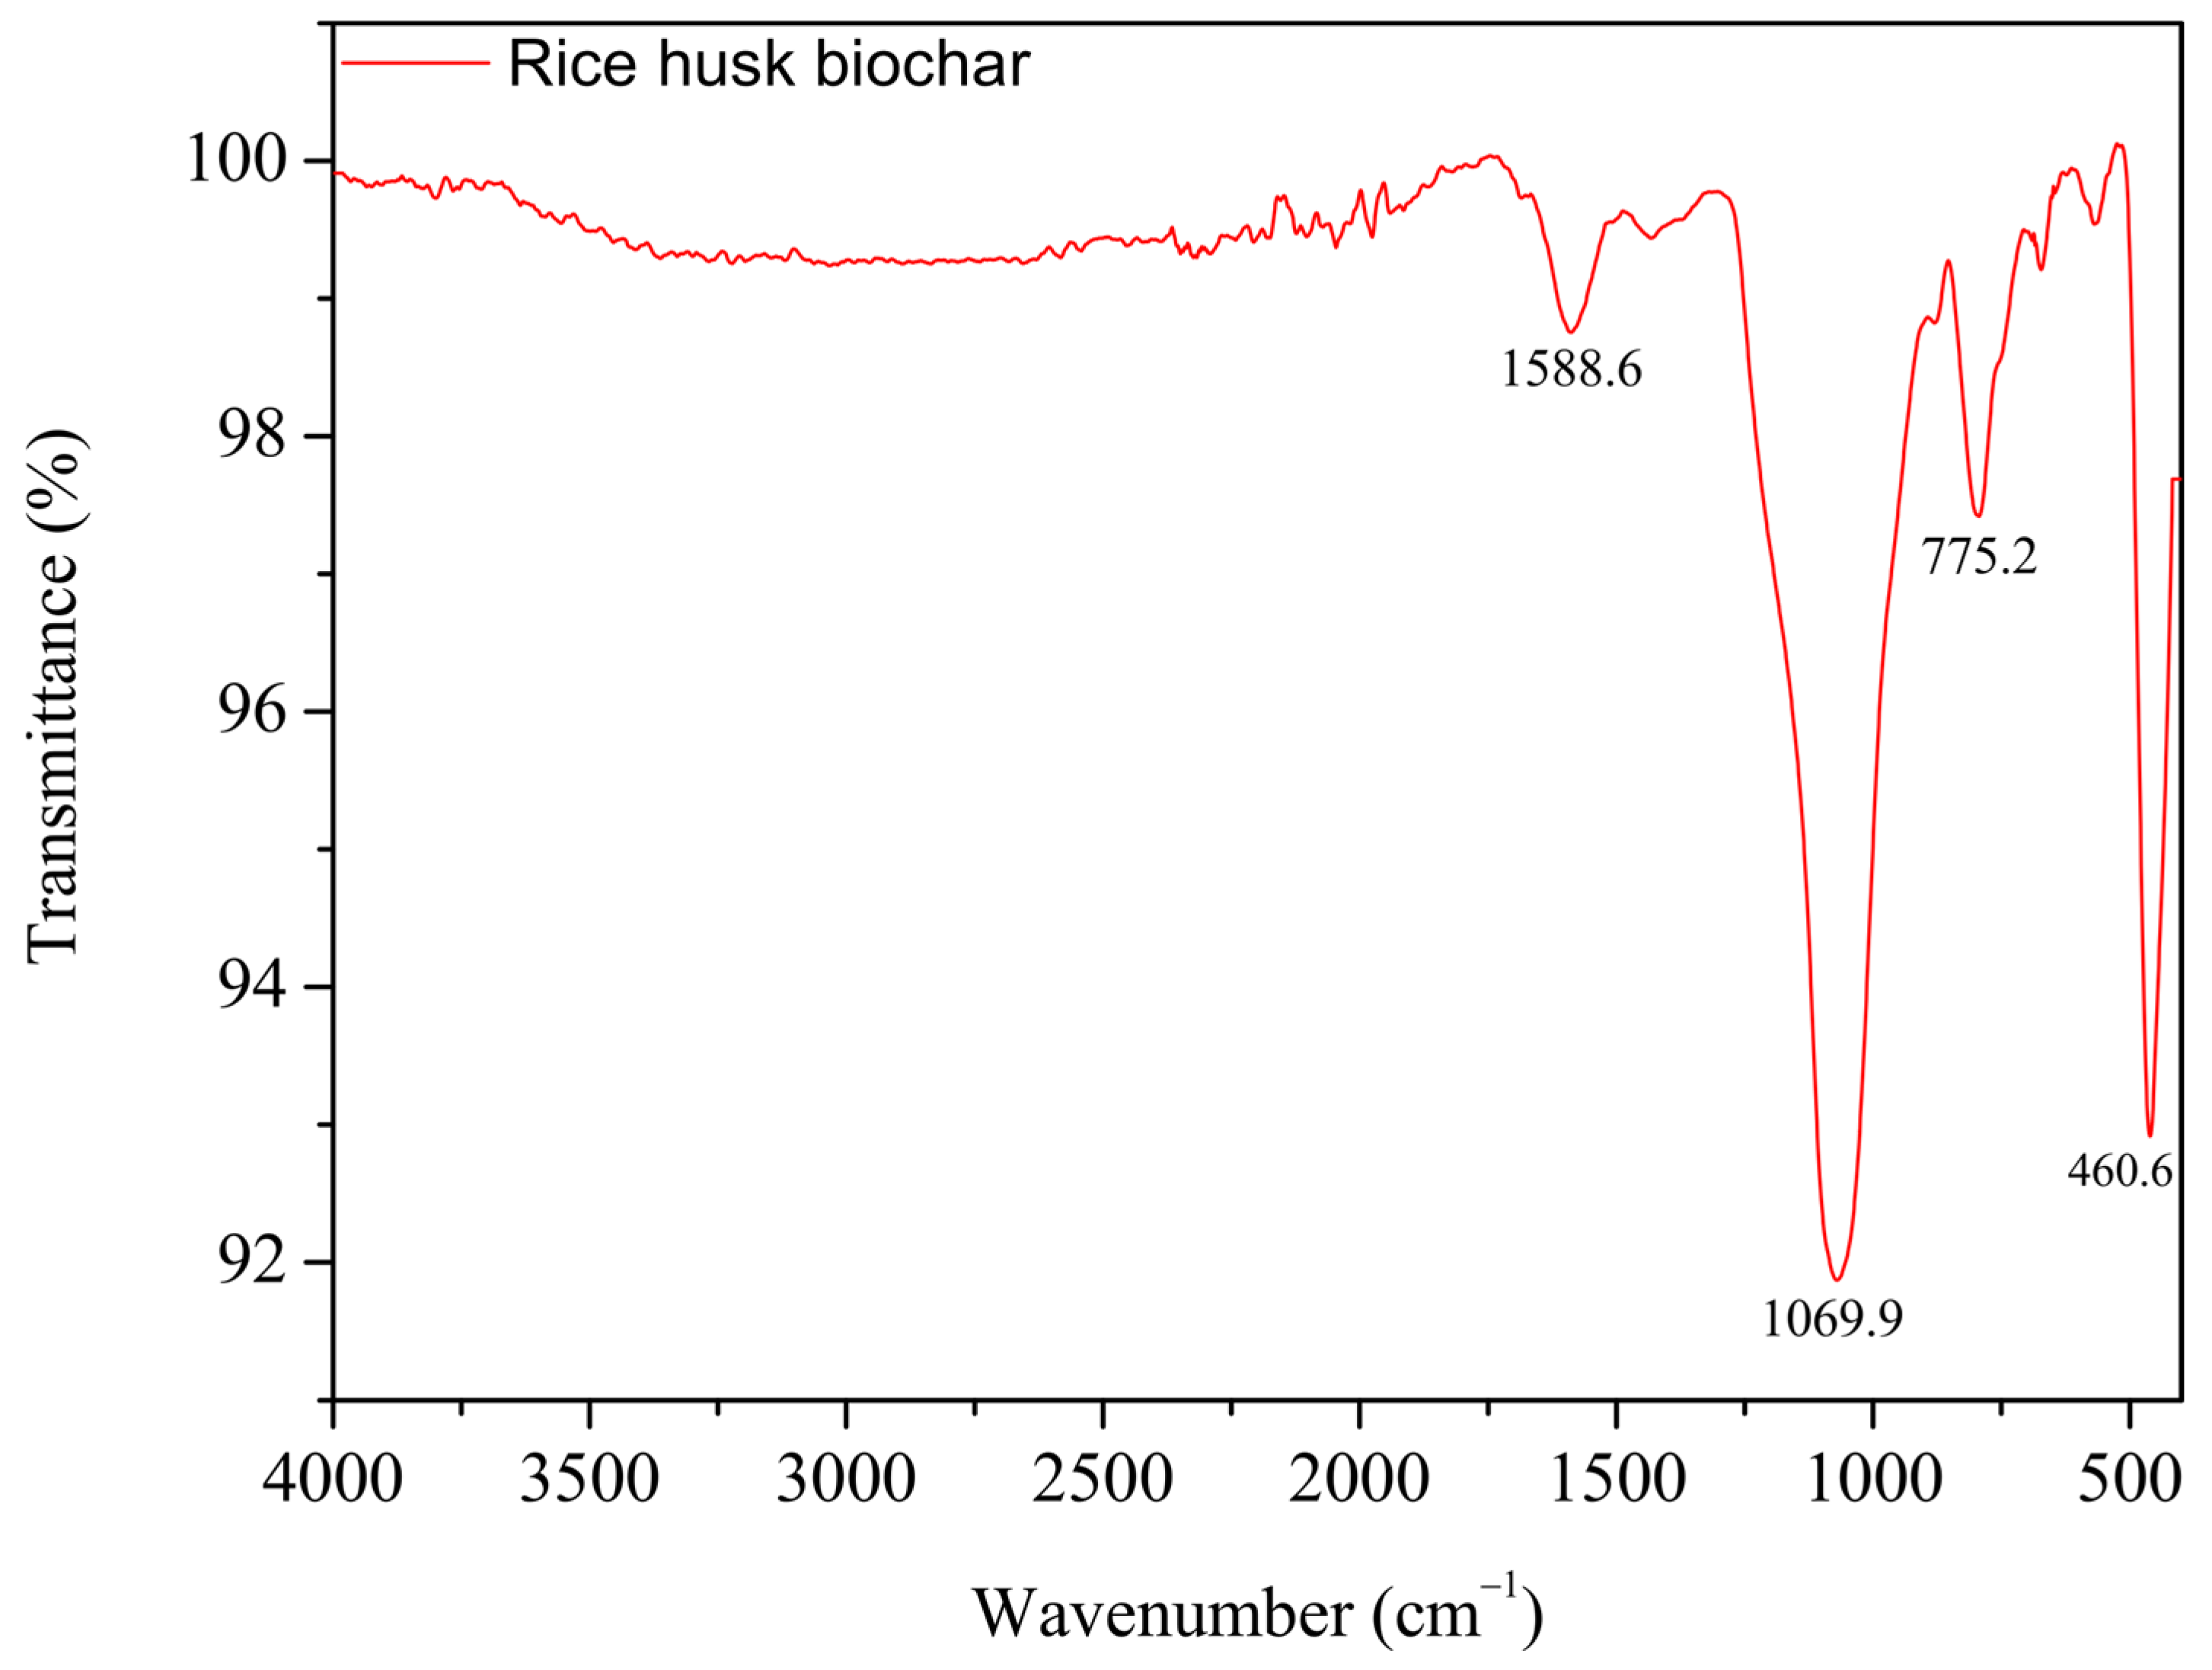
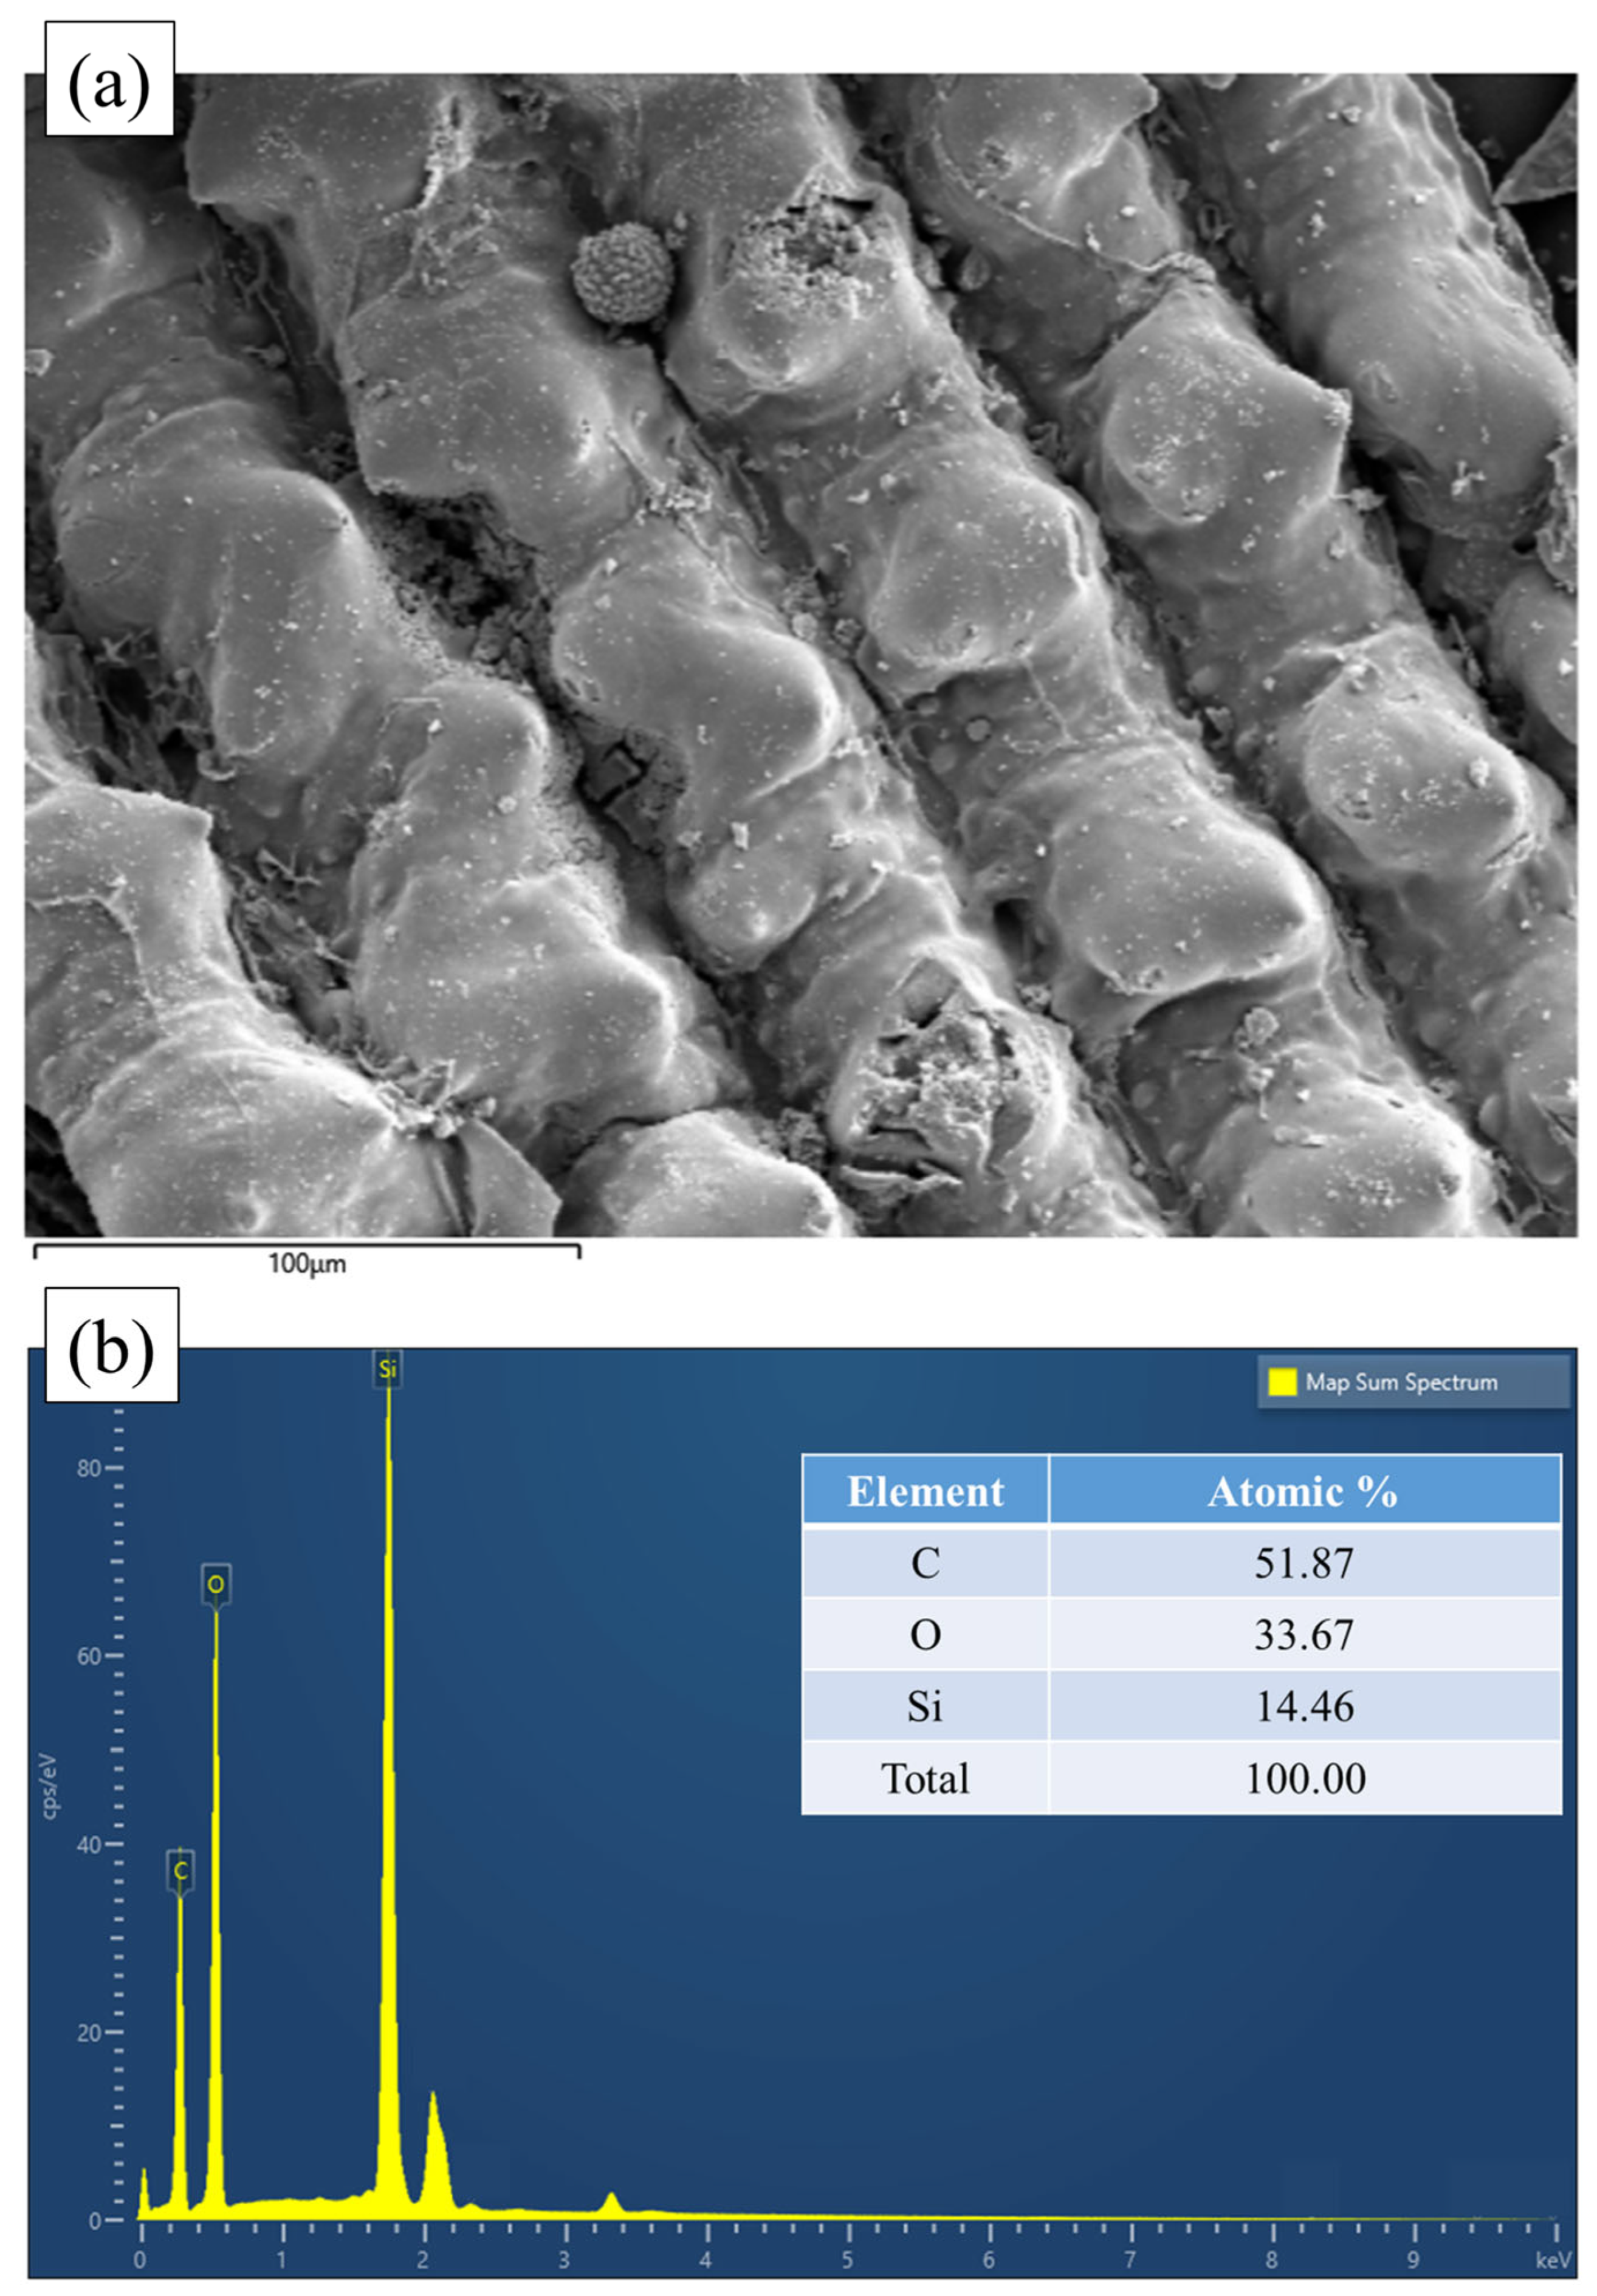
3.6. Role of Pore Structure and Surface Chemistry in the Adsorption Performance of Rice Husk Biochar

The proper configuration of micropores and mesopores plays a critical role in adsorption processes. Micropores primarily function as the main sites for adsorption due to their strong interaction with adsorbates [53,54,55]. Although mesopores may exhibit relatively lower interaction capacity compared to micropores, they serve also as pathways, facilitating the transport of adsorbates to the micropores for effective adsorption [56,57,58].
The adsorption-desorption isotherm of rice husk biochar (Figure 4) exhibits characteristics of both Type I (b) and Type IV isotherms, as described by the International Union of Pure and Applied Chemistry (IUPAC) [59]. The steep initial rise at low relative pressure (P/P0 < 0.01) indicates micropore filling, a hallmark of Type I (b) isotherms, which are associated with micropores, including wider micropores and narrow mesopores (<~2.5 nm). This is supported by the t-plot analysis, which reveals that micropores contribute 26.0 m2 g−1 to the total specific surface area of rice husk biochar, accounting for approximately 82% of the specific surface area measured at 31.9 m2 g−1 (Table 2). The adsorption behavior at higher relative pressures (P/P0 > 0.1) aligns with Type IV isotherms, indicating the presence of mesopores in the rice husk biochar. According to the IUPAC classification, Type IV isotherms are observed in mesoporous materials, where the adsorption process involves monolayer-multilayer adsorption followed by capillary condensation at higher relative pressures.
The desorption branch exhibits a hysteresis loop resembling Type H4, which is often associated with materials containing micropores and narrow mesopores. These interpretations are consistent with previously reported classification and pore behavior in mesoporous and microporous adsorbents [59,60,61,62]. The loop does not close completely, which may be attributed to diffusion limitations in micropores that hinder the release of adsorbed nitrogen molecules—possibly due to irreversible uptake—as well as to potential pore deformation during adsorption [55,63,64].
Figure 5 illustrates the pore size distribution of rice husk biochar. The prominent peak within the 1–2 nm range confirms a significant presence of micropores. Additionally, a smaller peak around 10 nm suggests the presence of mesopores.
These results suggest that both micropores and mesopores of the rice husk biochar play significant roles in adsorbing odorous compounds. With a molecular size of approximately 0.3 nm, NH3 is well-suited for adsorption within the micropores. Meanwhile, the mesopores serve as transport pathways, reducing diffusional limitations and facilitating the movement of ammoniacal nitrogen molecules into the micropores, thereby ensuring effective utilization of adsorption sites. In addition, the reduction in DMS emissions observed in the bedded pack treated with rice husk biochar may also be attributed to its pore structure. The micropores likely acted as adsorption sites for DMS or its precursors, while the mesopores improved air permeability within the bedded pack [65]. This enhanced oxygen diffusion could have mitigated anaerobic conditions, thereby suppressing the activity of microorganisms responsible for DMS production.
The FTIR spectrum of rice husk biochar exhibited peaks at 1588.1 ± 0.2 cm−1, 1047.8 ± 19.0 cm−1, 791.2 ± 3.9 cm−1, and 459.9 ± 2.4 cm−1 (Figure 6). The peak at 1588.1 cm−1 corresponds to C=O stretching vibrations, with potential contributions from C=C or aromatic ring vibrations [66,67,68]. The peak at 1047.8 cm−1 is associated with Si-O-Si stretching vibrations [66,68,69]. The peak at 791.2 cm−1 is attributed to Si-H stretching vibrations but could also be linked to C-H bonds [68,69]. Lastly, the peak at 459.9 cm−1 represents Si-H bending vibrations, consistent with previous studies [68].
The observed reduction in NH3 emissions is attributed to the oxygen-containing functional groups in the rice husk biochar, particularly carbonyl groups (peak at 1588.1 cm−1), which interact with NH4+ through electrostatic interactions. The dipole moment of the carbonyl group enables its oxygen atom to engage with the positively charged NH4+ ion [70,71,72]. In addition to these chemical interactions, physical adsorption within the biochar’s porous structure further enhances NH3 retention.
On the other hand, the presence of silica (SiO2) on the biochar surface can negatively impact its adsorption capacity. While SiO2 helps maintain the hierarchical porous structure of rice husk during pyrolysis by providing structural support, it can also hinder pore formation on the biochar surface [73,74,75,76]. Rice husk ash typically contains around 90% SiO2 [77,78,79]. Tsai et al. [80] reported that rice husk biochar pyrolyzed at 900 °C for 30 min contains about 40% wt% silicon (Si) due to the high SiO2 content in rice husk. The FTIR spectrum confirms the presence of siloxane (Si-O-Si) groups [66,68,69], which form the structural framework of SiO2 [81,82,83]. Additional peaks further support the existence of silicon-containing structures on the biochar surface. SEM-EDS analysis also confirms a 14.5% atomic percentage of Si on the biochar surface (Figure 7). Shin et al. [84] conducted an XRD analysis using the same biochar and identified typical silica characteristics, such as cristobalite, at 22° [85].
Bai et al. [86] reported that etching silica using an alkali-silica reaction with NaOH significantly altered the material’s surface properties. After etching with NaOH, the silica content in a rice husk adsorbent was significantly reduced to 2.7%, resulting in a more ordered surface graphitic structure. Similarly, Shen et al. [87] observed that KOH activation of rice husk biochar reduced the presence of Si-O-Si functional groups and increased its porosity. These structural characteristics and potential limitations imposed by silica indicate that optimizing the biochar’s surface chemistry and enhancing its porosity can significantly improve its adsorption capacity for odorous compounds.

4. Conclusions

This study investigated the potential of rice husk biochar to mitigate odor emissions from a simulated dairy barn bedded pack system, focusing on the impact of biochar application rates (5% and 10% by dry weight). Our findings demonstrate that biochar can significantly reduce ammonia (NH3) and dimethyl sulfide (DMS) emissions. This reduction is attributed to enhanced adsorption and improved air permeability, suppressing anaerobic bacterial activity. Biochar application led to NH3 emission reductions of 27% and 43% and DMS emission reductions of 53% and 75% at 5% and 10% addition levels, respectively, with the most significant reductions observed within the first two weeks. This improvement is likely due to biochar’s microporous and mesoporous structures, which facilitate the adsorption of odorous compounds like NH3 and DMS while simultaneously enhancing air permeability to support aerobic microbial activity. Furthermore, biochar amendment improved total nitrogen retention within the bedding material. In addition, biochar in manure can enhance its value as a fertilizer, as its carbon-rich and porous nature helps improve soil structure, moisture retention, and microbial activity. These benefits aid odor control and promote crop growth and long-term soil health, offering both environmental and agronomic advantages. This is supported by the findings of Glaser et al. [88], who demonstrated that combining biochar with compost, digestate, or mineral fertilizers significantly increased maize yield—by up to 42% depending on the treatment—and improved nutrient uptake while reducing the accumulation of heavy metals in plants. Stacey et al. [89] also reported that the addition of biochar (up to 40% v/v) to poultry manure compost reduced nitrogen loss and increased potato tuber yield by 40%, highlighting its effectiveness in both nutrient conservation and crop productivity. Gao et al. [90] found that applying biochar co-compost at an equivalent carbon rate (8 Mg C ha−1) significantly increased soil water holding capacity and plant biomass, reduced cumulative CO2 emissions, and lowered nutrient leaching compared to biochar or compost alone. Although the 10% biochar treatment achieved the highest reduction, the 5% treatment proved nearly as effective, attaining 63% of the NH3 reduction and 70% of the DMS reduction observed with 10% biochar. Considering its lower material cost and reduced manure management burden, the 5% biochar treatment appears to be the more practical and scalable option for odor control in dairy barns. However, a potential limitation of rice husk biochar is its high silica (SiO2) content. While SiO2 contributes to the structural integrity of biochar, it can also hinder pore formation and reduce adsorption efficiency. While biochar effectively mitigated NH3 and DMS emissions, no substantial reductions were observed for other odorous compounds. Odor unit reduction was observed only temporarily on day 7, suggesting limitations in sustained odor control. While the 21-day lab-scale experiment provided valuable insights into short-term odor mitigation, longer-duration, and field-scale studies are essential to fully capture the dynamics of biochar performance under realistic manure accumulation and environmental conditions. NH₃ and DMS emission patterns may shift over time due to factors such as adsorption saturation, microbial adaptation, and changes in bedding composition, which could affect the sustainability of observed reductions. To address this and other remaining challenges, future research should focus on:
  • Developing chemical or physical modification techniques to overcome limitations posed by high silica (SiO2) content in rice husk biochar, thereby enhancing its surface area and functional adsorption sites.
  • Investigating the influence of silica content on pore structure formation and its correlation with odorant adsorption efficiency.
  • Conducting microbial community analysis to elucidate the mechanisms behind odorant reduction and better understand biochar’s interaction with microbial processes.
  • Evaluating long-term performance under field-scale and dynamic housing conditions.
  • Assessing economic and environmental trade-offs for large-scale implementation.
Overall, the findings highlight rice husk biochar as a promising solution for reducing key odor emissions in dairy housing systems. Consequently, future efforts should address its material limitations and validate performance under real-world operating conditions to maximize its impact.

Author Contributions

Conceptualization, H.A.; methodology, H.A.; software, J.S.; validation, J.S. and H.A.; formal analysis, J.S., D.K., Y.L., S.L. and R.W.; investigation, J.S., D.K., Y.L., S.L. and R.W.; resources, H.A.; data curation, J.S., D.K. and H.A.; writing—original draft, J.S.; writing—review and editing, H.A.; visualization, J.S.; supervision, H.A.; project administration, H.A.; funding acquisition, H.A. All authors have read and agreed to the published version of the manuscript.

Funding

This work was supported by Korea Institute of Planning and Evaluation for Technology in Food, Agriculture and Forestry (IPET) through Livestock Industrialization Technology Development Program, funded by Ministry of Agriculture, Food and Rural Affairs (MAFRA) (RS-2021-IP321088).

Institutional Review Board Statement

Not applicable.

Informed Consent Statement

Not applicable.

Data Availability Statement

The original contributions presented in this study are included in the article. Further inquiries can be directed to the corresponding author.

Conflicts of Interest

The authors declare no conflicts of interest. The funders had no role in the design of the study; in the collection, analyses, or interpretation of data; in the writing of the manuscript; or in the decision to publish the results.

References

  1. Gay, S.W. Natural Ventilation for Free Stall Dairy Barns; Virginia State University: Petersburg, VA, USA, 2009. [Google Scholar]
  2. Samer, M. Abatement Techniques for Reducing Emissions from Livestock Buildings; Springer: Berlin/Heidelberg, Germany, 2016. [Google Scholar]
  3. Yin, Y.; Yang, C.; Li, M.; Zheng, Y.; Ge, C.; Gu, J.; Li, H.; Duan, M.; Wang, X.; Chen, R. Research progress and prospects for using biochar to mitigate greenhouse gas emissions during composting: A review. Sci. Total Environ. 2021, 798, 149294. [Google Scholar] [CrossRef]
  4. Agyarko-Mintah, E.; Cowie, A.; Van Zwieten, L.; Singh, B.P.; Smillie, R.; Harden, S.; Fornasier, F. Biochar lowers ammonia emission and improves nitrogen retention in poultry litter composting. Waste Manag. 2017, 61, 129–137. [Google Scholar] [CrossRef] [PubMed]
  5. Zhou, S.; Wen, X.; Cao, Z.; Cheng, R.; Qian, Y.; Mi, J.; Wang, Y.; Liao, X.; Ma, B.; Zou, Y. Modified cornstalk biochar can reduce ammonia emissions from compost by increasing the number of ammonia-oxidizing bacteria and decreasing urease activity. Bioresour. Technol. 2021, 319, 124120. [Google Scholar] [CrossRef]
  6. Chen, B.; Koziel, J.A.; Białowiec, A.; Lee, M.; Ma, H.; Li, P.; Meiirkhanuly, Z.; Brown, R.C. The impact of surficial biochar treatment on acute H2S emissions during swine manure agitation before pump-out: Proof-of-the-concept. Catalysts 2020, 10, 940. [Google Scholar] [CrossRef]
  7. Ro, K.S.; Woodbury, B.; Spiehs, M.; Szogi, A.A.; Silva, P.J.; Hwang, O.; Cho, S. Pilot-scale H2S and swine odor removal system using commercially available biochar. Agronomy 2021, 11, 1611. [Google Scholar] [CrossRef]
  8. Leso, L.; Barbari, M.; Lopes, M.; Damasceno, F.; Galama, P.; Taraba, J.; Kuipers, A. Invited review: Compost-bedded pack barns for dairy cows. J. Dairy Sci. 2020, 103, 1072–1099. [Google Scholar] [CrossRef] [PubMed]
  9. Karhu, K.; Mattila, T.; Bergström, I.; Regina, K. Biochar addition to agricultural soil increased CH4 uptake and water holding capacity–Results from a short-term pilot field study. Agric. Ecosyst. Environ. 2011, 140, 309–313. [Google Scholar] [CrossRef]
  10. Zhang, J.; Qun, C.; Changfu, Y. Biochar effect on water evaporation and hydraulic conductivity in sandy soil. Pedosphere 2016, 26, 265–272. [Google Scholar] [CrossRef]
  11. Gondim, R.S.; Muniz, C.R.; Lima, C.E.P.; SANTOS, C.L.A.D. Explaining the water-holding capacity of biochar by scanning electron microscope images. Rev. Caatinga 2018, 31, 972–979. [Google Scholar] [CrossRef]
  12. Kaikiti, K.; Stylianou, M.; Agapiou, A. Use of biochar for the sorption of volatile organic compounds (VOCs) emitted from cattle manure. Environ. Sci. Pollut. Res. 2021, 28, 59141–59149. [Google Scholar] [CrossRef]
  13. Ministry of Agriculture, Food and Rural Affairs. Enforcement Decree of Livestock Industry Act; Ministry of Agriculture, Food and Rural Affairs: Sejong-si, Republic of Korea, 2023.
  14. National Institute of Animal Science, Rural Development Administration. Re-Establishment of Livestock Manure Generation Per Head and Amount of Manure on the Barn of Some Types of the Livestock House; National Institute of Animal Science, Rural Development Administration: Wanju-gun, Republic of Korea, 2020.
  15. Ministry of Environment. Livestock Manure Treatment Facility Standard Plan; Ministry of Environment: Sejong-si, Republic of Korea, 2009.
  16. Ministry of Agriculture, Food and Rural Affairs. 2023 Livestock Environment Survey; Ministry of Agriculture, Food and Rural Affairs: Sejong-si, Republic of Korea, 2024.
  17. Korea Meteorological Administration. Climatological Normals of the Republic of Korea (2011–2020); Korea Meteorological Administration: Seoul, Republic of Korea, 2025.
  18. Ahn, H.; Sauer, T.; Richard, T.; Glanville, T.D. Determination of thermal properties of composting bulking materials. Bioresour. Technol. 2009, 100, 3974–3981. [Google Scholar] [CrossRef]
  19. Fidel, R.B.; Laird, D.A.; Thompson, M.L.; Lawrinenko, M. Characterization and quantification of biochar alkalinity. Chemosphere 2017, 167, 367–373. [Google Scholar] [CrossRef]
  20. Brunauer, S.; Emmett, P.H.; Teller, E. Adsorption of gases in multimolecular layers. J. Am. Chem. Soc. 1938, 60, 309–319. [Google Scholar] [CrossRef]
  21. De Boer, J. Studies on pore systems in catalysts: V. The t method. J. Catal. 1965, 4, 319–323. [Google Scholar]
  22. Barrett, E.P.; Joyner, L.G.; Halenda, P.P. The determination of pore volume and area distributions in porous substances. I. Computations from nitrogen isotherms. J. Am. Chem. Soc. 1951, 73, 373–380. [Google Scholar] [CrossRef]
  23. EN 13725:2003; Air Quality-Determination of Odour Concentration by Dynamic Olfactometry. European Committee for Standardization (CEN): Brussels, Belgium, 2003.
  24. Wang, Z.; Xu, Y.; Yang, T.; Liu, Y.; Zheng, T.; Zheng, C. Effects of biochar carried microbial agent on compost quality, greenhouse gas emission and bacterial community during sheep manure composting. Biochar 2023, 5, 3. [Google Scholar] [CrossRef]
  25. Graves, R.E.; Hattemer, G.M.; Stettler, D.; Krider, J.; Chapman, D. Environmental Engineering National Engineering Handbook; United States Department of Agriculture (USDA): Washington, DC, USA, 2000; Part 637.
  26. Mitchell, P.J.; Simpson, A.J.; Soong, R.; Simpson, M.J. Shifts in microbial community and water-extractable organic matter composition with biochar amendment in a temperate forest soil. Soil Biol. Biochem. 2015, 81, 244–254. [Google Scholar] [CrossRef]
  27. Kerner, P.; Struhs, E.; Mirkouei, A.; Aho, K.; Lohse, K.A.; Dungan, R.S.; You, Y. Microbial responses to biochar soil amendment and influential factors: A three-level meta-analysis. Environ. Sci. Technol. 2023, 57, 19838–19848. [Google Scholar] [CrossRef]
  28. Brewer, L.; Andrews, N.; Sullivan, D.M.; Gehr, W. Agricultural Composting and Water Quality; Oregon State University: Corvallis, OR, USA, 2021. [Google Scholar]
  29. Kuo, S.; Ortiz-Escobar, M.; Hue, N.; Hummel, R.; Pandalai, S. Composting and compost utilization for agronomic and container crops. Recent Res. Dev. Environ. Biol. 2004, 1, 451–513. [Google Scholar]
  30. Steiner, C.; Melear, N.; Harris, K.; Das, K. Biochar as Bulking Agent for Poultry Litter Composting. Carbon Manag. 2011, 2, 227–230. [Google Scholar] [CrossRef]
  31. Nguyen, M.K.; Lin, C.; Hoang, H.G.; Sanderson, P.; Dang, B.T.; Bui, X.T.; Nguyen, N.S.H.; Vo, D.-V.N.; Tran, H.T. Evaluate the role of biochar during the organic waste composting process: A critical review. Chemosphere 2022, 299, 134488. [Google Scholar] [CrossRef] [PubMed]
  32. Godlewska, P.; Schmidt, H.P.; Ok, Y.S.; Oleszczuk, P. Biochar for composting improvement and contaminants reduction. A review. Bioresour. Technol. 2017, 246, 193–202. [Google Scholar] [CrossRef]
  33. Awasthi, M.K.; Duan, Y.; Awasthi, S.K.; Liu, T.; Zhang, Z. Influence of bamboo biochar on mitigating greenhouse gas emissions and nitrogen loss during poultry manure composting. Bioresour. Technol. 2020, 303, 122952. [Google Scholar] [CrossRef]
  34. Bello, A.; Deng, L.; Sheng, S.; Jiang, X.; Yang, W.; Meng, Q.; Wu, X.; Han, Y.; Zhu, H.; Xu, X. Biochar reduces nutrient loss and improves microbial biomass of composted cattle manure and maize straw. Biotechnol. Appl. Biochem. 2020, 67, 799–811. [Google Scholar] [CrossRef]
  35. Pereira, J.L.; Martins, F.; Bonifácio, G.; Garcia, C.; Teixeira, J.; Trindade, H. Biochar as an alternative litter additive to mitigate gaseous emissions from broiler housing and subsequent storage. Agronomy 2024, 14, 1595. [Google Scholar] [CrossRef]
  36. Baral, K.R.; McIlroy, J.; Lyons, G.; Johnston, C. The effect of biochar and acid activated biochar on ammonia emissions during manure storage. Environ. Pollut. 2023, 317, 120815. [Google Scholar] [CrossRef]
  37. Dougherty, B.; Gray, M.; Johnson, M.G.; Kleber, M. Can biochar covers reduce emissions from manure lagoons while capturing nutrients? J. Environ. Qual. 2017, 46, 659–666. [Google Scholar] [CrossRef]
  38. Chen, B.; Koziel, J.A.; Banik, C.; Ma, H.; Lee, M.; O’Brien, S.C.; Li, P.; Andersen, D.S.; Białowiec, A.; Brown, R.C. Mitigation of gaseous emissions from stored swine manure with biochar: Effect of dose and reapplication on a pilot-scale. Atmosphere 2021, 12, 96. [Google Scholar] [CrossRef]
  39. Maurer, D.L.; Koziel, J.A.; Kalus, K.; Andersen, D.S.; Opalinski, S. Pilot-scale testing of non-activated biochar for swine manure treatment and mitigation of ammonia, hydrogen sulfide, odorous volatile organic compounds (VOCs), and greenhouse gas emissions. Sustainability 2017, 9, 929. [Google Scholar] [CrossRef]
  40. Pires, A.J.; Esteves, C.; Bexiga, R.; Oliveira, M.; Fangueiro, D. Biochar Supplementation of Recycled Manure Solids: Impact on Their Characteristics and Greenhouse Gas Emissions During Storage. Agronomy 2025, 15, 973. [Google Scholar] [CrossRef]
  41. Dasgupta, S.; Divekar, S.; Spjelkavik, A.I.; Didriksen, T.; Nanoti, A.; Blom, R. Adsorption properties and performance of CPO-27-Ni/alginate spheres during multicycle pressure-vacuum-swing adsorption (PVSA) CO2 capture in the presence of moisture. Chem. Eng. Sci. 2015, 137, 525–531. [Google Scholar] [CrossRef]
  42. Manyà, J.J.; García-Morcate, D.; González, B. Adsorption performance of physically activated biochars for postcombustion CO2 capture from dry and humid flue gas. Appl. Sci. 2020, 10, 376. [Google Scholar] [CrossRef]
  43. Nguyen, M.-V.; Lee, B.-K. Removal of dimethyl sulfide from aqueous solution using cost-effective modified chicken manure biochar produced from slow pyrolysis. Sustainability 2015, 7, 15057–15072. [Google Scholar] [CrossRef]
  44. Tamura, T.; Katayama, T.; Haga, K. Emission patterns of malodorous compounds and greenhouse gases from the pile-type composting of cattle manure. Nihon Chikusan Gakkaiho 1999, 70, 235–239. [Google Scholar] [CrossRef]
  45. Aizawa, A.; Miyazaki, A.; Tanaka, N. Emissions of Volatile Organic Compounds from Dairy Cattle Manure in a Cattle Shed in Japan. Asian J. Atmos. Environ. 2022, 16, 2022024. [Google Scholar] [CrossRef]
  46. Rynk, R.; Van de Kamp, M.; Willson, G.B.; Singley, M.E.; Richard, T.L.; Kolega, J.J.; Gouin, F.R.; Laliberty, L.; Kay, D.; Murphy, D. On-Farm Composting Handbook (NRAES 54); Northeast Regional Agricultural Engineering Service (NRAES): Ithaca, NY, USA, 1992. [Google Scholar]
  47. Zhu, P.; Shen, Y.; Pan, X.; Dong, B.; Zhou, J.; Zhang, W.; Li, X. Reducing odor emissions from feces aerobic composting: Additives. RSC Adv. 2021, 11, 15977–15988. [Google Scholar] [CrossRef]
  48. Gao, X.; Yang, F.; Cheng, J.; Xu, Z.; Zang, B.; Li, G.; Xie, X.; Luo, W. Emission of volatile sulphur compounds during swine manure composting: Source identification, odour mitigation and assessment. Waste Manag. 2022, 153, 129–137. [Google Scholar] [CrossRef]
  49. Hwang, O.; Lee, S.-R.; Cho, S.; Ro, K.S.; Spiehs, M.; Woodbury, B.; Silva, P.J.; Han, D.-W.; Choi, H.; Kim, K.-Y. Efficacy of different biochars in removing odorous volatile organic compounds (VOCs) emitted from swine manure. ACS Sustain. Chem. Eng. 2018, 6, 14239–14247. [Google Scholar] [CrossRef]
  50. Meiirkhanuly, Z.; Koziel, J.A.; Chen, B.; Białowiec, A.; Lee, M.; Wi, J.; Banik, C.; Brown, R.C.; Bakshi, S. Mitigation of gaseous emissions from swine manure with the surficial application of biochars. Atmosphere 2020, 11, 1179. [Google Scholar] [CrossRef]
  51. Li, Y.; Wang, B.; Shang, H.; Cao, Y.; Yang, C.; Hu, W.; Feng, Y.; Yu, Y. Influence of adsorption sites of biochar on its adsorption performance for sulfamethoxazole. Chemosphere 2023, 326, 138408. [Google Scholar] [CrossRef]
  52. Martin, S.M.; Kookana, R.S.; Van Zwieten, L.; Krull, E. Marked changes in herbicide sorption–desorption upon ageing of biochars in soil. J. Hazard. Mater. 2012, 231, 70–78. [Google Scholar] [CrossRef]
  53. Wang, Z.; Hao, C.; Wang, X.; Wang, G.; Ni, G.; Cheng, Y. Effects of micro-mesopore structure characteristics on methane adsorption capacity of medium rank coal. Fuel 2023, 351, 128910. [Google Scholar] [CrossRef]
  54. Kasozi, G.N.; Zimmerman, A.R.; Nkedi-Kizza, P.; Gao, B. Catechol and humic acid sorption onto a range of laboratory-produced black carbons (biochars). Environ. Sci. Technol. 2010, 44, 6189–6195. [Google Scholar] [CrossRef]
  55. Qi, L.; Tang, X.; Wang, Z.; Peng, X. Pore characterization of different types of coal from coal and gas outburst disaster sites using low temperature nitrogen adsorption approach. Int. J. Min. Sci. Technol. 2017, 27, 371–377. [Google Scholar] [CrossRef]
  56. Hsieh, C.-T.; Teng, H. Influence of mesopore volume and adsorbate size on adsorption capacities of activated carbons in aqueous solutions. Carbon 2000, 38, 863–869. [Google Scholar] [CrossRef]
  57. Yin, J.; Zhang, W.; Alhebshi, N.A.; Salah, N.; Alshareef, H.N. Synthesis strategies of porous carbon for supercapacitor applications. Small Methods 2020, 4, 1900853. [Google Scholar] [CrossRef]
  58. Mohan, D.; Sharma, R.; Singh, V.K.; Steele, P.; Pittman Jr, C.U. Fluoride removal from water using bio-char, a green waste, low-cost adsorbent: Equilibrium uptake and sorption dynamics modeling. Ind. Eng. Chem. Res. 2012, 51, 900–914. [Google Scholar] [CrossRef]
  59. Thommes, M.; Kaneko, K.; Neimark, A.V.; Olivier, J.P.; Rodriguez-Reinoso, F.; Rouquerol, J.; Sing, K.S. Physisorption of gases, with special reference to the evaluation of surface area and pore size distribution (IUPAC Technical Report). Pure Appl. Chem. 2015, 87, 1051–1069. [Google Scholar] [CrossRef]
  60. Han, M.-L.; Wei, X.-L.; Zhang, J.-C.; Liu, Y.; Tang, X.; Li, P.; Liu, Z.-Y. Influence of structural damage on evaluation of microscopic pore structure in marine continental transitional shale of the Southern North China Basin: A method based on the low-temperature N2 adsorption experiment. Pet. Sci. 2022, 19, 100–115. [Google Scholar] [CrossRef]
  61. Baldovino-Medrano, V.c.G.; Niño-Celis, V.; Isaacs Giraldo, R. Systematic analysis of the nitrogen adsorption–desorption isotherms recorded for a series of materials based on microporous–mesoporous amorphous aluminosilicates using classical methods. J. Chem. Eng. Data 2023, 68, 2512–2528. [Google Scholar] [CrossRef]
  62. Silvestre-Albero, A.M.; Juárez-Galán, J.M.; Silvestre-Albero, J.; Rodríguez-Reinoso, F. Low-pressure hysteresis in adsorption: An artifact? J. Phys. Chem. C 2012, 116, 16652–16655. [Google Scholar] [CrossRef]
  63. Maziarka, P.; Wurzer, C.; Arauzo, P.J.; Dieguez-Alonso, A.; Mašek, O.; Ronsse, F. Do you BET on routine? The reliability of N2 physisorption for the quantitative assessment of biochar’s surface area. Chem. Eng. J. 2021, 418, 129234. [Google Scholar] [CrossRef]
  64. Lowell, S.; Shields, J.E.; Thomas, M.A.; Thommes, M. Characterization of Porous Solids and Powders: Surface Area, Pore Size and Density; Springer Science & Business Media: Berlin, Germany, 2012; Volume 16. [Google Scholar]
  65. Ren, Z.; Wang, D.; Qin, Z.; Liu, Z. Effects of pore size, water content, and oxygen-containing functional groups on oxygen adsorption in bituminous coal. Sci. Rep. 2023, 13, 10373. [Google Scholar] [CrossRef]
  66. Liu, C.; Wang, W.; Wu, R.; Liu, Y.; Lin, X.; Kan, H.; Zheng, Y. Preparation of acid-and alkali-modified biochar for removal of methylene blue pigment. ACS Omega 2020, 5, 30906–30922. [Google Scholar] [CrossRef]
  67. Armynah, B.; Djafar, Z.; Piarah, W.H.; Tahir, D. Analysis of chemical and physical properties of biochar from rice husk biomass. J. Phys. Conf. Ser. 2018, 979, 012038. [Google Scholar] [CrossRef]
  68. Wei, L.; Huang, Y.; Li, Y.; Huang, L.; Mar, N.N.; Huang, Q.; Liu, Z. Biochar characteristics produced from rice husks and their sorption properties for the acetanilide herbicide metolachlor. Environ. Sci. Pollut. Res. 2017, 24, 4552–4561. [Google Scholar] [CrossRef]
  69. Palniandy, L.K.; Yoon, L.W.; Wong, W.Y.; Yong, S.-T.; Pang, M.M. Application of biochar derived from different types of biomass and treatment methods as a fuel source for direct carbon fuel cells. Energies 2019, 12, 2477. [Google Scholar] [CrossRef]
  70. Chen, M.; Wang, F.; Zhang, D.-l.; Yi, W.-m.; Liu, Y. Effects of acid modification on the structure and adsorption NH4+-N properties of biochar. Renew. Energy 2021, 169, 1343–1350. [Google Scholar] [CrossRef]
  71. Yang, Y.; Piao, Y.; Wang, R.; Su, Y.; Liu, N.; Lei, Y. Nonmetal function groups of biochar for pollutants removal: A review. J. Hazard. Mater. Adv. 2022, 8, 100171. [Google Scholar] [CrossRef]
  72. Yin, Q.; Si, L.; Wang, R.; Zhao, Z.; Li, H.; Wen, Z. DFT study on the effect of functional groups of carbonaceous surface on ammonium adsorption from water. Chemosphere 2022, 287, 132294. [Google Scholar] [CrossRef]
  73. Liu, D.; Zhang, W.; Lin, H.; Li, Y.; Lu, H.; Wang, Y. Hierarchical porous carbon based on the self-templating structure of rice husk for high-performance supercapacitors. RSC Adv. 2015, 5, 19294–19300. [Google Scholar] [CrossRef]
  74. Shen, Y.; Zhang, N. Facile synthesis of porous carbons from silica-rich rice husk char for volatile organic compounds (VOCs) sorption. Bioresour. Technol. 2019, 282, 294–300. [Google Scholar] [CrossRef]
  75. Ahiduzzaman, M.; Sadrul Islam, A. Preparation of porous bio-char and activated carbon from rice husk by leaching ash and chemical activation. SpringerPlus 2016, 5, 1248. [Google Scholar] [CrossRef]
  76. Shackley, S.; Carter, S.; Knowles, T.; Middelink, E.; Haefele, S.; Sohi, S.; Cross, A.; Haszeldine, S. Sustainable gasification–biochar systems? A case-study of rice-husk gasification in Cambodia, Part I: Context, chemical properties, environmental and health and safety issues. Energy Policy 2012, 42, 49–58. [Google Scholar] [CrossRef]
  77. Chandrasekhar, S.; Pramada, P.; Majeed, J. Effect of calcination temperature and heating rate on the optical properties and reactivity of rice husk ash. J. Mater. Sci. 2006, 41, 7926–7933. [Google Scholar] [CrossRef]
  78. Nzereogu, P.; Omah, A.; Ezema, F.; Iwuoha, E.; Nwanya, A. Silica extraction from rice husk: Comprehensive review and applications. Hybrid Adv. 2023, 4, 100111. [Google Scholar] [CrossRef]
  79. Jenkins, B.; Baxter, L.L.; Miles Jr, T.R.; Miles, T.R. Combustion properties of biomass. Fuel Process. Technol. 1998, 54, 17–46. [Google Scholar] [CrossRef]
  80. Tsai, W.-T.; Lin, Y.-Q.; Huang, H.-J. Valorization of rice husk for the production of porous biochar materials. Fermentation 2021, 7, 70. [Google Scholar] [CrossRef]
  81. Gibbs, G.V.; Wallace, A.F.; Cox, D.F.; Downs, R.; Ross, N.L.; Rosso, K.M. Bonded interactions in silica polymorphs, silicates, and siloxane molecules. Am. Mineral. 2009, 94, 1085–1102. [Google Scholar] [CrossRef]
  82. Zulumyan, N.; Isaakyan, A.; Pirumyan, P.; Beglaryan, A. The structural characteristics of amorphous silicas. Russ. J. Phys. Chem. A 2010, 84, 700–702. [Google Scholar] [CrossRef]
  83. Görlich, E. The structure of SiO2—Current views. Ceram. Int. 1982, 8, 3–16. [Google Scholar] [CrossRef]
  84. Shin, J.; Lee, Y.; Kim, D.; Lee, S.; Ahn, H. Effect of rice husk biochar added bedding on the reduction of ammonia and hydrogen sulfide emissions from dairy manure. J. Odor Indoor Environ. 2022, 21, 270–277. [Google Scholar] [CrossRef]
  85. Song, X.; Zhang, Y.; Chang, C. Novel method for preparing activated carbons with high specific surface area from rice husk. Ind. Eng. Chem. Res. 2012, 51, 15075–15081. [Google Scholar] [CrossRef]
  86. Bai, W.; Qian, M.; Li, Q.; Atkinson, S.; Tang, B.; Zhu, Y.; Wang, J. Rice husk-based adsorbents for removing ammonia: Kinetics, thermodynamics and adsorption mechanism. J. Environ. Chem. Eng. 2021, 9, 105793. [Google Scholar] [CrossRef]
  87. Shen, Y.; Zhang, N.; Fu, Y. Synthesis of high-performance hierarchically porous carbons from rice husk for sorption of phenol in the gas phase. J. Environ. Manag. 2019, 241, 53–58. [Google Scholar] [CrossRef]
  88. Glaser, B.; Wiedner, K.; Seelig, S.; Schmidt, H.-P.; Gerber, H. Biochar organic fertilizers from natural resources as substitute for mineral fertilizers. Agron. Sustain. Dev. 2015, 35, 667–678. [Google Scholar] [CrossRef]
  89. Stacey, N.E.; Tea, T.; Seefeldt, S.S.; Bary, A.; Collins, D.P. Biochar-Poultry Manure Compost Alters Temperature and Nitrogen Dynamics during Composting and Improves Potato Growth Following Field Application. Compos. Sci. Util. 2024, 31, 86–102. [Google Scholar] [CrossRef]
  90. Gao, S.; Harrison, B.P.; Thao, T.; Gonzales, M.L.; An, D.; Ghezzehei, T.A.; Diaz, G.; Ryals, R.A. Biochar co-compost improves nitrogen retention and reduces carbon emissions in a winter wheat cropping system. GCB Bioenergy 2023, 15, 462–477. [Google Scholar] [CrossRef]
Figure 1. Schematic diagram of lab-scale bedded pack system setup.
Applsci 15 06361 g001
Figure 2. Weekly volatile solids reduction in the simulated bedded pack with biochar addition.
Applsci 15 06361 g002
Figure 3. Comparison of O2 concentrations in different experimental groups.
Applsci 15 06361 g003
Figure 4. Nitrogen adsorption-desorption isotherm of rice husk biochar.
Applsci 15 06361 g004
Figure 5. Pore size distribution of rice husk biochar.
Applsci 15 06361 g005
Figure 6. FTIR spectrum of rice husk biochar.
Applsci 15 06361 g006
Figure 7. SEM (a) and EDS (b) result of rice husk biochar.
Applsci 15 06361 g007
Table 1. Characteristics of dairy manure, sawdust, and their mixture. (Mean ± S.D., n = 3).
PropertyDairy ManureSawdustMixture
Moisture content (% w.b.) 79.1 ± 0.212.9 ± 0.375.0 ± 0.5
Volatile solid (% d.b.) 83.0 ± 0.598.3 ± 0.190.9 ± 0.2
Total nitrogen (%, w.b.)0.5 ± 0.00.2 ± 0.00.5 ± 0.0
Total carbon (%, w.b.)7.0 ± 0.347.8 ± 0.010.0 ± 0.0
C/N ratio14.2 ± 0.8207.5 ± 0.021.1 ± 0.0
Bulk density (g L−1)956.8108.0613.0 ± 5.3
Free air space (%)12.692.845.1 ± 0.5
w.b. = Wet basis; d.b. = Dry basis.
Table 2. Characteristics of rice husk biochar. (Mean ± S.D., n = 3).
PropertyRice Husk Biochar
Moisture content (% w.b.) 2.0 ± 0.1
Volatile solid (% d.b.) 6.3 ± 0.0
Total nitrogen (%, w.b.)0.8 ± 0.2
Total carbon (%, w.b.)55.6 ± 3.2
pH10.4
Specific surface area (m2 g−1)31.9
Micropore surface area (m2 g−1)26.0
Total pore volume (cm3 g−1)0.02
Micropore volume (cm3 g−1)0.01
Adsorption average pore diameter (nm)15.5
w.b. = Wet basis; d.b. = Dry basis.
Table 3. Mass balance of volatile solids in simulated bedded pack chamber. (Mean ± S.D., n = 3).
ControlTreatment
5% Biochar10% Biochar
Initial VS (Day 0, g)617.7 ± 0.0630.3 ± 3.1659.5 ± 1.2
Added VS (g)128.3 ± 0.4144.7 ± 0.3136.2 ± 0.2
Sampling loss (g)151.6 ± 0.3152.2 ± 0.3153.9 ± 0.5
Remaining VS (Day 20, g)408.5 ± 3.6411.1 ± 3.6423.5 ± 1.3
Decomposed VS (g) 185.9 ± 4.0 a211.8 ± 5.5 b218.4 ± 2.9 b
Note: Different letters in the same row mean each group is significantly different (p < 0.05). Decomposed VS = Initial VS + Added VS-Sampling VS-Remaining VS.
Table 4. Comparison of free air space changes. (n = 3).
ControlTreatmentSEMp-Value
5% Biochar10% Biochar5% Biochar10% Biochar
Day 0 (%)45.147.249.50.70.0540.002
Day 21 (%)32.232.633.20.60.7140.233
Reduction rate of free air space (%)28.730.932.91.60.4320.094
Table 5. Weekly variations in average ammonia emissions. (Mean ± S.D.)
PeriodNH3 Emission, mg m−2 Day−1SEMp-Value
ControlTreatment
5% Biochar10% Biochar5% Biochar10% Biochar
1st week (n = 18)279.5193.3152.018.30.0080.001
2nd week (n = 15)111.192.268.08.60.1510.006
3rd week (n = 6)42.540.035.32.70.6490.079
Overall (n = 39)178.3130.8101.712.10.0180.002
Table 6. Weekly variations in average emissions of sulfur compounds.
CompoundPeriodControlTreatmentSEMp-Value
5% Biochar10% Biochar5% Biochar10% Biochar
H2S
(μg m−2 day−1)
1st week0.011.43.40.510.4150.913
2nd week0.72.73.30.070.2140.112
3rd week43.035.127.21.120.9030.678
Overall8.013.37.75.080.5750.998
MM
(μg m−2 day−1)
1st week287.2805.8660.7191.760.0790.206
2nd weekND NDND---
3rd weekNDNDND---
Overall156.6439.6360.4104.590.0790.206
DMS
(mg m−2 day−1)
1st week12.25.63.00.780.004<0.001
2nd week1.40.90.40.110.007<0.001
3rd week0.20.10.10.020.8760.606
Overall7.13.31.80.42<0.001<0.001
DMDS
(μg m−2 day−1)
1st week117.7115.963.855.500.9990.619
2nd weekNDNDND---
3rd weekNDNDND---
Overall64.263.234.830.270.9990.619
ND = Not detected. Abbreviations: MM, methyl mercaptan; DMS, dimethyl sulfide; DMDS, dimethyl disulfide. Note: The number of measurements taken was 18 in the 1st week, 9 in the 2nd week, 6 in the 3rd week, and 33 overall.
Table 7. Weekly variations in average emissions of total volatile fatty acid, phenol, p-cresol, and indole emissions.
CompoundPeriodEmission, μg m−2 Day−1SEMp-Value
ControlTreatment
5% Biochar10% Biochar5% Biochar10% Biochar
TVFA1st week104.7112.4108.06.680.5250.879
2nd week166.681.589.256.560.3530.413
3rd week62.965.563.45.250.8780.996
Overall114.095.494.715.600.5000.478
Phenol1st week2628.62753.22993.2117.720.5710.048
2nd week1397.41381.01408.451.640.9470.975
3rd week1290.61400.61513.139.850.0730.003
Overall2049.62133.02291.976.260.5510.044
p-Cresol1st week2.01.92.20.110.7030.239
2nd week2.03.62.40.400.0210.601
3rd week2.41.92.20.120.0180.328
Overall2.12.32.20.090.0400.162
Indole1st week1.61.61.30.280.9910.620
2nd weekND NDND---
3rd weekNDNDND---
Overall0.90.90.70.150.9910.620
ND = Not detected. Note: The number of measurements taken was 18 in the 1st week, 9 in the 2nd week, 6 in the 3rd week, and 33 overall.
Table 8. Weekly variation in logarithmically transformed odor units with additional manure applications. (Mean ± S.D., n = 9).
Elapsed Time (Days)Logarithmically Transformed Odor Unit
Control5% Biochar10% Biochar
02.3 ± 0.1 a12.5 ± 0.3 a12.1 ± 0.3 a1
72.0 ± 0.2 a22.0 ± 0.1 a21.8 ± 0.0 b2
141.5 ± 0.1 a31.5 ± 0.2 a31.4 ± 0.2 a3
211.5 ± 0.2 a31.3 ± 0.2 a31.4 ± 0.1 a3
Note: Different letters in a row indicate significant differences between treatments at the same time (p < 0.05), while different numbers in a column indicate significant differences between measurement days within treatments (p < 0.05).
Disclaimer/Publisher’s Note: The statements, opinions and data contained in all publications are solely those of the individual author(s) and contributor(s) and not of MDPI and/or the editor(s). MDPI and/or the editor(s) disclaim responsibility for any injury to people or property resulting from any ideas, methods, instructions or products referred to in the content.

