Abstract
TRISO fuels are proposed for portable and modular power reactor technologies. Expansion is dependent upon improvements to safety through a thorough understanding of fission product behavior as related to functional containment design philosophies. Significant knowledge gaps exist in the thermodynamic behavior of neodymium and cerium fission products solubility in graphite, which play a role in the qualification of TRISO fuels. DSC measurements were conducted on Nd-C and Ce-C carbide fission products to expand upon calculated phase equilibria. Various crucible tests, calibrant experimentation, sample generation and sample preparation techniques, and new thermodynamic measurements have been performed. New phase equilibria were produced to improve Nd-C and Ce-C phase diagrams and further inform models of fission product behavior within TRISO fuels. The following phase transition temperatures are reported for Nd-C, with an error of ±32.7 °C: 10 mol%C— °C, °C, and °C; 16 mol%C— °C and °C; 20 mol%C— °C; 25 mol%C— °C and °C; 30 mol%C— °C and °C; 35 mol%C— °C and °C; 40 mol%C— °C. The following phase transition temperatures are reported for Ce-C with an error of ±32.7 °C: 20 mol%C— °C; 32 mol%C— °C and 857 °C; 67 mol%C— °C.
1. Introduction
1.1. Background
TRi-structural ISOtropic (TRISO) particle fuel is purported to change the application of traditional defense in depth concepts on the operational safety of nuclear power reactors, primarily through increased reliance on fuel-driven fission product retention. Typical nuclear power reactors credit a super structure, usually of reinforced concrete and air-tight, as a containment boundary against radiological releases. However, many TRISO applications rely upon a functional containment design, where the fuel itself is credited towards this function. Therefore, it is imperative that fuel performance modeling is developed at a higher level of predictability than conventional fuels to ensure the safety of TRISO-fueled reactors.
The basic structure of a TRISO fuel particle is shown in Figure 1, illustrating the size of each layer. The fuel kernel most commonly proposed in the commercial sector is a solid Uranium Oxycarbide (UCO) mixture of uranium carbide and uranium oxide. The kernel provides the fissile material for the fuel and assists in fission product retention, while the porous buffer layer provides some accommodation for fission product gases and kernel swelling, permitting gaseous volumetric expansion and mitigating overpressurization of the fuel particle [1]. The Inner Pyrolytic Carbon (IPyC) layer assists in fission product retention within the particle, seals the fuel kernel from external contaminants during fabrication, and provides a deposition surface for the outer layers [1,2]. The SiC layer, which is deposited on the exterior of the IPyC layer, provides structural integrity to the fuel and is the primary barrier to solid fission product release [1,3]. Finally, the Outer Pyrolytic Carbon (OPyC) layer protects the SiC layer from external hazards, provides an additional barrier to fission product release, and can be used as a bond surface for large fuel compact fabrication [1].
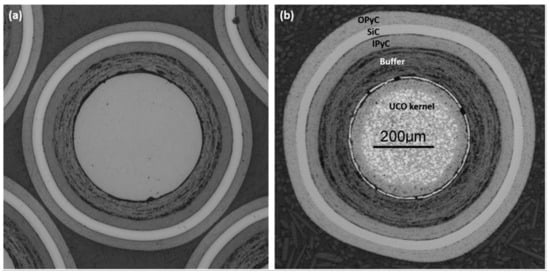
Figure 1.
Cross section of modern TRISO fuel particles. (a) UO2 TRISO particle. (b) UCO TRISO particle [1]. Reprinted from Journal of Nuclear Materials, Volume 515, Paul A. Demkowicz, Bing Liu, and John D. Hunn, Coated particle fuel: Historical perspectives and current progress, pages 434–450, Copyright 2019, with permission from Elsevier.
- Pressure vessel failure due to fission gas overpressurization [1,2,4,5,6];
- Kernel migration [1,2,4];
- Fission product chemical attack of the SiC layer [1,2,5,6,7,8,9];
- Radiation-induced changes to the IPyC and OPyC layers [1,2,4,5,10].
Rare earth carbide compounds are of particular interest as they are a fission product commonly generated in nuclear particle fuels that have been shown to chemically attack the SiC layer [2]. UO2 kernels are less susceptible to this as rare earth fission products will favor forming oxide compounds and remain within the kernel and porous buffer layer [1]. However, they are more susceptible to CO(g) formation, which can lead to overpressurization failure [1,5,6]. UC kernels behave conversely. With CO(g) formation limited, rare earths instead form carbide compounds at the SiC boundary, and subsequently, transport through the SiC layer [1]. TRISO irradiation studies as seen from the Advanced Gas Reactor (AGR) AGR-1 [11,12] and AGR-2 [12,13] programs have shown excellent fission product retention using UCO compared to UC and UO2.
Although silver and palladium fission product behavior are perhaps the most important causes of SiC degradation and fission product release [1,2], they are also the primary transport mechanism of rare earth fission products from the fuel kernel to the SiC grains and grain boundaries [9,14]. Therefore, improving the understanding of rare earth fission product carbide compounds may prove to further the understanding of other fission-product-related failure mechanisms.
1.2. Motivation
While much research has been conducted to understand the impact of TRISO fuel fission products and their resultant compounds on fuel integrity, thermodynamic analyses of some fission product carbide compounds are limited or absent in the open literature. Neodymium and cerium carbides are such compounds that have significant gaps in experimental data to validate predicted behavior. These compounds play a significant role in TRISO fuel performance as insufficient oxygen stoichiometry in the fuel kernel has been proven to lead to neodymium and cerium directly attacking the SiC layer through carbide compound precipitation [1,9,15,16]. Cerium is also an important fission product as low inventories can be indicative of abnormal fuel kernel size or low initial fissile content, thereby implying anomalies in the manufacturing process [17].
Neodymium and cerium are rare earth elements that fall under the lanthanoid group of elements, and follow similar thermodynamic behavior to their parent element and its compounds [18]. The lanthanum carbide system has been extensively investigated experimentally by Spedding et al. [18], providing data to validate most phase transition temperatures predicted by the calculated phase diagram by Peng et al. [19]. The La-C phase diagram proposed by Peng et al. [19] is provided in Figure 2. The La-C system contains a low-temperature eutectic transition at approximately 20 mol%C and °C, and a high temperature eutectic transition at approximately 68–70 mol%C and °C [19]. Two stoichiometric phases are also present, the sesquicarbide phase at 60 mol%C and °C and the dicarbide phase at 67 mol%C and °C [19]. The La-C system contains numerous experimental data to validate the predicted phase diagram by Peng et al. [19], with specific emphasis on the liquidus and eutectic transition from 0 to 67 mol%C.
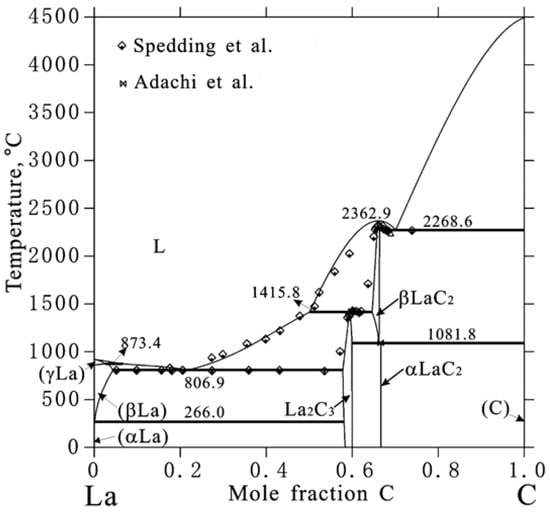
Figure 2.
La-C predicted phase diagram by Peng et al. [19], with experimental data by Spedding et al. [20] and Adachi et al. [21].
1.3. Review of Neodymium–Carbon Predicted and Experimental Data
The neodymium–carbon system has been reported sparingly in the open literature with little experimental data to characterize the full phase diagram. Figure 3 illustrates the predicted phase diagram by Bian et al. [22] with limited experimental data in reference to the following discussion. Thermodynamic properties have been approximated via phase equilibria modeling and prediction based on trends in the La-C, Ce-C, and Pr-C systems [22,23,24]. Spedding et al. [18] reported hexagonal Nd and cubic Nd2C3 phases in the 0 to 50 mol%C range via X-ray diffraction. Bian et al. [22] added new data within this range by melting neodymium ingots in a graphite crucible at 1100 °C, 1200 °C, 1350 °C, and 1500 °C until carbon-saturated alloys were produced at 37, 39.3, 44.8, 49.7, and 49.2 mol%C, respectively [22]. The phases present in these samples were confirmed via back-scattering scanning electron microscopy (BSEM) [22].
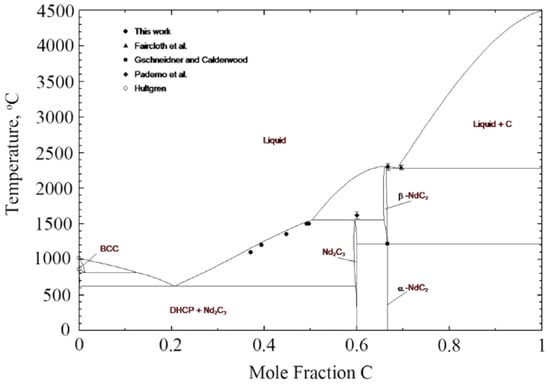
Figure 3.
Nd-C predicted. phase diagram by Bian et al. [22], with experimental data by Faircloth et al. [25], Gschneidner and Calderwood [24], Paderno et al. [26], and Hultgren [27].
All other data available in the literature focus on the 50 to 100 mol%C range of the phase diagram with emphasis on the stoichiometric compounds NdC2 and Nd2C3. Gschneidner and Calderwood [24] performed an analysis of this system and described the Nd2C3 as cubic, analogous to the Pu2C3 crystal structure, existing in the 54 to 60 mol%C range with an approximate melting temperature of 1620 ± 50 °C. The low-temperature NdC2 phase is reported as tetragonal with the CaC2 crystal structure, and experiences a phase transition to NdC2, which has a cubic CaF2 structure [24]. Various temperatures were reported for this phase transition, with the assessed value reported by Gschneidner and Calderwood as 1150 ± 20 °C for the NdC2 to NdC2 phase transition and a postulated melting temperature greater than 2260 °C [24]. They also reported an assessed NdC2-C eutectic phase transition at 2260 ± 30 °C [24].
Meschel and Kleppa synthesized NdC2 by combining Nd and C powders into pressed pellets and heating them to 1200 ± 2 °C, confirming the presence of the tetragonal crystal structure at this temperature and reporting an enthalpy of formation of −29.2 ± 1.4 kJ/mol [23,28]. Faircloth et al. [25] also provided additional phase transition temperatures and enthalpies of formation measurements around the NdC2 compound that aligned well with those reported by Gschneidner and Calderwood. Vidhya et al. [29] mixed NdO and graphite into pellets and heated the samples to produce a desired partial pressure of CO(g) and measured the resulting NdC2 enthalpy of formation as −90.8 ± 6 kJ/mol. This measurement appears as an outlier compared to other enthalpy measurements of the same compound, which is similarly true for the CeC2 measurement also by Vidhya et al. [30]. Peng et al. [19] excluded this enthalpy data from their assessment of the Ce-C system for this reason. Therefore, these data are included for completeness but are excluded for comparison with this work. A summary of phase transition temperatures and enthalpies found in the open literature for the Nd-C system is provided in Table 1 and Table 2.
1.4. Review of Cerium–Carbon Predicted and Experimental Data
Experimental data are also lacking in the cerium–carbon system. Many thermodynamic properties were calculated and approximated based on trends in the La-C and Pr-C systems, similar to neodymium carbide [28,31]. See Figure 4 for the predicted phase diagram by Peng et al. [19] in reference to the following discussion. Aside from pure cerium, no experimental data could be found in the 0 to 50 mol%C range, and the few data points that do exist are solely for the CeC2 and Ce2C3 stoichiometric phases [19]. Gschneidner and Calderwood [32] described the sesquicarbide crystal as cubic in the Pu2C3 structure with a melting temperature of 1505 °C, following the behavioral trends of other rare earths [31]. They also described the CeC2 compound as having an to phase transition at 1150 °C ± 20 °C, a melting temperature of 2420 ± 180°C, and a CeC2-C eutectic phase transition at 2260 ± 20 °C [31]. Winchell and Baldwin [33] heated CeO2 and graphite powder to generate CeC2, and confirmed the phases present via the mass spectrometric-Knudsen cell technique and X-ray diffraction at varying temperatures. They described the low-temperature structure of CeC2 as body-centered tetragonal, which transitions to pyrite cubic at 1100 ± 10°C, and a eutectic temperature of 2270 ± 20 °C, both in good agreement with Gschneidner and Calderwood [32]. The enthalpy of formation was found to be −71.1 kJ/mol [32], which is markedly different compared to Meschel and Kleppa’s −25.4 ± 1.4 kJ/mol [28,34]. A summary of phase transition temperatures and enthalpies found in the open literature for the Ce-C system is provided in Table 3 and Table 4.
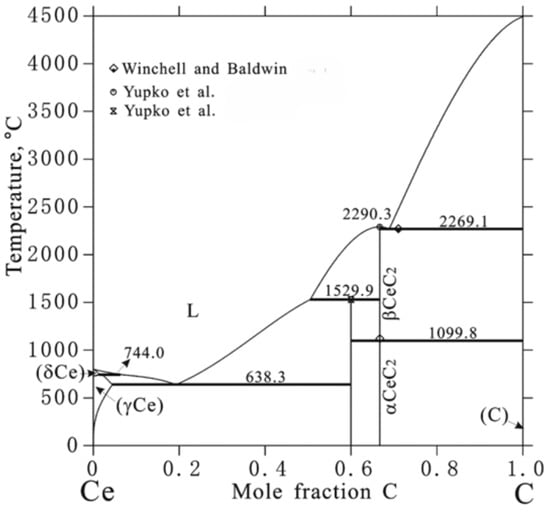
Figure 4.
Ce-C predicted phase diagram by Peng et al. [19], with experimental data by Winchell and Baldwin [33], and Yupko et al. [35].
1.5. Objectives
The thermodynamic assessment by Bian et al. [22] demonstrated the most complete phase diagram reported in the open literature for the Nd-C system, incorporating existing measurements of specific molar concentrations and adding new experimental data. Similarly, Peng et al. [19] performed a comprehensive review of existing literature and applied the Calphad method to generate the most comprehensive phase diagram of the Ce-C system in the open literature. Both thermodynamic systems are similar in structure and behavior, as is expected of light rare earth elements [19,20,23,28,34]. These two thermodynamic analyses, along with the works described earlier, provide the basis of comparison for the present work.
The goal of this work is to report new, experimental phase transition temperatures and enthalpies of fusion for the 0–40 mol%C range of the Nd-C system and Ce-C systems. Other molarities are used to validate measurements against existing experimental values reported in the open literature. Measurements are performed via Differential Scanning Calorimetry (DSC), and DSC crucible materials are proposed. The experimental data collected from this campaign are expected to inform the creation of thermodynamic models to accurately predict fission product behavior. The Thermodynamics of Advanced Fuels-International Database (TAF-ID) was developed using the Calphad method to perform thermodynamic calculations of various standard and accident scenarios on nuclear fuel materials [36]. The results from this work will expand the TAF-ID database and improve modeling of Nd-C and Ce-C rare earth carbide compounds in TRISO fuel.

Table 1.
Neodymium carbide phase transition temperatures in the open literature.
Table 1.
Neodymium carbide phase transition temperatures in the open literature.
| Item | Mol%C | Mol%Nd | Equilibrium | Temperature [°C] | Method | Ref. |
|---|---|---|---|---|---|---|
| 1 | 0 | 1 | Nd ⇌Nd | 862 | Calorimetry; | [22] |
| 2 | 0 | 1 | Nd ⇌ (L) | 1001.67 | Calorimetry; | [22] |
| 3 | 37 | 63 | Nd2C3 + (L) ⇌ (L) | 1100 ± 0.5 | BSEM, Elemental Analysis; | [22,37] |
| 4 | 39 | 61 | Nd2C3 + (L) ⇌ (L) | 1200 ± 0.5 | BSEM, Elemental Analysis; | [22,37] |
| 5 | 45 | 55 | Nd2C3 + (L) ⇌ (L) | 1350 ± 0.5 | BSEM, Elemental Analysis; | [22,37] |
| 6 | 49 | 51 | Nd2C3 + (L) ⇌ (L) | 1500 ± 0.5 | BSEM, Elemental Analysis; | [22,37] |
| 7 | 50 | 50 | Nd2C3 + (L) ⇌ (L) | 1500 ± 0.5 | BSEM, Elemental Analysis; | [22,37] |
| 8 | 60 | 40 | Nd2C3 ⇌ (L) | 1620 ± 40 | Assessed; | [24] |
| 9 | 67 | 33 | NdC2⇌NdC2 | 1150 ± 20 | Assessed; | [24,38] |
| 10 | 67 | 33 | NdC2− C ⇌ (L) | 2260 ± 30 | Assessed; | [24,38] |
| 11 | 67 | 33 | NdC2 (L) | 2260 | Estimated; | [23] |
| 12 | 67 | 33 | NdC2 (L) | 2290 ± 10 | Knudsen Cell Effusion; | [25] |
| 13 | 70 | 30 | NdC2.29 (L) | 2300 ± 15 | Knudsen Cell Effusion; | [25] |
Table 2.
Neodymium carbide enthalpy of formation values in the open literature.
Table 2.
Neodymium carbide enthalpy of formation values in the open literature.
| Item | Mol%C | Mol%Nd | Compound | Hf (25 °C) [kJ/mol] | Method | Ref. |
|---|---|---|---|---|---|---|
| 1 | 60 | 40 | Nd2C3 | −34.1 ± 3 | Electromotive Force; | [22] |
| 2 | 67 | 33 | NdC2 | −29.2 ± 1.4 | Calorimetry; | [23] |
| 3 | 67 | 33 | NdC2 | −90.8 ± 6 | Quadruple Mass Spectrometer; | [29] |
| 4 | 67 | 33 | NdC2 | −17.4 ± 3 | Knudsen Cell Effusion; | [25] |
| 5 | 67 | 33 | NdC2 | −29.33 ± 3 | Electromotive Force; | [22] |
Table 3.
Cerium carbide phase transition temperatures in the open literature.
Table 3.
Cerium carbide phase transition temperatures in the open literature.
| Item | Mol%C | Mol%Ce | Equilibrium | Temperature [°C] | Method | Ref. |
|---|---|---|---|---|---|---|
| 1 | 60 | 40 | Ce2C3 ⇌ CeC2 + (L) | 1529.9 ± 50 | Thermal Analysis; | [19,39] |
| 2 | 60 | 40 | Ce2C3 (L) | 1700 | Assessed; | [32] |
| 3 | 67 | 33 | CeC2⇌ (L) | 2250 ± 20 | Knudsen Cell Effusion; | [25] |
| 4 | 67 | 33 | CeC2⇌ (L) | 2270 ± 20 | Thermal Analysis; | [33] |
| 5 | 67 | 33 | CeC2⇌ (L) | 2290.3 ± 60 | Thermal Analysis; | [19,39] |
| 6 | 67 | 33 | CeC2⇌ (L) | 2245 ± 20 | Assessed; | [32] |
| 7 | 67 | 33 | CeC2⇌CeC2 | 1100 ± 10 | Thermal Analysis; | [33] |
| 8 | 70 | 30 | CeC2.34 (L) | 2270 ± 15 | Knudsen Cell Effusion; | [25,32] |
Table 4.
Cerium carbide enthalpy of formation values in the open literature.
Table 4.
Cerium carbide enthalpy of formation values in the open literature.
| Item | Mol%C | Mol%Ce | Compound | Hf (25 °C) [kJ/mol] | Method | Ref. |
|---|---|---|---|---|---|---|
| 1 | 60 | 40 | Ce2C3 | −88.3 ± 2.9 | Calorimetry; | [40] |
| 2 | 67 | 33 | CeC2 | −104.7 | Knudsen Cell Effusion; | [25] |
| 3 | 67 | 33 | CeC2 | −62.7 ± 21 | Knudsen Cell MS; | [41] |
| 4 | 67 | 33 | CeC2 | −81.6 | Knudsen Cell Effusion; | [33] |
| 5 | 67 | 33 | CeC2 | −97.1 ± 5.4 | Calorimetry; | [40] |
| 6 | 67 | 33 | CeC2 | −76.2 ± 4.2 | Calorimetry; | [34] |
| 7 | 67 | 33 | CeC2 | −120.1 ± 11 | Quadruple Mass Spectrometer; | [30] |
| 8 | 67 | 33 | CeC2 | −88.5 ± 10.5 | Electromotive Force; | [42] |
2. Materials and Methods
2.1. Sample Preparation
Neodymium carbide and cerium carbide samples were fabricated at the University of Texas at San Antonio (UTSA) (San Antonio, TX, USA) with a customized Tri-Arc Melt Furnace, Model 5TA, from Centorr Vacuum Industries. Nd and Ce foil with 99.9% purity (sourced from Alfa Aesar, Haverhill, MA, USA) were refined through a melt–clean–remelt process to remove impurities. These were reacted with graphite under an inert, ultra-high purity argon environment to produce four Nd-C and two Ce-C samples of various molar compositions, which were shipped to Ontario Tech University (OTU) and then stored in an argon environment to prevent potential oxidation. A more thorough description of the fabrication process is described by Cavazos et al. [43]. The planned crucibles for the DSC experiments had a measured inner diameter of 5.95 mm and inner height of 3.20 mm. However, the fabricated samples were too large to fit into the volume, having a diameter of approximately 8 mm and height of 4 mm. The samples were resized at OTU within an argon-filled glovebox to fit within the measurement crucibles.
2.2. Sample Cutting
An MBRAUN Labstar Pro glovebox (sourced from MBRAUN, Garching, Germany) was used to store all carbide samples, and perform sample cutting as it provides an inert atmosphere of ultra-high purity argon gas, i.e., 99.999% Ar. The glovebox is equipped with H2O and O2 sensors that were used to regulate atmospheric conditions, ensuring water vapor and oxygen levels remained at approximately 1–5 ppm. These sensors were monitored during the initial opening of the carbide samples from UTSA to assess if oxygen ingress occurred in the packaging. No noticeable increase in water or oxygen levels was observed.
A small and a large antechamber are equipped on the side of the glovebox to permit ingress and egress of materials, and two lockable gloveports on the front of the glovebox allowed manipulation of tooling and equipment without exposure. The exhaust of both antechambers was fitted to a vacuum pump, with adjustable valving to inject either air or argon gas into the chamber. Use of the antechamber required its volume to be evacuated using the vacuum pump for 30 s, then re-filled with the necessary atmosphere, cycling three times before opening. The gloveports housed two black rubber gloves that were connected via pressed o-rings to maintain a pressure boundary, and the gloves were dressed with disposable extra-large nitrile gloves to prevent cross-contamination during sample work within the glovebox. An overview of the glovebox setup is provided in Figure 5.
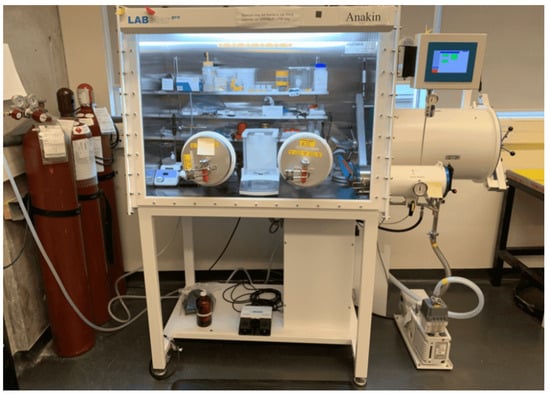
Figure 5.
Photograph of MBRAUN glovebox used in this work.
The small size and high hardness of the carbide samples introduced difficulty with resizing. Additionally, as rare earth carbides readily oxidize, any mechanical work required an inert environment, and therefore, had to be performed within the argon-filled glovebox.
To perform the sample cutting, the following materials were required:
- Extra-large nitrile disposable gloves;
- Anti-static weighing boats;
- Kimtech wipes;
- One pair of tweezers approximately 15 inches long;
- One adjustable wrench;
- Ziploc sandwich bags pre-labeled with the sample identity and unique numbering;
- Ziploc large freezer bags to house the components for sample cutting and store the Ziploc sandwich bags containing the cut samples;
- A large chisel approximately 12 inches long and 0.25 inches wide at its cutting face;
- A rubber mallet approximately 3 inches in diameter at the contact face;
- Three flat stainless steel electrical outlet cover plates to prevent damage to the glovebox were used;
- Peelable sticky pads for holding the sample during cutting and cleaning the glovebox;
- One DSC crucible for fit testing cut samples.
Within the glovebox, the three stainless steel plates were stacked together with the curved side facing upwards, and peelable sticky pads were placed on top with the sticky side facing upwards. Next, Kimtech wipes were placed on the bottom surface inside of an unlabeled Ziploc freezer bag to assist in identifying cut samples. The plates and sticky pads were then inserted into the Ziploc freezer bag on top of the Kimtech wipes. The sample to be cut was removed from its original packaging using tweezers and placed on top of the sticky pad. The Ziploc bag was then sealed with the exception of a 1-inch section, where the chisel was inserted and the cutting edge pressed into the sample. A few light taps with the rubber mallet to the end of the chisel were performed first to create a small groove that prevented slippage. Then, the sample was split into pieces via the rubber mallet. The cut pieces mostly remained on the sticky pad, but some were also found on the Kimtech wipes.
No pieces escaped the large Ziploc freezer bag. Samples of sufficient size were collected using the tweezers and placed into a labeled Ziploc sandwich bag and sealed. While in the Ziploc sandwich bag, the sample was fit tested with a DSC crucible using tweezers. The samples were then stored in the glovebox until removed for testing.
As multiple, smaller samples were produced from the cutting process, samples of intermediate molarity were generated at OTU by combining neighboring concentrations of similar mass. For example, cut samples from Nd-C of 10 mol%C and 20 mol%C were placed into the same measurement crucible, then melted within the STA furnace at 1100 °C and held isothermally for 90 min to promote homogeneous mixing. This process was applied to all samples from OTU and resulted in an expansion of the reported results to better inform phase transition trends.
2.3. Crucible Selection
Initially, alumina crucibles were employed with a thin layer of alumina powder applied to the crucible inner surface to prevent sample–crucible adhesion, which was applied successfully in previous campaigns [44]. Calibrations were completed successfully but chemical interactions occurred between the alumina crucibles, alumina powder, and the 10 mol%C and 90 mol%Nd sample. This was confirmed through review of the erroneous DSC signal response and visual confirmation of an interaction between the sample and crucible, as shown in Figure 6.
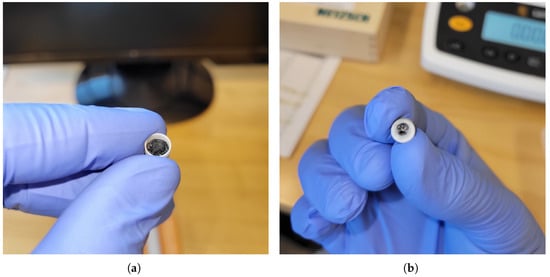
Figure 6.
Optical images of Nd1, 10 mol%C and 90 mol%Nd post-DSC test using alumina crucibles and alumina powder: (a) Nd1 Post-DSC Crucible Interior. (b) Nd1 Post-DSC Crucible Exterior.
The specimen could not be removed from the crucible, and the crucible developed a permanent blue and black discoloration through to the outer surface. Further experiments with alumina were halted and boron nitride (BN) crucibles were instead employed (sourced from Netzsch product no. NGB808836, Bavaria, Germany) along with boron nitride powder placed in the interior to prevent adhesion (sources from Sigma Aldrich product no. 255475-50G boron nitride powder, 1 m, 98%, St. Louis, MO, USA). Boron nitride crucibles have been shown to perform successfully with rare earth carbides in the open literature [23,28]. Other crucibles were not considered due to potential chemical interactions. While the BN powder prevented adhesion, it also acted as a thermal barrier between the specimen and DSC thermocouple, significantly dampening the DSC peak response and hindering accurate phase transition identification. Therefore, the BN powder was not used, resulting in the samples adhering to the crucibles but providing clean and distinct DSC phase transition responses. A new crucible was employed for each test, which greatly added to the cost of the experimentation.
2.4. Differential Scanning Calorimetry
The Netzsch 449 F1 Jupiter Simultaneous Thermal Analyzer (STA) was employed (sourced from Netzsch, Bavaria, Germany), as it can perform multiple types of analysis, including ThermoGravimetric Analysis (TGA) and DSC. For this work, the STA was used in DSC-TGA mode to perform the experimental measurements, similar to other experimental works completed at Ontario Tech University [44,45,46]. The SiC furnace of the STA was employed, permitting a peak measurement temperature of 1550 °C but maximum setpoint temperature of 1600 °C with a continuous flow of 99.999% Ar gas at 20 mL/min passed over an Oxygen Trap System (OTS) composed of a zirconium oxygen-getter ring and alumina support tube (sourced from Netzsch product no. HTP40000A97.010-00, Bavaria, Germany). Measurements were performed using an alumina sample carrier, Type S TGA-DSC thermocouple, with a Pt/Rh head (sourced from Netzsch product no. HTP40000A54.000-00, Bavaria, Germany), having a mass balance resolution of 25 ng and a maximum sample weight of 5 g including the two DSC crucibles [47]. A photograph of the DSC setup is shown in Figure 7, and a schematic showing the layout of the thermocouple is shown in Figure 8. A dissimilar metal junction is under each crucible and wired together, composing the thermocouple assembly, as shown in blue.
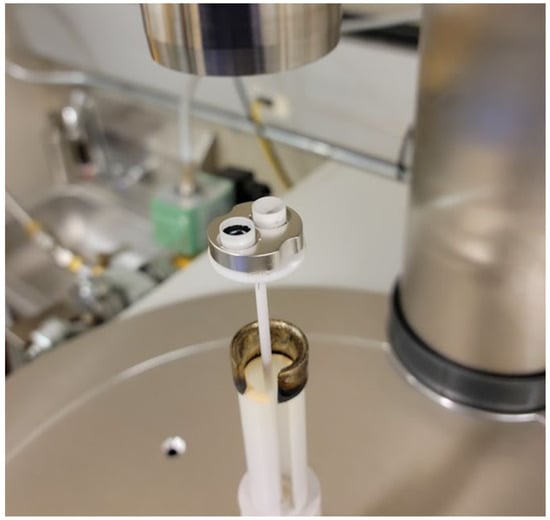
Figure 7.
STA 449 F1 Jupiter STA setup with OTS ring, alumina support tube, alumina sample carrier, Type S TGA-DSC thermocouple with a Pt/Rh head, and boron nitride measurement and reference crucibles.
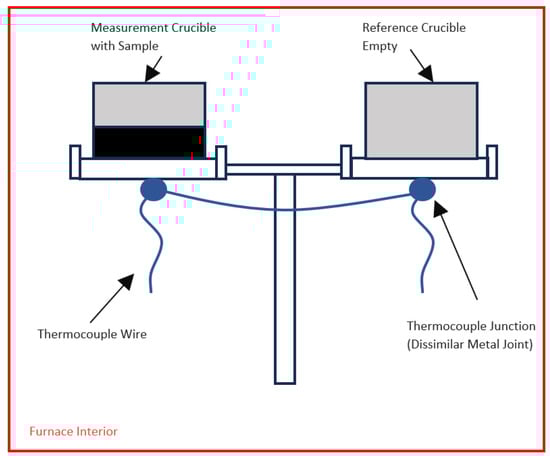
Figure 8.
Schematic of the STA interior showing placement of crucibles and thermocouple.
Prior experimentation has shown that below 800 °C, the OTS was ineffective at reducing oxygen concentration [44,45], as measured with a Zirox ZR 5 oxygen probe (sourced from Zirox, Greifswald, Germany). Despite this observation, residual oxygen remained at approximately 180 ppm within this temperature range which is favorable to prevent oxygen ingress during the low-temperature calibrant testing. Additionally, mass changes during each experiment were found to be negligible, with mass changes increasing up to 5% at the peak temperature of a heating cycle likely due to buoyancy effects, then returning to nominal at the end of the cycle and nominal at the end of the overall DSC experiment. This indicated that oxidation during testing was unlikely to have occurred.
2.5. DSC Calibration
The STA DSC-TGA was calibrated with one measurement crucible containing the calibrant and one empty, reference crucible, using the Netzsch DSC/DTA calibration kit (sourced from Netzsch part no. 6.223.5-91.3.00, Bavaria, Germany). The calibrants used in this study and their melting temperatures are: In ( °C), Zn ( °C), Al ( °C), Ag ( °C), and Au ( °C). Experiments above the gold melting temperature should be reviewed with care due to potential extrapolation errors in the DSC measurements. Nickel, with a melting temperature of °C, was initially included as a calibrant but was found to chemically react with the boron nitride crucibles and excluded. An optical image of the reacted nickel calibrant and boron nitride crucible is shown in Figure 9. A study by Song et al. [48] reacted hexagonal BN powder with nickel(II) nitrate hexahydrate in an aqueous solution to form Ni(II) modified porous BN, which was eventually annealed into a solid solution. It was shown that the nickel adhered to the outer surface of the BN via B-O-Ni bonding [48]. Therefore, it is suspected that oxygen played a role in the chemical interaction observed, either via an oxide layer on the nickel calibrant or the BN crucible. Another study by Zhong et al. [49] demonstrated that nickel oxide can decompose hexagonal BN into boron oxide, which may have also contributed to the observed phenomenon.
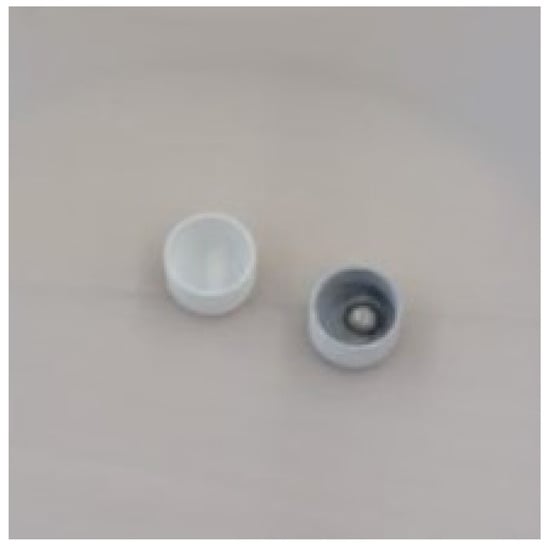
Figure 9.
Test Ni-2-1 post-DSC measurement of nickel calibrant using BN crucibles. Sample appears to have reacted with the crucible.
Calibrant melting temperatures were confirmed through three heating cycles 100 °C above and below the reported melting temperature at a heating rate of 5 °C/min, per the recommendation by Netzsch [50] and previous DSC experience using the STA instrument [44,45]. The onset temperature from the first heating cycle was discarded as the test system had not reached thermodynamic equilibrium. The average of the onset temperatures of the second and third heating cycles was used to determine the phase transition temperatures of the calibrants, as analyzed by the Netzsch Proteus software v.6.1.0 [51]. The enthalpy of formation values were calculated as the area under the second and third heating cycle peaks similarly using the Netzsch Proteus software [50,51]. Figure 10 shows the DSC plot obtained from the silver calibration test, demonstrating the difference in DSC response of the first heating cycle compared to the second and third, while Figure 11 demonstrates the determination of the phase transition onset temperature and enthalpy values.
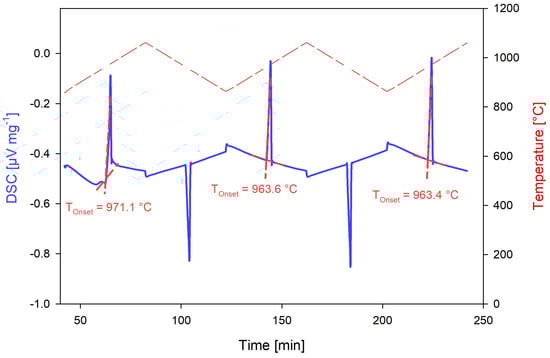
Figure 10.
DSC response of the silver calibrant from the Netzsch calibration kit 6.223.5–91.3.00 using boron nitride crucibles.
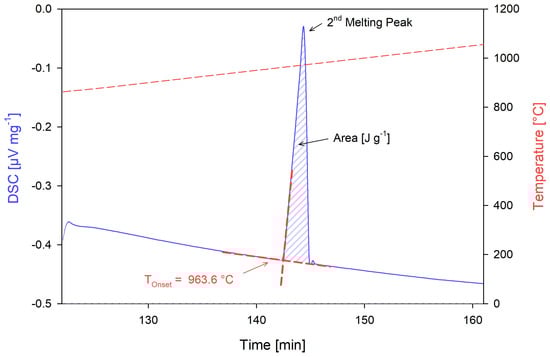
Figure 11.
Onset temperature and enthalpy measurements of the second heating cycle of the silver calibrant.
The Netzsch Temperature Calibration program [50] was used to fit a second-order polynomial to the calibrant phase transition temperatures. This was chosen over the linear approximation as it was more accurate for the 600 °C to 900 °C range that encompassed the majority of the planned experiments. The calibration curve is shown in Figure 12 as fit to Equation (1) and the results of the calibration analysis using the Netzsch Proteus software are shown in Table 5. Note that the scale is relatively small, with the largest deviation from the regression being the silver calibrant at approximately °C. The regression fit of the temperature calibration curve is represented by
where , , and are the temperature calibration coefficients determined through the regression analysis and is the measured temperature [50,51]. A weighting factor of 10 was given to all calibrants as the measured onset temperatures were all close to the reference temperatures.
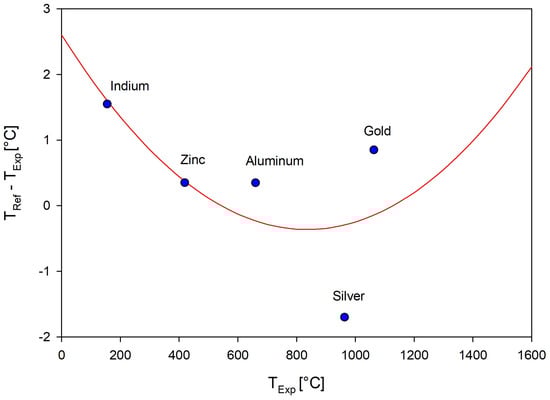
Figure 12.
Regression analysis of experimentally measured calibrant onset melting temperatures and calibration curve.
Table 5.
Measured and corrected calibration temperatures.
The enthalpy of fusion of the phase transitions was calculated by measuring the area of the DSC phase transition peak from the second and third heating cycles using the Proteus software [51] and averaging the values. The corrected temperature values from the temperature calibration curve and the average measured enthalpy of fusion values were then entered into the Netzsch Sensitivity Calibration program. The enthalpy values were then fit to the curve in Equation (2) by
where and are sensitivity coefficients and T is the measured temperature. A weighting factor of 10 was applied to all calibrants similar to the temperature calibration. The resulting sensitivity curve is shown in Figure 13. The sensitivity results were then applied to the measurements reported for this work.
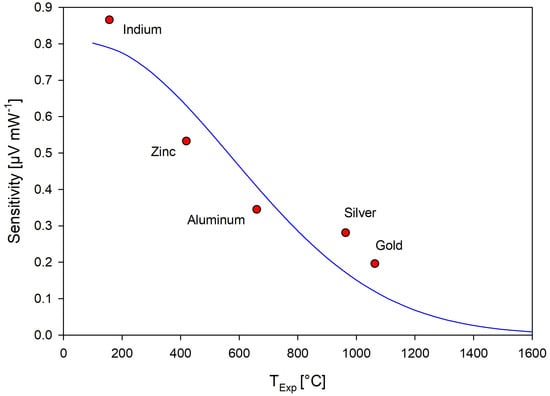
Figure 13.
Regression analysis of experimentally measured sensitivity calibration values.
2.6. DSC Measurements
DSC measurements of the carbide samples were performed in a similar manner as the calibration sequences. Samples were removed from the argon-filled glovebox using an anti-static weighing boat, and their mass measured using a Sartorius Entris 64I-1SUS mass balance (sourced from Sartorius, Göttingen, Germany) with an accuracy of ±0.1 mg before being placed inside a boron nitride crucible and positioned into the STA furnace. The total exposure of the sample in air was less than 10 min to minimize oxidation. The combined intermediate samples produced at OTU were tested using a similar process with the addition of a 90 min isothermal hold at 1100 °C at the beginning of the DSC test. Lower temperatures and shorter isothermal holds were tested but these proved ineffective at completely melting and mixing the samples as confirmed through poor DSC responses and a lack of melting observed via visual inspection of the measurement crucible. A summary of the DSC test parameters is provided below:
Measurement parameters:
- Test Instrument: Netzsch STA 449 F1 Jupiter Simultaneous Thermal Analyzer (sourced from Netzsch, Bavaria, Germany);
- Inert Gas Passover: 99.999% Ar gas;
- Gas Flow Rate: 20 mL/min;
- Oxygen Trap System: Zirconium oxygen-getter ring (sourced from Netzsch, Bavaria, Germany);
- Sample Carrier Support Tube: Alumina (sourced from Netzsch product no. HTP40000 A97.010-00, Bavaria, Germany);
- Sample Carrier: Alumina with a Pt/Rh head and Type S TGA-DSC Thermocouple (sourced from Netzsch product No. HTP40000A54.000-00, Bavaria, Germany);
- Measurement Crucible: Boron Nitride (sourced from Netzsch product no. NGB808836, Bavaria, Germany);
- Reference Crucible: Boron Nitride (sourced from Netzsch product no. NGB808836, Bavaria, Germany).
Measurement procedure:
- STA Crucibles: Insert the measurement crucible with the sample and the empty reference crucible onto the STA sample holder;
- STA Furnace: Perform three STA SiC furnace volume evacuations using a vacuum pump, and three furnace volume re-fills with 99.999% Ar gas;
- Temperature Rate: Set the temperature rate to 5 °C/min;
- Isothermal Hold: For the intermediary compounds produced at OTU, heat the furnace to 1100 °C, then hold for 90 min—for the UTSA samples, omit this step;
- Return to Room Temperature: For the intermediary compounds produced at OTU, cool the furnace to 25 °C—for the UTSA samples, omit this step;
- Temperature Heating: Heat the furnace to 100 °C above the highest predicted phase transition temperature;
- Temperature Cooling: Cool the furnace to 100 °C below the lowest predicted phase transition temperature;
- Temperature Cycling: Repeat Step 5 and 6 for a total of six temperature transition cycles, i.e., three heating and three cooling.
2.7. Experimental Procedures
As a result of the chemical interactions observed between the alumina crucibles and the carbide samples, variations in testing were required until a standard, repeatable test sequence was established with the available lab equipment. A summary of the tests performed is provided in Table 6. Note that samples labeled Nd1.5, Nd2.5, Nd3.5, and Ce1.5 were produced at OTU, and all other samples were produced at UTSA. The Test ID in this table is assigned per the following system: “(Material)-(Campaign #)-(Test #)”. Campaign #1 commenced with alumina DSC crucibles for calibrations and testing. Nd1 was the first carbide sample tested, with tests Nd1-1-1 and Nd1-1-2 showing no discernible DSC phase transition. It was suspected that the low masses of 21.1 mg and 20.0 mg contributed to this observation. Therefore, test Nd1-1-3 used 125.3 mg of sample Nd1 in an attempt to improve the DSC response. The sample appeared to chemically react with the alumina crucible as shown in Figure 6, with the resultant DSC response displaying erratic values that did not follow the repeatability of typical DSC sequences.
Table 6.
Rare earth carbide DSC campaigns and test sequences.
Carbide testing in Campaign #2 commenced with Nd1-2-1 and boron nitride crucibles, where a two-hour isothermal hold of 500 °C with 0.25% H2 gas, balance Ar, was added. The lack of DSC response in tests Nd1-1-1 and Nd1-1-2 was postulated to be a result of sample oxidation. Therefore, a small amount of hydrogen gas was passed over the sample to react with any surface oxygen and removed before commencing the three heating and cooling cycles for phase transition measurements. This is based on prior experience with oxidized samples at OTU that was able to successfully mitigate specimen oxidation through this marginal passover of hydrogen gas. No mass change was observed during tests Nd1-2-1, Nd1-2-2, and Nd2-2-1, suggesting that the hydrogen did not remove significant amounts of oxygen or material. It is also possible that there was insufficient hydrogen added to the system to significantly reduce the samples. DSC results for Nd1-2-1 and Nd1-2-2 were excellent compared to those measured with alumina crucibles, with well-defined phase transitions. However, the samples adhered to the crucible after testing. This appeared to be a different phenomenon compared to the alumina-Nd1 reaction and BN-Ni reaction as no mass change occurred, the crucible remained visually unchanged, and the DSC response provided expected results. Therefore, boron nitride powder was added to the crucible for test Nd2-2-1 in an attempt to prevent sample adhesion. Initial results appeared to prevent adhesion between the sample and crucible, but the DSC response was negligible above background noise and it was later discovered that the powder could not be removed from the crucible.
Campaign #3 commenced using boron nitride crucibles, with the intent of determining a configuration that would prevent sample and crucible adhesion. The 0.25% H2 gas isothermal hold was also omitted based on the suspected negligible improvements. Tests Nd1-3-1 and Nd1-3-2 attempted to adjust the boron nitride powder to prevent adhesion while permitting strong DSC responses. Test Nd1-3-1 used 0.8 mg of BN powder, which provided an excellent DSC response but did not prevent sample adhesion. The results were also comparable to Nd1-2-1, confirming that the hydrogen gas did not improve the DSC responses and that the minimal BN powder could produce a strong DSC response. Test Nd1-3-2 used 14.5 mg of BN powder, dampening the DSC response so no discernible phase transitions were observed. Unexpectedly, the sample also adhered to the powder and crucible. The campaign was then paused and restarted due to temporary equipment downtime and other factors.
Finally, Campaign #4 proceeded with just boron nitride crucibles, no hydrogen gas passover, and no boron nitride powder lining, resulting in the use of one BN crucible for one carbide test measurement as sample adhesion could not be reliably prevented without the loss of DSC responses.
2.8. Potential Sample Oxidation
Oxidation of the samples may have occurred during transportation to the OTU facility. At UTSA, the samples were packaged into Ziploc bags and placed into a hardshell, sealable container, all within an argon-filled glovebox. The cap of the container was further sealed with packing tape. Despite these precautions, the Ziploc bags of each sample were observed to contain a non-trivial amount of powder indicative of small levels of oxidation from interaction with the samples. The powder was present on the exterior of some of the samples and within the Ziploc bags. Figure 14 shows photographs of samples Nd1 and Nd3 in their original packaging and removed to display their outer surface within the OTU glovebox. The packaging of Nd1 had some powder visible in the Ziploc bag, but displays the least amount of powder compared to all other samples. Additionally, the exterior of the sample did not have significant amounts of powder present as shown by the detailed surface features. Nd3 had a significant amount of powder present in the Ziploc bag, and the surface of the sample was chalk-like in appearance and texture. However, this powder was removed through low-force abrasion with a Kimtech wipe and calipers. Use of the chiseled pieces from sample resizing further reduced potential contamination from oxide compounds as it is unlikely that oxidation entered the sample interior. This was confirmed through visual inspection of cut samples.
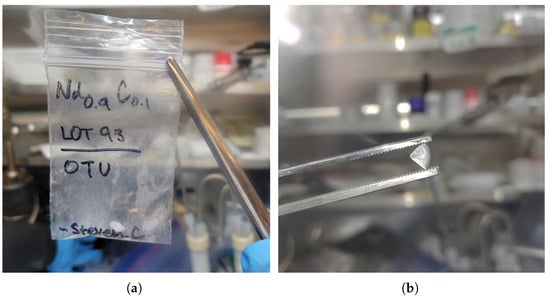
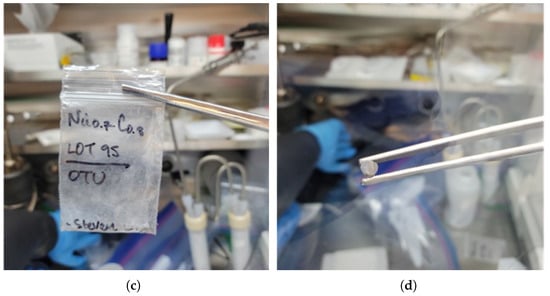
Figure 14.
Optical images of Nd1, 10 mol%C and 90 mol%Nd, and Nd3, 30 mol%C and 70 mol%Nd as shown in their original packaging: (a) Nd1 transport packaging; (b) Nd1 sample exterior; (c) Nd3 transport packaging; (d) Nd3 sample exterior.
3. Results
DSC responses were analyzed using the Netzsch Proteus software. Three heating and cooling cycles were performed for the original samples provided by UTSA and an isothermal hold at the peak of the first heating cycle was added for the intermediary samples produced at OTU. Samples were initially solid, with rough and jagged surfaces as a result of the cutting process, then liquefied and filled the inner surface of the crucible after melting in the DSC. This provided improved surface area of contact and heat transfer with the DSC thermocouple as confirmed through visual inspection and shown in Figure 15. It is noted that some samples did not fully wet the inner surface of the measurement crucible despite melting, as shown in Figure 15c,d with sample Ce2.
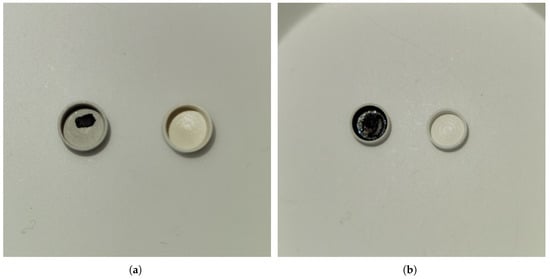
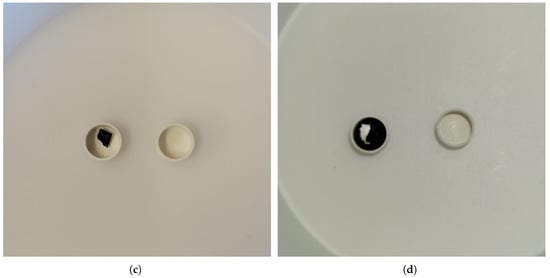
Figure 15.
Optical images of Nd4, 40 mol%C and 60 mol%Nd, and Ce2, 20 mol%C and 80 mol%Ce, pre- and post-DSC: (a) Nd4 pre-DSC; (b) Nd4 post-DSC; (c) Ce2 pre-DSC; (d) Ce2 post-DSC.
3.1. DSC Measurements of the Nd-C System
3.1.1. Nd1: 10 mol%C, 90 mol%Nd
DSC measurements of Nd1 were performed under Campaigns #1, #2, and #3 as described in Table 6, and reported data are derived from tests Nd1-2-1, Nd1-2-2, and Nd1-3-1. Nd1-2-1 used 31.2 mg of sample and did not utilize boron nitride powder lining as DSC tests of the stoichiometric NdC2 in the literature indicated that the sample would not adhere to the crucible [23,52]. Post-test examination determined that the sample adhered to the crucible, but the DSC signal response was clear and no apparent chemical reaction occurred as confirmed visually and through thermogravimetric response of the STA. Nd1-2-2 increased the sample size to 147.4 mg to improve the strength of the DSC response, and also omitted BN powder. DSC responses were excellent; however, the sample adhered to the crucible once again. As mentioned previously, Nd1-2-1 and Nd1-2-2 employed a two hour isothermal hold of 500 °C with 0.25% H2/Ar gas, during the first temperature ramping cycle in an attempt to mitigate any potential oxidation of the sample. Figure 16 shows the DSC response of the third heating cycle of test Nd1-2-2, which displayed representative DSC peaks for this molar concentration.
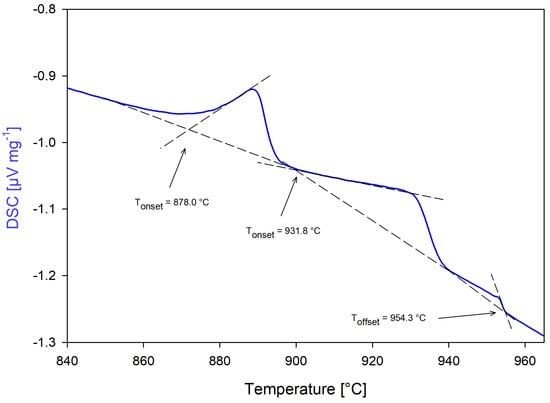
Figure 16.
Test Nd1−2−2: 10 mol%C−90 mol%Nd third heating cycle.
Nd1-3-1 employed 0.8 mg of boron nitride powder using a sample size of 40.1 mg, with the sample adhering once more but providing observable phase transitions comparable to Nd1-2-1 and Nd1-2-2. The test did not use the H2 isothermal hold, and results confirmed that the isothermal hold did not contribute to improved DSC responses. Three phase changes were observed in all tests, but displaying relatively higher phase transition temperatures than predicted by Bian et al. [22]. In all tests of Nd1 through all campaigns, the sample completely liquefied. Weighting was favored on the data collected from test Nd1-3-1 as the solidus temperature better aligned with the Nd2 and Nd3 solidus temperatures.
3.1.2. Nd2: 20 mol%C, 80 mol%Nd
Two DSC measurements were performed on two samples of Nd2 to identify the eutectic transition temperature of the system under Campaigns #2 and #4 and tests Nd2-2-1 and Nd2-4-1, respectively. Nd2-2-1 employed a 125.9 mg sample with 12.7 mg of boron nitride powder, and the second used a 22.8 mg sample without boron nitride powder. The sample used in the first test did not adhere to the crucible, but the DSC response was severely suppressed with a single, marginal inflection point present in both heating cycles. Nd2-4-1 displayed a single prominent DSC peak response indicating a phase transition in both the second and third heating cycles that agreed well with each other and was reported. The sample completely liquefied in the second test. Weighting was favored on test Nd2-4-1 due to the improved test conditions and higher DSC response, as well as better alignment with neighboring composition solidus temperatures. Noise was present in the DSC response that is speculated to be caused by the relatively small sample size, which would result in the DSC measurement thermocouple being more sensitive to temperature fluctuations.
3.1.3. Nd3: 30 mol%C, 70 mol%Nd
Nd3 was tested under Campaign #4 via test Nd3-4-1 using a sample of mass 33.7 mg. The second and third heating cycles produced an evident phase with a prominent DSC peak at the predicted solidus. The liquidus temperature was difficult to identify due to the unexpected DSC response of both heating cycles from 800 °C to 990 °C, where multiple inflection points appeared with amplitudes slightly above the background response. The last inflection point, also with the largest DSC response within this range, had offset temperatures for the second and third heating cycles of °C and °C that were reported. The sample completely liquefied in this test.
3.1.4. Nd4: 40 mol%C, 60 mol%Nd
Nd4 was tested under Campaign #4 via test Nd4-4-1 using a sample of mass 16.0 mg. Unlike Nd3, the lower-temperature eutectic phase transition was difficult to identify while the liquidus was more apparent. The DSC response showed a change in slope commencing at approximately 800 °C for both the second and third heating cycle indicating the potential for a phase transition to exist somewhere in this region. However, there appears to be noise or a poor DSC response or some combination that may be impacting the DSC signal. This is discussed further in Section 4. As a result, there is no reported temperature for the low-temperature eutectic phase transition. The liquidus offset temperature for the second and third heating cycle agreed well with each other and displayed a comparatively more prominent, but objectively dampened DSC peak at °C and °C, respectively. The sample completely liquefied in this test.
3.1.5. Nd1.5: 16.3 mol%C, 83.7 mol%Nd
A 14.5 mg sample of Nd1 and a 22.2 mg sample of Nd2 were placed in the measurement crucible and heated to 1100 °C, holding isothermally for 90 min under test Nd1.5-4-1. Three separate inflection points were observed in the second and third heating cycle. The relatively small response of the first peak may indicate that this is not actually a phase change. Data are reported for the solidus and liquidus from the second and third peaks using the onset and offset temperatures, respectively. The first peak is discussed later in Section 4. The sample completely liquefied in this test.
3.1.6. Nd2.5: 25.14 mol%C, 74.86 mol%Nd
A 31.8 mg sample of Nd2 and 29.8 mg sample of Nd3 were placed in the measurement crucible and heated to 1100 °C, holding isothermally for 90 min under test Nd2.5-4-1. Similar to Nd1.5, three separate inflection points were observed and data for the onset temperature of the second and offset of the third were reported for the solidus and liquidus, respectively. The sample completely liquefied in this test.
3.1.7. Nd3.5: 35.63 mol%C, 64.37 mol%Nd
A 26.2 mg sample of Nd3 and 29.5 mg sample of Nd4 were placed in the measurement crucible and heated to 1100 °C, holding isothermally for 90 min under test Nd3.5-4-1. A change in the DSC response was observed at approximately 680 °C for both the second and third heating cycle similar to the other mixed samples. However, two higher temperature prominent DSC peaks were present in both the second and third heating cycle, which agreed well with each other. The onset temperature of the second peak and the offset of the third peak were reported. The sample completely liquefied in this test.
3.2. DSC Measurements of the Ce-C System
3.2.1. Ce1: 67 mol%C, 33 mol%Ce
Ce1 was tested under Campaign #4 via test Ce1-4-1 using a sample mass of 8.7 mg. This was the smallest sample size tested in the experimental campaign due to issues with the sample resizing process. A single phase transition was observed in both the second and third heating cycle, with the onset temperatures agreeing well with each other and were reported. However, visual inspection of the sample indicated that it did not completely melt despite reaching temperatures of 1300 °C. It is suspected that the surface area of the sample in contact with the crucible melted while the rest of the sample remained as a solid mixture due to the sample adhering to the crucible and retaining some of its original shape.
3.2.2. Ce2: 20 mol%C, 80 mol%Ce
Ce2 was tested under Campaign #4 via test Ce2-4-1 using a sample of mass 40.2 mg. Initially, the sample did not melt upon completion of the test and no discernible phase transition occurred in the DSC response. The test was restarted as Ce2-4-2 and the max temperature was changed from 760 °C to 980 °C. The sample successfully liquefied. The first heating cycle had a strong DSC response but as the system was not yet in thermodynamic equilibrium the result is not reported. Additionally, the DSC responses for the second and third heating cycle did not display a prominent DSC peak. Instead, a small DSC response was observed with a minimal inflection point that appeared to be larger than the background response. Onset temperatures for this response from the second and third heating cycles were reported and differed by approximately 12 °C.
3.2.3. Ce1.5: 32 mol%C, 68 mol%Ce
A 9.5 mg sample of Ce1 and 27.6 mg sample of Ce2 were placed in the measurement crucible and heated to 1100 °C, holding isothermally for 90 min under test Ce1.5-4-1. Similar to Ce2, the first heating cycle displayed more prominent DSC responses, with two inflection points observed, while the second and third heating cycles had significantly muted DSC responses. The sample was restarted as Ce1.5-4-2 in an attempt to improve the signal response by expanding the temperature bounds. The minor inflection points observed via the derivative of the DSC response was used to identify potential phase transitions in the second and third heating cycle of both tests, while using the first heating cycle overlay as a qualitative comparison. The sample completely liquefied in both tests. See Figure 17 for the first and third heating cycles of test Ce1.5-4-2. The data for this measurement are reported in this work to inform future efforts, but should be treated as suspect given the poor DSC response.
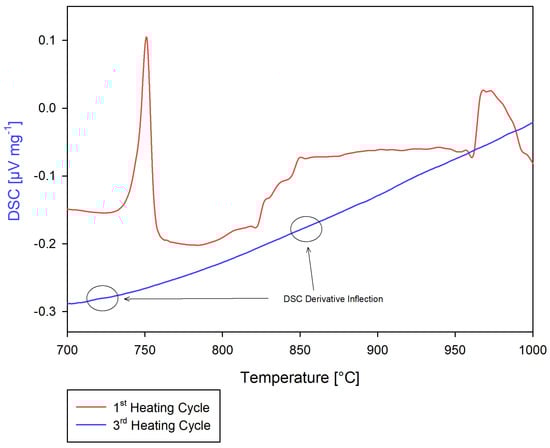
Figure 17.
Test Ce1.5−4−1: 39.8 mol%C and 60.2 mol%Ce first and third heating cycle.
3.3. Error Analysis
The error in temperature measurements was calculated using the combined uncertainty method, summation in quadrature. The standard uncertainty for the temperature values, , was determined using Equation (3):
where [°C] is the temperature combined uncertainty, is the sensitivity coefficient, and [°C] is the standard uncertainty of each source of error in the temperature measurements. is equal to 1 since the uncertainty contributors are in units of °C. The Netzsch DSC thermocouple instrument uncertainty is ±0.4 °C [45]. Based on the temperature calibrations and regression analysis from the standard deviation, the standard uncertainty is ±4.1 °C. Additionally, the uncertainty associated with recording the phase transition temperature reading from the Netzsch Proteus software at 5 °C/min is ±0.4 °C. Finally, there is significant uncertainty associated with the transition temperatures reported for the same molar concentration but different test samples, as seen in the values for tests Nd1-2-1, Nd1-2-2, and Nd1-3-1. This is likely a combination of variation in sample size, test configuration, and interaction between the sample and crucible. The uncertainty for sample temperature measurements is ±32.4 °C. Therefore, using Equation (3), the combined temperature uncertainty of DSC measurements is ±32.7 °C.
The error in the enthalpy of fusion measurements was calculated using a similar process. is equal to 1 as all error contributors are in units of kJ/mol. The Netzsch DSC enthalpy measurement uncertainty is ±2% [53], which conservatively is ±0.4 kJ/mol by applying the uncertainty to the largest enthalpy recorded. A regression analysis of the standard deviation of the calibrant enthalpies provides a standard uncertainty of ±0.6 kJ/mol. The uncertainty associated with recording the enthalpy value from the Netzsch Proteus software is ±1 kJ/mol. Finally, the uncertainty for the enthalpies reported for the same molar concentration but different test samples is ±0.2 kJ/mol. Therefore, using Equation (3), the combined enthalpy uncertainty is ±1.3 kJ/mol.
3.4. Experimental Results
The reported phase transition temperatures and associated enthalpies of fusion from this work are summarized in Table 7, Table 8, Table 9 and Table 10, along with the available data in the open literature. Data are reported for all expected phase transitions with the exception of the low-temperature transition for sample Nd4. No discernible DSC peak or derivative inflection point could be observed for this predicted transition.
Table 7.
Measured phase transition temperatures of Nd-C from this work and the open literature.
Table 8.
Measured enthalpies of fusion of Nd-C from this work and enthalpies of formation from the open literature.
Table 9.
Measured phase transition temperatures of Ce-C from this work and the open literature.
Table 10.
Measured enthalpies of fusion of Ce-C from this work and enthalpies of formation from the open literature.
3.4.1. Neodymium–Carbon
A temperature–composition isobaric phase diagram of the Nd-C system is shown in Figure 18, providing a comparison of the results from the DSC measurements completed in this work with existing data in the open literature, and Figure 19 shows the low-temperature eutectic region. The basis for the predicted phase changes is derived from the work by Bian et al., with experimental data referenced accordingly. Note that the predicted phase transitions from Bian et al. are largely speculative and should be considered for reference only. The 40 mol%C sample provides the only point for direct comparison with Bian et al. at 39 mol%C. The liquidus phase transition temperature for this work was found to be °C compared to 1200 °C reported experimentally by Bian et al., and aligned well with the predicted phase transition [22]. Nd2C3 exists as a body-centered cubic similar to the Pu2C3 [24], whereas the low-temperature Nd phase exists in the hexagonal close-packed crystal structure [22]. Cavazos et al. noted that the body centered cubic structures of rare earth carbide compounds of higher carbon molarity appear to experience greater oxidation [43]. Therefore, potential oxidation would be expected to react with Nd2C3 to a greater extent in the solid solution at 40 mol%C than the hexagonal Nd, which is expected to be seen as an increase in the measured phase transition temperature.
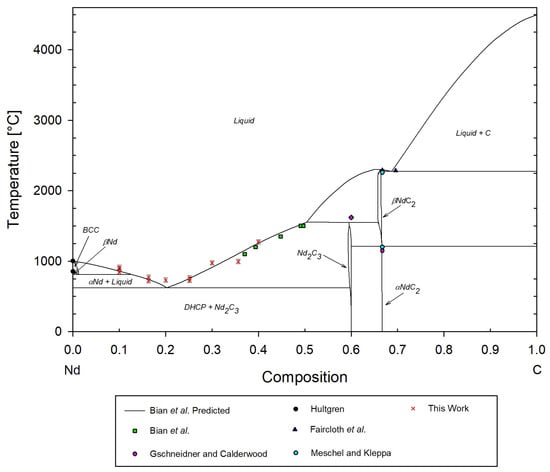
Figure 18.
Predicted Nd-C phase diagram and some experimental data by Bian et al. [22], with experimental data points from this work, Meschel and Kleppa [23], Gschneidner and Calderwood [24], Faircloth et al. [25], and Hultgren [27].
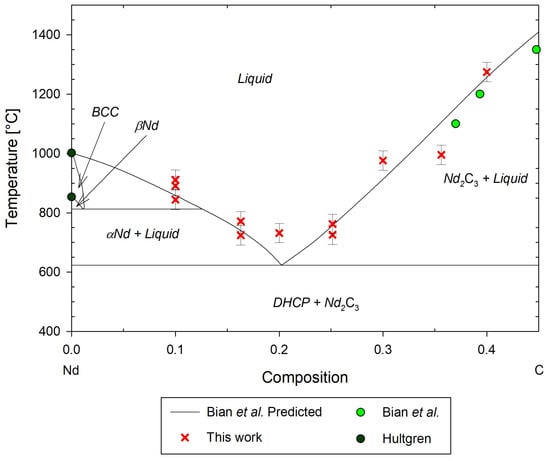
Figure 19.
Predicted Nd-C phase diagram and experimental data by Bian et al. [22] from 0 to 50 mol%C, with additional experimental data by Hultgren [27], and this work.
Additionally, it appears that the eutectic temperature is experimentally higher than predicted. Average values of the onset temperatures of the eutectic phase transition for Nd1.5, Nd2, Nd2.5, and Nd3 gives a eutectic phase transition of °C. Nd1 and Nd3.5 were omitted as their low-temperature phase transitions are significantly higher and may indicate a need to repeat the DSC measurements of these data. The low-temperature phase transitions found from tests of these samples were very inconsistent. Nd3.5 showed a strong DSC peak at °C; however, a change in the DSC response is observed occurring at approximately 730 °C, aligning well with the neighboring molar composition eutectic temperature, but an onset temperature could not be reported.
The La-C system also has a higher eutectic of approximately °C [18], which may indicate similarly higher eutectic transitions for other rare earth carbides. Phase transitions at compositions near the eutectic composition are known to be difficult to measure [54]. Therefore, Nd1 and Nd3 should be re-tested with a lower heating rate of 1 °C/min or less, as suggested by Rycerz [54], to improve DSC responses in mixed solids. Spedding et al. noted that axial ratios, c/a, of lanthanum and neodymium converged at 1.619 and 1.621 at observed phase transition temperatures, and both exhibit a hexagonal close-packed crystal structure in the low-temperature phase, indicating likely similar phase transition behavior [18]. Additionally, the outer valence electrons of neodymium and lanthanum exist in the same configuration, but their electron configurations can vary in other orbitals [55]. Therefore, they are expected to share some bonding and phase transition behavior.
3.4.2. Cerium–Carbon
A temperature–composition isobaric phase diagram for the Ce-C system is shown in Figure 20, providing a comparison of the results from the cerium carbide DSC measurements completed in this work against the open literature, and Figure 21 showing the low-temperature eutectic. The basis for the predicted phase changes is derived from the work by Peng et al. [19]. Note that the predicted phase equilibria by Peng et al. [19] are speculative and should be considered for reference only. The 67 mol%C sample provides the only point for direct comparison with Winchell and Baldwin [33]. The CeC2 to Ce2 transition at this molar composition is °C ± 32.7 °C for this work, compared to 1100 °C experimentally reported by Winchell and Baldwin [33], and the predicted phase transition of °C reported by Peng et al. [19]. It is suspected that potential oxidation effects delayed the onset of the phase transition. Additionally, the transition in crystal structure from body-centered tetragonal to face-centered cubic results in a density increase of the sample and the associated kinetics may have delayed phase transition measurements. X-ray diffraction and BSEM performed by Cavazos et al. on similar samples and in particular the 80 mol%C sample demonstrated a decomposition into CeC2 + C solid solution [43]. A similar decomposition may have occurred with the sample tested in this work, which could affect the thermocouple response and resulting reported phase transition temperature.
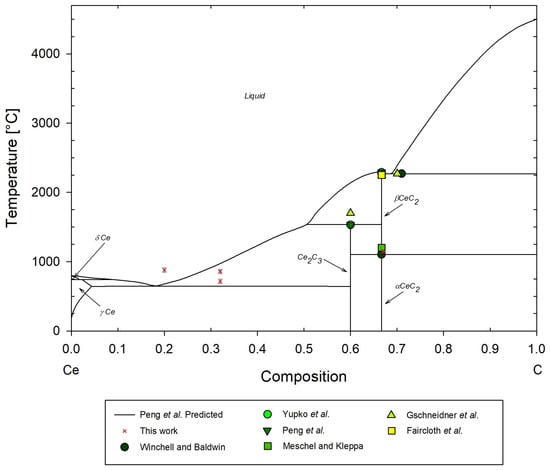
Figure 20.
Predicted Ce-C phase diagram and some experimental data by Peng et al. [19], with experimental data points from this work, Winchell and Baldwin [33], Gschneidner et al. [32], Faircloth et al. [25], Meschel and Kleppa [34], and Yupko et al. [35].
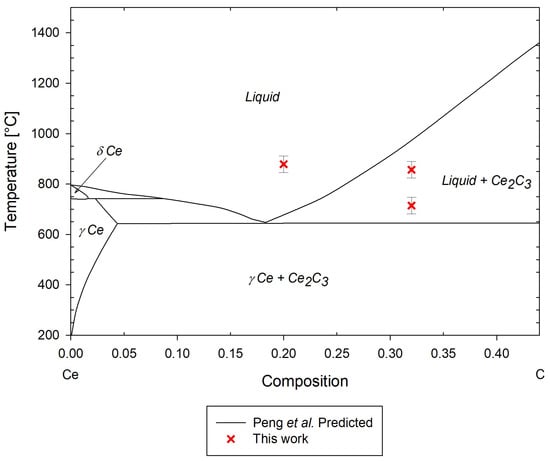
Figure 21.
Predicted Ce-C phase diagram by Peng et al. [19], with experimental data points from this work.
The low-temperature eutectic transition and liquidus measurements from Ce1.5 agree relatively well with the predicted phase transitions by Peng et al. [19]. However, the eutectic temperature appears to be significantly higher than the predicted transition, which is consistent with the Nd-C system. It is likely that this is caused by similar phenomena affecting the Nd-C measurements; however, given the lower-temperature eutectic measured from Ce1.5 and significant differences compared to the predicted phase diagram, Ce2 should be re-tested at a lower heating rate to improve the DSC response and confidence in the measurement.
Similar to neodymium, Spedding et al. also noted that the axial ratios of lanthanum and cerium converged at 1.619 and 1.618 at observed phase transition temperatures [18]. However, cerium exists as a face-centered cubic structure at low temperatures, which will differ its behavior relative to lanthanum [18]. While cerium shares the same outer electron configuration with lanthanum, other orbitals differ [55]. Therefore, similar to neodymium, cerium is expected to share some behavior with the lanthanum system, as observed with the results in this study.
4. Discussion
All tests resulted in the samples adhering to the boron nitride crucibles. Alumina crucibles also chemically reacted with the samples and were unusable for this experimental campaign. Visual inspection of the sample and crucible after testing confirmed adhesion occurred, but degradation of the exterior of the crucible was not observed and thermogravimetric analysis during the DSC tests confirmed no mass changes over the course of each heating cycle. This also confirmed that oxidation due to air ingress during testing was negligible, validating the partial pressure of oxygen measurements taken by the Zirox probe for each test. Despite this observation, there was difficulty in analyzing the DSC responses of some of the specimens, and it is suspected that oxidation during transportation from UTSA to OTU may have occurred.
In general, data reported from the second and third heating cycle correlated well within the same test, with an average variance of phase transition temperatures between cycles of °C. However, phase transitions between tests of samples that were tested multiple times displayed a larger variation. Test Nd1-2-1 solidus onset temperature of the second cycle reported a value of °C that correlated well with the onset temperature of the third cyle of °C. In test Nd1-2-2, the second and third cycle onset temperatures for the solidus were found to be °C and °C, respectively, and in test Nd1-3-1, the second and third cycle onset temperatures were °C and °C, respectively. Results from Nd1-2-1 and Nd1-2-2 aligned fairly well with each other, but Nd1-3-1 found significantly lower onset temperatures. Therefore, a higher subjective weight was applied to tests Nd1-2-1 and Nd1-2-2 than Nd1-3-1 when averaging reported phase transition temperatures. This also accounted for the significant error in the reported data.
Samples Nd3, Nd4, Ce1, and Ce2 all displayed dampened DSC responses or unexpected DSC responses captured by the STA thermocouple but lacking in clarity of the exact onset and/or offset temperatures of some phase transitions. Powder was present in the sample Ziploc bags used during transportation that appeared similar in appearance to neodymium oxide and cerium oxide, displaying a blue and black powdery color and yellow and grey powdery color, respectively. Discussions with UTSA confirmed that oxide formation of rare earths generates a substance similar to this observed material. Additionally, it is suspected that lowered heating rates would improve identification of lower-temperature phase transitions by allowing additional time for reaction kinetics to complete.
The 40 mol%C, 60 mol%Nd sample and 67 mol%C, 33 mol%Ce samples compared well to experimental and predicted values in the open literature. Mixed solids experience non-congruent melting that can add difficulty to measuring phase transitions. After initial melting and during subsequent cooling of a mixed phase, the phase of each crystal will tend to separate from the mixture and fail to completely form the predicted low-temperature solid phase [54]. As a result, eutectic and liquidus transitions of neighboring compositions may appear in the measured sample, and therefore, annealing of the sample is necessary to return to equilibrium [54]. Practically, this would necessitate an isothermal hold for all DSC measurements in this campaign of potentially 48 h and at temperatures slightly below the first predicted phase transition to improve accuracy of onset temperatures [54]. However, this explains the lower temperature effect seen on some of the tests, such as Nd2.5-4-1 at approximately 680 °C. This effect is not a real transition and is instead suspected to be an artifact of non-congruent melting, and therefore, it is omitted in this work.
4.1. Impact on TRISO Fuel Performance
Neodymium and cerium are present in the TAF-ID database as they are important lanthanoid fission products for fuel safety simulations [36]. However, their carbide binary systems are absent [36]. As a result, a Gibbs energy minimization of the binary system would first need to be assessed and then validated using experimental data to accurately model their behavior. The results from this work directly address this knowledge gap in the open literature, permitting validation of Nd-C and Ce-C models to assist with TRISO fuel fission product simulations [36]. Binary carbide system data in the TAF-ID is significantly lacking in general. Therefore, data reported here further improve the efficacy of the database to support TRISO fuel modeling. Additionally, the SiC layer of the TRISO particle is the primary barrier to non-gaseous fission product release and provides crucial structural integrity [1]. Therefore, these results further understanding of the interactions of Nd-C and Ce-C with SiC in a ternary system.
4.2. Improvements to Experimental Campaign
It is recommended to characterize the elemental composition of the test samples and the boron nitride crucibles using inductively coupled plasma mass spectrometry. This would help identify issues in the experimental methods that could improve the accuracy of the DSC measurements. Additionally, sample sizes varied significantly, from 9.5 mg to approximately 100 mg. A cutting press with an apparatus to secure the sample would vastly improve the re-sizing process and produce more uniform samples.
The intermediary samples, Nd1.5, Nd2.5, Nd3.5, and Ce1.5, were produced directly within the DSC furnace and immediately tested. Production of these molar compositions using an arc melter would better control mixing conditions for homogeneity. Finally, it is recommended that a custom boron nitride crucible be machined with high purity material to mitigate the sample adhesion observed. DSC of carbides by Meschel and Kleppa proved that BN crucibles are effective at measuring RE-C phase equilibria. It is possible that the commercially available BN crucible contains impurities that may chemically react to cause adhesion. Additionally, if the samples were in fact partially oxidized, then it is also possible that this oxygen contamination could result in the adhesion. Further analysis on these phenomena is necessary to add confidence to the data collected in this campaign.
As sample oxidation is a potential source of error, it is recommended that the transport container be improved. The plastic hardshell container that was used was found to be dented upon receipt at OTU, which may have contributed to oxygen ingress. Additionally, the container did not appear to be designed with a hermetic seal. A sturdier transport container with a designed air-tight seal and filled with an inert atmosphere should be used.
5. Conclusions
DSC measurements of Nd-C and Ce-C mixtures were conducted to assess the phase transition temperatures and associated enthalpies of fusion of varying molar concentrations. Of particular interest is the interaction between the rare earth samples and the boron nitride crucibles. The experimental methodology should be further refined to use crucibles that will not adhere to the tested specimens. While previous rare earth experiments in the open literature successfully employed boron nitride crucibles without adhesion, those crucibles were custom-designed and fabricated [23,52], which may have assisted in mitigating the sample adhesion.
New data have been added that can be used to support the thermodynamic model of the Nd-C system for the 10 to 40 mol%C portion of the phase diagram. Overlaying measurements in this work with experimental data in the open literature agreed well. Data that can be used to support the thermodynamic model of the Ce-C system was similarly expanded in the 20 to 40 mol%C range, with an additional measurement performed of the Ce2C3 compound that compared well to experimental data in the open literature.
These results expand upon nuclear fuel thermodynamic databases, such as TAF-ID, to provide experimental data that validate Nd-C and Ce-C Gibbs energy minimization models. This will provide a thermodynamic basis for TRISO fuel safety simulations on validating the integrity of the SiC layer, and is expected to improve manufacturing of TRISO fuel particles. However, some data are still lacking in the Nd-C system, and significant gaps remain in the Ce-C system.
Author Contributions
Conceptualization, M.H.A.P. and E.S.S.; methodology, B.W.N.F., R.V. and M.H.A.P.; writing—original draft preparation, R.V.; writing—review and editing, M.H.A.P., B.W.N.F., S.J.C. and E.S.S.; supervision, M.H.A.P. and B.W.N.F.; funding acquisition, M.H.A.P. All authors have read and agreed to the published version of the manuscript.
Funding
This research was undertaken, in part, thanks to funding from the Canada Research Chairs program of the Natural Sciences and Engineering Research Council of Canada, grant (950-231328). Funding for equipment from the Canadian Foundation for Innovation, grant #35712, and the Ontario Ministry of Economic Development, Job Creation Trade, grant #35712, which are greatly acknowledged.
Data Availability Statement
Data are contained within the article.
Acknowledgments
Thanks are due to E. Geiger (previously OTU) and Susan Meschel (Illinois Institute of Technology) for their support and productive discussions.
Conflicts of Interest
The authors declare no conflicts of interest. The funders had no role in the design of the study; in the collection, analyses, or interpretation of data; in the writing of the manuscript; or in the decision to publish the results.
Abbreviations
The following abbreviations are used in this manuscript:
| AGR | Advanced Gas Reactor |
| BSEM | Back Scattering Electron Microscopy |
| DSC | Differential Scanning Calorimetry |
| HCP | Hexagonal Close-Packed Crystal Structure |
| IPyC | Inner Pyrolytic Carbon |
| OPyC | Outer Pyrolytic Carbon |
| OTS | Oxygen Trap System |
| STA | Simultaneous Thermal Analyzer |
| TG | Thermogravimetric |
| TGA | Thermogravimetric Analysis |
| TRISO | TRi-structural ISOtropic |
| UCO | Uranium Oxycarbide |
| US | United States |
| UTSA | University of Texas at San Antonio |
References
- Demkowicz, P.A.; Liu, B.; Hunn, J.D. Coated particle fuel: Historical perspectives and current progress. J. Nucl. Mater. 2019, 515, 434–450. [Google Scholar] [CrossRef]
- Demkowicz, P.A.; Petti, D.A.; Sawa, K.; Maki, J.T.; Hobbins, R.R. TRISO-Coated Particle Fuel Fabrication and Performance. In Comprehensive Nuclear Materials, 2nd ed.; Konings, R.J., Stoller, R.E., Eds.; Elsevier: Oxford, UK, 2020; pp. 256–333. [Google Scholar] [CrossRef]
- Coen, V.; Hausner, H.; Quataert, D. Cesium migration in silicon carbide. J. Nucl. Mater. 1972, 45, 96–104. [Google Scholar] [CrossRef]
- Bower, G.R.; Ploger, S.A.; Demkowicz, P.A.; Hunn, J.D. Measurement of kernel swelling and buffer densification in irradiated UCO-TRISO particles. J. Nucl. Mater. 2017, 486, 339–349. [Google Scholar] [CrossRef]
- Jiang, W.; Hales, J.D.; Spencer, B.W.; Collin, B.P.; Slaughter, A.E.; Novascone, S.R.; Toptan, A.; Gamble, K.A.; Gardner, R. TRISO particle fuel performance and failure analysis with BISON. J. Nucl. Mater. 2021, 548, 152795. [Google Scholar] [CrossRef]
- Minato, K.; Ogawa, T.; Fukuda, K.; Sekino, H.; Miyanishi, H.; Kado, S.; Takahashi, I. Release behavior of metallic fission products from HTGR fuel particles at 1600 to 1900 °C. J. Nucl. Mater. 1993, 202, 47–53. [Google Scholar] [CrossRef]
- Fu, Z.; van Rooyen, I.J.; Bachhav, M.; Yang, Y. Microstructure and fission products in the UCO kernel of an AGR-1 TRISO fuel particle after post irradiation safety testing. J. Nucl. Mater. 2020, 528, 151884. [Google Scholar] [CrossRef]
- Price, M. The Dragon Project origins, achievements and legacies. Nucl. Eng. Des. 2012, 251, 60–68. [Google Scholar] [CrossRef]
- Wen, H.; van Rooyen, I.J. Distribution of fission products palladium, silver, cerium and cesium in the un-corroded areas of the locally corroded SiC layer of a neutron irradiated TRISO fuel particle. J. Eur. Ceram. Soc. 2017, 37, 3271–3284. [Google Scholar] [CrossRef]
- Katoh, Y.; Snead, L.L.; Szlufarska, I.; Weber, W.J. Radiation effects in SiC for nuclear structural applications. Curr. Opin. Solid State Mater. Sci. 2012, 16, 143–152. [Google Scholar] [CrossRef]
- Grover, S.; Maki, J.; Petti, D. Completion of the First NGNP Advanced Gas Reactor Fuel Irradiation Experiment, AGR-1, in the Advanced Test Reactor; Technical Report INL/CON-10-18032; Idaho National Laboratory: Idaho Falls, ID, USA, 2010. [Google Scholar]
- Petti, D.; Bell, G.; Team, A. The DOE Advanced Gas Reactor Fuel Development and Qualfication Program; Technical Report INEEL/CON-04-02416; Idaho National Laboratory: Idaho Falls, ID, USA, 2005. [Google Scholar]
- Hales, J.D.; Toptan, A.; Jiang, W.; Spencer, B.W. Numerical evaluation of AGR-2 fission product release. J. Nucl. Mater. 2022, 558, 153325. [Google Scholar] [CrossRef]
- van Rooyen, I.; Lillo, T.; Wu, Y. Identification of silver and palladium in irradiated TRISO coated particles of the AGR-1 experiment. J. Nucl. Mater. 2014, 446, 178–186. [Google Scholar] [CrossRef]
- Shams, M.K.; Ducros, C.; Rickard, M. U.S. NRC—CNSC Memorandum of Cooperation FINAL REPORT Concerning Tristructural Isotropic (TRISO) Fuel Qualification; Technical Report U.S. NRC ML23172A242 and CNSC e-Docs #7055295; U.S. NRC and CNSC: Rockville, MD, USA, 2023. [Google Scholar]
- Minato, K.; Fukuda, K.; Ishikawa, A.; Mita, N. Advanced coatings for HTGR fuel particles against corrosion of SiC layer. J. Nucl. Mater. 1997, 246, 215–222. [Google Scholar] [CrossRef]
- Stempien, J.D.; Hunn, J.D.; Morris, R.N.; Gerczak, T.J.; Demkowicz, P.A. AGR-2 TRISO Fuel Post-Irradation Examination Final Report; Technical Report INL/EXT-21-64279; Idaho National Laboratory: Idaho Falls, ID, USA, 2021. [Google Scholar]
- Spedding, F.H.; Gschneidner, K.J.; Daane, A.H. The Crystal Structures of Some of the Rare Earth Carbides. J. Am. Chem. Soc. 1958, 80, 4499–4503. [Google Scholar] [CrossRef]
- Peng, Y.; Du, Y.; Zhang, L.; Sha, C.; Liu, S.; Zheng, F.; Zhao, D.; Yuan, X.; Chen, L. Thermodynamic modeling of the C–RE (RE=La, Ce and Pr) systems. Calphad 2011, 35, 533–541. [Google Scholar] [CrossRef]
- Spedding, F.; Gschneidner, K.; Daane, A. The Lanthanum-Carbon System. Trans. Am. Inst. Min. Metall. Eng. 1959, 215, 192–199. [Google Scholar]
- Adachi, G.; Ueno, K.; Shiokawa, J. Heats of transformation in lanthanide dicarbides and mixed lanthanide dicarbide solid solutions. J. Less Common Met. 1974, 37, 313–314. [Google Scholar] [CrossRef]
- Bian, Y.; Tang, K.; Tranell, G. A thermodynamic assessment of the Nd–C system. Calphad 2015, 51, 206–210. [Google Scholar] [CrossRef]
- Meschel, S.; Kleppa, O. Standard enthalpies of formation of some neodymium and gadolinium carbides, silicides and germanides by high-temperature direct-synthesis calorimetry. J. Alloys Compd. 1995, 217, 235–239. [Google Scholar] [CrossRef]
- Gschneidner, J.K.A.; Calderwood, F. The C-Nd (Carbon-Neodymium) System. Bull. Alloy Phase Diagrams 1986, 7, 557–558. [Google Scholar] [CrossRef]
- Faircloth, R.; Flowers, R.; Pummery, F. Vaporization of some rare-earth dicarbides. J. Inorg. Nucl. Chem. 1968, 30, 499–518. [Google Scholar] [CrossRef]
- Paderno, Y.; Yupko, V.; Makarenko, G. Some Physical Properties of the Sesquicarbides of Yttrium, Lanthanum, Cerium, and Neodymium. Izv. Akad. Nauk SSSR Neorganiĉeski Mater. 1969, 5, 386–388. [Google Scholar]
- Hultgren, R.; Kelly, A. Selected Values of Thermodynamic Properties of Metals and Alloys; Wiley: Hoboken, NJ, USA, 1963; Volume 1. [Google Scholar]
- Meschel, S.; Kleppa, O. Thermochemistry of alloys of transition metals and lanthanide metals with some IIIB and IVB elements in the periodic table. J. Alloys Compd. 2001, 321, 183–200. [Google Scholar] [CrossRef]
- Vidhya, R.; Antony, M.; Vasudeva Rao, P.; Viswanathan, B. Enthalpy and Gibbs energy of formation of neodymium dicarbide. J. Nucl. Mater. 2001, 295, 228–232. [Google Scholar] [CrossRef]
- Vidhya, R.; Antony, M.; Vasudeva Rao, P.; Viswanathan, B. Enthalpy and Gibbs energy of formation of cerium dicarbide. J. Nucl. Mater. 2003, 317, 102–108. [Google Scholar] [CrossRef]
- Massalski, T.; Murray, J.; Bennett, L.; Baker, H. Binary Alloy Phase Diagrams, C-Ce (Carbon-Cerium); Number v. 1 in Binary Alloy Phase Diagrams; American Society for Metals: Metals Park, OH, USA, 1986. [Google Scholar]
- Gschneidner, K.A.; Verkade, M.E. Selected Cerium Phase Diagrams; Technical Report IS-RIC-7; Rare-Earth Information Center Energy and Mineral Resources Institute, Iowa State University: Ames, IA, USA, 1970. [Google Scholar]
- Winchell, P.; Baldwin, N.L. Mass spectrometric-Knudsen cell study of cerium dicarbide sublimation and thermal and X-ray analyses of cerium dicarbide. J. Phys. Chem. 1967, 71, 4476–4479. [Google Scholar] [CrossRef]
- Meschel, S.; Kleppa, O. Standard enthalpies of formation of some carbides, silicides and germanides of cerium and praseodymium. J. Alloys Compd. 1995, 220, 88–93. [Google Scholar] [CrossRef]
- Yupko, V.L.; Makarenko, G.; Paderno, Y. Physical Properties of Carbides of Rare Earth Materials. Tugoplavkie Karbidy 1970, 251, 148–154. [Google Scholar]
- Guéneau, C.; Dupin, N.; Kjellqvist, L.; Geiger, E.; Kurata, M.; Gossé, S.; Corcoran, E.; Quaini, A.; Hania, R.; Smith, A.; et al. TAF-ID: An international thermodynamic database for nuclear fuels applications. Calphad 2021, 72, 102212. [Google Scholar] [CrossRef]
- Jakobsson, L.K.; Tangstad, M. Distribution of Boron Between Silicon and CaO-MgO-Al2O3-SiO2 Slags. Metall. Mater. Trans. B 2014, 45, 1644–1655. [Google Scholar] [CrossRef]
- Massalski, T.; Murray, J.; Bennett, L.; Baker, H. Binary Alloy Phase Diagrams, C-Nd (Carbon-Neodymium); Number v. 1 in Binary Alloy Phase Diagrams; American Society for Metals: Metals Park, OH, USA, 1986. [Google Scholar]
- Yupko, V.L.; Makarenko, G.; Paderno, Y. Physical Properties of Carbides of Rare-Earth Metals. In Refractory Carbides; Springer: Princeton, NJ, USA, 1974; pp. 251–259. [Google Scholar] [CrossRef]
- Baker, F.B.; Huber, E.J., Jr.; Holley, C.E., Jr.; Krikorian, N.H. Enthalpies of formation of cerium dioxide, cerium sesquicarbide, and cerium dicarbide. J. Chem. Thermodyn. 1971, 3, 77–83. [Google Scholar] [CrossRef]
- Balducci, G.; Capalbi, A.; Maria, G.D.; Guido, M. Tetracarbide Molecules in the Vapor Phase over Rare-Earth-Graphite Systems. J. Chem. Thermodyn. 1965, 43, 2136–2137. [Google Scholar] [CrossRef]
- Anderson, J.; Bagshaw, A. Thermodynamic Data for Some Rare Earth Carbides by Solid-State EMF Techniques; Technical Report; Oxford University: Oxford, UK, 1970. [Google Scholar]
- Cavazos, S.J.; Younus, S.; Uresti-Mireles, J.; Sooby, E.S.; Piro, M.H.A. Rare Earth Carbide (Nd-C and Ce-C) Synthesis and Characterization to Inform Phase Equilibrium in Advanced Nuclear Fuels. Metals 2024, 14, 1322. [Google Scholar] [CrossRef]
- Collins, M.; Francolini, G.; Obreja, P.; Scuro, N.; Varga, R.; Breeden, B.; Rosas, D.; Fitzpatrick, B.; Geiger, E.; Harvel, G.; et al. A comparison of thermo-oxidation kinetic measurements of Zircaloy-4 in light and heavy water steam. J. Nucl. Mater. 2023, 573, 154111. [Google Scholar] [CrossRef]
- Lipkina, K.; Palinka, K.; Geiger, E.; Fitzpatrick, B.; Vălu, O.; Beneš, O.; Piro, M. Thermodynamic investigations of the LiF-CsF and NaF-CsF pseudo-binary systems. J. Nucl. Mater. 2022, 568, 153901. [Google Scholar] [CrossRef]
- Lipkina, K.; Hallatt, D.; Geiger, E.; Fitzpatrick, B.; Sakamoto, K.; Shibata, H.; Piro, M. A study of the oxidation behaviour of FeCrAl-ODS in air and steam environments up to 1400 °C. J. Nucl. Mater. 2020, 541, 152305. [Google Scholar] [CrossRef]
- Netzsch. High Temperature Platform 400 Operating Instructions Simultaneous TG-DTA/DSC Apparatus STA 449 F1 Jupiter®; Netzsch: Selb, Germany, 2012. [Google Scholar]
- Song, Q.; Liang, J.; Fang, Y.; Guo, Z.; Du, Z.; Zhang, L.; Liu, Z.; Huang, Y.; Lin, J.; Tang, C. Nickel (II) modified porous boron nitride: An effective adsorbent for tetracycline removal from aqueous solution. Chem. Eng. J. 2020, 394, 124985. [Google Scholar] [CrossRef]
- Zhong, G.; Cao, L.; Wang, X.; Shang, R.; Wu, F.; Wu, Y.; Liu, Y.; Xie, J. Enhanced catalytic performance in oxidative dehydrogenation of ethane via trace nickel oxide and boron nitride synergy. Appl. Catal. A Gen. 2025, 696, 120197. [Google Scholar] [CrossRef]
- Netzsch. Temperature and Sensitivity Calibration Protocol, Software Manual DSC Instruments; Netzsch: Selb, Germany, 2012. [Google Scholar]
- Netzsch. Netzsch Proteus®-Thermal Analysis Software (Version 6.1.0); Netzsch: Selb, Germany, 2018. [Google Scholar]
- Meschel, S. Personal Communication; Illinois Institute of Technology: Chicago, IL, USA, 2022. [Google Scholar]
- Netzsch. Simultaneous Thermal Analyzer–STA 449 F1 Jupiter, Analyzing and Testing Brochure; Netzsch: Selb, Germany, 2025. [Google Scholar]
- Rycerz, L. Practical remarks concerning phase diagrams determination on the basis of differential scanning calorimetry measurements. J. Therm. Anal. Calorim. 2013, 113, 231–238. [Google Scholar] [CrossRef]
- Petit, L.; Svane, A.; Szotek, Z.; Temmerman, W.M. First-principles study of rare-earth oxides. Phys. Rev. B-Condens. Matter. Mater. Phys. 2005, 72, 205118. [Google Scholar] [CrossRef]
Disclaimer/Publisher’s Note: The statements, opinions and data contained in all publications are solely those of the individual author(s) and contributor(s) and not of MDPI and/or the editor(s). MDPI and/or the editor(s) disclaim responsibility for any injury to people or property resulting from any ideas, methods, instructions or products referred to in the content. |
© 2025 by the authors. Licensee MDPI, Basel, Switzerland. This article is an open access article distributed under the terms and conditions of the Creative Commons Attribution (CC BY) license (https://creativecommons.org/licenses/by/4.0/).