Article

Appraisal of Industrial Pollutants in Sewage and Biogas Production Using Multivariate Analysis and Unsupervised Machine Learning Clustering

by
Wiktor Halecki
1,*,
Anna Młyńska
2 and
Krzysztof Chmielowski
3
1
Institute of Technology and Life Sciences—National Research Institute, Falenty, Al. Hrabska 3, 05-090 Raszyn, Poland
2
Department of Water Supply, Sewerage and Environmental Monitoring, Faculty of Environmental and Power Engineering, Cracow University of Technology, Warszawska 24, 31-155 Cracow, Poland
3
Department of Natural Gas Engineering, Faculty of Drilling, Oil and Gas, AGH University of Science and Technology, Mickiewicza 30, 30-059 Cracow, Poland
*
Author to whom correspondence should be addressed.
Appl. Sci. 2025, 15(11), 6222; https://doi.org/10.3390/app15116222
Submission received: 21 March 2025 / Revised: 24 May 2025 / Accepted: 27 May 2025 / Published: 31 May 2025
(This article belongs to the Special Issue AI in Wastewater Treatment)

Abstract

:
Sewage composition analysis is important for understanding environmental impact and ensuring effective treatment processes. In this study, we employed multivariate analysis techniques to delve into the intricate composition of sewage. Specifically, we utilized Principal Component Analysis (PCA) and Detrended Correspondence Analysis (DCA) to uncover patterns and relationships among different types of sewage pollutants. Statistical analysis revealed that treatment stages did not consistently reduce all pollutant concentrations. Mechanical treatment failed to lower chlorides and sulfates, but was effective for ether extract and phenols. Moreover, total mechanical–biological treatment provided a significant, 91% reduction of the ether extract and phenols, while only reducing chlorides by 13% and sulfates by 22%. The multivariate analysis revealed significant differences between raw sewage and mechanically treated sewage. Totally treated sewage stood out as the key factor influencing the pollutants studied, particularly chlorides and sulfates. This finding emphasizes the critical role of comprehensive treatment processes in effective sewage management. Among the analysed substances, chlorides showed the strongest clustering potential, with an average Silhouette coefficient of 0.738, the highest observed. Phenols, on the other hand, exhibited lower Within-Cluster Sum of Squares (WCSS), suggesting their potential as an alternative parameter for evaluation.

1. Introduction

Sewage composition analysis stands at the forefront of environmental research, offering critical insights into water quality and pollution levels [1,2,3]. Understanding the intricate makeup of sewage is essential for effective treatment strategies and safeguarding environmental health [4,5]. As a reflection of societal activities, sewage reveals chemical and industrial pollutants that pose significant risks to ecosystems and human health [6]. Investigating its composition highlights pollutant sources, impacts and potential mitigation strategies [7].
Industrial pollutants are harmful, because they can significantly impact both the environment and human health [8]. The ether extract represents the content of organic substances in sewage. The ether extract includes petroleum products, fats and oils, which are extracted from water and sewage with petroleum ether; this substance is resistant to comprehensive sewage treatment [9]. Ether extract is one of the significant parameters which must be considered in food industry sewage. In particular, sewage from meat, fat, poultry, dairy and fish processing plants is heavily loaded with this substance [10]. The content of the ether extract is also significant in sewage coming from production processes of confectionery plants [11,12]. Ether extract is also one of the main pollution indicators in rainwater discharged from roads [13]. Fatty and oily substances make a thin and transparent layer on the surface of the water, blocking access to oxygen [14]. This inhibits the process of water self-treatment and disrupts the functioning of aquatic ecosystems [15]. Removal of fats and oils from sewage in the mechanical stages of wastewater treatment plants (WWTPs) is not sufficient; a significant amount of fatty and oily substances flows into the WWTP in the form of emulsion and persists into the biological stages of the WWTP [15].
Phenols, chlorides and sulfates represent a class of industrial pollutants that warrant particular attention due to their significant environmental impact and potential risks to human health. Examining their presence in sewage sheds light on their sources, effects and mitigation strategies [16]. Phenols are among the basic substances found in significant amounts in sewage from the process of coal coking and obtaining coal derivatives [17]. Phenolic compounds are prevalent pollutants in sewage, originating from industries such as petrochemicals, pharmaceuticals, and pulp and paper production. These compounds pose a threat to aquatic ecosystems due to their toxicity and persistence [18]. Phenols can disrupt the balance of aquatic flora and fauna, inhibit photosynthesis in plants and impair the reproductive success of aquatic organisms. Additionally, exposure to phenolic compounds has been linked to adverse health effects in humans, including respiratory irritation and skin disorders. Effective treatment methods, such as advanced oxidation processes and activated carbon adsorption (including a cost-effective and environmentally friendly sewage-based activated carbon adsorption method, which supports the sustainable management of huge amounts of sewage [19]), are essential for removing phenols from sewage and minimizing their environmental impact [20]. Hybrid cavitation techniques for phenol removal show potential. While cavitation alone may not be efficient or cost-effective, its combination with oxidation processes, catalysts, or additives could prove beneficial [21]. Chloride ions are ubiquitous in industrial sewage, particularly in sectors such as metal processing, chemical manufacturing and food processing. Chlorides can enter water bodies through direct discharge or runoff from road salts and de-icing agents. While chloride ions themselves are not typically toxic, elevated chloride concentrations can have detrimental effects on freshwater ecosystems [22]. High chloride levels can disrupt the balance of aquatic organisms, corrode infrastructure and impair the quality of drinking water sources [23]. Excessive sulfates in industrial sewage cause environmental and operational issues, like equipment corrosion and harm to aquatic ecosystems. Calcium sulfate-induced crystallization is a promising, cost-effective solution that achieves up to 60% sulfate removal. Fluidized-bed crystallizers provide superior control and continuous operation for industrial applications, though challenges remain in optimizing the process and managing by-products [24]. Addressing the presence of the ether extract, phenols, chlorides and sulfates in sewage requires a multifaceted approach involving pollution prevention, regulatory enforcement and technological innovation [25].
Collaboration between industries, government agencies and environmental organizations is essential for implementing effective mitigation strategies and safeguarding water quality for current and future generations. Analysing contaminants, such as ether extract, phenols, chlorides and sulfates, presents significant challenges in sewage treatment technologies. These substances were selected as indicators in this study due to their high prevalence in industrial sewage, their considerable environmental impact and their importance in regulatory frameworks. This research innovates by using commercial products to reduce struvite formation, improving sewage treatment efficiency. It addresses gaps in evaluating coagulant (polyaluminium chloride (PAC)) usage and employs unsupervised machine learning to identify phenol patterns and ether extract anomalies. Our primary objectives were as follows: (i) analyse the composition of sewage by comparing raw sewage, mechanically treated sewage and totally treated sewage samples in terms of ether extract, phenols, chlorides and sulfates; (ii) assess the factors influencing biogas production, specifically comparing compost and biomass materials during the waste treatment process; (iii) optimize the use of coagulants, particularly polyaluminium chloride and commercial products (Polystabil KWS) to improve treatment processes by reducing the ether extract load and the volume of discharged sewage sludge; (iv) support decision-making by identifying the most critical pollutants through multivariate analysis and clustering, utilizing unsupervised machine learning techniques to evaluate the ether extract, phenols, chlorides, and sulfates.

2. Materials and Methods

2.1. Research Object

2.1.1. General Information

The sewage samples tested in this study were treated at a wastewater treatment plant located in southern Poland. This municipal, collective, two-stage WWTP serves an urban area and neighbouring communes. The WWTP treats both domestic sewage and industrial sewage received from small, local business entities. For the year in which the research was carried out (Year I), the details of the WWTP and the sewerage area are specified as follows:
  • Population equivalent (p.e.) of the WWTP: 180,000
  • Maximum design hydraulic capacity of the WWTP: 42,200 m3/d
  • Length of the combined sewage system: 76 km
  • Length of the sanitary sewage system: 477.2 km
  • Length of the rainwater system: 72.8 km
  • Population equivalent (p.e.) of residents using sewage network: 93,708
  • Population equivalent (p.e.) of industry using sewage network: 73,805
  • Number of residents using septic tanks: 8821
  • Number of residents using domestic treatment plants: 71
A technological scheme of the WWTP is shown in Figure 1. The first stage of treatment (mechanical treatment) takes place in the following order: two automatic bar screens, then two parallel grit chambers and, finally, two radial primary settling tanks. The second stage of treatment (biological treatment) takes place in two biological reactors consisting of separate anaerobic, hypoxic and aerobic zones, operated with activated sludge technology. The final stage of sewage treatment takes place in the two radial secondary settling tanks, from which the clarified sewage outflow is discharged to the river.

2.1.2. Energy Management

Table A1 in Appendix A shows monthly average values related to the energy management at the studied WWTP in the nine-year period under consideration. Energy use ranged between 217.08 MWh/month and 271.29 MWh/month, with an average for the multi-year period of 235.21 MWh/month. Average monthly energy production in the multi-year period was 153.74 MWh/month. The energy purchase ranged from a minimum of 22.13 MWh/month to a maximum of 215.16 MWh/month, with an average for the multi-year period of 85.24 MWh/month, while the sale of energy ranged on average from 1.90 MWh/month to a maximum of 40.32 MWh/month, with an average for the multi-year period of 10.30 MWh/month. In the multi-year period, the WWTP’s own energy production covered on average 67% of the demand.
The average monthly biomass at the WWTP (considering a nine-year period) ranged from 4275 mg/L/month to 5483 mg/L/month, with the multi-year average of 4924 mg/L/month. Biogas production varied on average between 86.25 thous. m3/month and 131.97 thous. m3/month (average for the nine-year period of 112.03 thous. m3/month). Additionally, the average monthly composting in the multi-year period was determined at a level of 634.2 mg/month and average discharge of sewage sludge was 251.62 thous. dry matter/month (Appendix A, Table A2).

2.2. Analysed Parameters

A general overview of parameters analysed in this study is shown in Table 1.

2.3. Research Data Handling and Statistical Analysis

Research data for this study include the results of measurements of four polluting substances: ether extract (EE), phenols, chlorides and sulfates. Concentrations of these pollutants in sewage at three treatment stages (i.e., raw sewage, mechanically treated sewage and totally treated sewage) were measured in the accredited laboratory of the WWTP. Sewage samples for testing were collected by the WWTP operator over the period of one calendar year. Over this time, at each of the three treatment stages, both ether extract and phenols were tested 62 times, while both chlorides and sulfates were tested nearly 70 times. Standardized methods were employed to analyse sewage samples. Phenols content was measured using PN-ISO 6439:1994, involving distillation and UV-VIS spectrophotometry. Ether extract (EE) was determined via Soxhlet extraction under PN-EN 14331:2004. Chloride levels were assessed using silver nitrate titration (PN-ISO 9297:1994), while sulfate concentrations were analysed gravimetrically per PN-ISO 9280:2002.
Initial statistical data analysis includes calculations of the basic descriptive statistics for polluting substance concentrations in sewage at the subsequent treatment stages: minimum (Min), average (Avg), maximum (Max), standard deviation (STD), coefficient of variation (CV), kurtosis (Kurt) and skewness (Sk). The interpretation of variability of the substance concentrations expressed by CV coefficient was made based on the following rules: less than 0.25—low variability, between 0.25 and 0.45—average variability, between 0.45 and 1.00—strong variability, more than 1.00—very strong variability.
The analysis referred to the maximum permissible values of pollutant concentrations in sewage specified by the obligatory Polish Regulation [26]: ether extract (i.e., substances extractable with petroleum ether)—50 mg/L, phenols—0.1 mg/L, chlorides—1000 mg/L, sulfates—500 mg/L.
Based on the concentrations of polluting substances in raw sewage and in mechanically treated sewage, the average percentage reduction (ηAvg), along with the standard deviation of percentage reduction (ηSTD) achieved as a result of mechanical treatment was counted. Similarly, based on the concentrations of polluting substances in raw sewage and in totally treated sewage, the percentage reduction (ηAvg), along with the standard deviation of percentage reduction (ηSTD) achieved as a result of the overall mechanical–biological treatment, was determined. For this purpose, Equation (1) was used:
η = [(CrCt)/Cr)] × 100%
where η is percentage reduction of polluting substance (%), Cr is polluting substance concentration in raw sewage (mg/L), and Ct is polluting substance concentration in totally treated sewage (mg/L).

2.4. Data Preparation for Machine Learning

We utilized three main steps in our methodology. First, we categorized the data into three groups: raw sewage, mechanically treated sewage and totally treated sewage. Second, we applied simple statistical methods to present general information and used regression models to demonstrate potential relationships between variables. Finally, in the third step, we employed unsupervised algorithms to analyse relationships between various contaminants, including the ether extract, phenols, chlorides and sulfates. These contaminants significantly challenge sewage treatment, prompting us to apply our methodology for effective solutions. Flex plots were created in JASP version 0.18.3.
Multivariate regression refers to a statistical technique that establishes relationships between multiple data variables. It estimates a linear equation to analyse multiple dependent or outcome variables based on one or more predictor variables over different time points. In our study, we employed a multivariate regression with raw sewage as the dependent variable and mechanically treated sewage and totally treated sewage as independent variables across all four studied groups. Additionally, we conducted ordination multivariate analyses. Principal Component Analysis (PCA), a widely-used tool, aids in dimension reduction by focusing solely on data points, not their labels. PCA summarizes correlated variables into interpretable axes of variation, though it maximizes feature variance without guaranteeing relevance for prediction or dimensionality reduction tasks. A Kaiser–Meyer–Olkin (KMO) value of 0.48 was considered unacceptable, indicating inadequate sampling adequacy for factor analysis. Values above 0.5 are generally acceptable, with values closer to 1.0 indicating higher suitability. Values below 0.5 suggest the dataset may not be suitable for factor analysis [27]. The p-value for sphericity was <0.01, indicating a violation of the sphericity assumption. Given the linear nature of PCA and the nonlinearity of many engineering problems, we utilized Detrended Correspondence Analysis (DCA) for detrending and rescaling, removing arch effects from ordination and enhancing analysis accuracy. PCA serves as a pre-processing step for other machine learning algorithms, such as clustering and classification. By incorporating class information into dimension reduction, DCA maximizes data utilization. We applied PCA and DCA to reveal relationships among groups and associations among chemical elements in raw sewage, mechanically treated sewage and in totally treated sewage. DCA segments the first axis and centres the second axis at 0.0, effectively displaying factors influencing spatial distribution. Bartlett’s test and KMO validated variable contributions in ordination methods. The analysis was done using PaSt software version 4.03.

2.5. Unsupervised k-Means Method for Pollution Analysis in Sewage

Clustering encompasses techniques for identifying observation subgroups within a dataset. Utilizing the Euclidean distance, we used those measurements of ether extract, phenols, chlorides and sulfates, aiming for similarity within the same group and dissimilarity across different groups. As an unsupervised method, clustering seeks relationships between observations without relying on a response variable. We employed unsupervised machine learning algorithms for raw sewage, mechanically treated sewage and totally treated sewage. Clustering enabled us to identify similar observations and potentially categorize them. K-means clustering, a commonly used method, partitioned the dataset into k groups, aiding in group visualization. Silhouette analysis evaluated separation distances between resulting clusters, providing visual insights into the number of clusters. Silhouette coefficients near 1.0 indicate significant separation, while 0.0 suggests proximity to cluster boundaries and negative values imply potential misassignment. Within-Cluster Sum of Squares (WCSS) identified the optimal cluster quantity. The analysis was conducted using PaSt software version 4.03.

2.6. The Assessment of Addition of Polyaluminium Chloride and Commercial Products for Struvite Reduction in Processing

An analysis of the addition of a coagulant—polyaluminium chloride—over a two-year period was conducted to understand trends and seasonal changes in sewage treatment for suspended particles removal. In addition, the usage of a commercial product—Polystabil KWS—was also analysed to understand trends and seasonal changes related to struvite reduction. The data from the same two-year period were compared to assess the increase in the average volume of discharged sewage sludge and the decrease in the consumption of Polystabil KWS per unit volume.
The doses of polyaluminium chloride and Polystabil KWS were adjusted to optimize their consumption, especially in high-demand seasons. The consumption of both products was regularly monitored and laboratory tests were conducted to assess the effectiveness of polyaluminium chloride and Polystabil KWS. Detailed documentation was maintained and regular reports were prepared, which allowed for the identification of trends and a quick response to irregularities.

3. Results

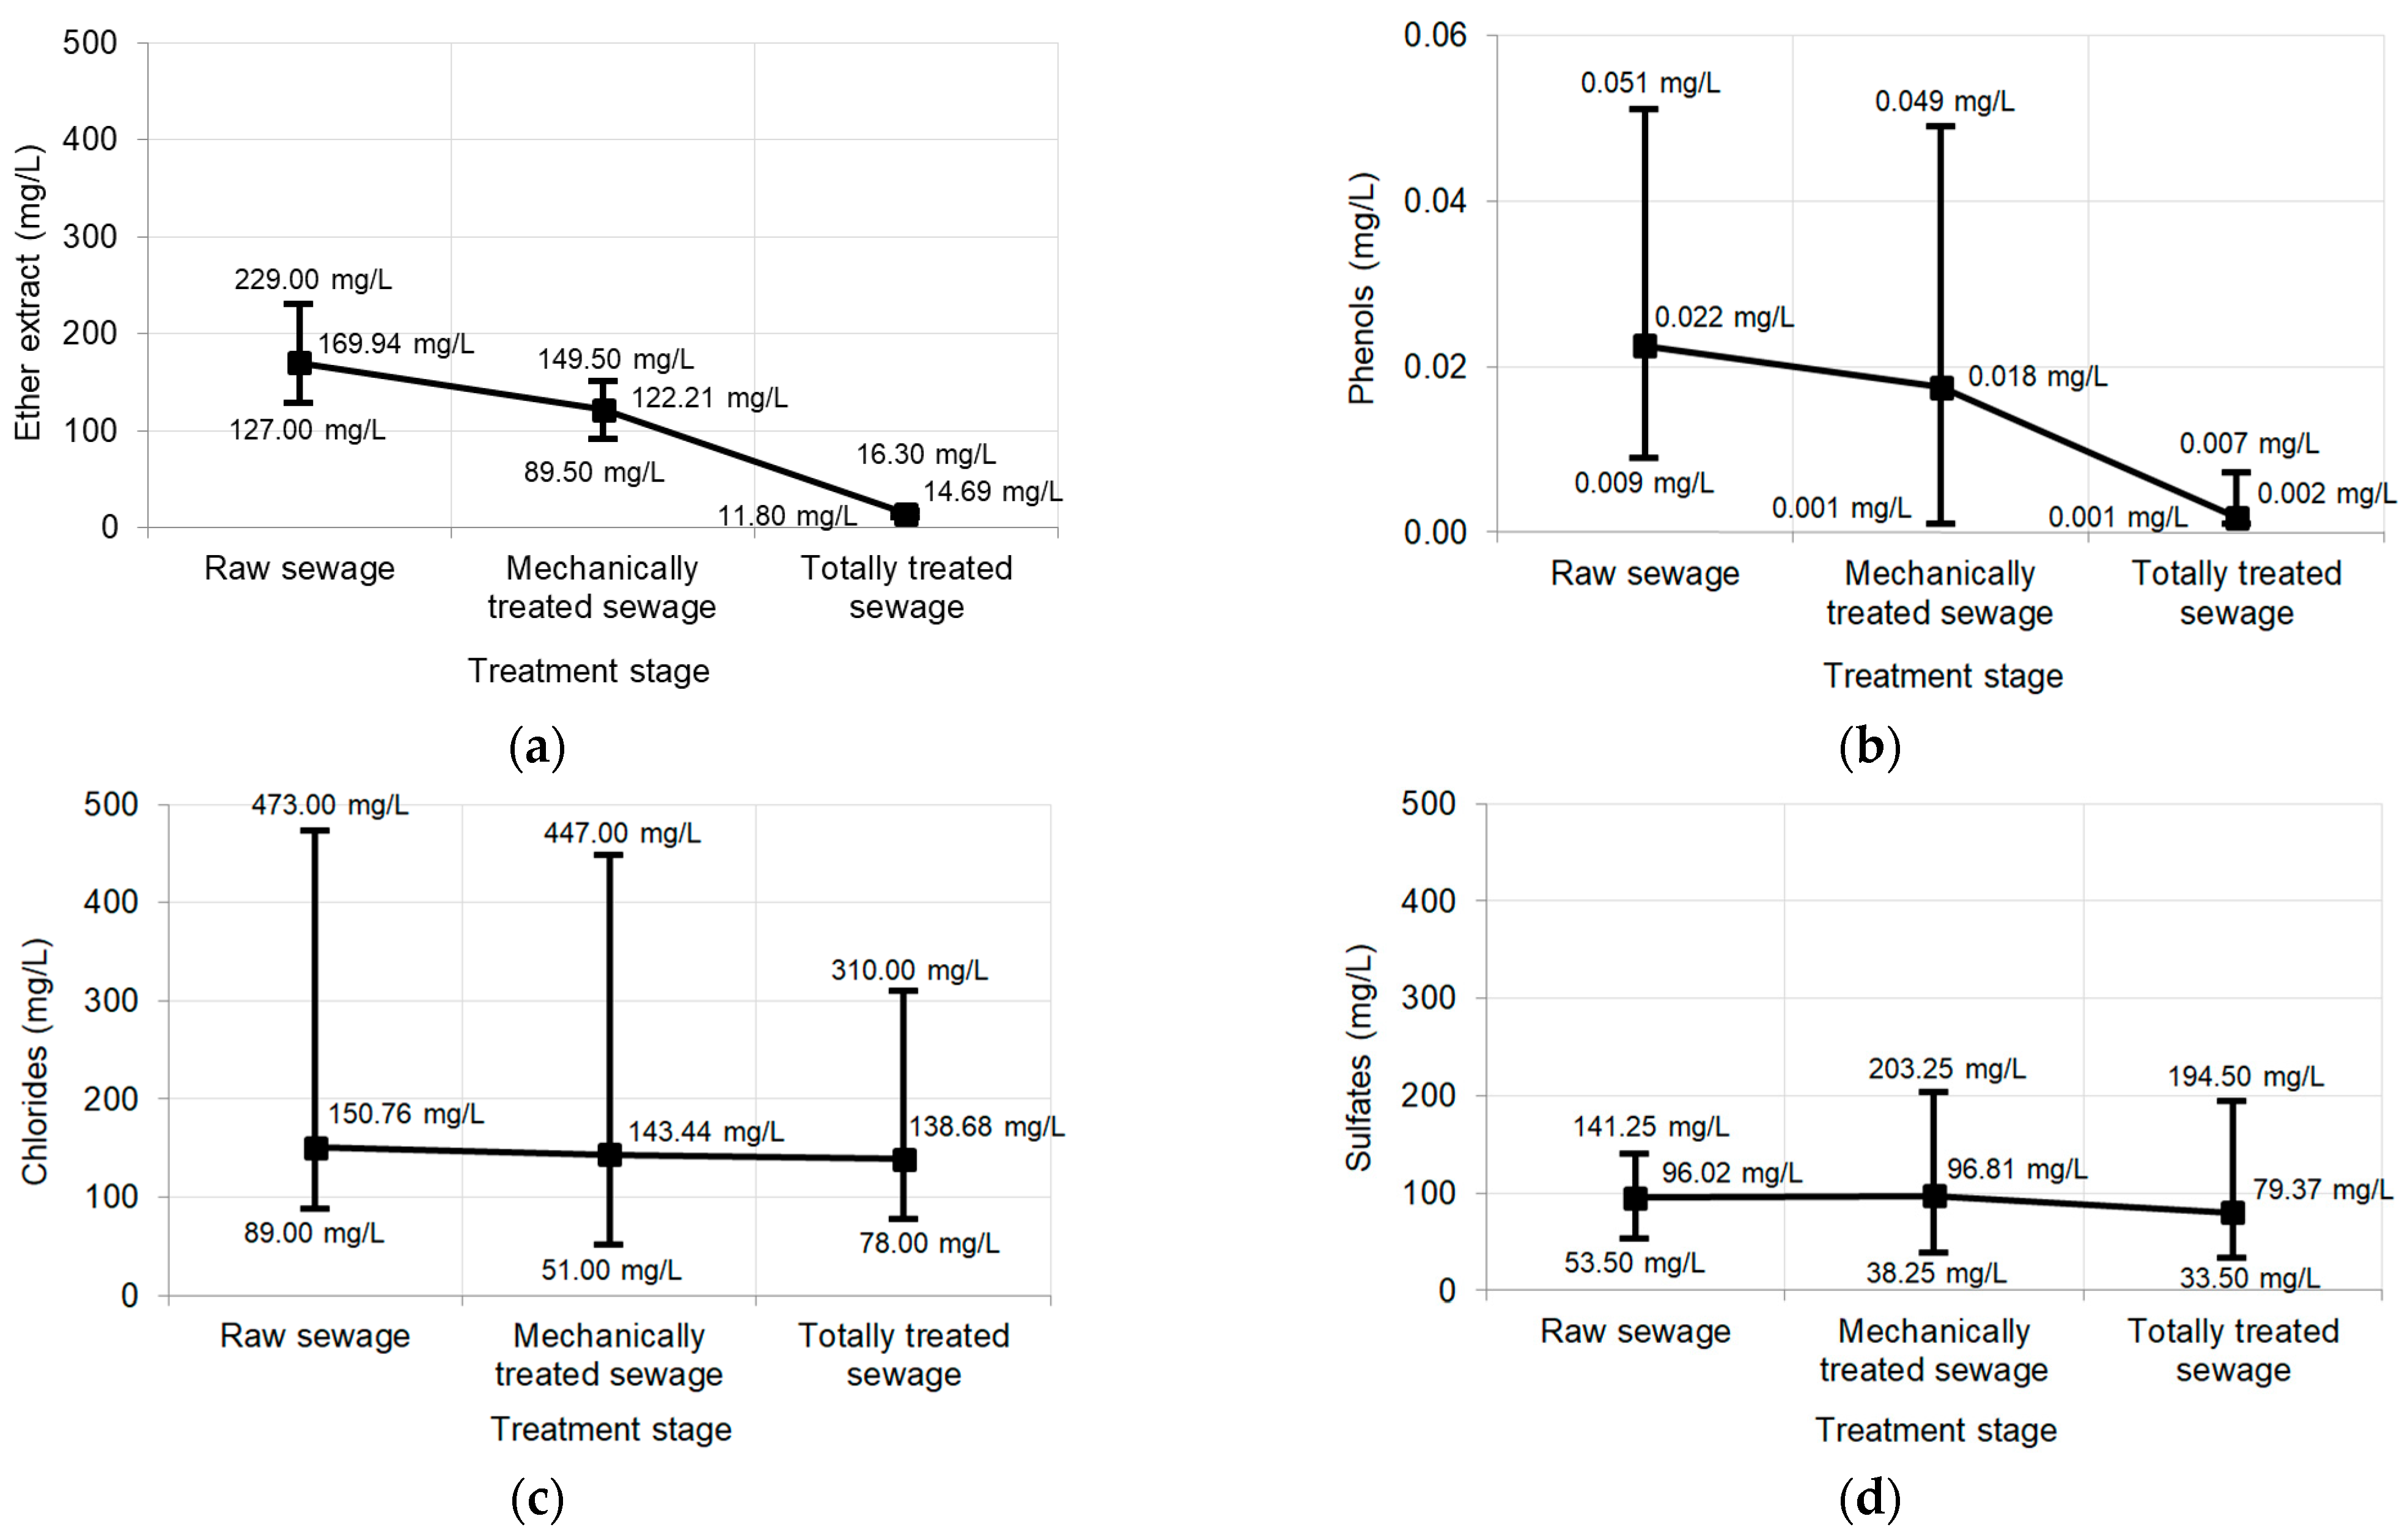
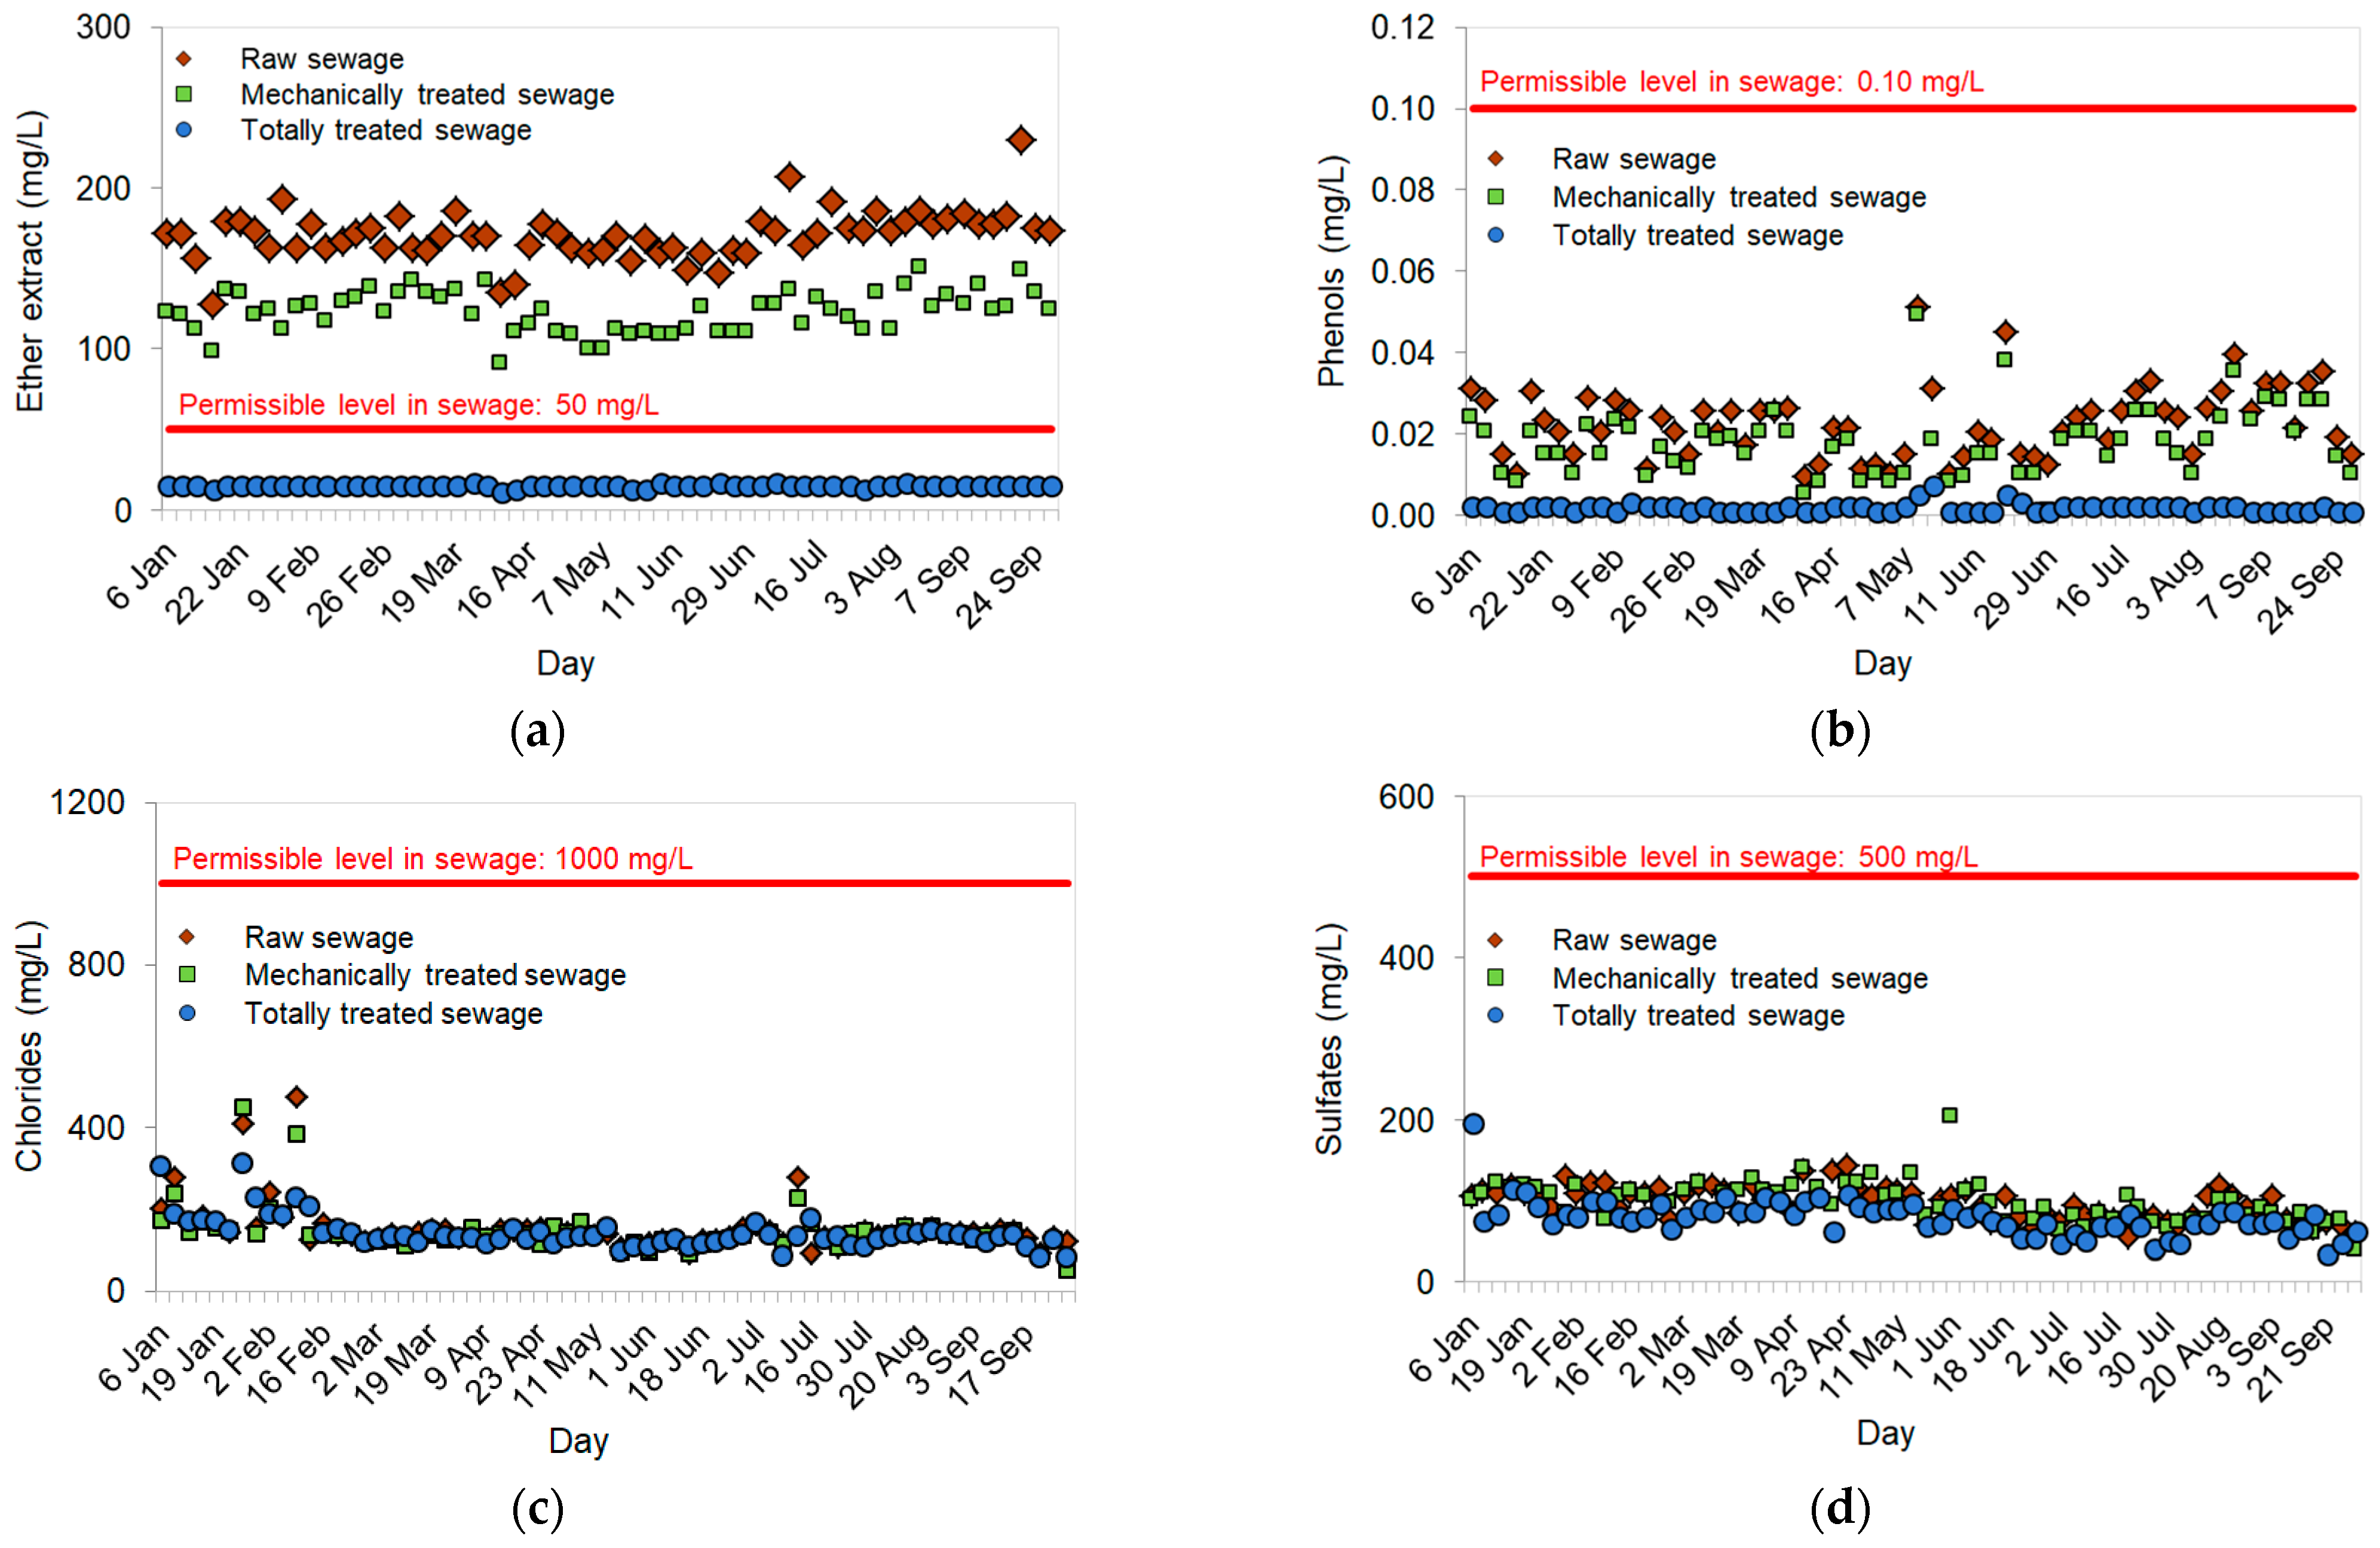
3.1. Concentrations of Pollution in Sewage at the Subsequent Treatment Stages

Among the four tested polluting substances, phenols were in the lowest concentrations (Avg = 0.022 mg/L in raw sewage, Avg = 0.002 mg/L in totally treated sewage). The greatest concentrations in raw sewage were found in case of the ether extract (the average was nearly 170 mg/L), while in totally treated sewage, it was noted for chlorides (the average was nearly 139 mg/L) (Table 2). Based on the calculated values of CV (Table 2), it can be stated that the ether extract was characterized by the lowest variability of concentrations in sewage (low variability; CV = 0.06 ÷ 0.10), while the greatest variability was attributed to the phenols (even strong variability). In turn, the concentrations of sulfates and chlorides were mainly characterized by average variability. Calculations of kurtosis (Kurt) and skewness (Sk) for all substances (Table 2) additionally allowed determining the shape and symmetry of the substances concentrations. The following rules were applied: greater kurtosis—more variables are accumulated around the average; skewness greater than zero—a prevalence of variables below the average; skewness less than zero—a prevalence of variables above the average. For example, based on the calculated skewness (Table 2), it can be stated that in most cases, concentrations of the polluting substances under consideration were below the average concentrations (skewness greater than zero).
The graphs in Figure 2 show that the subsequent treatment stages did not cause a gradual reduction in the concentration of all tested substances. A visible reduction in the concentration through the subsequent treatment stages was observed in the case of the ether extract (Figure 2a) and phenols (Figure 2b). Considering the average concentrations of chlorides (Figure 2c) and sulfates (Figure 2d), these remained at a relatively even level at all three treatment stages. These findings were further developed into the results presented in Table 3. For the calculations of the average percentage reduction (ηAvg) of polluting substances, Equation (1) was used. Mechanical treatment caused a reduction of the ether extract and phenols concentrations averaging, respectively, 28% and 24%. In turn, the total mechanical–biological treatment provided a substantial reduction of over 91% in both of these substances. It was calculated that the standard deviation of the ether extract and phenols percentage reduction (ηSTD) for the total treatment processes was smaller than for mechanical treatment (Table 3). For chlorides and sulfates, not only was there no gradual reduction in concentration as a result of mechanical treatment processes; in a significant part of the tested samples, the noted concentrations of chlorides and sulfates were greater in mechanically treated sewage than in raw sewage. This could have occurred as a result, for example, of the release of substances from solid phase of sewage into the liquid phase of sewage. Because of this, mechanical treatment for chlorides and sulfates disposal was evaluated as not applicable (Table 3). When it comes to the overall mechanical–biological treatment processes, these yielded low reduction levels (ηAvg for chlorides was 13% and for sulfates was 22%), with over 11% standard deviation of the percentage reduction (ηSTD).
As can be seen from Figure 3, in totally treated sewage, concentrations of the analysed pollutants were lower than the maximum permissible levels in sewage as determined by the Polish Regulation [26]. The average concentration of the ether extract was lower than the permissible concentration of 50 mg/L by 70%, phenols (permissible 0.10 mg/L) by 98%, chlorides (permissible 1000 mg/L) and sulfates (permissible 500 mg/dm3) by about 85%. Only for the ether extract were concentrations in raw sewage and in mechanically treated sewage clearly higher than the permissible value of 50 mg/L (Figure 3a).

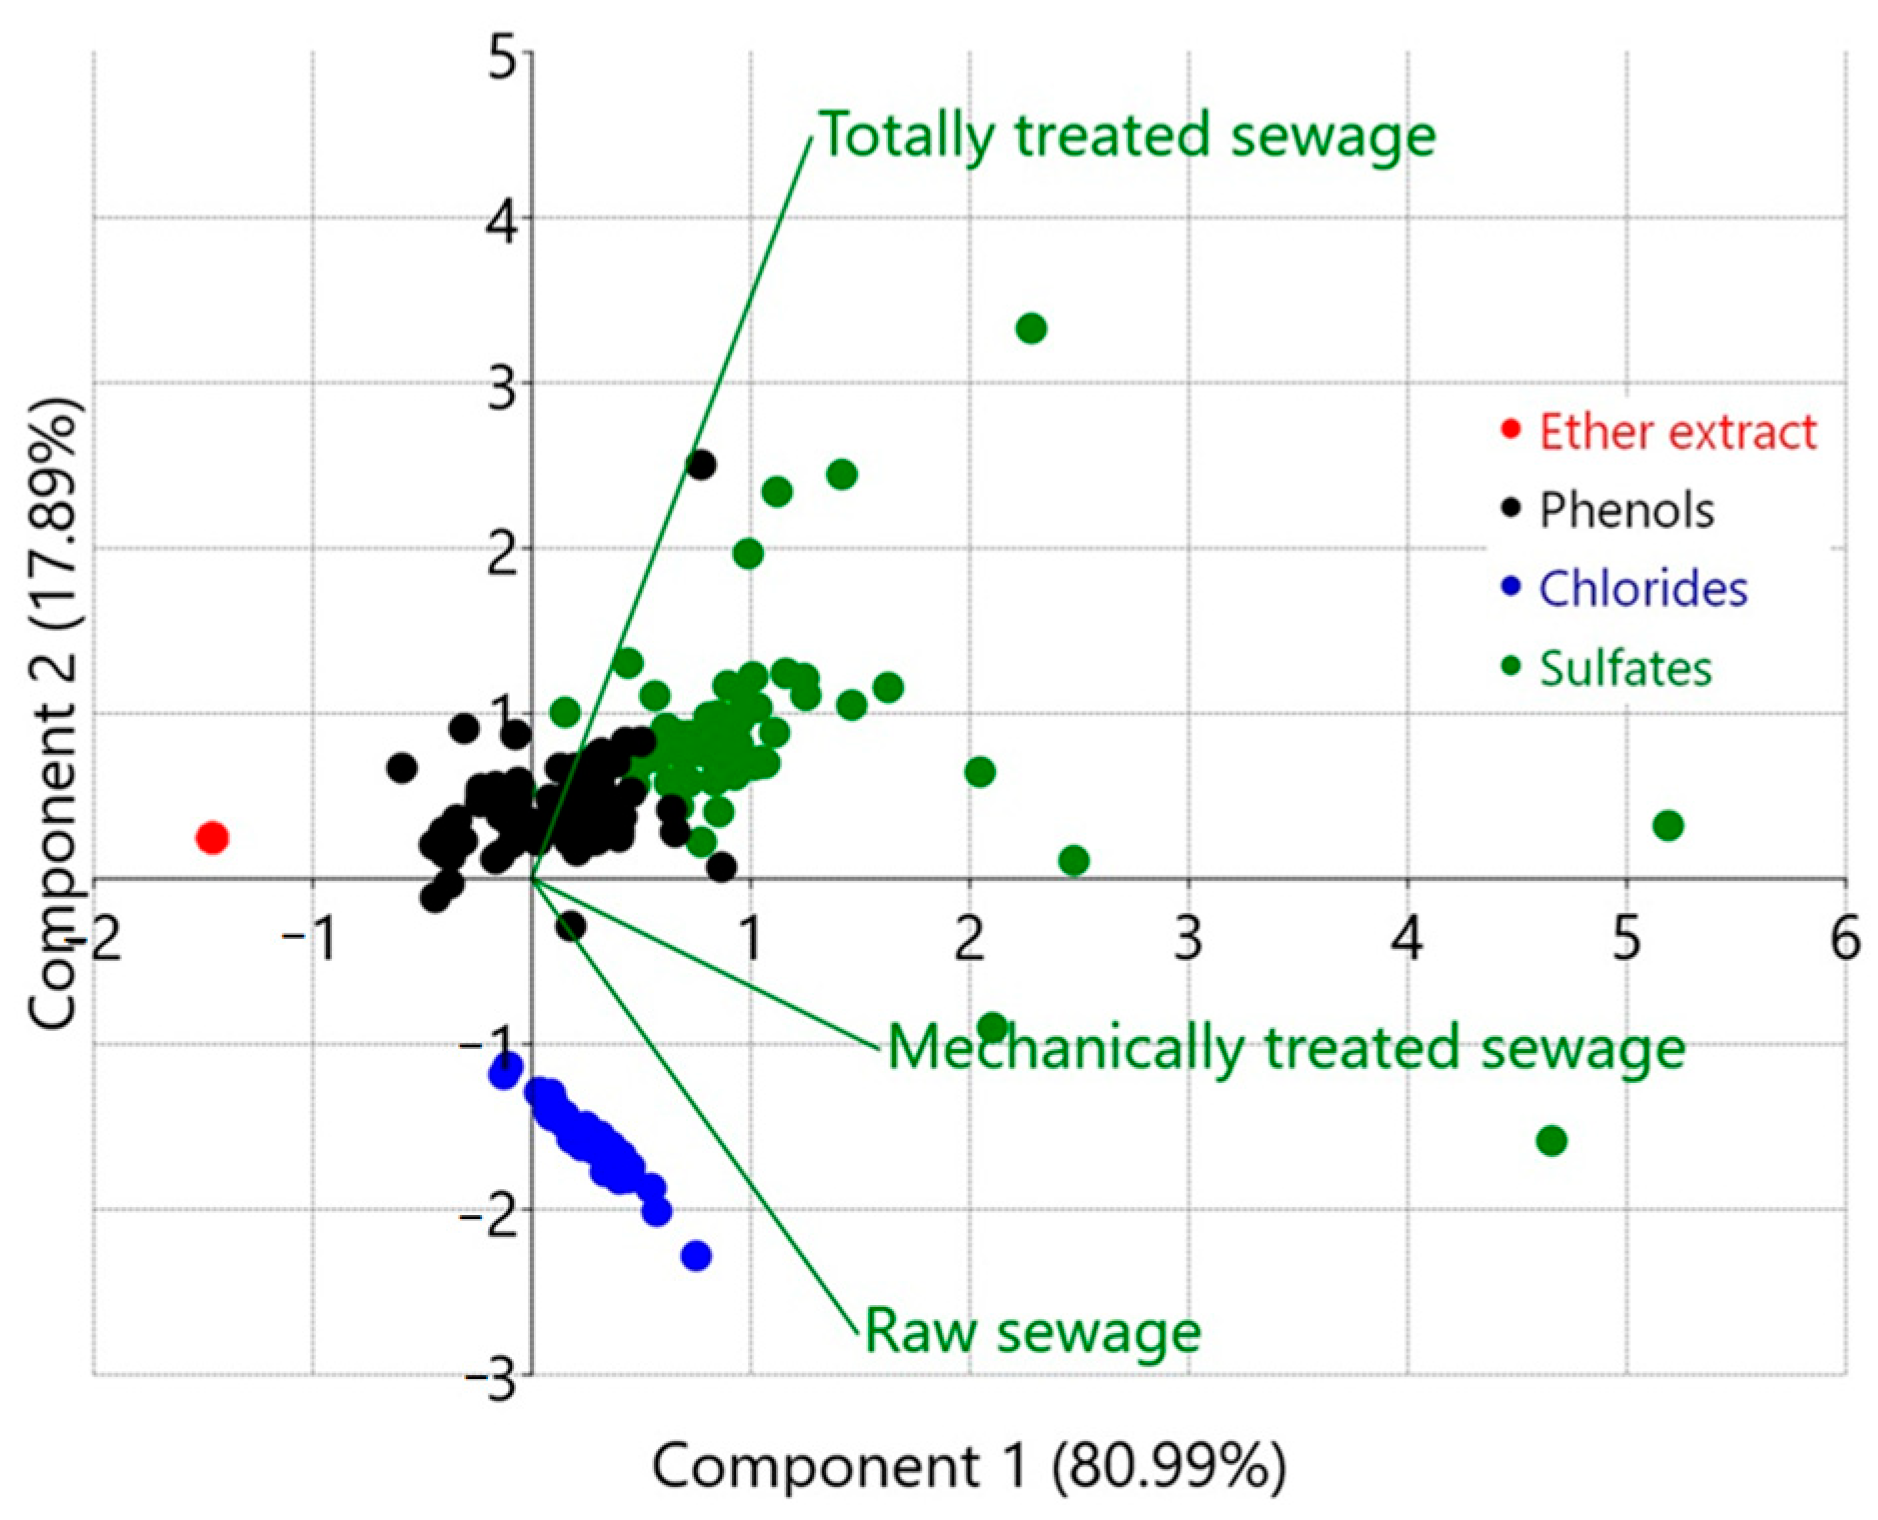
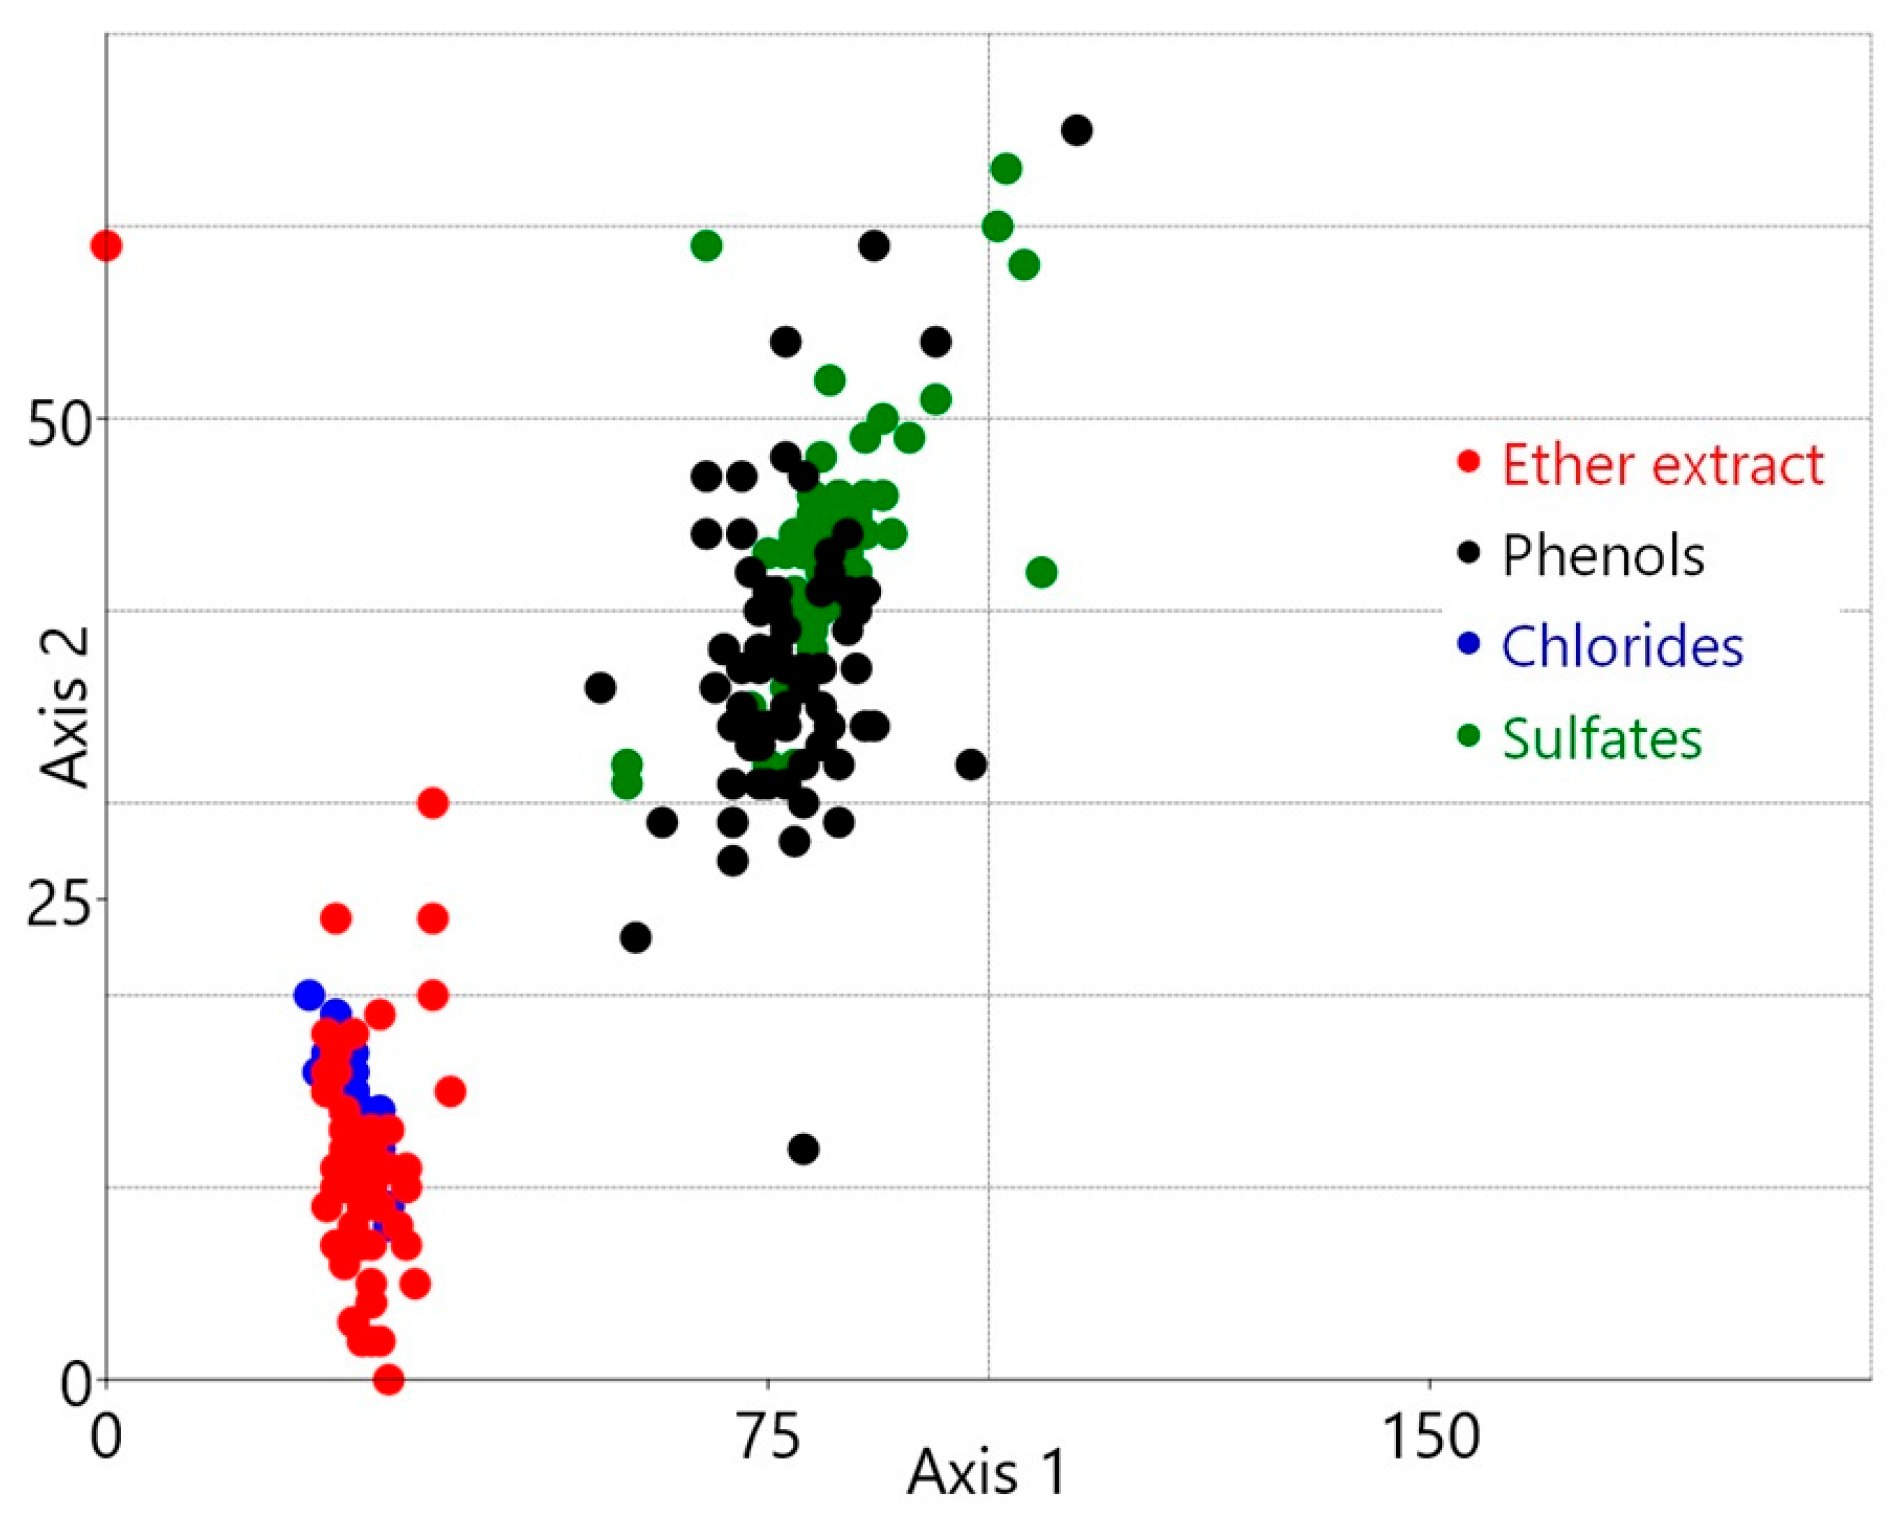
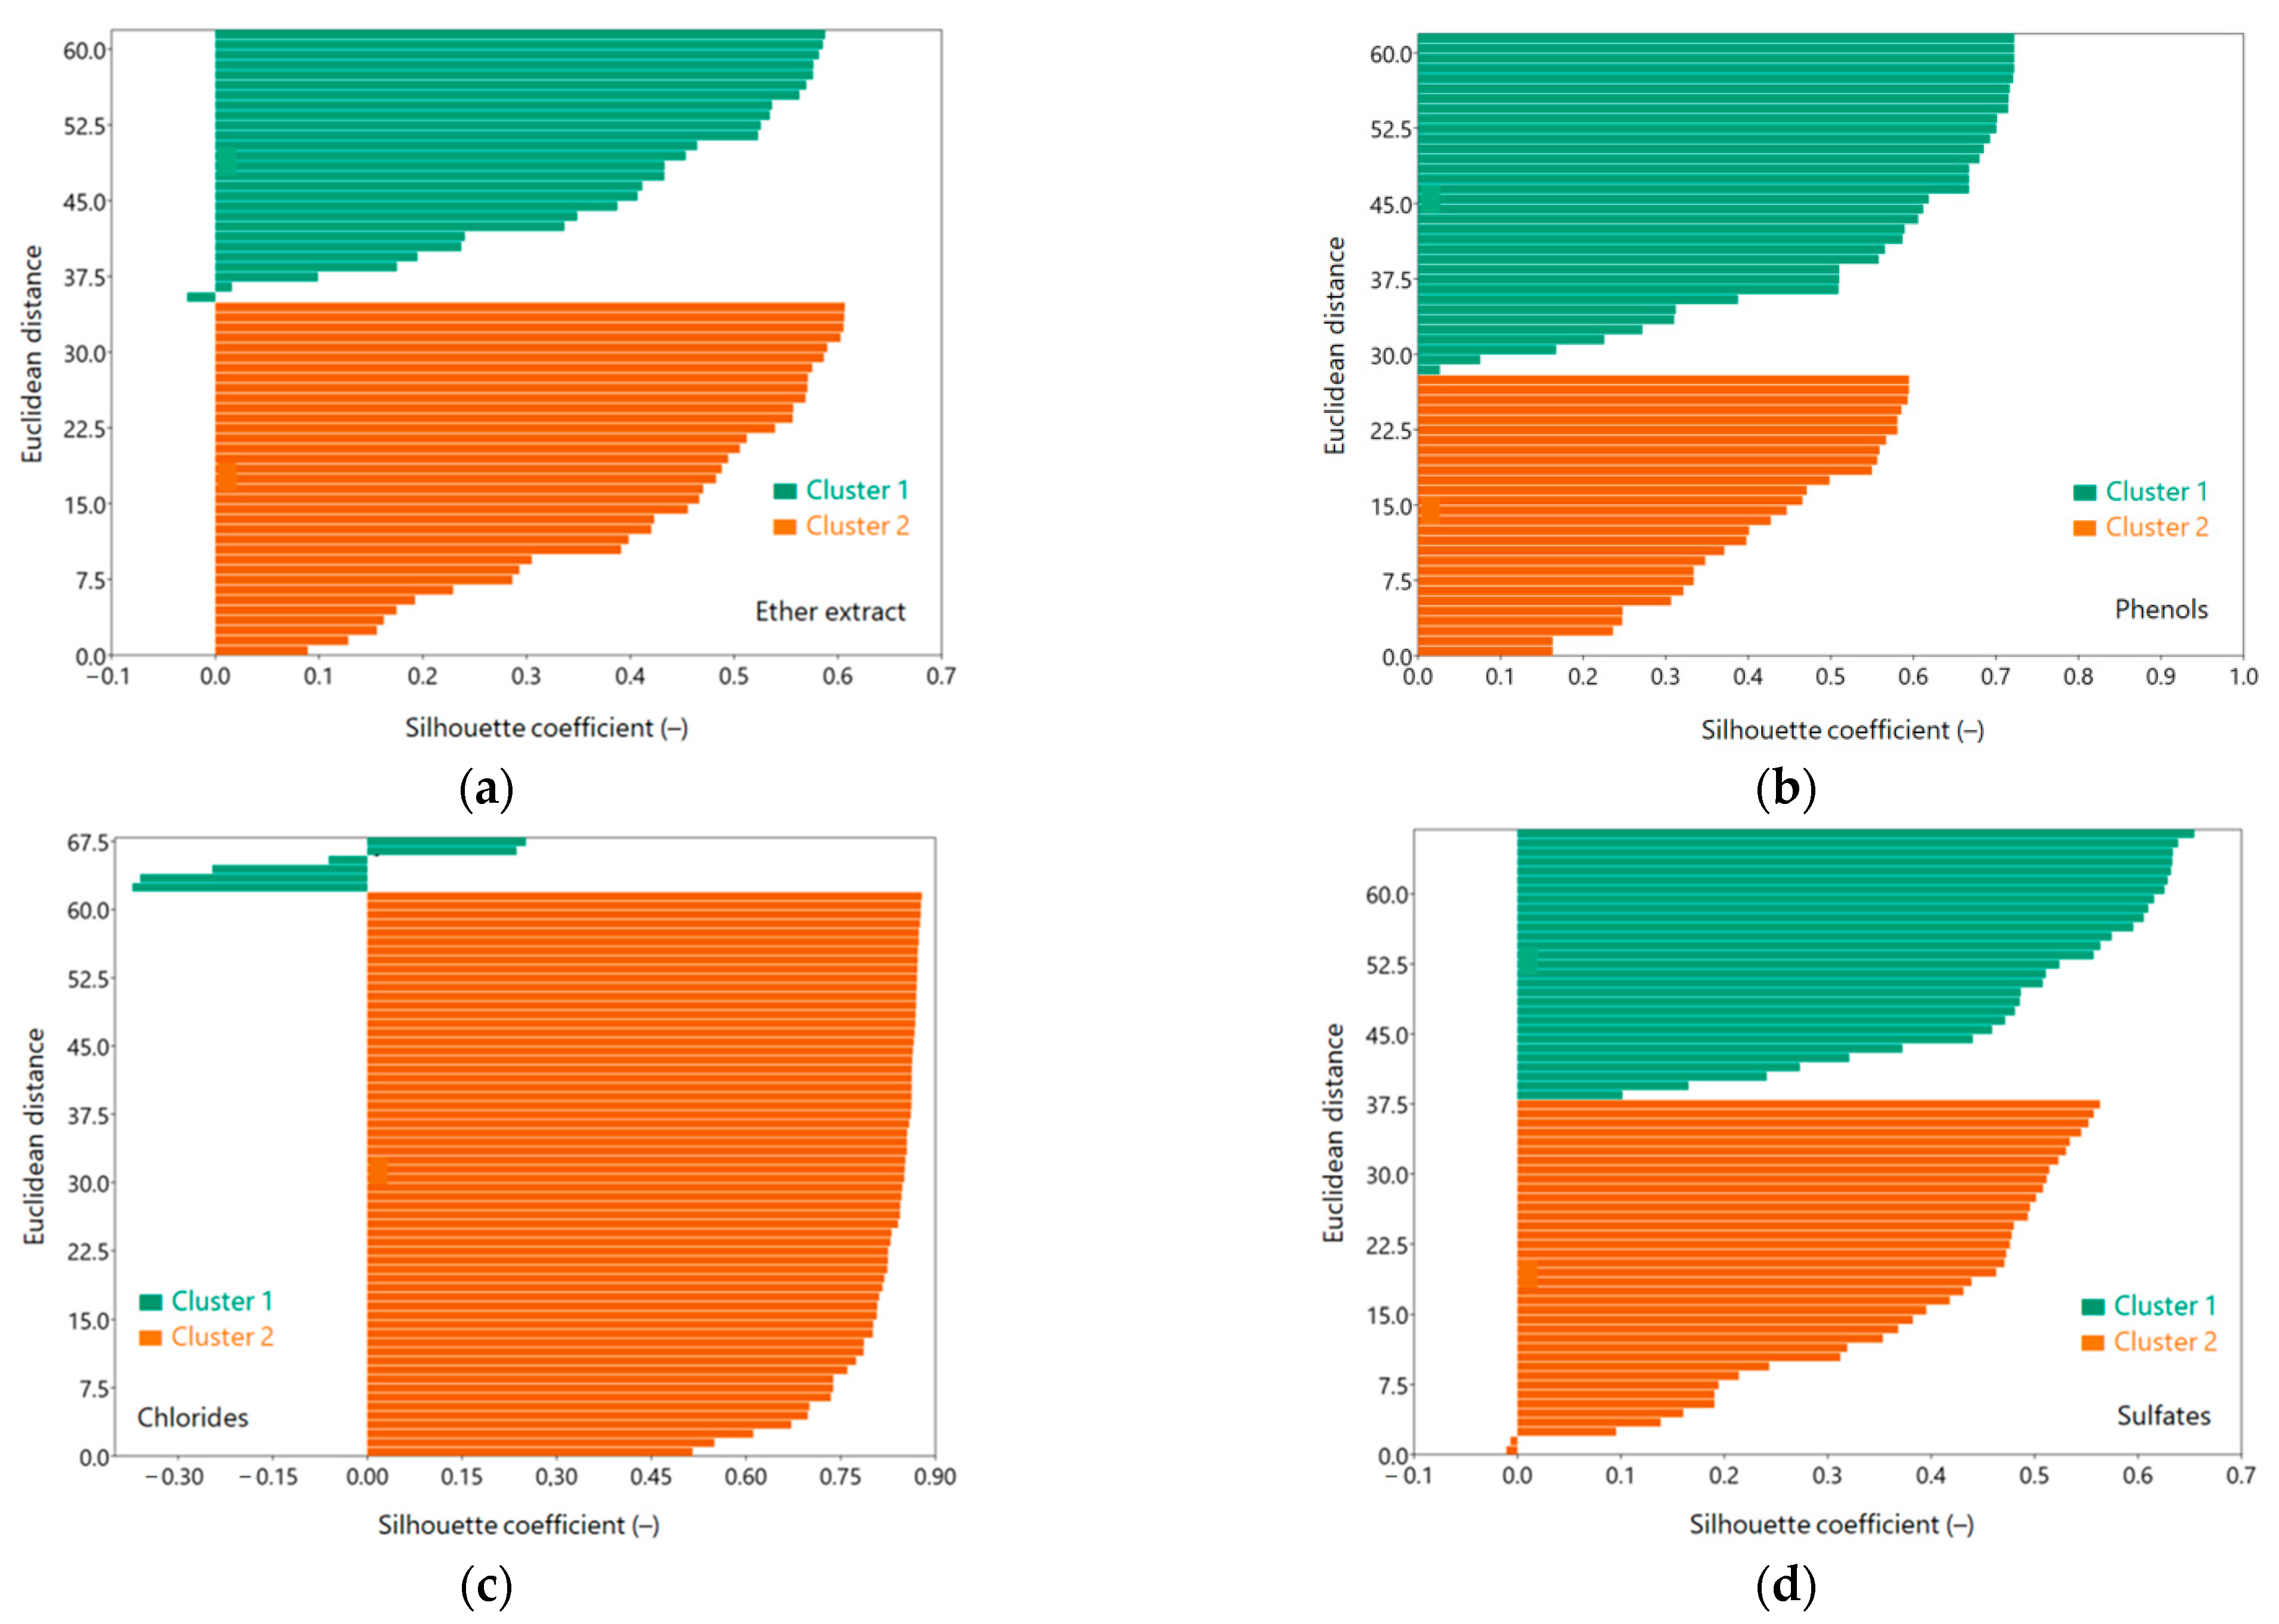
3.2. Selecting Optimal Cluster Number for Sewage Pollution Analysis

Multivariate regression analysis (Table 4a) further elucidated the disparities between sewage from different treatment stages. A statistically significant difference was found between raw sewage and mechanically treated sewage, with a high R2 value of 0.88 indicating a strong relationship (Table 4b).
A Principal Component Analysis (PCA) was conducted to discern underlying patterns among various types of polluting substances in sewage. The analysis revealed correlations between the ether extract and phenols, while chlorides and sulfates exhibited close proximity. The scatter plot in Figure 4 depicts the results of sewage analysis. The plot’s axes represent two principal components: Component 1 (80.99%) on the x-axis and Component 2 (17.89%) on the y-axis. The plot reveals distinct clusters, with the ether extract spreading out significantly along Component 2, suggesting substantial variance in this compound compared to others. Phenols and sulfates cluster more tightly near the origin, indicating that they share similar characteristics. Chlorides are also distinct, with some spread along both substances. The Kaiser–Meyer–Olkin (KMO) measure was 0.48172, which was considered unacceptable for factor analysis.
The Detrended Correspondence Analysis (DCA) plot (Figure 5) showed the relationships between sewage pollutants. The distances between points on the plot reflect the similarity or dissimilarity of the sewage pollutants. Points closer together share more similar properties, while points farther apart have more distinct differences. This is measured using Bray–Curtis distance, a metric that quantifies the dissimilarity between two samples based on the presence and abundance of various substances. The ether extract varied across samples; phenols clustered together, indicating similar properties; chlorides also formed a distinct group, while sulfates either spread out or clustered, highlighting their variability.
Distinct clustering and dispersion patterns were observed for the ether extract, phenols, chlorides and sulfates. Phenols were related to sulfates, while ether extract aligned closely with chlorides. Figure 5 highlights the unique and shared properties of these substances within the sewage samples. This analysis helps in identifying key trends and outliers, which can guide further research or inform management strategies in sewage treatment and water quality monitoring. Grasping the variability and consistency of sewage pollutant substances is important for targeted interventions and better treatment processes. Variability in the ether extract levels might need more investigation, while the consistent behaviour of phenols and chlorides suggests predictable patterns for more efficient methods.
The dataset in Figure 6a consists of the ether extract data analysed using a clustering method. The analysis yielded the following metrics: an average Silhouette width of 0.4184, a Within-Cluster Sum of Squares (WCSS) of 12.564, an F-statistic of 0.96961 and a variance explained of 49.23%.
The Silhouette plot for phenols (Figure 6b) revealed two distinct clusters (Cluster 1 and Cluster 2) with varying degrees of internal cohesion. Cluster 1 exhibited consistently higher Silhouette coefficients, indicating strong intra-cluster similarity. Cluster 2 showed lower Silhouette coefficients, suggesting weaker internal cohesion and potential overlap with other clusters. A clustering analysis for phenols yielded the following metrics: an average Silhouette width of 0.49331, a Within-Cluster Sum of Squares of 0.0036858, an F-statistic of 1.3887 and a variance explained of 58.14%.
For chlorides (Figure 6c), the average Silhouette coefficient was 0.738, indicating strong cluster cohesion and good separation. Two clusters were identified. Cluster 2 was larger with a broad range of Silhouette scores, while Cluster 1 had lower Silhouette values, suggesting less cohesion. An F-statistic of 1.42 and variance explained (58.65%) suggest that while the clusters capture a significant portion of variability, there may be room for improvement by testing other numbers of clusters or adjusting the clustering algorithm.
In the case of sulfates (Figure 6d), Cluster 1 had higher Silhouette coefficients, indicating strong cohesion and separation. Cluster 2 had more variation in Silhouette values, with some points close to 0 or negative, suggesting less cohesion. Overall, the clustering with k = 2 was reasonable, but Cluster 2 may need further exploration. WCSS was 51.268, F-statistic was 0.963, variance explained was 49.06% and the average Silhouette coefficient was 0.431.

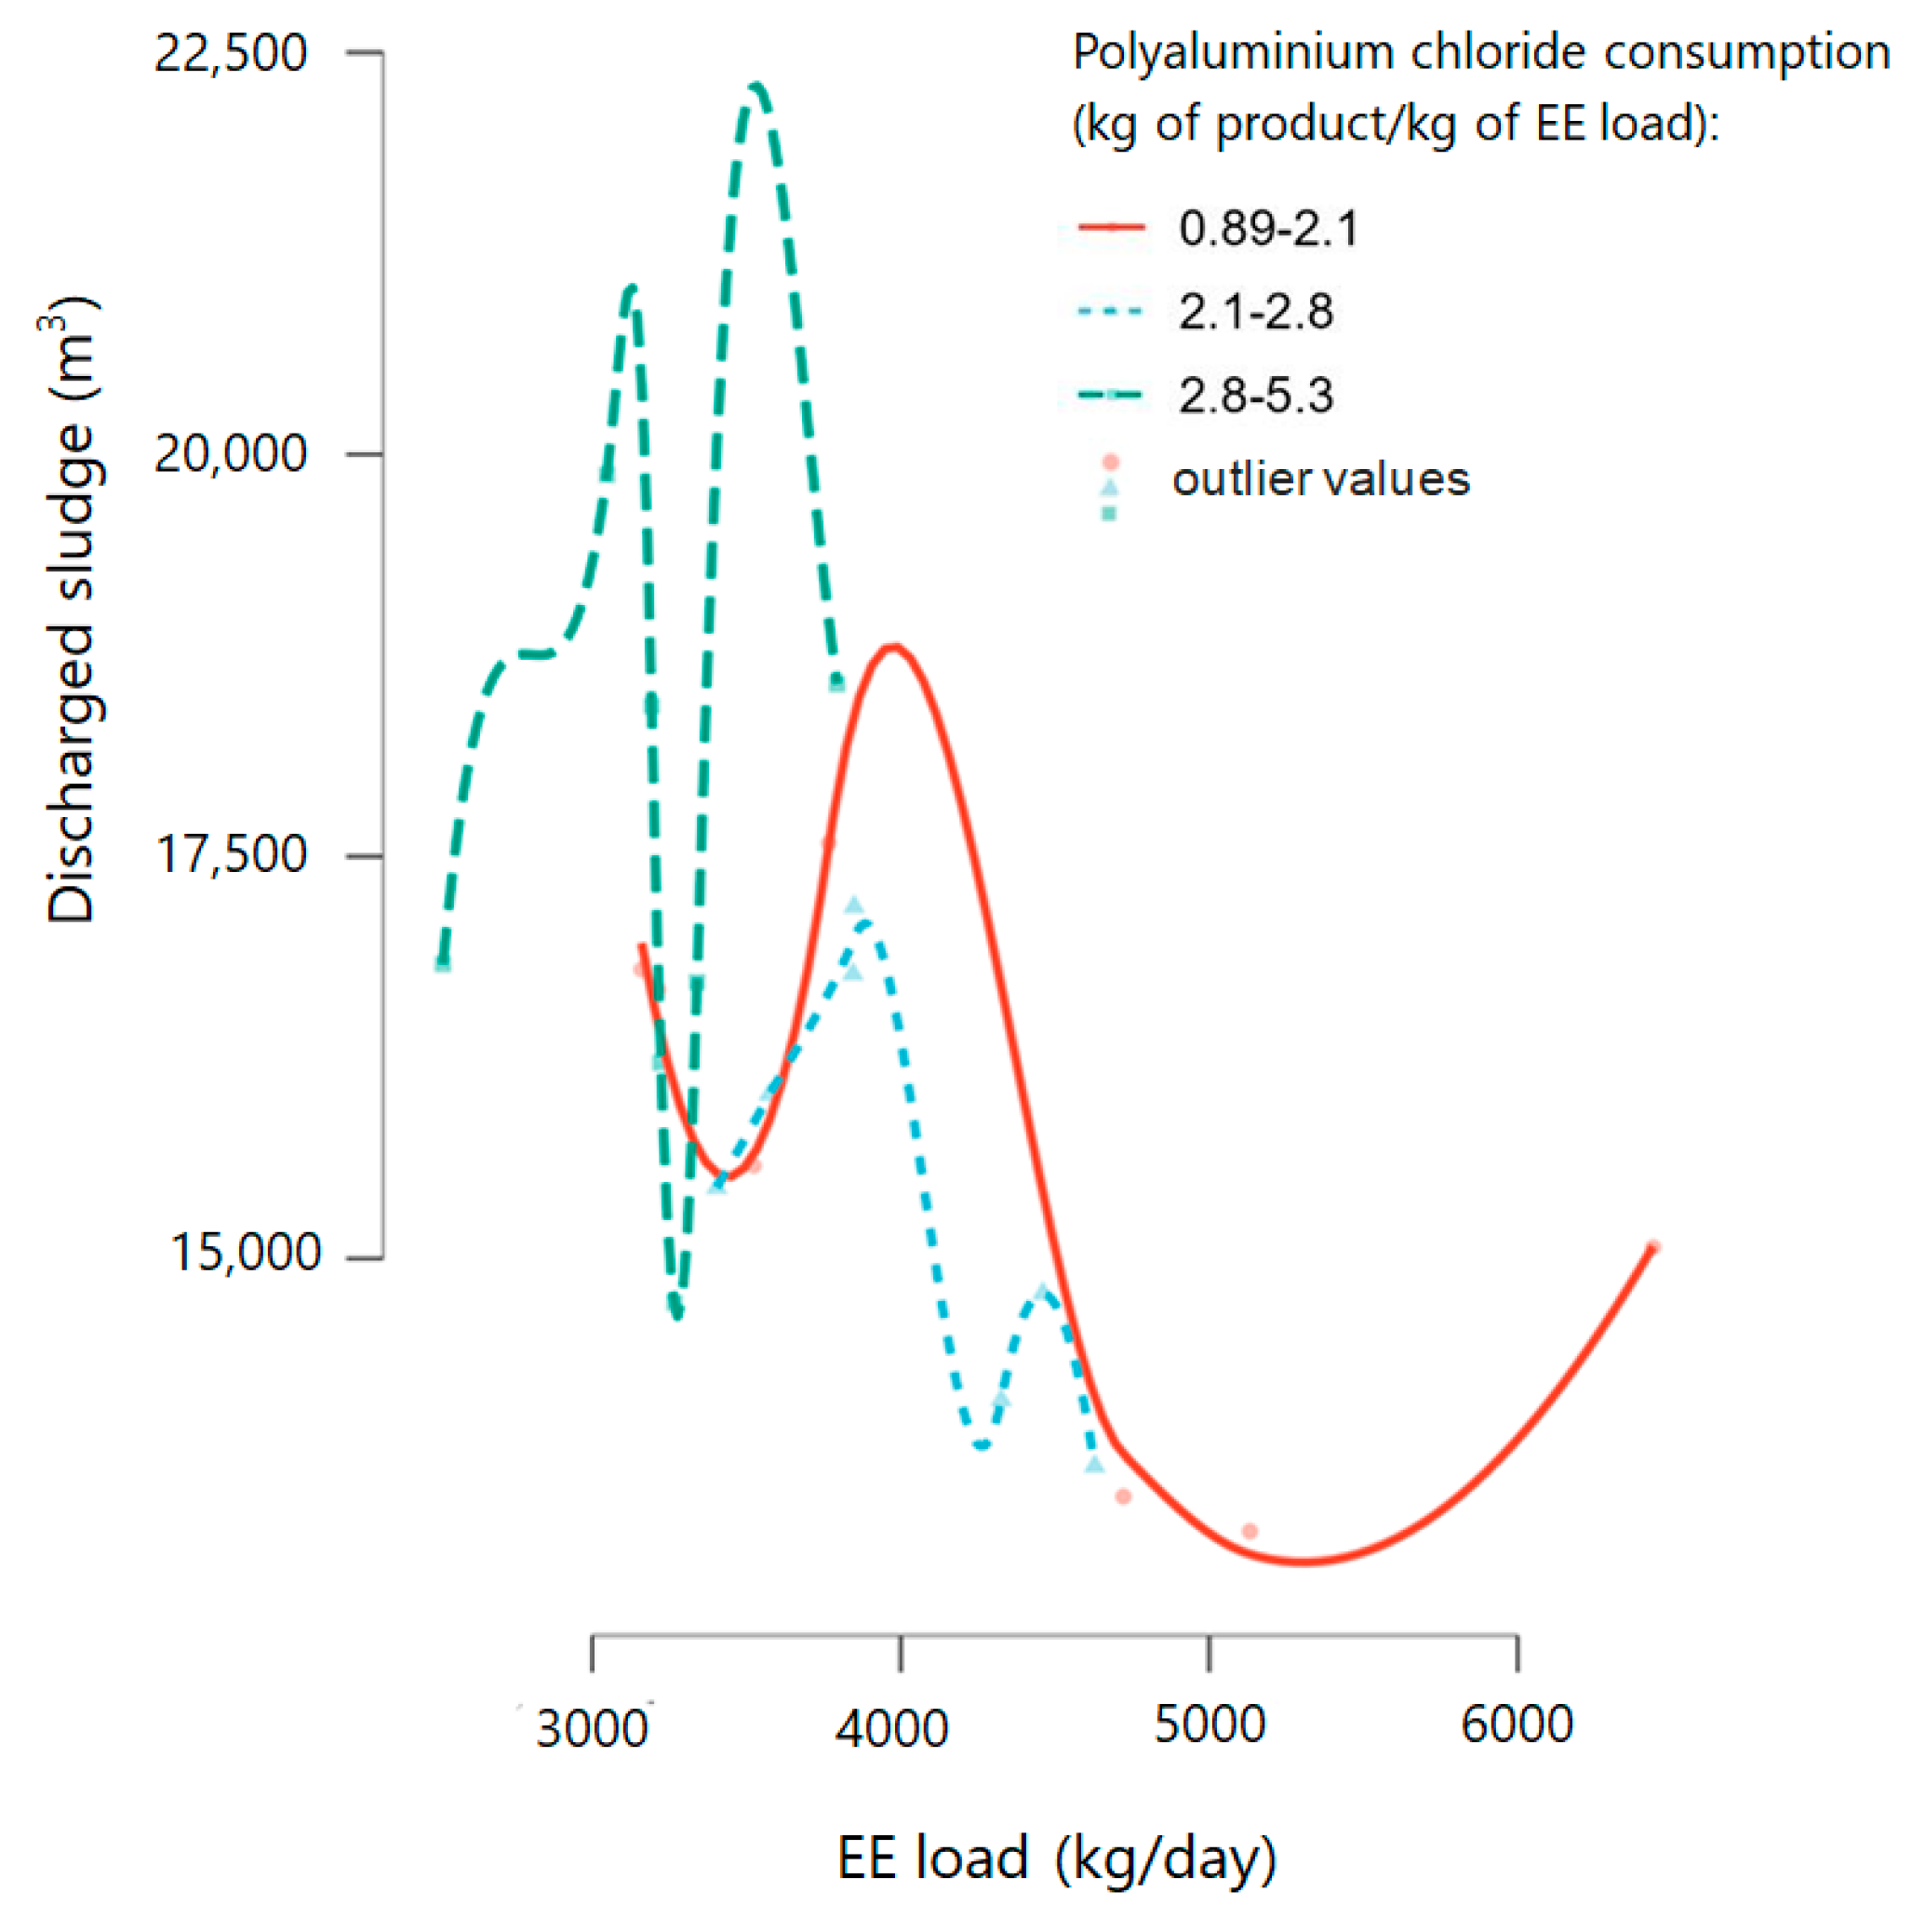
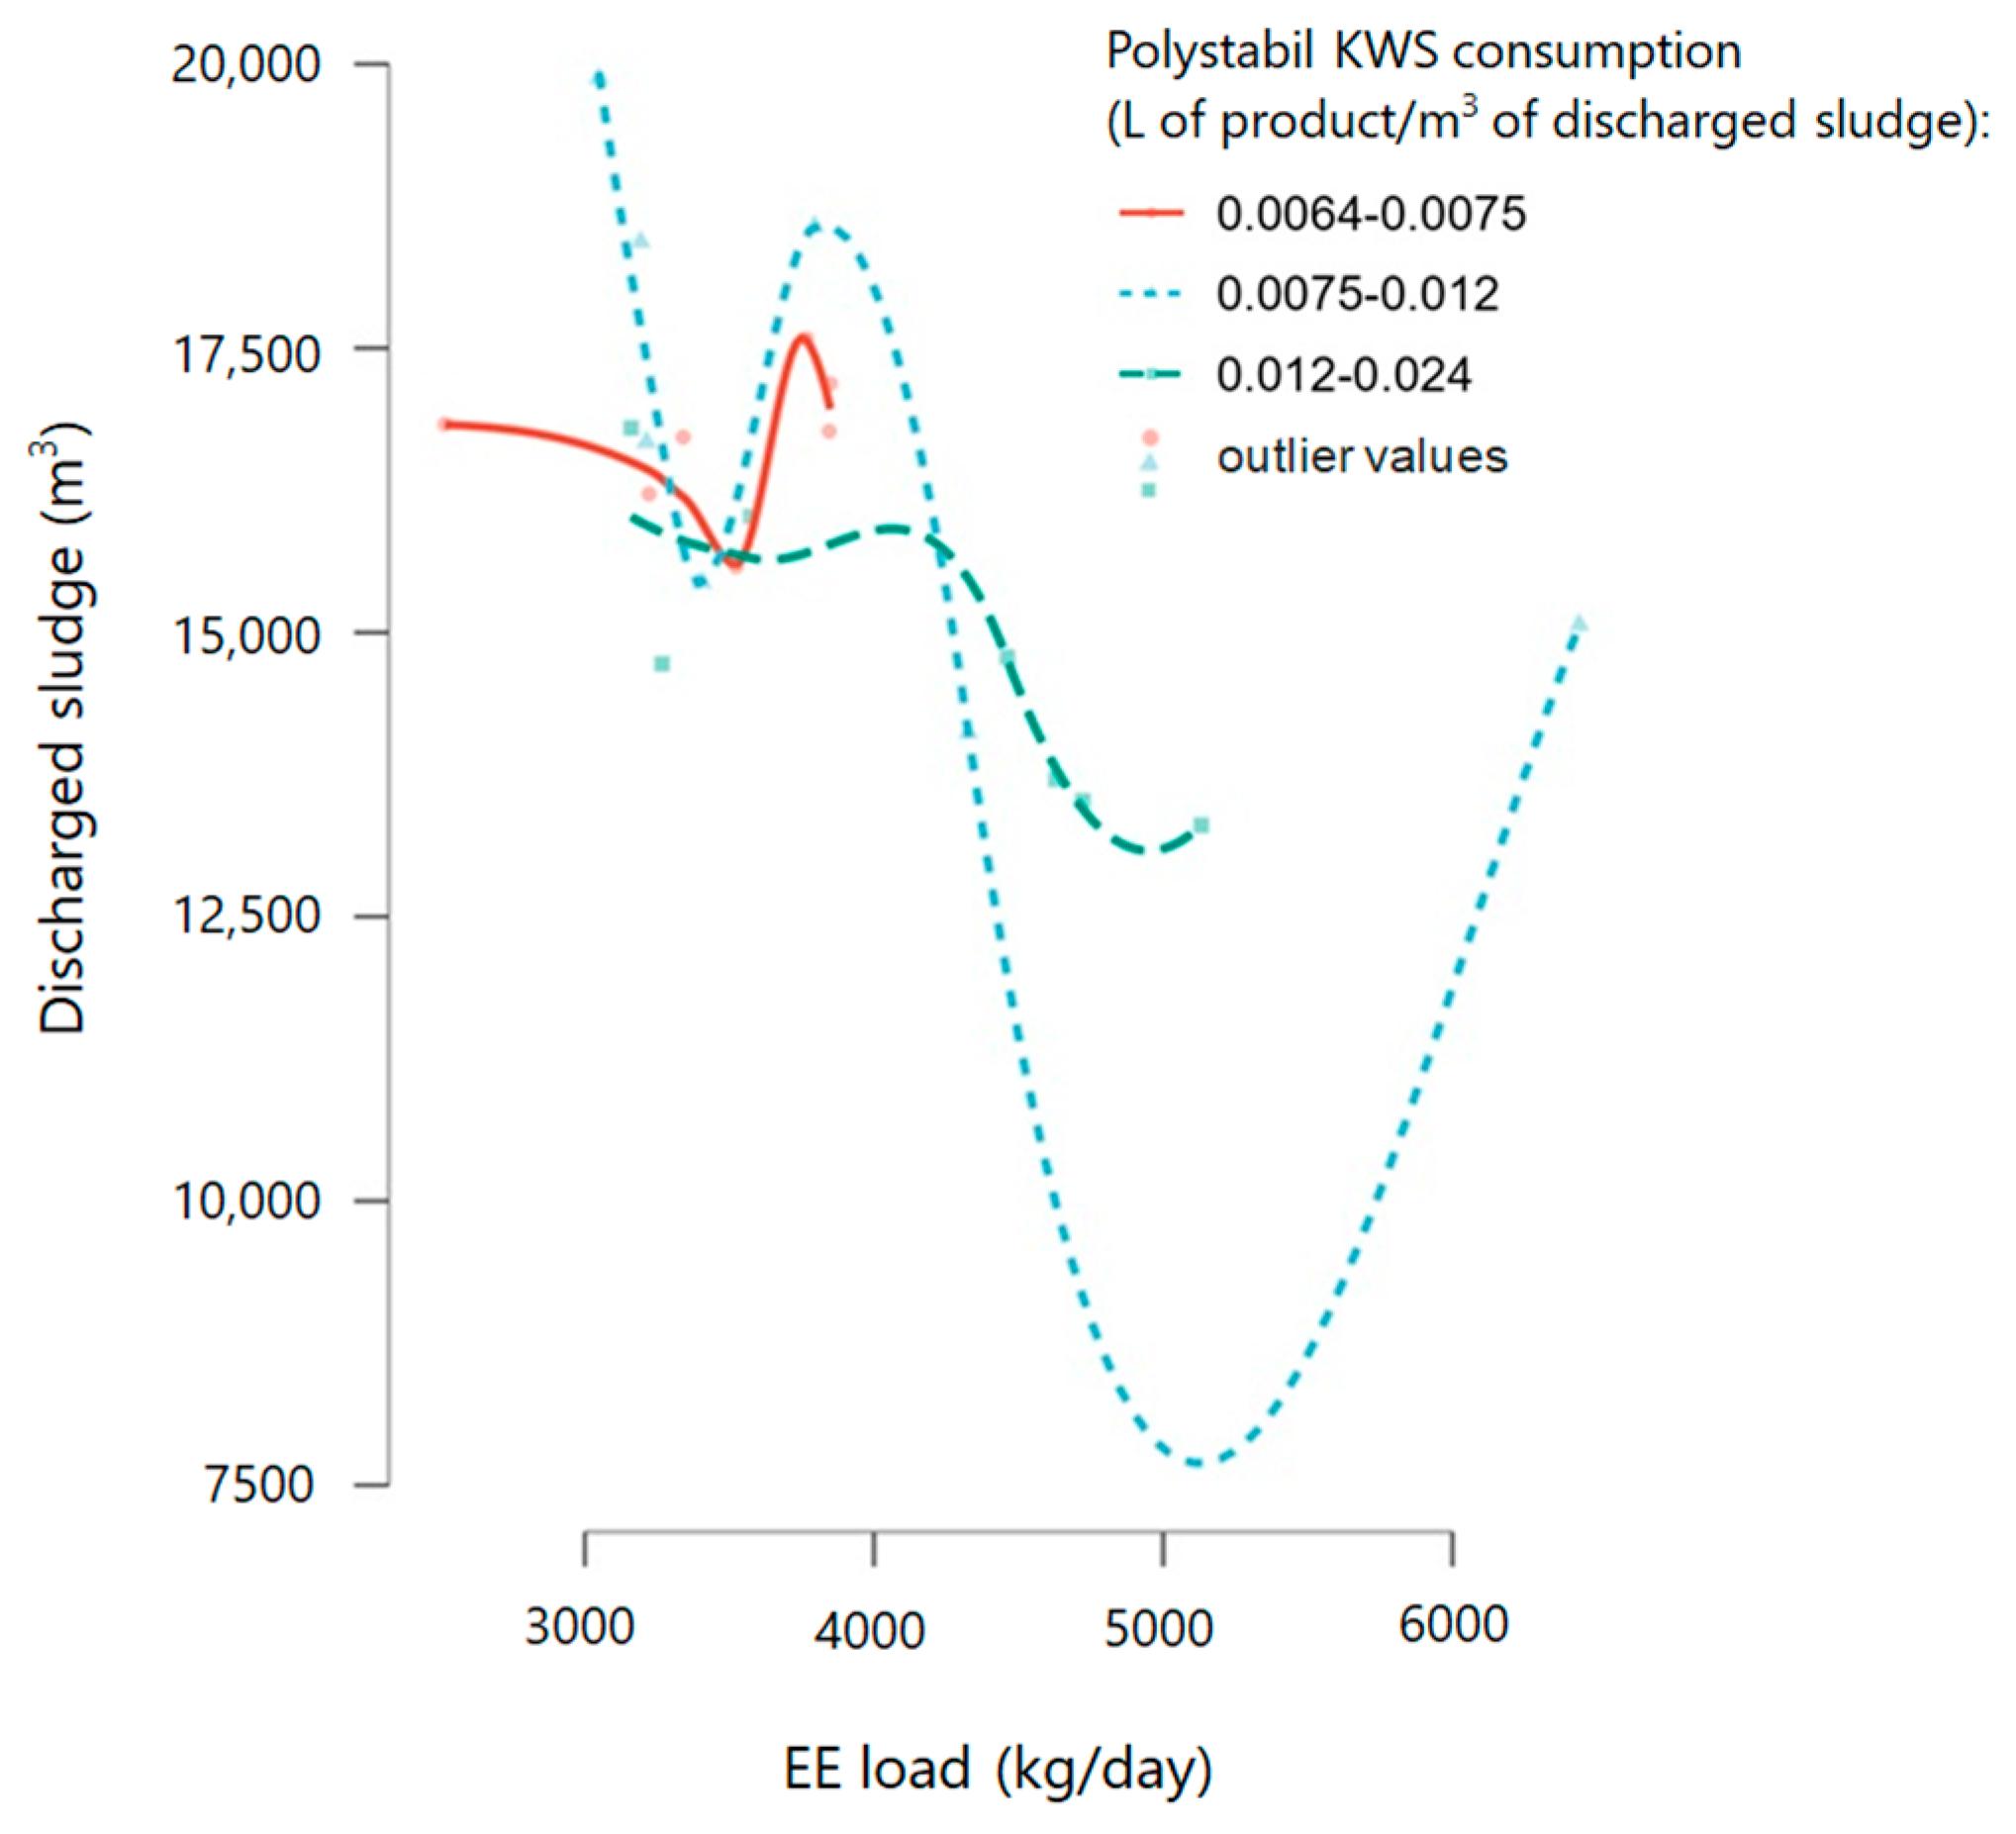
3.3. Technological Process Improvement Through Polyaluminium Chloride Addition and Struvite Reduction

The graph in Figure 7 shows the relationship between the ether extract (EE) load in raw sewage and the volume of discharged sewage. Three lines in Figure 7 represent different ranges of coagulant (polyaluminium chloride) consumption: a solid red line for polyaluminium chloride consumption between 0.89 and 2.1 kg of product/kg of EE load, a dashed blue line for polyaluminium chloride consumption between 2.1 and 2.8 kg of product/kg of EE load and a dashed green line for polyaluminium chloride consumption between 2.8 and 5.3 kg of product/kg of EE load. The flexplot shows a clear positive correlation between the ether extract load and the volume of discharged sewage.
Supplementary data for the above analysis are presented in Appendix B (Table A3). In year H, the average monthly polyaluminium chloride consumption was 8950 kg of product/month, with the EE load in raw sewage being 4096 kg/day. In the following year, the average monthly coagulant consumption increased to 9540 kg of product/month, with the EE load being 3475 kg of product/day. Polyaluminium chloride consumption per kg of the EE load rose from 2.185 kg of product to 2.745 kg of product.
The values of discharged sewage in Figure 8 vary depending on the ether extract (EE) load in raw sewage and the consumption of commercial product—Polystabil KWS for struvite reduction. The flexplot in Figure 8 shows a positive relationship between the ether extract load and the volume of discharged sewage sludge. As the ether extract load increases, so does the volume of discharged sewage. This relationship is illustrated through three lines representing different ranges of Polystabil KWS consumption: a solid red line (0.0064–0.0075 L of product/m3 of discharged sewage), a dashed light blue line (0.0075–0.012 L of product/m3 of discharged sewage) and a dashed green line (0.012–0.024 L of product/m3 of discharged sewage).
Additionally, in Appendix B (Table A4), the average values of Polystabil KWS addition as a struvite reduction measure are presented. The analysis yielded the following results: In year H, the average monthly volume of discharged sewage was 15,050 m3/month, the Polystabil KWS consumption was 188 L of product/month and the Polystabil KWS consumption per m3 of discharged sewage was 0.0125 L of product. In year I, the average monthly volume of discharged sewage was 17,482 m3/month, the average monthly Polystabil KWS consumption was 154 L of product/month and the Polystabil KWS consumption per m3 of discharged sewage was 0.0088 L of product.
Based on Table 5, a moderate positive correlation (Spearman’s correlation) was observed between the volume of discharged sewage sludge and the polyaluminium chloride consumption (p-value < 0.05). Conversely, the ether extract load showed a moderate negative correlation with polyaluminium chloride consumption and a strong negative correlation with the volume of discharged sewage sludge. Both correlations were statistically significant, with the latter being highly significant (p-value < 0.01). Additionally, Polystabil KWS consumption exhibited a strong negative correlation with the volume of discharged sewage sludge (p-value < 0.01) and a non-significant moderate negative correlation with polyaluminium chloride consumption.

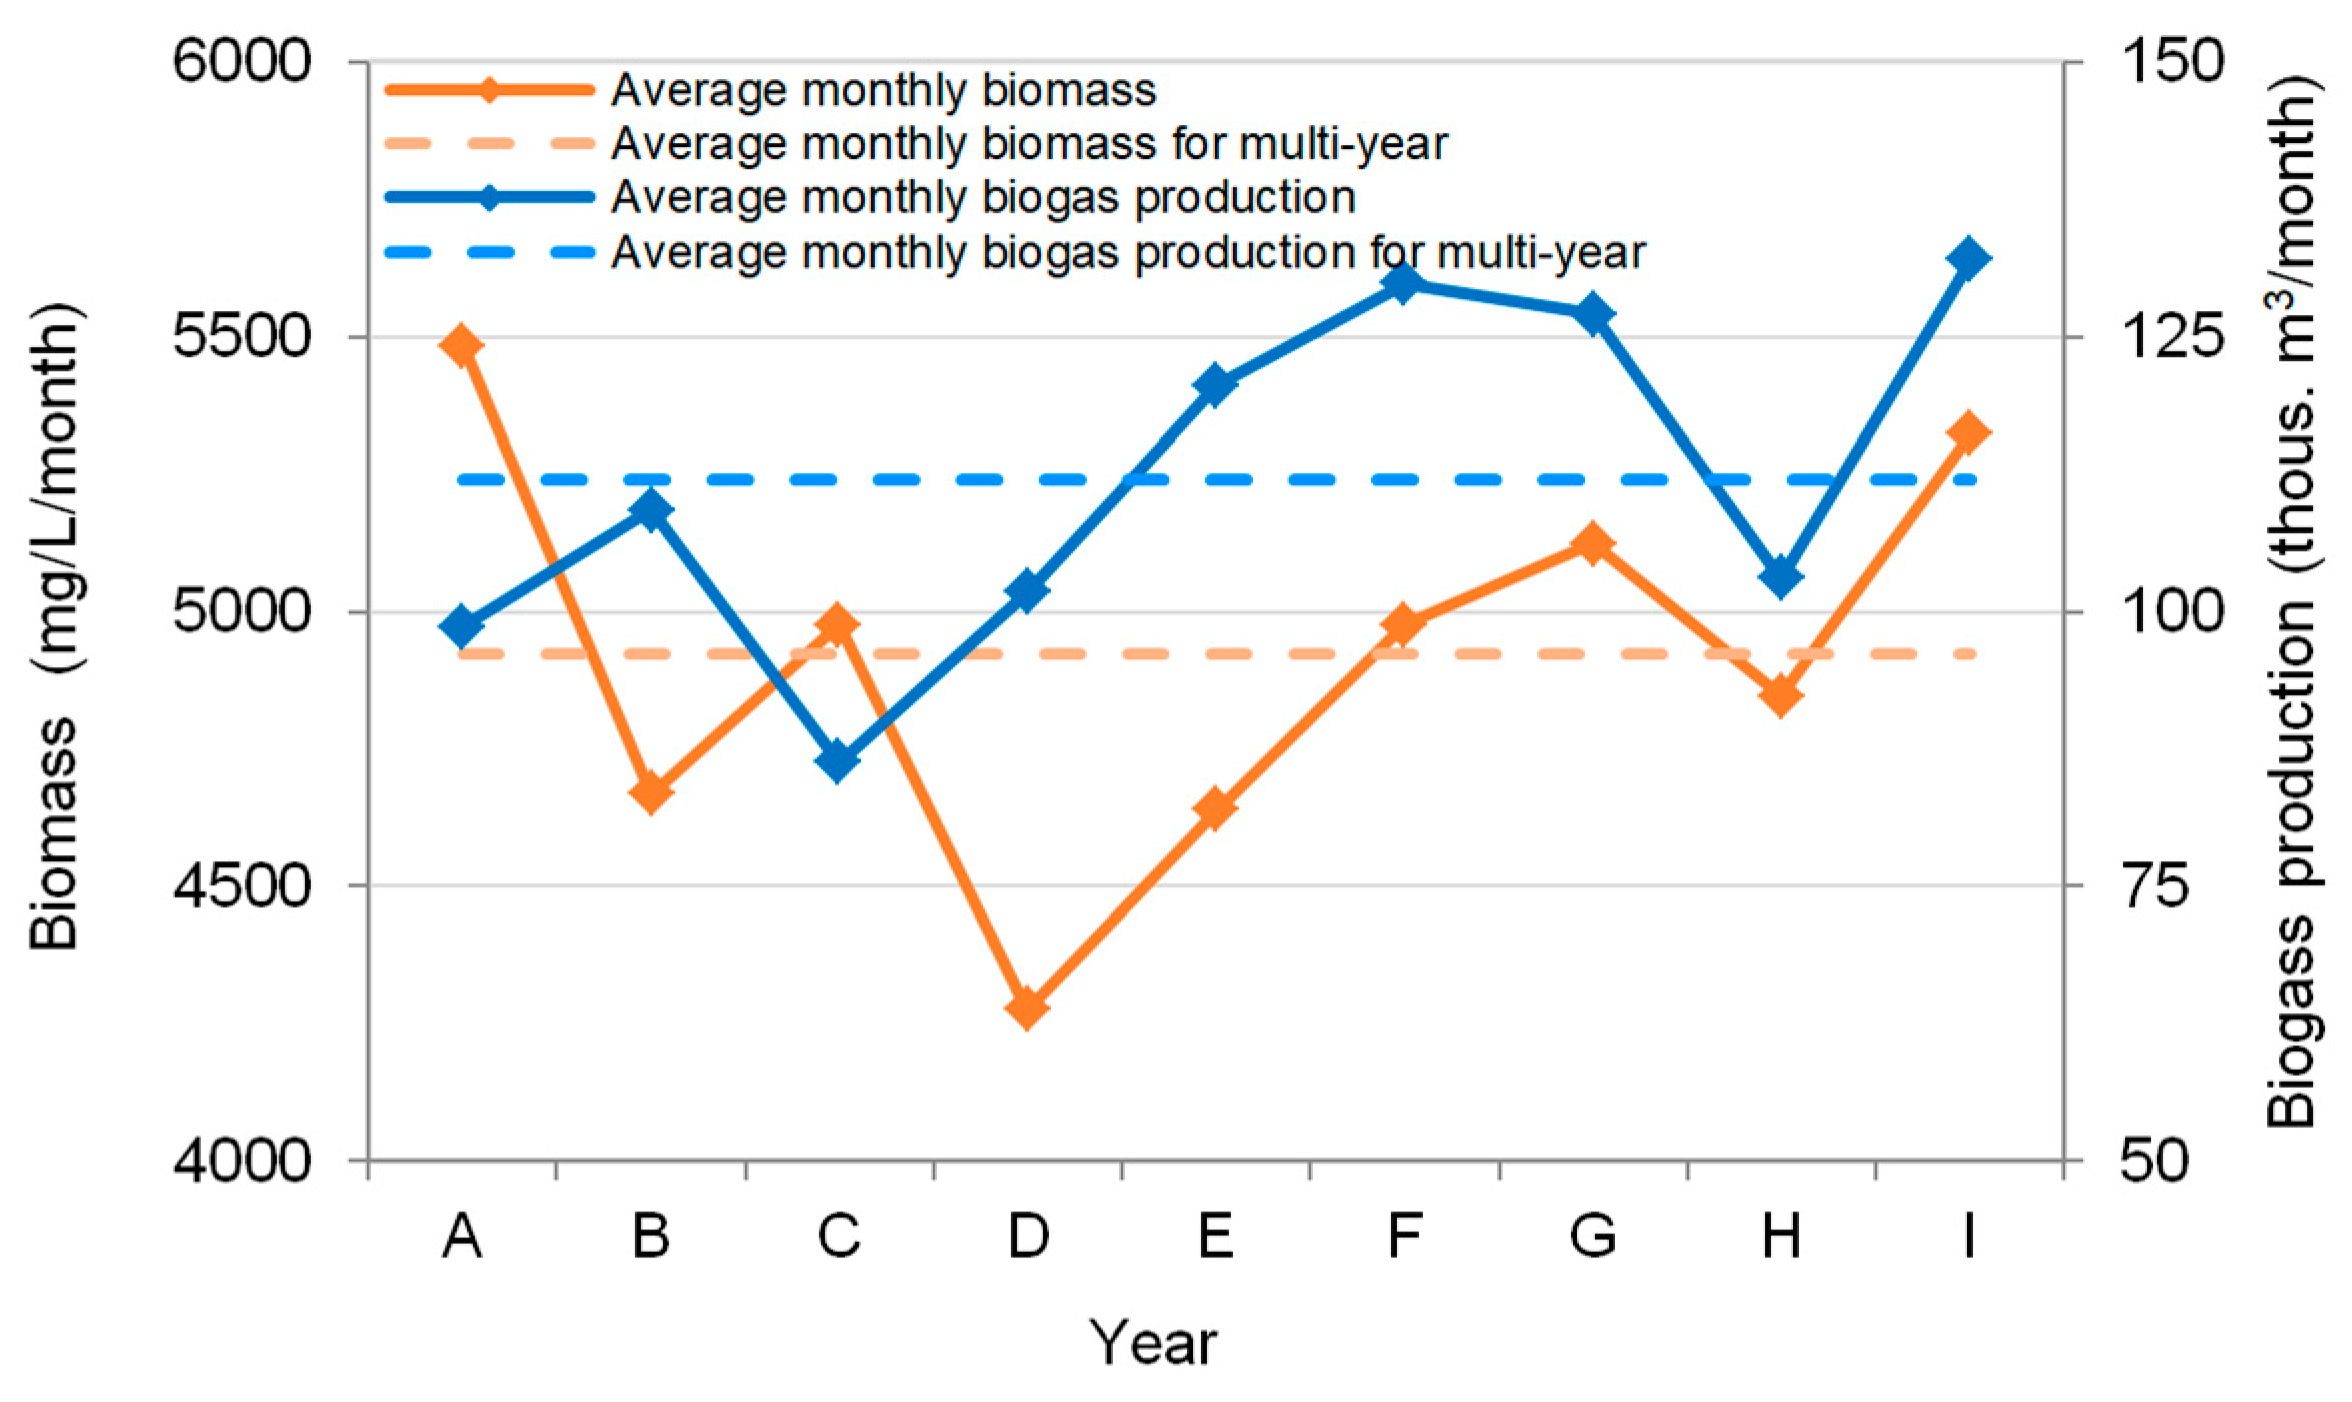
3.4. The Analysis of Biogas Production at the WWTP

Additionally in this study, the issue of biogas production was considered. The analysed WWTP produces biogas from the biomass of sewage sludge. Figure 9 and Table A2 (Appendix A) show that in particular years of the nine-year period (the years were labelled from A to I), biomass production was at an even level, which is evidenced by the calculated coefficient of variation CV = 0.07 (low variability); the average monthly biomass in the multi-year period was 4924 mg/L/month. Biogas production varied in the nine-year period, giving an average monthly value of 112.03 thous. m3/month (Figure 9, Table A2). Biogas production in subsequent years also remained at a steady level (CV = 0.13, indicating a low variability). Since Year D (Figure 9), a similar pattern of biomass and biogas production was observed, i.e., with an increase in biomass production, an increase in biogas production was observed.

4. Discussion

4.1. Removal of the Ether Extract, Phenols, Chlorides and Sulfates from Sewage in Municipal WWTPs

In light of the risk of exceeding permissible levels of substances extractable with petroleum ether in technological sewage from a confectionery plant, Rucka et al. [11] explored ways to enhance the efficiency of the existing sewage pre-treatment systems. Proposed solutions included installing additional deflectors or partitions and implementing biological sewage treatment under aerobic conditions. Subsequent technological tests conducted by Rucka et al. [12] on sewage from the confectionery industry, using the activated sludge method in SBR batch reactors, demonstrated satisfactory efficiency in removing substances extractable with petroleum ether. These results confirmed the viability of biological processes for treating this type of sewage. Similarly, our studies have shown that the processes taking place in the biological part of the WWTP play a key role in ether extract reduction. However, the first stage of treatment processes, i.e., mechanical treatment, which resulted in a 28% reduction of the ether extract, is also important. Therefore, the installation of additional deflectors or partitions in order to increase the efficiency of removing this type of pollutant, as proposed by Rucka et al. [12], seems to be justified. At one municipal WWTP, Boguski [15] reported an average removal efficiency of 42.7% for fat and oil substances in sewage. The highest load of substances extractable with petroleum ether was removed from initial sewage sludge, while the removal of fats and oils through sand and screenings was minimal. It was observed that the degradation of fat substances occurs predominantly during sludge processing, facilitated by microbiological decomposition in the fermentation chamber. This process does not occur in the biological treatment line of the WWTP. This is because the biodegradation of fats and oils by activated sludge microorganisms requires more time than the hydraulic retention time of the sewage and activated sludge mixture in the biological treatment section. Instead, fats and oils are adsorbed onto activated sludge flocs and subsequently removed in the stream of excess sludge.
The research by Tahri et al. [28] demonstrated that the presence of phenols and sulfides in sewage (along with chromium, nickel and copper) was a source of disturbances in the biological treatment processes in a WWTP operating activated sludge technology. The decrease in the efficiency of removing chemical oxygen demand, suspended solids and nitrogen was caused, among others, by the presence of phenols in raw sewage (January–March and October–December), which is associated with olive cultivation specific to the research region. In the period from May to September, i.e., when there were no phenols in the sewage, and other toxic elements were present, the treatment efficiency was good, thanks to the activated sludge acclimatization. In their study, Stefanowicz and Lisiecki [29] proved that when phenols are the only source of carbon in sewage and their concentration does not exceed 30 mg/L, then activated sludge quickly decomposes them, thus shortening the time of phenols’ toxic effect. However, when sewage contains other, more easily assimilable sources of carbon, even low concentrations of phenols are toxic to activated sludge, because activated sludge uses the most easily assimilable source of carbon. Undecomposed phenols can lead to a weakening of the activated sludge’s activity and even cause it to die. Therefore, the authors highlight that attempts to adapt activated sludge to the decomposition of phenolic sewage in municipal sewage can be risky, especially in WWTPs not adapted to phenols decomposition. Zhong et al. [30] investigated the effectiveness of various technologies for phenols removal used in several municipal WWTPs. The obtained efficiency reached high values, ranging from 88.95% (conventional activated sludge processes) to 99.97% (a combination of anaerobic/anoxic/oxic processes, continuous microfiltration processes, ozone oxidation and chlorination processes). High efficiency of phenols removal was evidenced by the fact that seventeen different phenols were identified in the sewage influents, while only five phenols were found in the sewage effluents (including two regulated and three unregulated phenols). In the WWTP that was the subject of our research, the biological part of which is based on activated sludge technology, a similarly high level of phenols reduction was achieved, exceeding 91%. In their research work, Mohammadi et al. [31] draw attention to the fact that phenols concentration in phenolic sewage classified as low, medium and high is a key factor in selecting the appropriate treatment method in industrial sewage treatment systems. In the case of low phenols concentrations, biodegradation, chemical, electrochemical and photocatalytic oxidation, solid phase extraction, ozonation, reverse osmosis/nanofiltration and wet air oxidation are recommended for phenols removal. In the case of high phenols concentrations, liquid–liquid extraction, pervaporation, membrane-based solvent extraction, adsorption and distillation are recommended.
Hong et al. [32] observed an adverse effect of chlorides on biological removal of nutrients from sewage. While the removal of ammonia nitrogen was not disturbed by the increased chlorides concentration, the removal of phosphate phosphorus at higher chlorides concentrations was definitely less effective. At chlorides concentrations above 1000 mg/L, the concentration of phosphate phosphorus in the effluent was even higher than in the influent. Moreover, it was noted that the efficiency of removal of organic substances was significantly lower in a context of higher chlorides concentrations. The research by Hong et al. [32] confirms the sensitivity of nitrifying activated sludge to high chlorides concentrations. Removal of chlorides from water and sewage is a difficult process, as a result of their high solubility and non-biodegradability. Chlorides removal methods include chemical precipitation, adsorption, oxidation and membrane separation [33]. As Bakshi et al. [34] point out, domestic ion-exchange water softeners have a significant impact on the chlorides load in municipal WWTPs. Since chlorides removal technologies in WWTPs are limited and very expensive [34,35], achieving sufficient chlorides reduction in treated sewage discharges is a real problem. A potential solution to this problem is to switch from domestic water softening to a centralized water softening system in water treatment plants. It turns out that centralized water softening methods using reverse osmosis technology or lime-softening technologies are more cost-effective solutions than home-based water softening with end-of-pipe chloride treatment; these methods are also characterized by environmental efficiency.
Microbiological sulfate reduction is one of the main biological processes of great environmental and biogeochemical importance [36]. As indicated by van den Brand [37], the use of sulfate-reducing bacteria in WWTPs brings advantages, including minimal sludge production, pathogens reduction, heavy metals removal and pre-treatment of anaerobic fermentation. The effectiveness of the sewage treatment system based on sulfate-reducing bacteria is also confirmed by Yun et al. [38]. Not only does the use of this system make it possible to achieve a high level of sulfate reduction (in the case of Yun et al. [38], it was 84%), but its integration with a sulfide fuel cell, which is an alternative to the energy-intensive oxygen sewage treatment process, also enables the generation of electricity. For better understanding the mechanisms of these biological processes, sulfate-reducing bacteria in anaerobic reactors of the active sludge technology municipal WWTPs were studied by El Houari et al. [36] and Rubio-Rincón et al. [39]. The research of El Houari et al. [36] revealed a high diversity and abundance of microbial communities, including sulfate-reducing bacteria, in anaerobic sludge. Ingvorsen et al. [39] studied the kinetics of sulfate reduction under alternating aerobic and anaerobic conditions to which sulfate-reducing bacteria were subjected. They observed an almost immediate reduction of sulfate in freshly aerated activated sludge after anaerobic incubation. The authors found a high capacity for reducing sulfates in sludge stored anaerobically in settling tanks for several days before dewatering. The consequence of the activity of sulfate-reducing bacteria is the production of sulfides, the presence of which is associated with unpleasant odours, toxicity and corrosion. In their research, García de Lomas et al. [40] demonstrated the effectiveness of adding a concentrated calcium nitrate to sewage at the works inlet, achieving a rapid decrease in sulfides, both in the air and the water phase. According to Kyser et al. [41], the best technology for reliable sulfate removal is reverse osmosis membrane treatment. Unfortunately, however, this technology is associated with very high costs of construction, maintenance and operation (capital costs, energy costs, equipment which is difficult to maintain, and qualified WWTP operators needed). Reverse osmosis is unprofitable for all municipal WWTPs. Reverse osmosis membrane treatment, while considered the most reliable technology for sulfate removal [41], suffers from prohibitively high construction, maintenance and operating costs, rendering it economically infeasible for many municipal WWTPs. Seeking more cost-effective solutions for removing orthophosphate, nitrate and sulfate ions, Abali et al. [42] proposed using adsorption on dried, crushed Carpobrotus edulis plant particles. This inexpensive, local and abundant biomaterial demonstrated a 73% reduction in sulfates, with the potential for integration with the activated sludge process. Studying sulfate and sulfide removal in constructed wetlands, Hou et al. [43] observed that increased sulfate loading correlated with a higher rate of sulfate removal. However, this also led to a greater proportion of discharged sulfides relative to removed sulfates (increasing from approximately 5.5% to 47%). A strong positive correlation (R2 = 0.983) was found between discharged sulfide share and sulfate load, indicating that constructed wetlands can effectively mitigate sulfide discharge alongside sulfate removal.

4.2. Biogas Production and Coagulant Assessment to Enhance Treatment Processes

As Ruszel et al. [44] indicated, based on data from 2019, in the European Union, the largest biogas production was recorded in Germany (7547.5 ktoe) and the smallest in Malta (1.6 ktoe). At that time, Poland took seventh place, with a total biogas production of 298.5 ktoe. However, in Germany, biogas produced from sewage sludge in 2019 accounted for about 6.5% of the total biogas production, whereas in Poland it was 40%, and in Malta 62.5%. According to Ciuła et al. [45], municipal WWTPs currently have a large energy potential and will continue to have such potential in the future. The authors estimate the prospects for the production of biogas from sewage sludge at a level of 408.87 million m3 per year, with the figure recorded in 2021 being 153.74 million m3. The data summarized by Ciuła et al. [45] show that in Poland, the amount of biogas produced from sewage sludge is in second place; only agricultural biogas production is ahead of sewage sludge biogas production. Landfill biogas, municipal biogas and biogas from food industry waste is also produced, but in smaller quantities than biogas from sewage sludge.
Biogas from anaerobic digestion in sewage treatment is converted into synthetic natural gas through catalytic methanation, achieving a gas mixture with CH4 ≥ 95%, H2 ≤ 5%, and CO2 ≤ 2.5%. Optimal conditions, including 4–5 bar pressure and reactor temperatures (400 °C and 300 °C), ensure efficient methane production for gas grid injection [46]. Our data highlighted energy usage and production over several years, showcasing a notable trend in increasing energy efficiency and coverage. For instance, between Year A and Year I (Table A1), there was a clear improvement in energy self-sufficiency, with the percentage coverage rising from 20% (Year A) to 90% (Year G). This indicates a successful strategy in enhancing the energy production capabilities of the WWTP, likely through investments in technology and processes. Moreover, maintaining a high level of energy share (up to 94%) suggested a well-balanced energy management approach, optimizing both usage and production. Biogas enhances the sewage treatment process by producing renewable energy from anaerobic digestion. Between 2014 and 2023 [47], there was a reduction in Biochemical Oxygen Demand (BOD5) and Chemical Oxygen Demand (COD), with reductions exceeding 97%. Advanced technologies and research have optimized methane production, contributing to efficient energy generation in a circular economy.
From Year A to Year I (Table A2), the average monthly amount of composted sewage sludge generally decreased, starting at 834.5 mg/month in Year A and dropping to 721.6 mg/month in Year I. This reduction suggested improvements in the efficiency of biogas production processes or alternative treatment methods. The amount of discharged sludge also declined during the same period, from 279.35 thous. dry matter/month in Year A to 267.32 thous. dry matter/month in Year I (Table A2). This indicates an overall improvement in sludge management and treatment, potentially reducing the environmental impact. Studying phenols and biogas is important because phenolic compounds, found in nature and organic wastes, can be utilized in biogas production. The study of Hernandez and Edyvean [48] found that phenolic compounds inhibit biogas production at concentrations of 120 to 594 mg of compound/g Volatile Suspended Solids (VSS), with a maximum biodegradation of 63.85 ± 2.73%. Understanding these effects can help optimize biogas production and manage the impact of phenolics in sewage treatment, as seen with inhibition concentrations between 800 and 1600 mg/L organic carbon.
The increase in polyaluminium chloride (coagulant) consumption in Year I (Table A3) suggests that more coagulant was needed to achieve the desired sewage treatment outcomes. This could be due to higher volumes of sewage, changes in the composition of the sewage, or the need to improve treatment efficiency. The slight improvement in treatment efficiency indicated by the higher polyaluminium chloride consumption per kg of the EE load means that despite using more coagulant, the process was better at reducing contaminants in the sewage (Table A3). Coagulants like polyaluminium chloride (PAC) are used to aggregate and remove particles, improving water clarity and quality [49]. In acidic conditions, charge neutralization was the main mechanism, while in alkaline conditions, both charge neutralization and sweep coagulation worked effectively. Optimal performance was achieved within a pH range of 7.0 to 10.0. Regular monitoring and adjustments ensured high coagulation efficiency.
There were no correlation values provided for polyaluminium chloride consumption alone (Table 5). The volume of discharged sludge showed a moderate positive correlation with coagulant consumption (Spearman’s Rho = 0.488, p-value = 0.026, Fisher’s z = 0.534, SE = 0.238), indicating that as the volume of discharged sludge increased, the consumption of polyaluminium chloride tended to increase. The ether extract load exhibited a moderate negative correlation with coagulant consumption (Spearman’s Rho = −0.443, p-value = 0.046, Fisher’s z = −0.476, SE = 0.237) and a strong negative correlation with the volume of discharged sludge (Spearman’s Rho = −0.614, p-value = 0.004, Fisher’s z = −0.716, SE = 0.241), indicating that higher ether extract loads corresponded to lower polyaluminium chloride consumption and lower volumes of discharged sludge.
For Polystabil KWS, both correlations were statistically significant (Table 5). Polystabil KWS consumption displayed a strong negative correlation with the volume of discharged sludge (Spearman’s Rho = −0.569, p-value = 0.008, Fisher’s z = −0.646, SE = 0.240), meaning that as Polystabil KWS consumption increased, the volume of discharged sludge tended to decrease. This correlation was statistically significant. However, the correlations with polyaluminium chloride consumption (Spearman’s Rho = −0.388, p-value = 0.083, Fisher’s z = −0.410, SE = 0.236) and the ether extract load (Spearman’s Rho = 0.260, p-value = 0.254, Fisher’s z = 0.266, SE = 0.234) were not statistically significant, indicating weak or no significant associations. Phenol can be removed from sodium sulfate sewage using a ternary extractant (20% tributylphosphane (TBP), 20% diethyl carbonate (DEC), 60% cyclohexane), achieving 99.79% extraction efficiency. Stripping phenol with 1 mol/L sodium hydroxide (NaOH) solution reaches 96.29% efficiency [50]. The overall process allows up to 99.78% phenol recovery through two-stage extraction and back-extraction.
A higher ether extract load correlates with a higher volume of discharged sludge. Coagulant consumption affects this relationship, with higher consumption leading to more substantial discharged sludge volume increases. This helps optimize sludge treatment by adjusting coagulant dosage. The flexplot in Figure 7 shows that a higher EE load generally means more discharged sludge, and this relationship is further influenced by the amount of coagulant used in the treatment process. As presented by Libecki et al. [51], coagulants were used to remove reactive dyes from sewage due to their effectiveness in improving purification efficiency. Traditional lab tests were labour-intensive and less realistic, leading to the development of an automated lab flow system. This approach optimized coagulation, achieving up to 95% colour removal with aluminium coagulants, making the process more efficient and practical.
The results in Table A4 show that in Year I, the volume of discharged sludge increased compared to Year H. Despite this increase, the average monthly Polystabil KWS consumption decreased, as did the Polystabil KWS consumption per m3 of discharged sludge. This indicates that in Year I, treatment processes became more efficient in terms of Polystabil KWS consumption. Essentially, more sewage sludge was treated using less of the product, which suggests improvements in treatment processes or more effective dosing strategies. Studying struvite reduction is essential for improving water quality by removing phosphates and ammonia, while generating valuable by-products, such as hydrogen and electricity. This environmentally beneficial process addresses nutrient removal in sewage and offers renewable energy benefits, despite some environmental impacts from the production of magnesium anodes [52].
A positive relationship between the ether extract load and the volume of discharged sludge is evident, with both variables increasing in tandem. Variations in Polystabil KWS consumption further influence this relationship. Lower product consumption (0.0064–0.0075 L of product/m3 of discharged sludge) shows varying sewage sludge volumes. Moderate Polystabil KWS consumption (0.0075–0.012 L of product/m3 of discharged sludge) and higher product consumption (0.012–0.024 L of product/m3 of discharged sludge) both demonstrate a consistent and significant increase in the volume of discharged sludge with rising EE loads (Figure 8). For effective water and sewage management, adjusting Polystabil KWS dosages according to ether extract load is essential. This approach ensures optimal sewage sludge management and enhances overall treatment efficiency, promoting sustainable practices in treatment facilities. Using coagulation improves the removal of fats, oils and greases (FOG) from sewage sludge. The innovative design with short baffles and the addition of alum significantly enhanced FOG removal efficiency, achieving up to 88% removal for high-strength sewage. For dissolved sewage effluents, coagulation with alum at 200 mg/L improved fine particle removal from 27–40% to 66–87%. This approach optimized sewage management and reduced sewer blockages [53].

4.3. Segregation of Industrial Pollutants Using a Machine Learning Clustering Algorithm

Addressing the presence of phenols and chlorides in sewage requires technological innovation. This includes using advanced data analytics techniques, such as clustering algorithms to identify patterns and group similar samples [54]. Determining the optimal number of clusters remains a challenge in sewage composition analysis and this choice significantly impacts environmental management practices. This approach provides valuable insights into the complex interactions of different chemical compounds in sewage [55].
In our study, using k-means clustering, two clusters were determined to be optimal across all studies. The clustering of the ether extract data (Figure 6a) resulted in less compact clusters (high value of Within-Cluster Sum of Squares of 12.564), with greater internal variance and weak separation (low F-statistic of 0.96961), explaining only a moderate portion (49.23%) of the data’s variance. This suggests the initial clustering was ineffective at creating distinct groups and missed significant underlying structures. Therefore, raw treatment requires improvement, including exploring different clustering algorithms, varying cluster numbers, feature engineering and data re-evaluation for noise or outliers. Phenols (Figure 6b) are useful for assessing cluster cohesion because of their low WCSS value. WCSS of 0.0036858 indicated compact clusters with good internal cohesion and emphasised their effectiveness as an assessment parameter from a different perspective. The F-statistic of 1.3887 suggested some degree of separation between clusters, but also the possibility of overlap. The clustering explained a moderate portion (58.14%) of the data’s variance. While the clusters showed internal consistency, the moderate Silhouette width and F-statistic suggested further investigation using different clustering methods, exploring alternative numbers of clusters and analysing specific phenols characteristics could lead to a more refined understanding of the structure of the data. For the average chlorides levels (Figure 6c), the Silhouette coefficient was 0.738, the highest among the analysed chemical compositions, highlighting chloride’s effectiveness as a clustering indicator; chlorides are a strong clustering indicator. The Silhouette coefficient values for sulfates (Figure 6d) ranged from slightly below 0.0 to around 0.7. Positive values indicated well-clustered points, while negative values suggested some points might have been incorrectly assigned to a cluster or were near the cluster boundaries. Cluster 1 had higher Silhouette coefficient values compared to Cluster 2, indicating that Cluster 1 data points were more compact and well-separated from other clusters. The Silhouette coefficients for Cluster 1 neared 0.7, suggesting strong cohesion and separation.
Another approach is the Silhouette score, which quantifies how similar an object is to its own cluster compared to other clusters. A higher Silhouette score indicates better-defined clusters. Selecting the optimal cluster number can provide valuable insights into the underlying structure of chemical compounds present in sewage samples. Clustering similar sewage samples helps identify distinct profiles, assess pollution and develop targeted treatments [56]. It can reveal pollutant correlations and highlight outliers. Choosing the right number of clusters is crucial for environmental research, management and policy, enabling better pollution control and water resource management [57]. Advancements in data analytics will further improve our understanding of sewage and its industrial pollutants for their environmental impact on water resource management [58,59].

5. Conclusions

A series of treatment stages led to a significant reduction in the ether extract and phenols concentrations in sewage, while chlorides and sulfates levels remained relatively constant. The mechanical–biological treatment achieved a reduction of over 91% in ether extract and phenols. However, chlorides and sulfates showed minimal reduction, sometimes even increasing, indicating that mechanical treatment was ineffective for these pollutants. Detrended Correspondence Analysis (DCA) highlighted patterns in industrial pollutants, revealing relationships among various sewage contaminants. The ether extract concentrations varied across samples, whereas phenols and chlorides formed distinct clusters, indicating similar behaviour. Sulfates exhibited both clustering and dispersion, reflecting their variability. This analysis provided valuable insights into the complex chemical interactions within sewage. K-means clustering identified two optimal clusters across the datasets. Among the analysed pollutants, chlorides levels yielded the highest Silhouette coefficient (0.738), demonstrating their strong potential as a clustering indicator. In contrast, phenols exhibited lower Within-Cluster Sum of Squares (WCSS), suggesting their effectiveness as an assessment parameter from an internal cluster cohesion perspective. The study found that advanced treatment processes effectively removed phenols and improved overall treatment efficiency, despite an increase in sewage sludge discharge. Optimizing Polystabil KWS dosages based on the ether extract loads improved treatment efficiency, even with increased sewage sludge discharge. This analysis was instrumental in identifying trends and outliers, guiding further research and enhancing sewage treatment and water quality monitoring. Understanding these pollutants patterns supports the development of targeted interventions and more efficient treatment processes, informing future assessments of industrial pollution.

Author Contributions

Conceptualization, W.H.; methodology, W.H. and A.M.; software, W.H. and A.M.; validation, W.H. and A.M.; formal analysis, W.H. and A.M.; investigation, W.H. and A.M.; resources, W.H. and K.C.; data curation, W.H. and K.C.; writing—original draft preparation, W.H. and A.M.; writing—review and editing, W.H. and A.M.; visualization, W.H. and A.M.; supervision, K.C.; project administration, K.C. All authors have read and agreed to the published version of the manuscript.

Funding

This research received no external funding.

Institutional Review Board Statement

Not applicable.

Informed Consent Statement

Not applicable.

Data Availability Statement

The original contributions presented in this study are included in the article. Further inquiries can be directed to the corresponding author.

Conflicts of Interest

The authors declare no conflicts of interest.

Appendix A

Table A1. Average values of energy management for the subject WWTP.
Share of Own
Energy in Demand
Covering the Demand with Own EnergyEnergy
Sale
Energy
Purchase
Energy
Production
Energy
Used
Year
(%)(MWh/Month)
202012.68215.1634.27249.43A
666640.32119.75115.17234.91B
51514.06120.64119.44240.08C
61611.9086.29135.97221.20D
73707.3564.27160.17217.08E
88856.6732.03198.11223.49F
94909.3122.13209.15222.80G
89858.2635.21209.63236.58H
75742.1171.64201.75271.29I
696710.3085.24153.74235.21Avg
0.320.301.080.670.360.07CV
Where Avg is average, CV is coefficient of variation (dimensionless values).
Table A2. Average values of biomass, biogas production, composting and discharged sewage sludge for the subject WWTP.
Discharged Sewage SludgeCompostingBiogas ProductionBiomassYear
(Thous. Dry Matter/Month)(mg/Month)(Thous. m3/Month)(mg/L/Month)
279.35834.598.625483A
274.30674.9109.224668B
234.85652.586.254977C
203.33508.4101.714275D
244.97555.1120.604638E
244.07561.9129.794977F
256.35581.9127.025124G
260.00617.4103.054846H
267.32721.6131.975325I
251.62634.2112.034924Avg
0.090.150.130.07CV
Where Avg is average, CV is coefficient of variation (dimensionless values). A, B, C, D, E, F, G, H and I are the years of study.

Appendix B

Table A3. Average values of polyaluminium chloride addition as a coagulant at the subject WWTP.
Polyaluminium Chloride Consumption in Relation to EE LoadEE Load in Raw SewageMonthly Polyaluminium Chloride ConsumptionYear
(kg of Product/kg of EE Load)(kg/Day)(kg of Product/Month)
2.18540968950H
2.74534759540I
Table A4. Average values of Polystabil KWS addition as a struvite precipitation prevention measure at the subject WWTP.
Polystabil KWS Consumption in Relation to the Volume of Discharged Sewage SludgeDischarged Sewage SludgeMonthly Polystabil KWS ConsumptionYear
(L of Product/m3 of Discharged Sludge)(m3/Month)(L of Product/Month)
0.012515,050188H
0.008817,482154I

References

  1. Li, Y.; Dong, H.; Li, L.; Tang, L.; Tian, R.; Li, R.; Chen, J.; Xie, Q.; Jin, Z.; Xiao, J.; et al. Recent advances in wastewater treatment through transition metal sulfides-based advanced oxidation processes. Water Res. 2021, 192, 116850. [Google Scholar] [CrossRef]
  2. Rossi, M.L.; Kremer, P.; Cravotta, C.A.; Scheirer, K.E.; Goldsmith, S.T. Long-term impacts of impervious surface cover change and roadway deicing agent application on chloride concentrations in exurban and suburban watersheds. Sci. Total Environ. 2022, 851, 157933. [Google Scholar] [CrossRef] [PubMed]
  3. Ebrahimi Gardeshi, M.; Arab, H.; Benguit, A.; Drogui, P. Runoff water loaded with road de-icing salts: Occurrence, environmental impact and treatment processes. Water Environ. J. 2024, 38, 20–31. [Google Scholar] [CrossRef]
  4. Honarvar Nazari, M.; Mousavi, S.Z.; Potapova, A.; McIntyre, J.; Shi, X. Toxicological impacts of roadway deicers on aquatic resources and human health: A review. Water Environ. Res. 2021, 93, 1855–1881. [Google Scholar] [CrossRef]
  5. Pugazhendi, A.; Al-Mur, B.A.; Jeyakumar, R.B. Cosmetic industrial wastewater treatment and bioelectricity production in upflow microbial fuel cell (UMFC) using extremophilic bacterial consortium. J. Taiwan Inst. Chem. Eng. 2025, 166, 105438. [Google Scholar] [CrossRef]
  6. Ke, X.; Qin, Z.; Chen, A.; Tian, Y.; Yang, Y.; Zhang, H.; Qiu, G.; Wu, H.; Wei, C. Triple strategies for process salt reduction in industrial wastewater treatment: The case of coking wastewater. Sep. Purif. Technol. 2025, 355, 129614. [Google Scholar] [CrossRef]
  7. Ngulube, K.F.; Abdelhaleem, A.; Osman, A.I.; Peng, L.; Nasr, M. Advancing sustainable water treatment strategies: Harnessing magnetite-based photocatalysts and techno-economic analysis for enhanced wastewater management in the context of SDGs. Environ. Sci. Pollut. Res. 2024, 31, 1–37. [Google Scholar] [CrossRef]
  8. Singh, A.; Gogoi, R.; Sharma, K.; Kumar, R.; Siril, P.F. Continuous flow synthesis of disordered covalent organic framework for ultra-high removal of industrial pollutants in flow. Sep. Purif. Technol. 2023, 307, 122739. [Google Scholar] [CrossRef]
  9. Jia, Y.; Wang, Y.; Wang, M.; Li, B.; Song, X.; Wu, M.; Guangzai, N.; Yin, Y. Efficient separation of biofuel, lignin and alkali from black liquor by acid precipitation and ethanol extraction for valorization. Ind. Crops Prod. 2024, 209, 117987. [Google Scholar] [CrossRef]
  10. Konieczny, P.; Szymański, M. Food industry wastewater—Characteristics, hazards, benefits. eko-net.pl “Firma i Środowisko” 2005, 10, 16–22. (In Polish) [Google Scholar]
  11. Rucka, K.; Balbierz, P.; Mańczak, M. Assessment of the possibilities of wastewater treatment from a confectionery plant. In Interdyscyplinarne Zagadnienia w Inżynierii i Ochronie Środowiska; Traczewska, T.M., Ed.; Oficyna Wydawnicza Politechniki Wrocławskiej: Wrocław, Poland, 2012; pp. 429–434. (In Polish) [Google Scholar]
  12. Rucka, K.; Mańczak, M.; Balbierz, P. Technological study of confectionary industry wastewater treatment in the activated sludge process. In Interdyscyplinarne Zagadnienia w Inżynierii i Ochronie Środowiska; Traczewska, T.M., Kaźmierczak, B., Eds.; Oficyna Wydawnicza Politechniki Wrocławskiej: Wrocław, Poland, 2014; pp. 699–706. (In Polish) [Google Scholar]
  13. Piekutin, J. Rainwater treatment of petroleum substances. Ekon. Środowisko 2013, 4, 60–66. (In Polish) [Google Scholar]
  14. Wang, B.; Liang, W.; Guo, Z.; Liu, W. Biomimetic super-lyophobic and super-lyophilic materials applied for oil/water separation: A new strategy beyond nature. Chem. Soc. Rev. 2015, 44, 336–361. [Google Scholar] [CrossRef] [PubMed]
  15. Boguski, A. Efficiency of grease substances removal in a municipal sewage treatment plant. Rocz. Ochr. Sr. 2008, 10, 481–489. (In Polish) [Google Scholar]
  16. Bhoi, R.; Shrivastava, A.; Sarkar, A. Chapter 10—Study of microbial communities in degrading toxic pollutants in the wastewater and solid waste treatment industries. In Functional Metagenomics. Microbial Diversity, Interaction, and Application in Bioremediation. Developments in Applied Microbiology and Biotechnology, 1st ed.; Shah, M.P., Ed.; Academic Press: New York, NY, USA, 2024; pp. 205–223. [Google Scholar] [CrossRef]
  17. Olczak, C.; Ligus, G.; Miodoński, J.M. Contemporary methods for treatment of phenolic coke wastewater. Chemik 2013, 67, 979–984. [Google Scholar]
  18. Salehi, S.; Abdollahi, K.; Panahi, R.; Rahmanian, N.; Shakeri, M.; Mokhtarani, B. Applications of biocatalysts for sustainable oxidation of phenolic pollutants: A review. Sustainability 2021, 13, 8620. [Google Scholar] [CrossRef]
  19. Mu’azu, N.D.; Jarrah, N.; Zubair, M.; Alagha, O. Removal of phenolic compounds from water using sewage sludge-based activated carbon adsorption: A review. Int. J. Environ. Res. Public Health 2017, 14, 1094. [Google Scholar] [CrossRef]
  20. Pavithra, K.G.; Rajan, P.S.; Arun, J.; Brindhadevi, K.; Le, Q.H.; Pugazhendhi, A. A review on recent advancements in extraction, removal and recovery of phenols from phenolic wastewater: Challenges and future outlook. Environ. Res. 2023, 237, 117005. [Google Scholar] [CrossRef] [PubMed]
  21. Gogate, P.R. Treatment of wastewater streams containing phenolic compounds using hybrid techniques based on cavitation: A review of the current status and the way forward. Ultrason. Sonochem. 2008, 15, 1–15. [Google Scholar] [CrossRef]
  22. Szklarek, S.; Górecka, A.; Wojtal-Frankiewicz, A. The effects of road salt on freshwater ecosystems and solutions for mitigating chloride pollution: A review. Sci. Total Environ. 2022, 805, 150289. [Google Scholar] [CrossRef]
  23. Duan, L.; Yun, Q.; Jiang, G.; Teng, D.; Zhou, G.; Cao, Y. A review of chloride ions removal from high chloride industrial wastewater: Sources, hazards, and mechanisms. J. Environ. Manag. 2024, 353, 120184. [Google Scholar] [CrossRef]
  24. Xu, W.; Liu, C. Application of induced crystallization for the mitigation of calcium sulfate in high-sulfate wastewater: A review. J. Water Process Eng. 2025, 69, 106824. [Google Scholar] [CrossRef]
  25. Khatry, I.S.; Devi, M.G.; Qartoubi, F.A.; Jadidi, A.A.; Al Rashdi, S.A. Investigation on adsorption performance of activated carbon prepared from municipal solid waste for the removal of pollutants from refinery wastewater. Indian J. Chem. Technol. 2024, 31, 288–297. [Google Scholar] [CrossRef]
  26. Regulation of the Minister of Maritime Economy and Inland Navigation of 12 July 2019 on Substances Particularly Harmful to the Aquatic Environment and Conditions to be Met During Sewage Discharge into the Water or into the Ground and During Rainwater or Snowmelt Discharge into the Water or into the Water Devices (Dz.U. 2019 poz. 1311). Available online: https://isap.sejm.gov.pl/isap.nsf/download.xsp/WDU20190001311/O/D20191311.pdf (accessed on 9 February 2025). (In Polish)
  27. Kaiser, H.F. An Index of Factorial Simplicity. Psychometrika 1974, 39, 31–36. [Google Scholar] [CrossRef]
  28. Tahri, M.; Larif, M.; Bachiri, B.; Kitanou, S.; Rajib, B.; Benazouz, K.; Khimani, M.; Taky, M.; Elamrani, M.; Elmidaoui, A. Characterization of heavy metals and toxic elements in raw sewage and their impact on the secondary treatment of the Marrakech wastewater treatment plant. J. Mater. Environ. Sci. 2017, 8, 2311–2321. [Google Scholar]
  29. Stefanowicz, T.; Lisiecki, J. Trials on phenol decomposition in sewage by unadapted activated sludge. Arch. Environ. Prot. 2000, 26, 159–167. (In Polish) [Google Scholar]
  30. Zhong, W.; Wang, D.; Xu, X. Phenol removal efficiencies of sewage treatment processes and ecological risks associated with phenols in effluents. J. Hazard. Mater. 2012, 217–218, 286–292. [Google Scholar] [CrossRef]
  31. Mohammadi, S.; Kargari, A.; Sanaeepur, H.; Abbassian, K.; Najafi, A.; Mofarrah, E. Phenol removal from industrial wastewaters: A short review. Desalin. Water Treat. 2015, 53, 2215–2234. [Google Scholar] [CrossRef]
  32. Hong, C.C.; Chan, S.-K.; Shim, H. Effect of chloride on biological nutrient removal from wastewater. J. Appl. Sci. Environ. Sanit. 2007, 2, 85–92. [Google Scholar]
  33. Li, Y.; Yang, Z.; Yang, K.; Wei, J.; Li, Z.; Ma, C.; Yang, X.; Wang, T.; Zeng, G.; Yu, G.; et al. Removal of chloride from water and wastewater: Removal mechanisms and recent trends. Sci. Total Environ. 2022, 821, 153174. [Google Scholar] [CrossRef] [PubMed]
  34. Bakshi, B.; Doucette, E.M.; Kyser, S.J. Centralized softening as a solution to chloride pollution: An empirical analysis based on Minnesota cities. PLoS ONE 2021, 16, e0246688. [Google Scholar] [CrossRef]
  35. Kyser, S.; Doucette, E. Alternatives for Addressing Chloride in Wastewater Effluent; Minnesota Pollution Control Agency: St. Paul, MN, USA, 2018. Available online: https://www.pca.state.mn.us/sites/default/files/wq-wwprm2-18.pdf (accessed on 9 February 2025).
  36. El Houari, A.; Ranchou-Peyruse, M.; Ranchou-Peyruse, A.; Bennisse, R.; Bouterfas, R.; Goni Urriza, M.S.; Qatibi, A.-I.; Guyoneaud, R. Microbial communities and sulfate-reducing microorganisms abundance and diversity in municipal anaerobic sewage sludge digesters from a wastewater treatment plant (Marrakech, Morocco). Processes 2020, 8, 1284. [Google Scholar] [CrossRef]
  37. van den Brand, T.P.H.; Roest, K.; Chen, G.H.; Brdjanovic, D.; van Loosdrecht, M.C.M. Potential for beneficial application of sulfate reducing bacteria in sulfate containing domestic wastewater treatment. World J. Microbiol. Biotechnol. 2015, 31, 1675–1681. [Google Scholar] [CrossRef]
  38. Yun, Y.-M.; Lee, E.; Kim, K.; Han, J.-I. Sulfate reducing bacteria-based wastewater treatment system integrated with sulfide fuel cell for simultaneous wastewater treatment and electricity generation. Chemosphere 2019, 233, 570–578. [Google Scholar] [CrossRef] [PubMed]
  39. Rubio-Rincón, F.; Lopez-Vazquez, C.; Welles, L.; van den Brand, T.; Abbas, B.; van Loosdrecht, M.; Brdjanovic, D. Effects of electron acceptors on sulphate reduction activity in activated sludge processes. Appl. Microbiol. Biotechnol. 2017, 101, 6229–6240. [Google Scholar] [CrossRef]
  40. García de Lomas, J.; Corzo, A.; Gonzalez, J.M.; Andrades, J.A.; Iglesias, E.; Montero, M.J. Nitrate promotes biological oxidation of sulfide in wastewaters: Experiment at plant-scale. Biotechnol. Bioeng. 2006, 93, 801–811. [Google Scholar] [CrossRef] [PubMed]
  41. Kyser, S.; Wolohan, K.; Hanson, A.; Parrella, A.; Jones, D. Sulfate Treatment; Minnesota Pollution Control Agency: St. Paul, MN, USA, 2018. Available online: https://www.eqb.state.mn.us/sites/eqb/files/documents/FINAL_181107%20Sulfate%20Treatment%20Presentation.pdf (accessed on 9 February 2025).
  42. Abali, M.; Ait Ichou, A.; Zaghloul, A.; Chiban, M.; Sinan, F.; Zerbet, M. Evaluation and improvement of the WWTP performance of an agricultural cooperative by adsorption on inert biomaterial: Case of orthophosphate, nitrate and sulfate ions. Appl. Water Sci. 2022, 12, 125. [Google Scholar] [CrossRef]
  43. Hou, J.; Guo, W.; Wen, Y. Effect of sulfate load on sulfur removal in model constructed wetlands. IOP Conf. Ser. Earth Environ. Sci. 2018, 186, 012078. [Google Scholar] [CrossRef]
  44. Ruszel, M.; Masłoń, A.; Ogarek, P. Analysis of biogas from sewage sludge digestion in terms of diversification in the natural gas production structure in Poland. Desalin. Water Treat. 2021, 232, 298–307. [Google Scholar] [CrossRef]
  45. Ciuła, J.; Wiewiórska, I.; Banaś, M.; Pająk, T.; Szewczyk, P. Balance and energy use of biogas in Poland: Prospects and directions of development for the circular economy. Energies 2023, 16, 3910. [Google Scholar] [CrossRef]
  46. Guilera, J.; Andreu, T.; Basset, N.; Boeltken, T.; Timm, F.; Mallol, I.; Morante, J.R. Synthetic natural gas production from biogas in a waste water treatment plant. Renew. Energy 2020, 146, 1301–1308. [Google Scholar] [CrossRef]
  47. Michalski, K.; Kośka-Wolny, M.; Chmielowski, K.; Bedla, D.; Petryk, A.; Guzdek, P.; Dąbek, K.A.; Gąsiorek, M.; Grübel, K.; Halecki, W. Examining the potential of biogas: A pathway from post-fermented waste into energy in a wastewater treatment plant. Energies 2024, 17, 5618. [Google Scholar] [CrossRef]
  48. Hernandez, J.E.; Edyvean, R.G.J. Inhibition of biogas production and biodegradability by substituted phenolic compounds in anaerobic sludge. J. Hazard. Mater. 2008, 160, 20–28. [Google Scholar] [CrossRef] [PubMed]
  49. Wei, N.; Zhang, Z.; Liu, D.; Wu, Y.; Wang, J.; Wang, Q. Coagulation behavior of polyaluminum chloride: Effects of pH and coagulant dosage. Chin. J. Chem. Eng. 2015, 23, 1041–1046. [Google Scholar] [CrossRef]
  50. Yang, X.; Wang, B.; Luo, H.; Yan, S.; Dai, J.; Bai, Z. Efficient recovery of phenol from coal tar processing wastewater with tributylphosphane/diethyl carbonate/cyclohexane: Extraction cycle and mechanism study. Chem. Eng. Res. Des. 2020, 157, 104–113. [Google Scholar] [CrossRef]
  51. Libecki, B.; Wardzyńska, R.; Kalinowski, S.; Kuźbik, K. Purification of a reactive dyes mixture solution by means of pre-hydrolyzed coagulants in the standard tests and coagulating flow system. Chem. Eng. Sci. 2025, 301, 120784. [Google Scholar] [CrossRef]
  52. Kékedy-Nagy, L.; Morrissey, K.G.; Anari, Z.; Daneshpour, R.; Greenlee, L.F.; Thoma, G. Sustainable electroless nutrient recovery from natural agro-industrial and livestock farm wastewater effluents with a flow cell reactor. Resour. Conserv. Recycl. 2025, 212, 107972. [Google Scholar] [CrossRef]
  53. Sultana, N.; Roddick, F.; Pramanik, B.K. Innovative grease interceptor to enhance fat, oil, and grease removal from the wastewater generated from food service establishments. Chemosphere 2025, 370, 143987. [Google Scholar] [CrossRef] [PubMed]
  54. Acosta, C.A.; Pasquali, C.L.; Paniagua, G.; Garcinuño, R.M.; Hernando, P.F. Evaluation of total phenol pollution in water of San Martin Canal from Santiago del Estero, Argentina. Environ. Pollut. 2018, 236, 265–272. [Google Scholar] [CrossRef]
  55. Corominas, L.; Garrido-Baserba, M.; Villez, K.; Olsson, G.; Cortés, U.; Poch, M. Transforming data into knowledge for improved wastewater treatment operation: A critical review of techniques. Environ. Model. Softw. 2018, 106, 89–103. [Google Scholar] [CrossRef]
  56. Beckers, L.M.; Brack, W.; Dann, J.P.; Krauss, M.; Müller, E.; Schulze, T. Unraveling longitudinal pollution patterns of organic micropollutants in a river by non-target screening and cluster analysis. Sci. Total Environ. 2020, 727, 138388. [Google Scholar] [CrossRef]
  57. Choi, J.M.; Manthapuri, V.; Keenum, I.; Brown, C.L.; Xia, K.; Chen, C.; Vikesland, P.J.; Blair, M.F.; Bott, C.; Pruden, A.; et al. A machine learning framework to predict PPCP removal through various wastewater and water reuse treatment trains. Environ. Sci. Water Res. Technol. 2025, 11, 481–493. [Google Scholar] [CrossRef]
  58. Peng, Q.; Yu, J.; Pang, Y.; Deng, L.; Tang, J.; Wang, J.; Wu, N.; Tang, L. Prospects of advanced oxidation processes for high-salinity coking wastewater treatment: A strategy to support sustainable management. Resour. Conserv. Recycl. 2025, 212, 107880. [Google Scholar] [CrossRef]
  59. Hanjra, M.A.; Blackwell, J.; Carr, G.; Zhang, F.; Jackson, T.M. Wastewater irrigation and environmental health: Implications for water governance and public policy. Int. J. Hyg. Environ. Health 2012, 215, 255–269. [Google Scholar] [CrossRef] [PubMed]
Figure 1. A scheme of the WWTP.
Applsci 15 06222 g001
Figure 2. Minimum, maximum and average pollution concentrations at the various treatment stages: (a) ether extract; (b) phenols; (c) chlorides; (d) sulfates.
Applsci 15 06222 g002
Figure 3. Concentrations of pollutants noted in sewage at the various treatment stages along with permissible levels: (a) ether extract; (b) phenols; (c) chlorides; (d) sulfates.
Applsci 15 06222 g003
Figure 4. Principal Component Analysis (PCA) of sewage pollutants including the ether extract, phenols, chlorides and sulfates.
Applsci 15 06222 g004
Figure 5. Detrended Correspondence Analysis (DCA) of sewage pollutants including ether extract, phenols, chlorides and sulfates. Phenols were related to sulfates. The ether extract was closer to chlorides.
Applsci 15 06222 g005
Figure 6. Silhouette analysis of sewage pollutants using optimal K-means clusters: (a) ether extract; (b) phenols; (c) chlorides; (d) sulfates.
Applsci 15 06222 g006
Figure 7. Dependence of the volume of discharged sewage and the ether extract (EE) load along with various levels of polyaluminium chloride consumption.
Applsci 15 06222 g007
Figure 8. Dependence of the volume of discharged sewage sludge and the ether extract (EE) load along with various levels of Polystabil KWS consumption.
Applsci 15 06222 g008
Figure 9. Biomass vs. biogas production at the subject WWTP.
Applsci 15 06222 g009
Table 1. The list of pollutants and other parameters tested in the study.
Pollutants tested in raw sewage, mechanically treated sewage and totally treated sewage:
  • ether extract (EE)
  • phenols
  • chlorides
  • sulfates
Coagulant tested for suspended particles removal:
  • polyaluminium chloride
Coagulant tested for struvite reduction:
  • Polystabil KWS
Parameters tested for biogas production:
  • biomass of sewage sludge
  • the volume of biogas
Table 2. Basic descriptive statistics for pollution in sewage at the various treatment stages.
SkKurtCVSTDMaxAvgMinPolluting
Substance
(−)(mg/L)
Raw sewage
0.453.680.0915.33229.00169.94127.00Ether extract
0.761.060.380.0090.0510.0220.009Phenols
3.6815.630.4060.50473.00150.7689.00Chlorides
−0.04−0.760.2120.23141.2596.0253.50Sulfates
Mechanically treated sewage
−0.17−0.400.1012.78149.50122.2189.50Ether extract
1.092.600.470.0080.0490.0180.001Phenols
3.6817.230.3955.25447.00143.4451.00Chlorides
1.054.410.2524.10203.2596.8138.25Sulfates
Totally treated sewage
−1.151.720.060.8716.3014.6911.80Ether extract
2.8510.690.600.0010.0070.0020.001Phenols
2.256.910.2940.90310.00138.6878.00Chlorides
1.768.770.2922.63194.5079.3733.50Sulfates
Where Min is minimum, Avg is average, Max is maximum, STD is standard deviation, CV is coefficient of variation, Kurt is kurtosis, Sk is skewness.
Table 3. Percentage reduction of pollutants in mechanically treated sewage and in totally treated sewage.
SulfatesChloridesPhenolsEther ExtractTreatment Stage
ηSTDηAvgηSTDηAvgηSTDηAvgηSTDηAvg
(%)
N/AN/AN/AN/A12.8723.975.6427.98Mechanically
treated sewage
11.9022.1011.3613.023.8391.810.7391.31Totally
treated sewage
Where ηAvg is average percentage reduction, ηSTD is standard deviation of percentage reduction, N/A is not applicable.
Table 4. (a) Multivariate regression analysis of mechanically treated sewage and totally treated sewage. Tests on independent variables. (b) Multivariate regression analysis of raw sewage, mechanically treated sewage and totally treated sewage. Tests on dependent variable as raw sewage.
a
pdf2df1FWilks’ LambdaIndependent Variables
<0.001256121190.10Mechanically treated sewage
<0.0012561117.40.68Totally treated sewage
b
pR2tStandard ErrorCoefficientIndependent VariablesDependent Variable
0.0511.9562.304.51ConstantRaw sewage
<0.0010.8846.030.0281.30Mechanically treated sewage
<0.0010.24−10.830.029−0.318Totally treated sewage
Where p is probability of results occurring by chance (smaller value means more significant results), df2 is degrees of freedom for denominator (total observations minus groups), df1 is degrees of freedom for numerator (number of group comparisons), F is the F-statistic used in ANOVA to compare group means by examining variance, Wilks’ lambda is a test statistic used in MANOVA for group mean differences (smaller value means greater difference), R² is the coefficient of determination (it is a statistical measure used in regression analysis to evaluate the goodness of fit of a model; it represents the proportion of the variance in the dependent variable that is predictable from independent variable(s)), and t is t-statistic (it measures how many standard deviations the coefficient is away from zero; it is used to test the significance of each predictor in the model).
Table 5. Spearman’s correlation for the studied coagulant (polyaluminium chloride), commercial product for struvite reduction (Polystabil KWS), the volume of discharged sewage sludge and the ether extract load.
Polystabil KWS ConsumptionEther Extract LoadDischarged Sewage SludgePolyaluminium Chloride Consumption Parameter of Correlation
Polyaluminium chloride consumptionSpearman’s Rho
p-value
Effect size (Fisher’s z)
SE Effect size
0.488Discharged
sewage
Spearman’s Rho
0.026p-value
0.534Effect size (Fisher’s z)
0.238SE Effect size
−0.614−0.443Ether extract
load
Spearman’s Rho
0.0040.046p-value
−0.716−0.476Effect size (Fisher’s z)
0.2410.237SE Effect size
0.260−0.569−0.388Polystabil KWS consumptionSpearman’s Rho
0.2540.0080.083p-value
0.266−0.646−0.410Effect size (Fisher’s z)
0.2340.2400.236SE Effect size
Where Spearman’s Rho is a measure of rank correlation between two variables (range from –1 to +1), p-value is probability of the correlation due to chance, Effect size (Fisher’s z) is a transformed correlation for stable variance and easier comparison, SE Effect size is the precision of the effect size estimate (smaller value means more precision).
Disclaimer/Publisher’s Note: The statements, opinions and data contained in all publications are solely those of the individual author(s) and contributor(s) and not of MDPI and/or the editor(s). MDPI and/or the editor(s) disclaim responsibility for any injury to people or property resulting from any ideas, methods, instructions or products referred to in the content.

