
Development and Validation of the Multi-Residue Method for Identification and Quantitation of Six Macrolide Antiparasitic Drugs


Abstract
1. Introduction
2. Materials and Methods
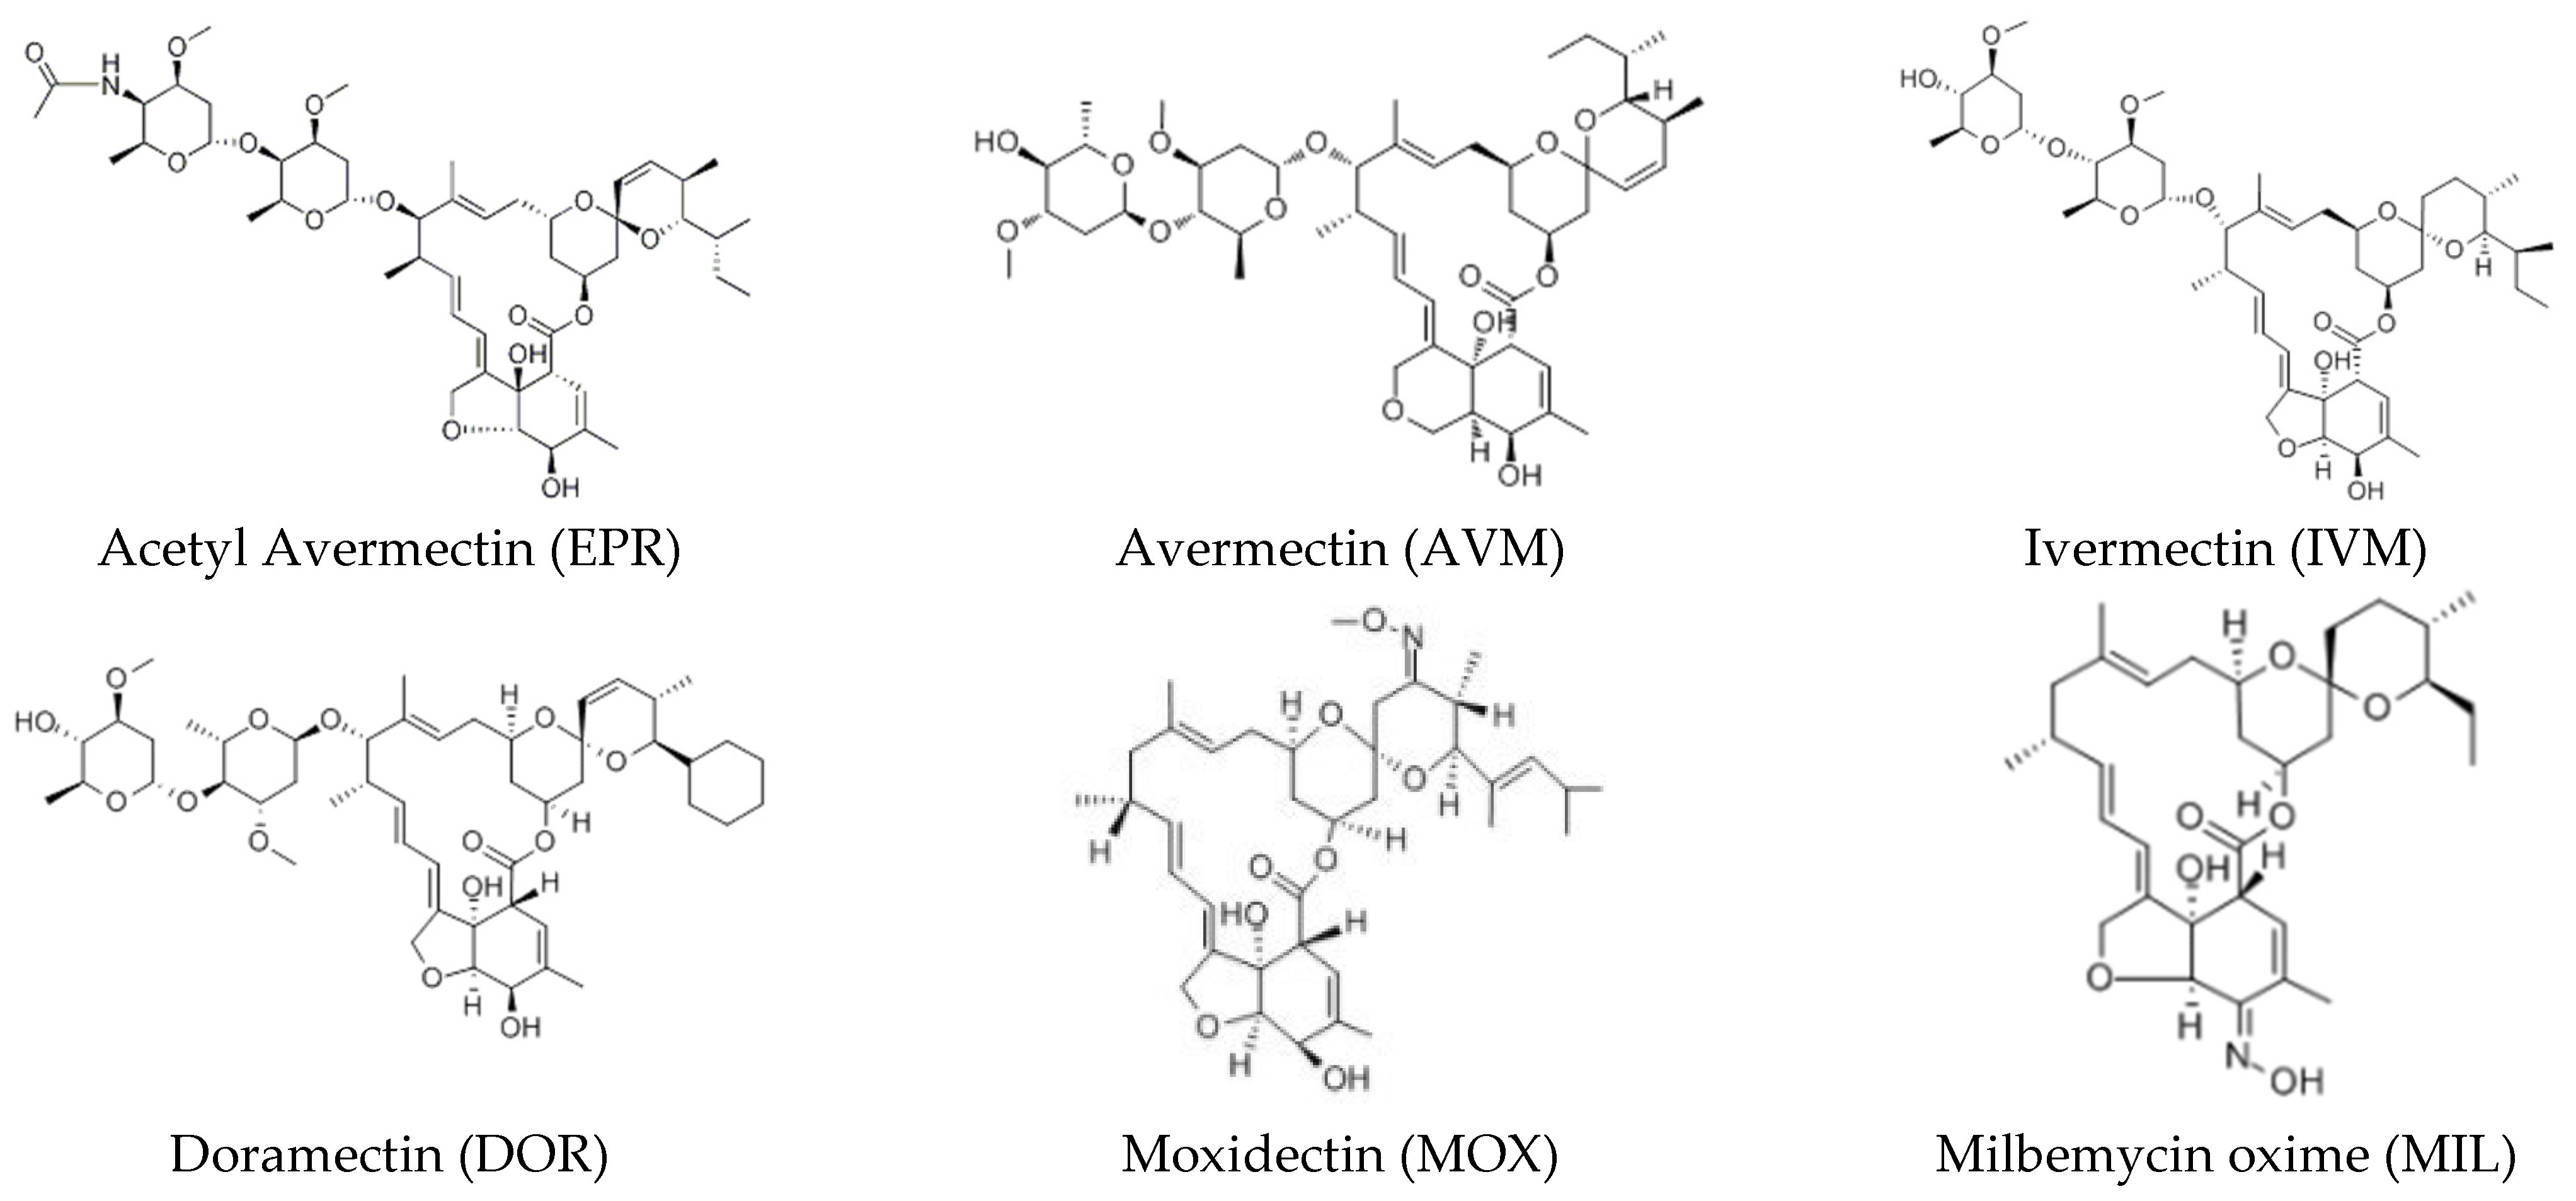
2.1. Chemicals and Drugs
2.2. Sample Preparation
2.3. Instrument Conditions
2.4. Method Validation
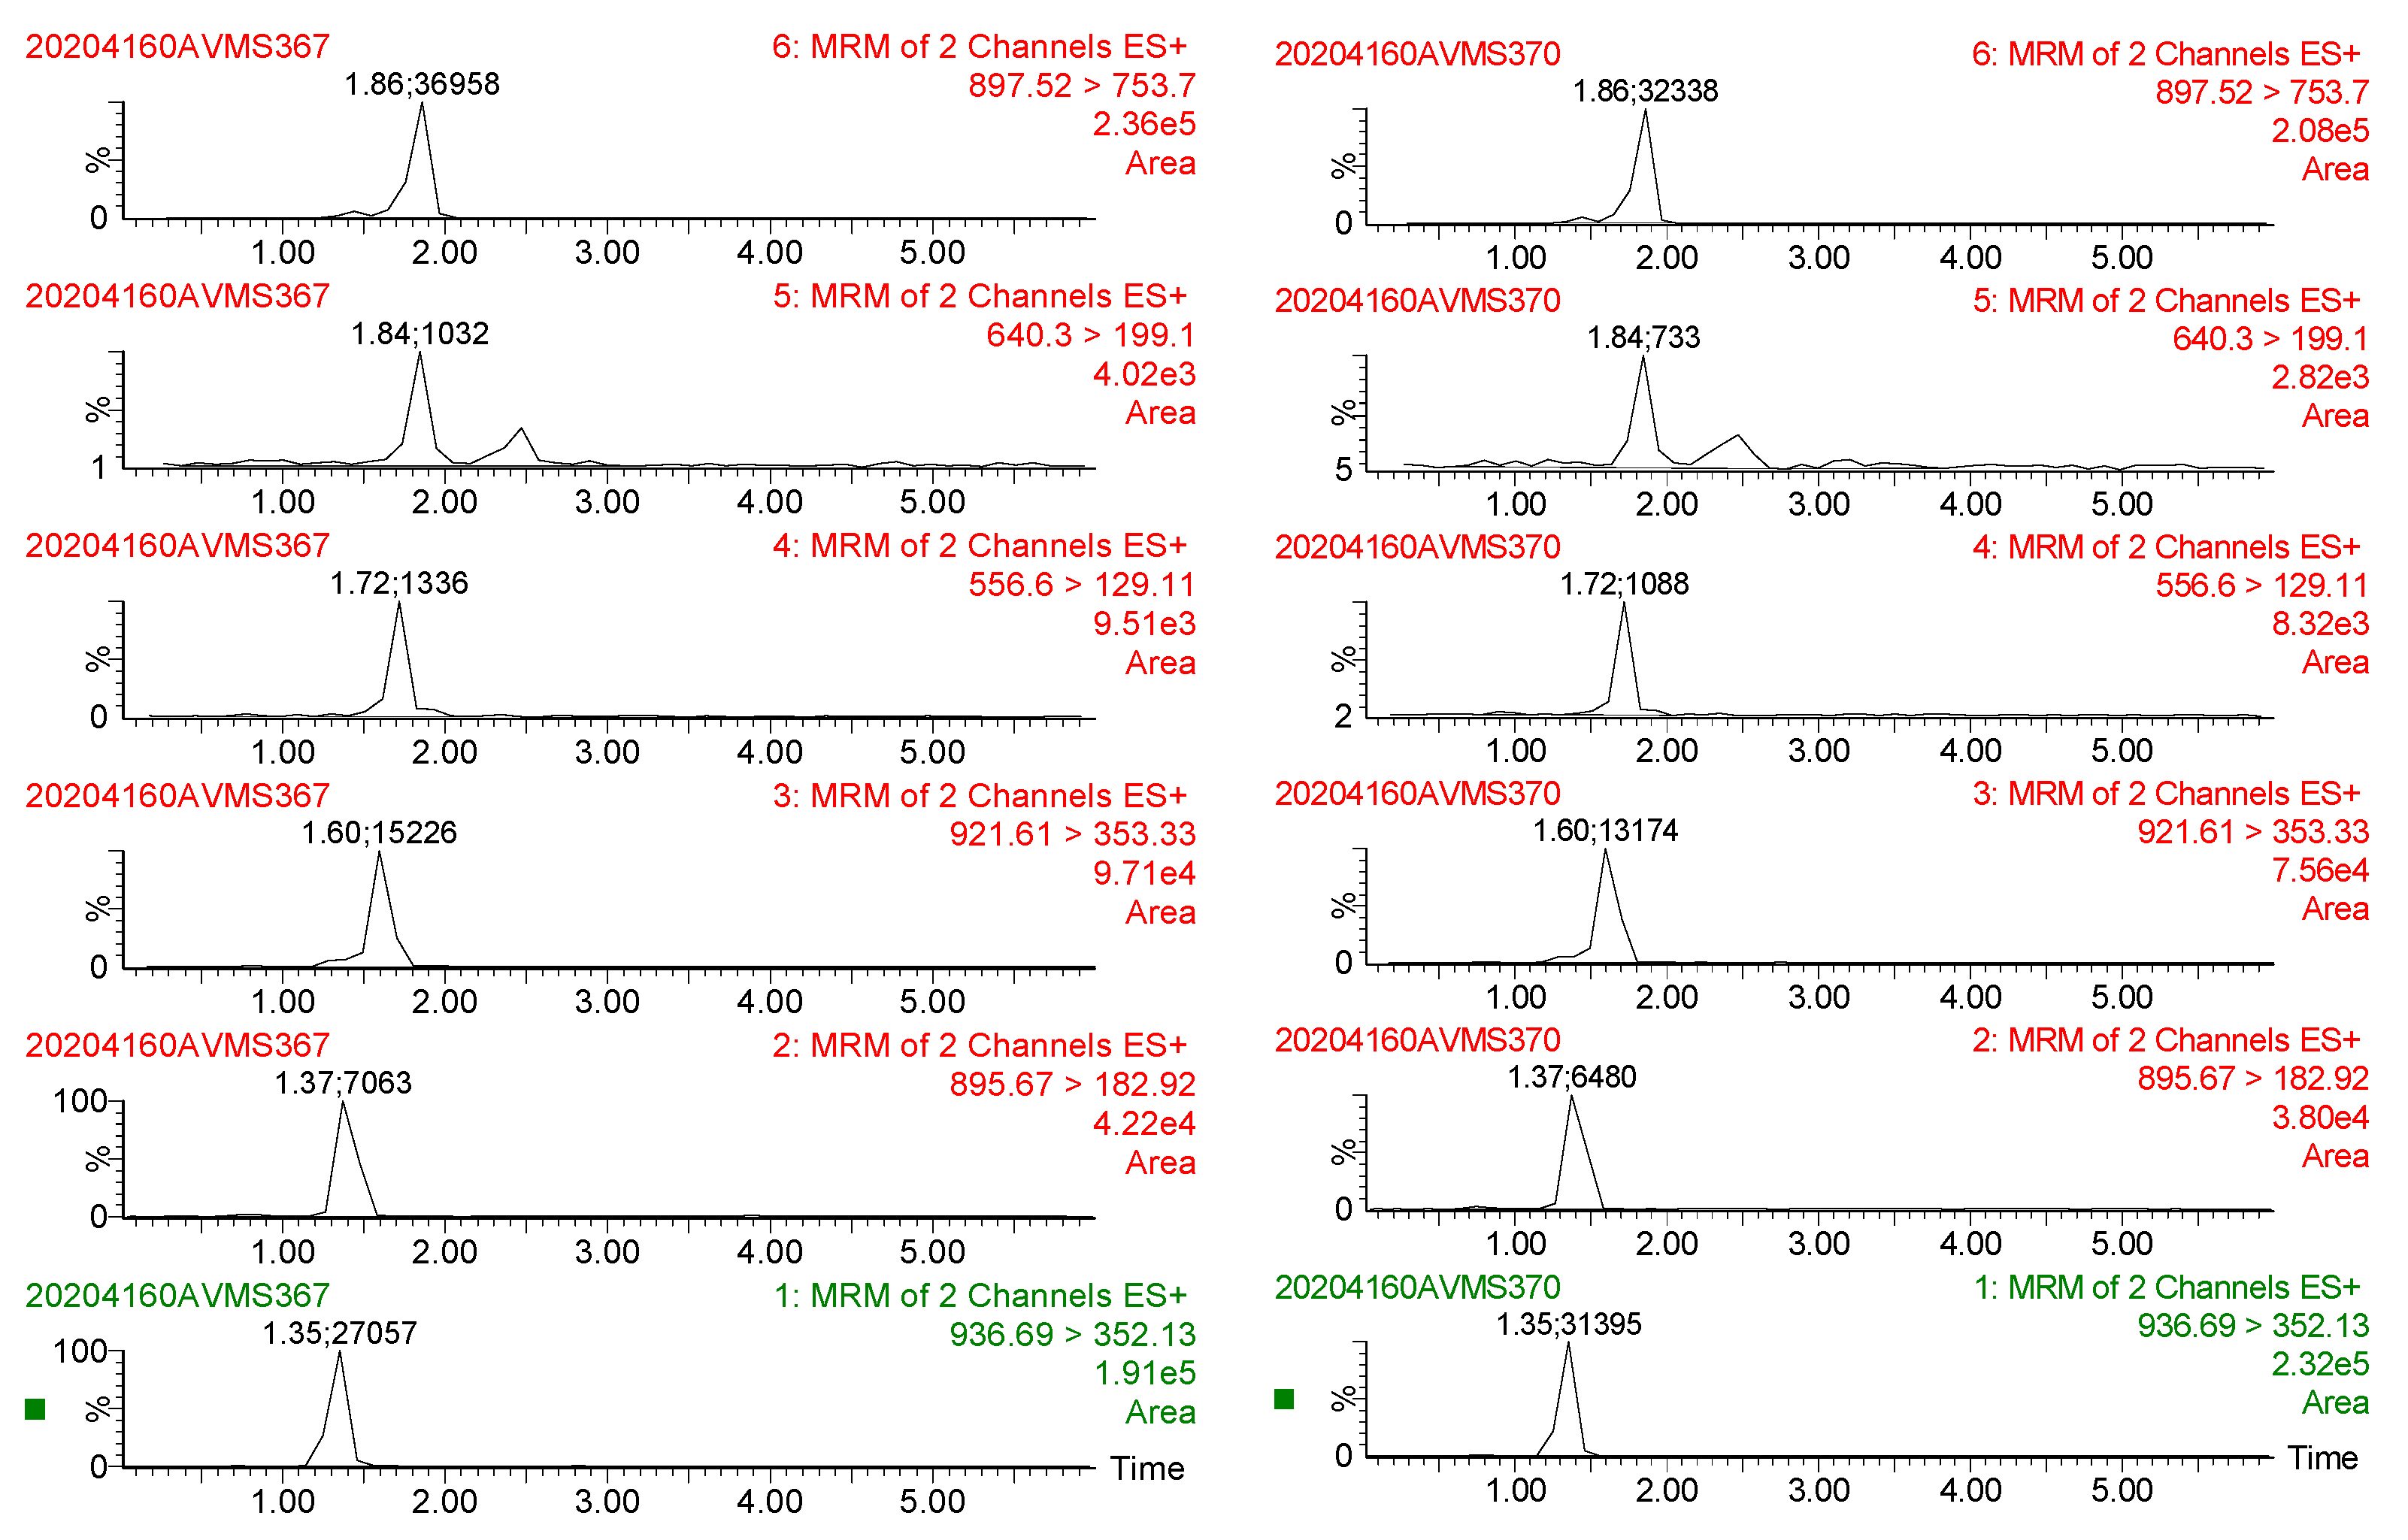
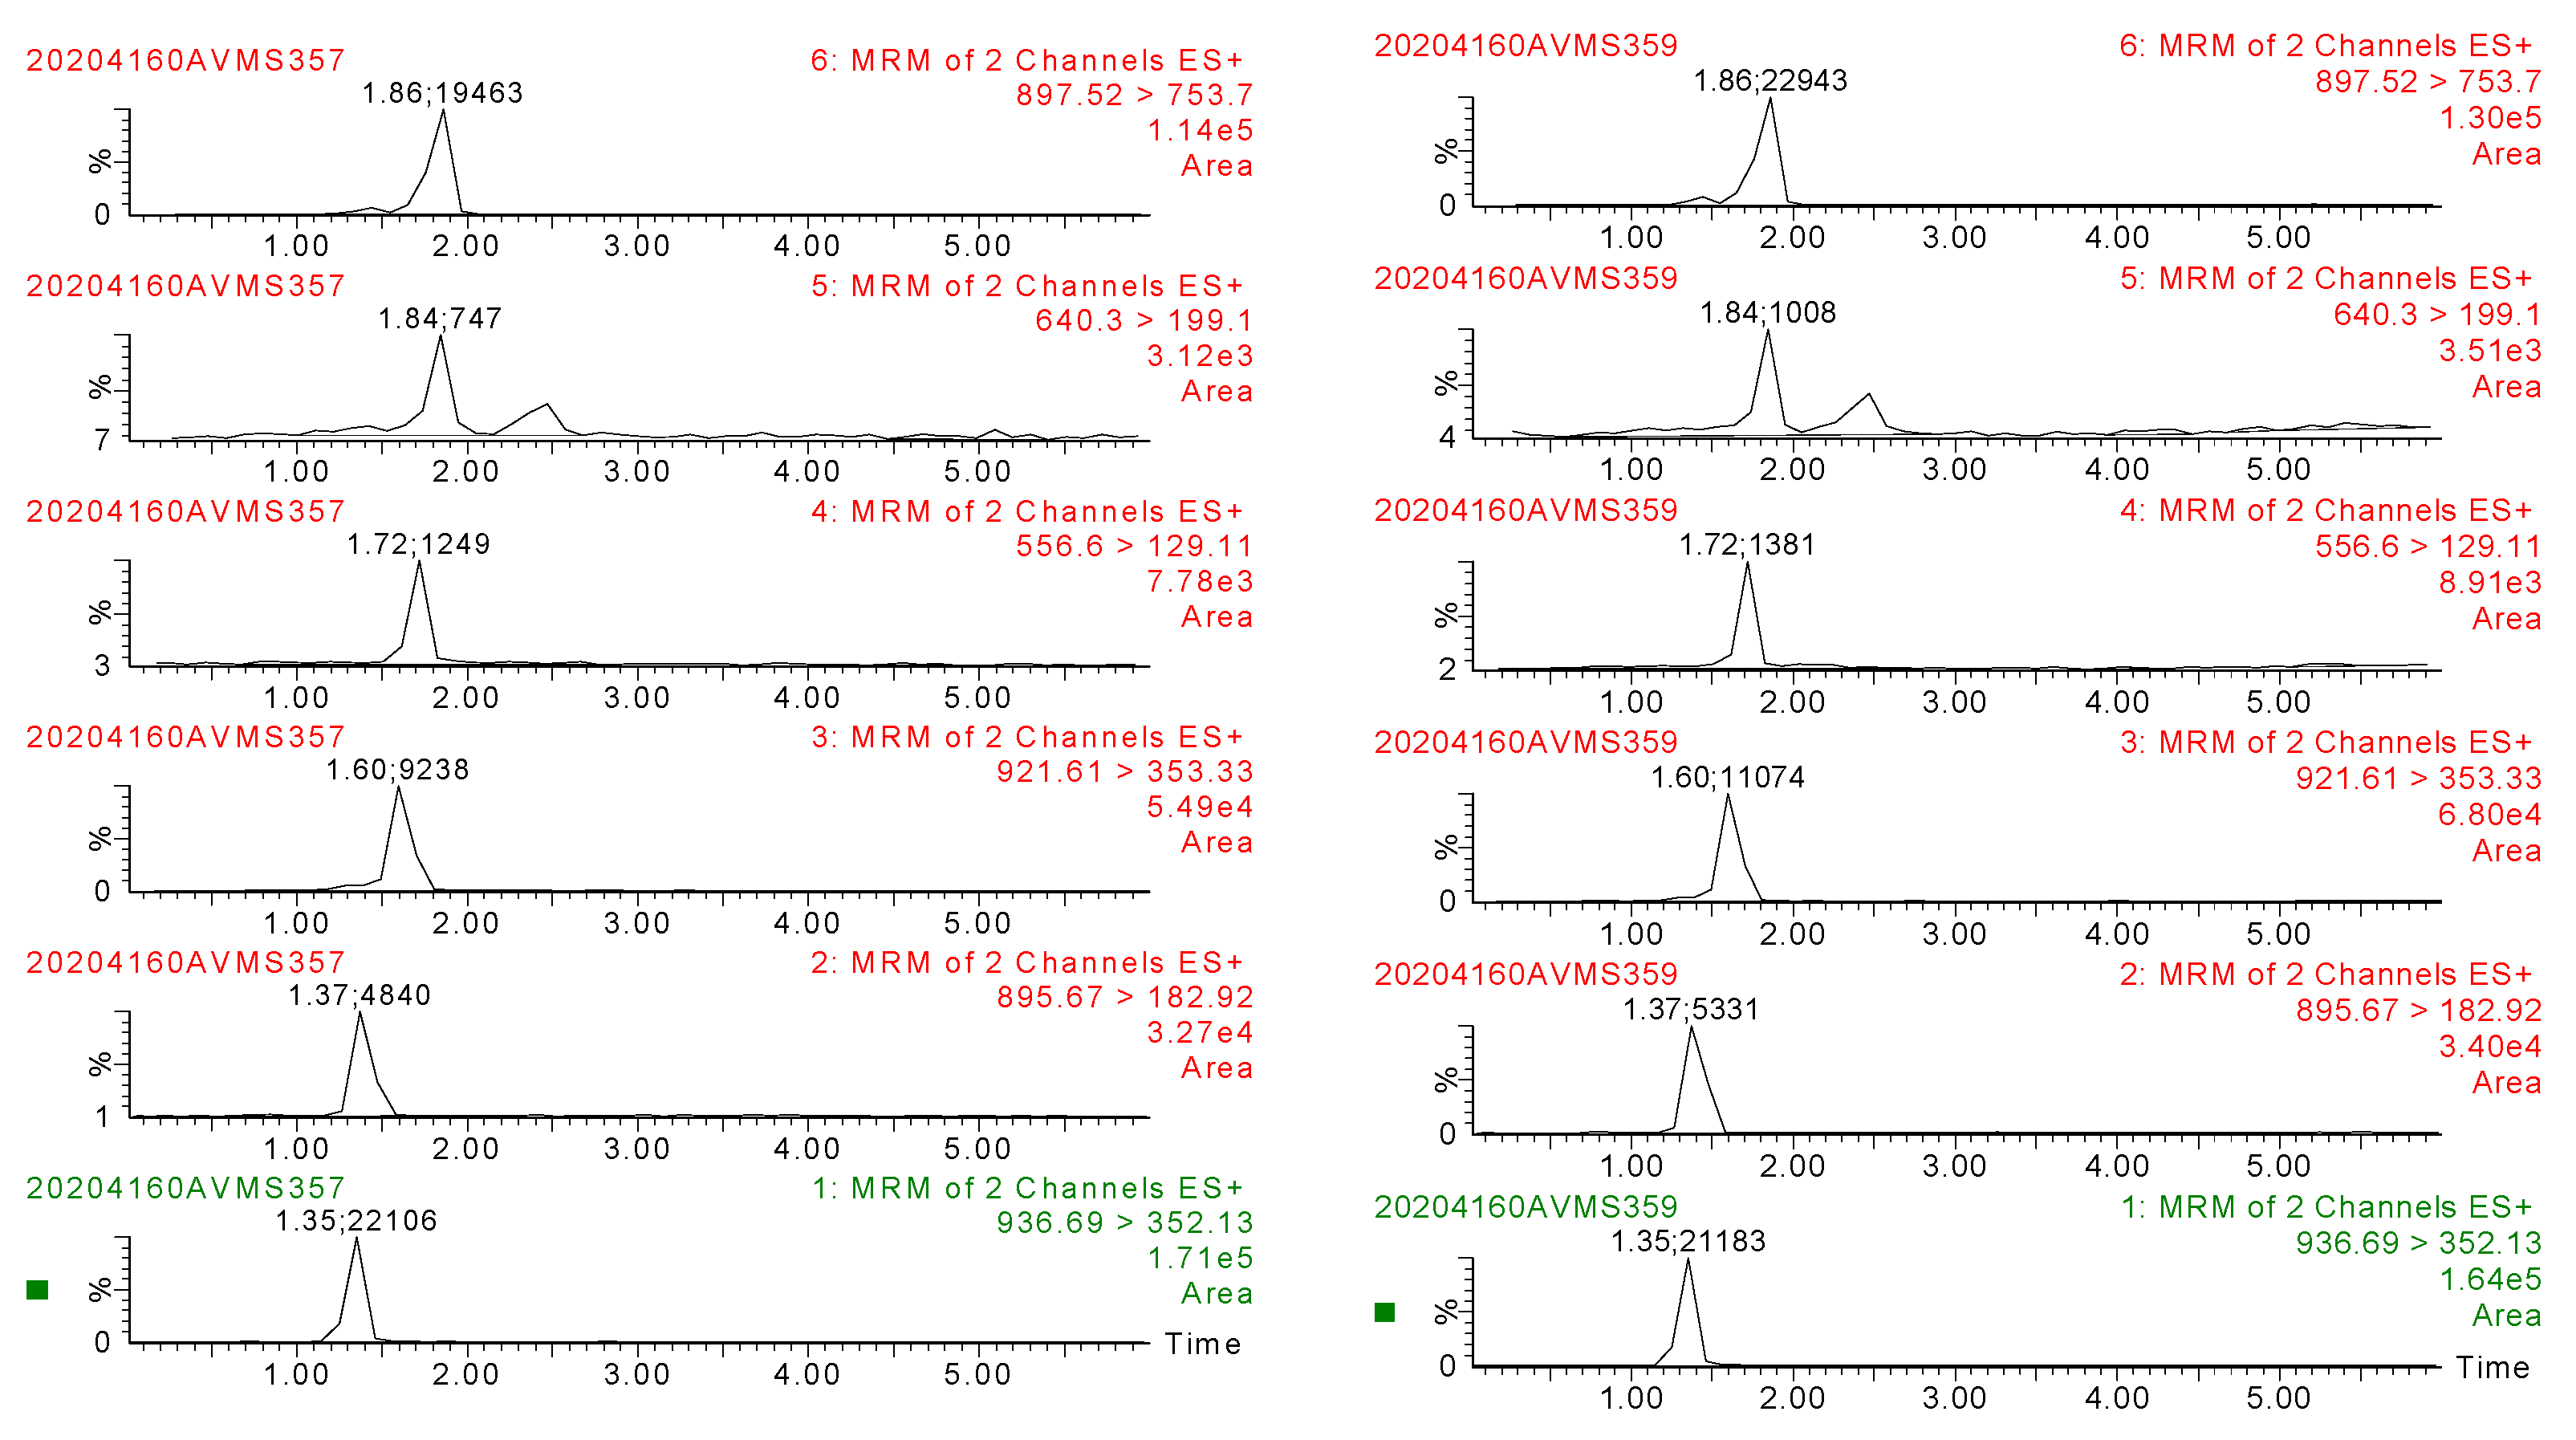
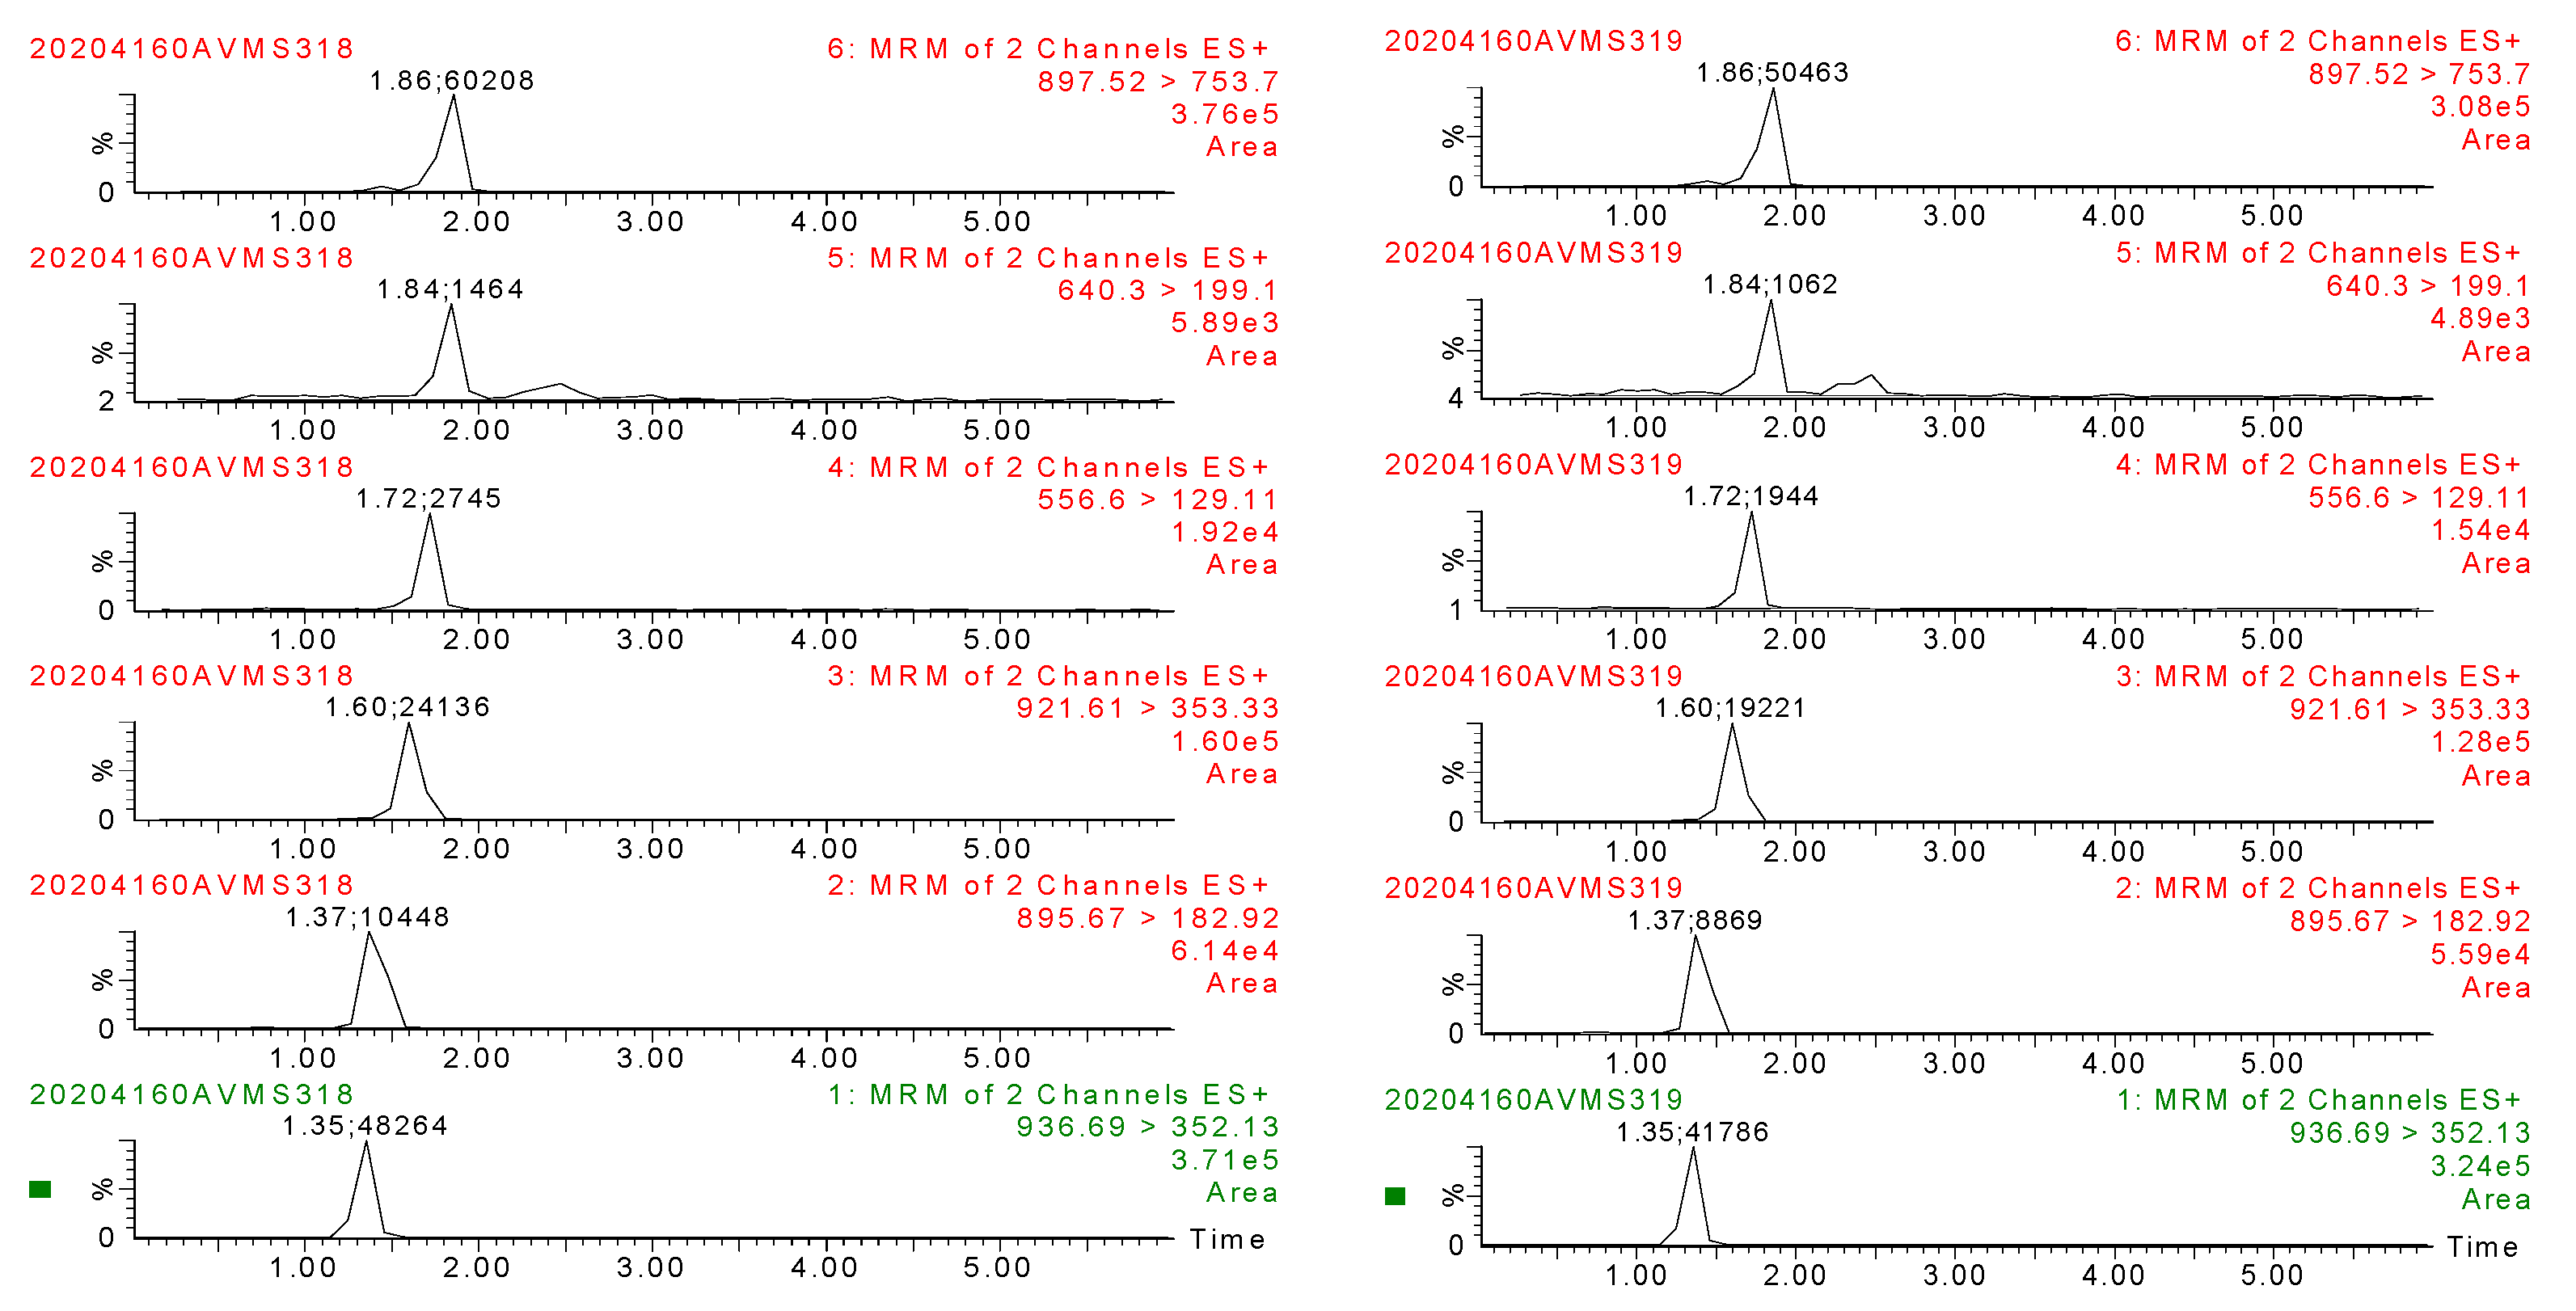
2.4.1. Specificity
2.4.2. Linearity
2.4.3. Accuracy and Precision
2.4.4. Limit of Detection (LOD)
3. Results and Discussion
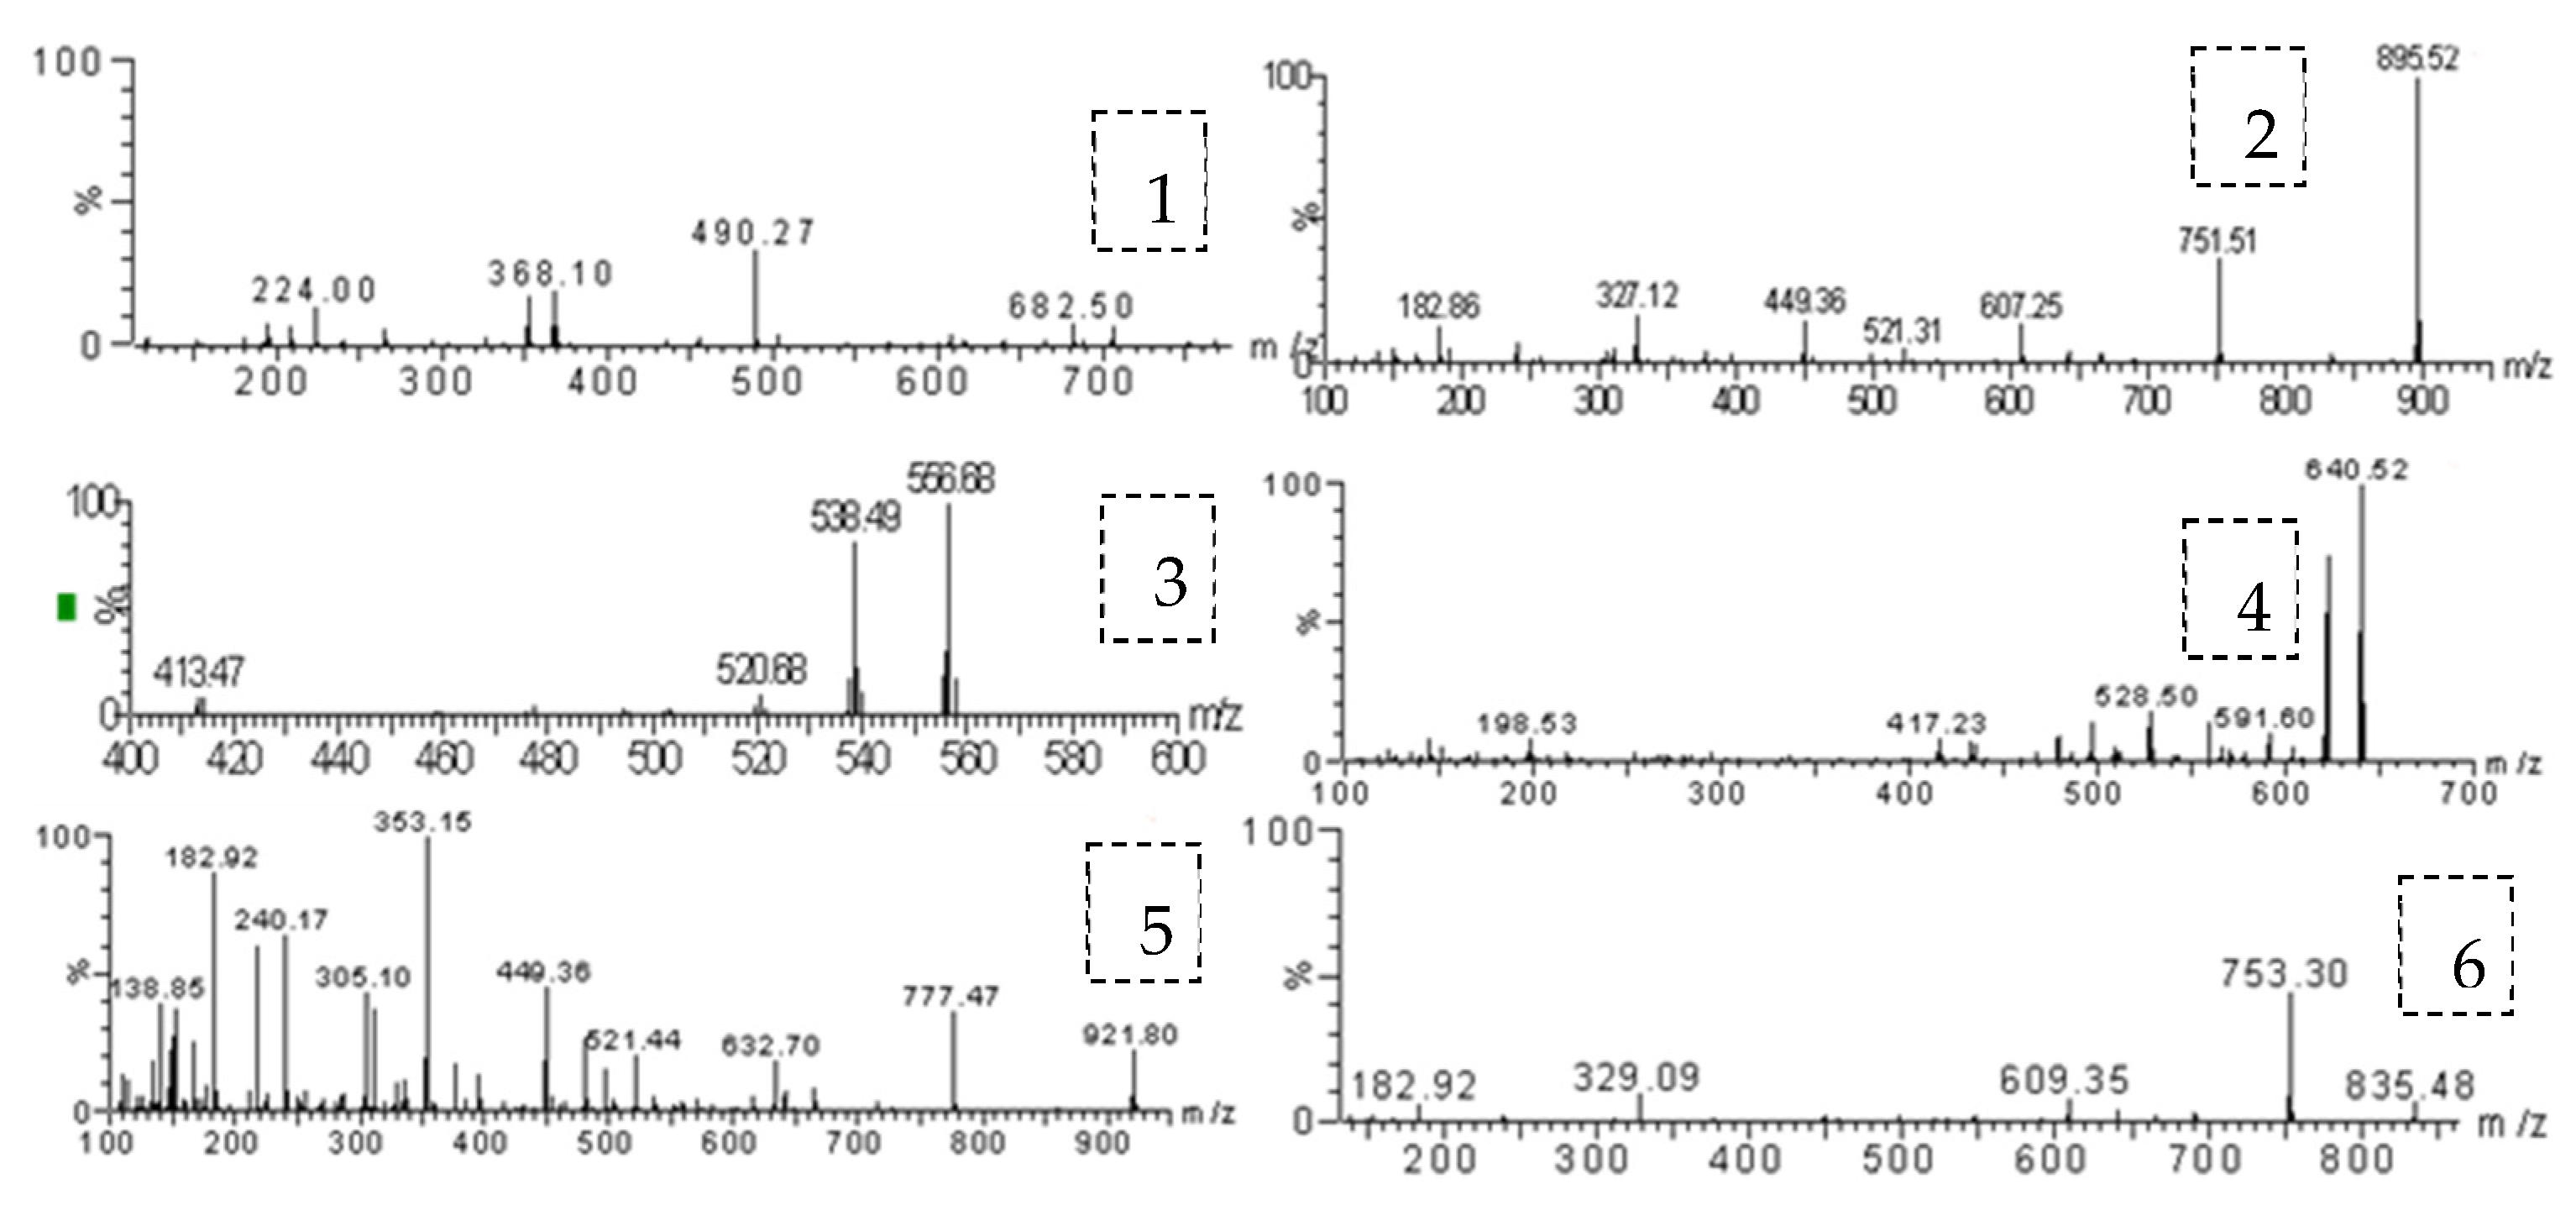
3.1. Optimization of Mass Conditions
3.2. Optimization of Sample Preparation
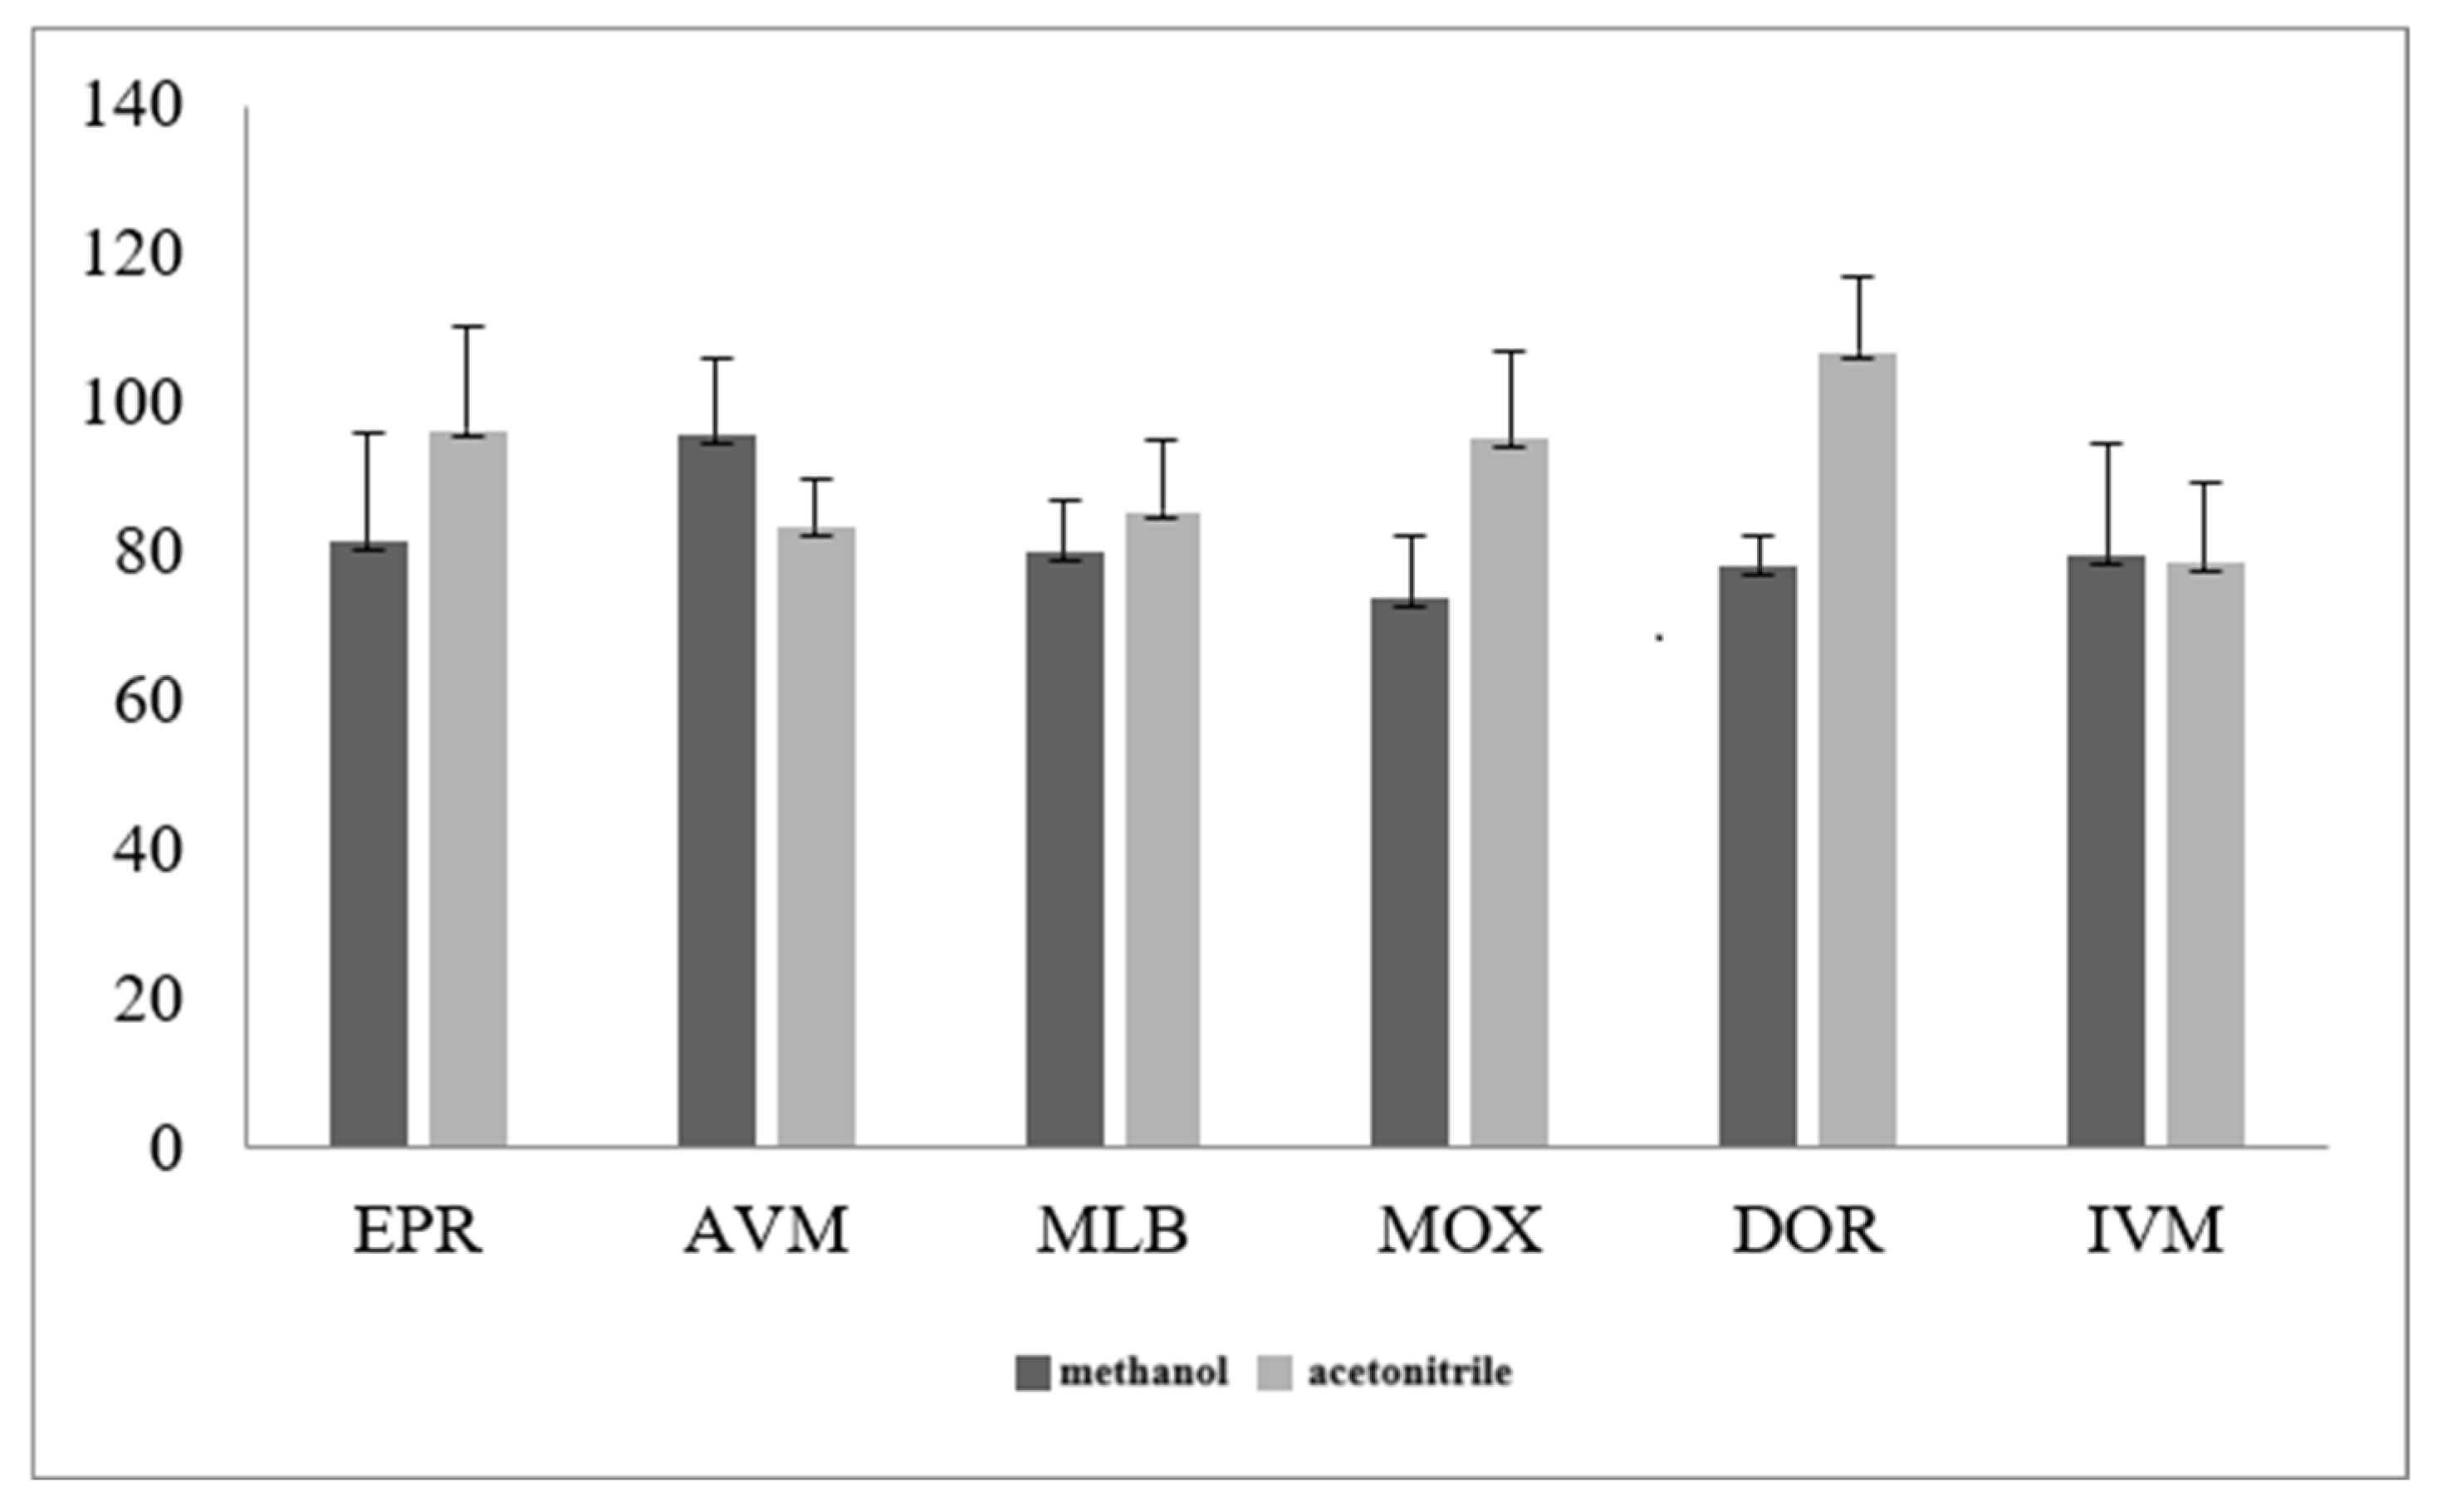
3.2.1. Optimization of Sample Extraction Solution
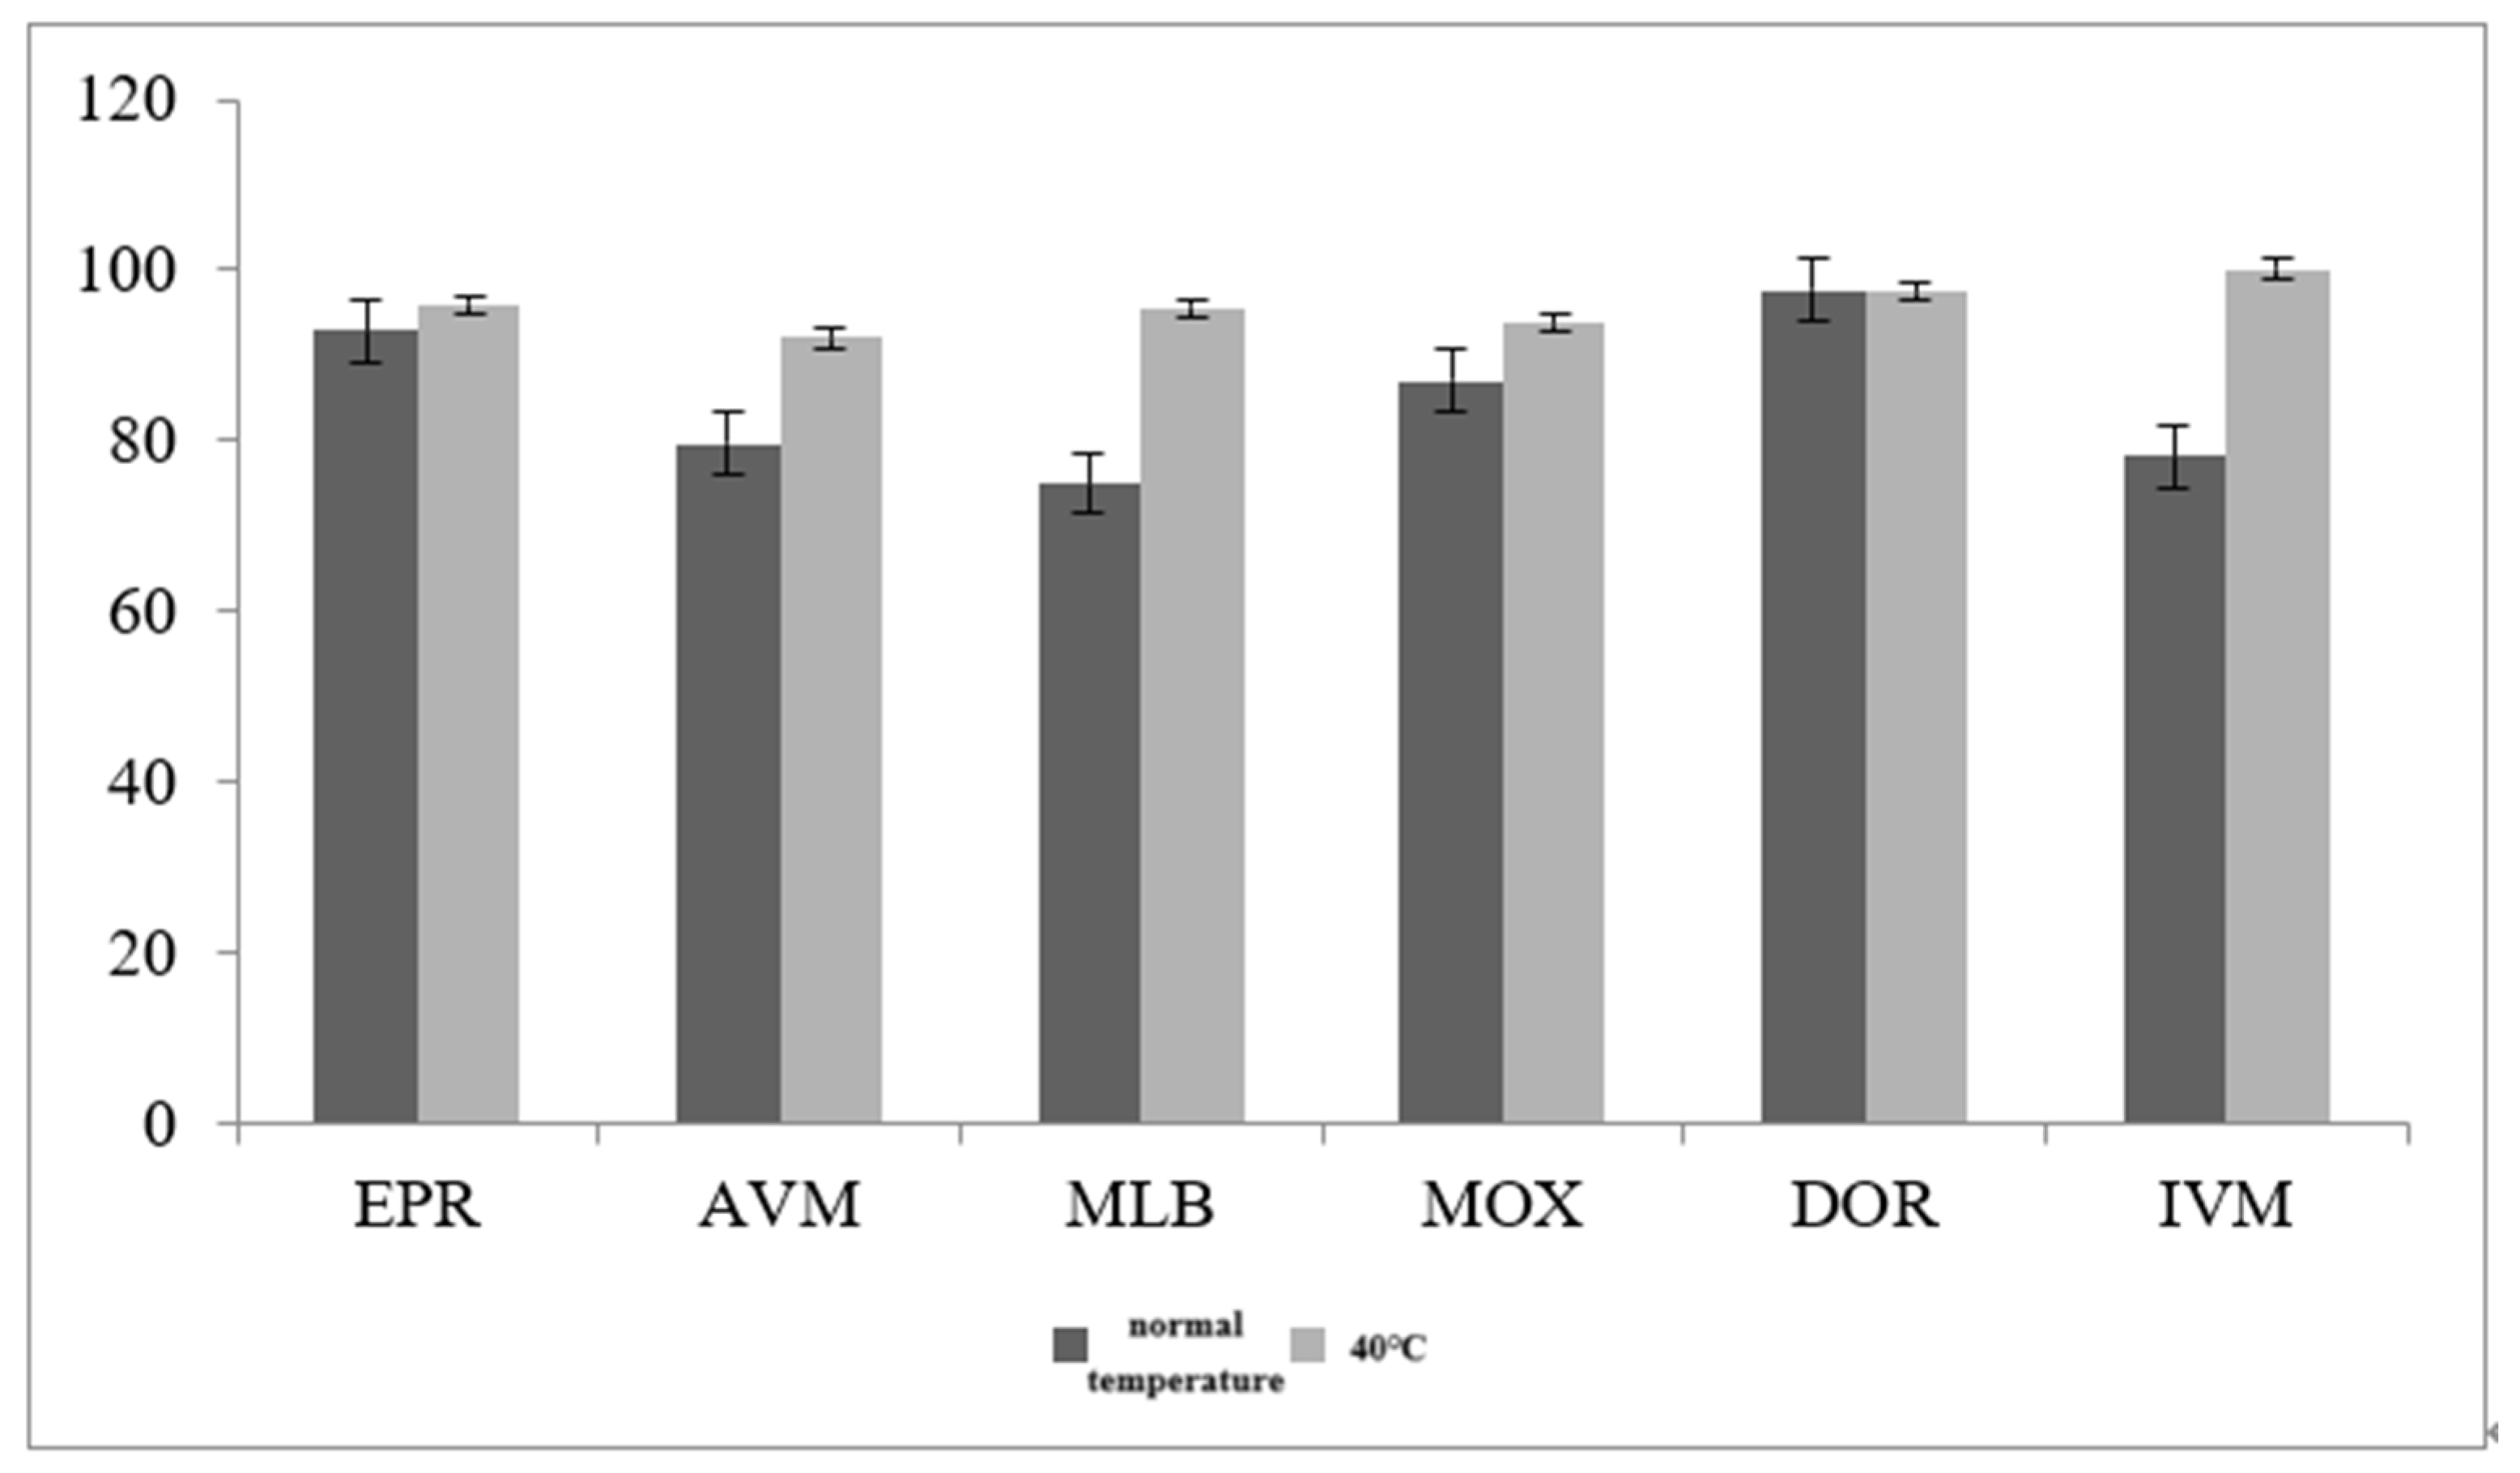
3.2.2. Optimization of Sample Extraction Temperature
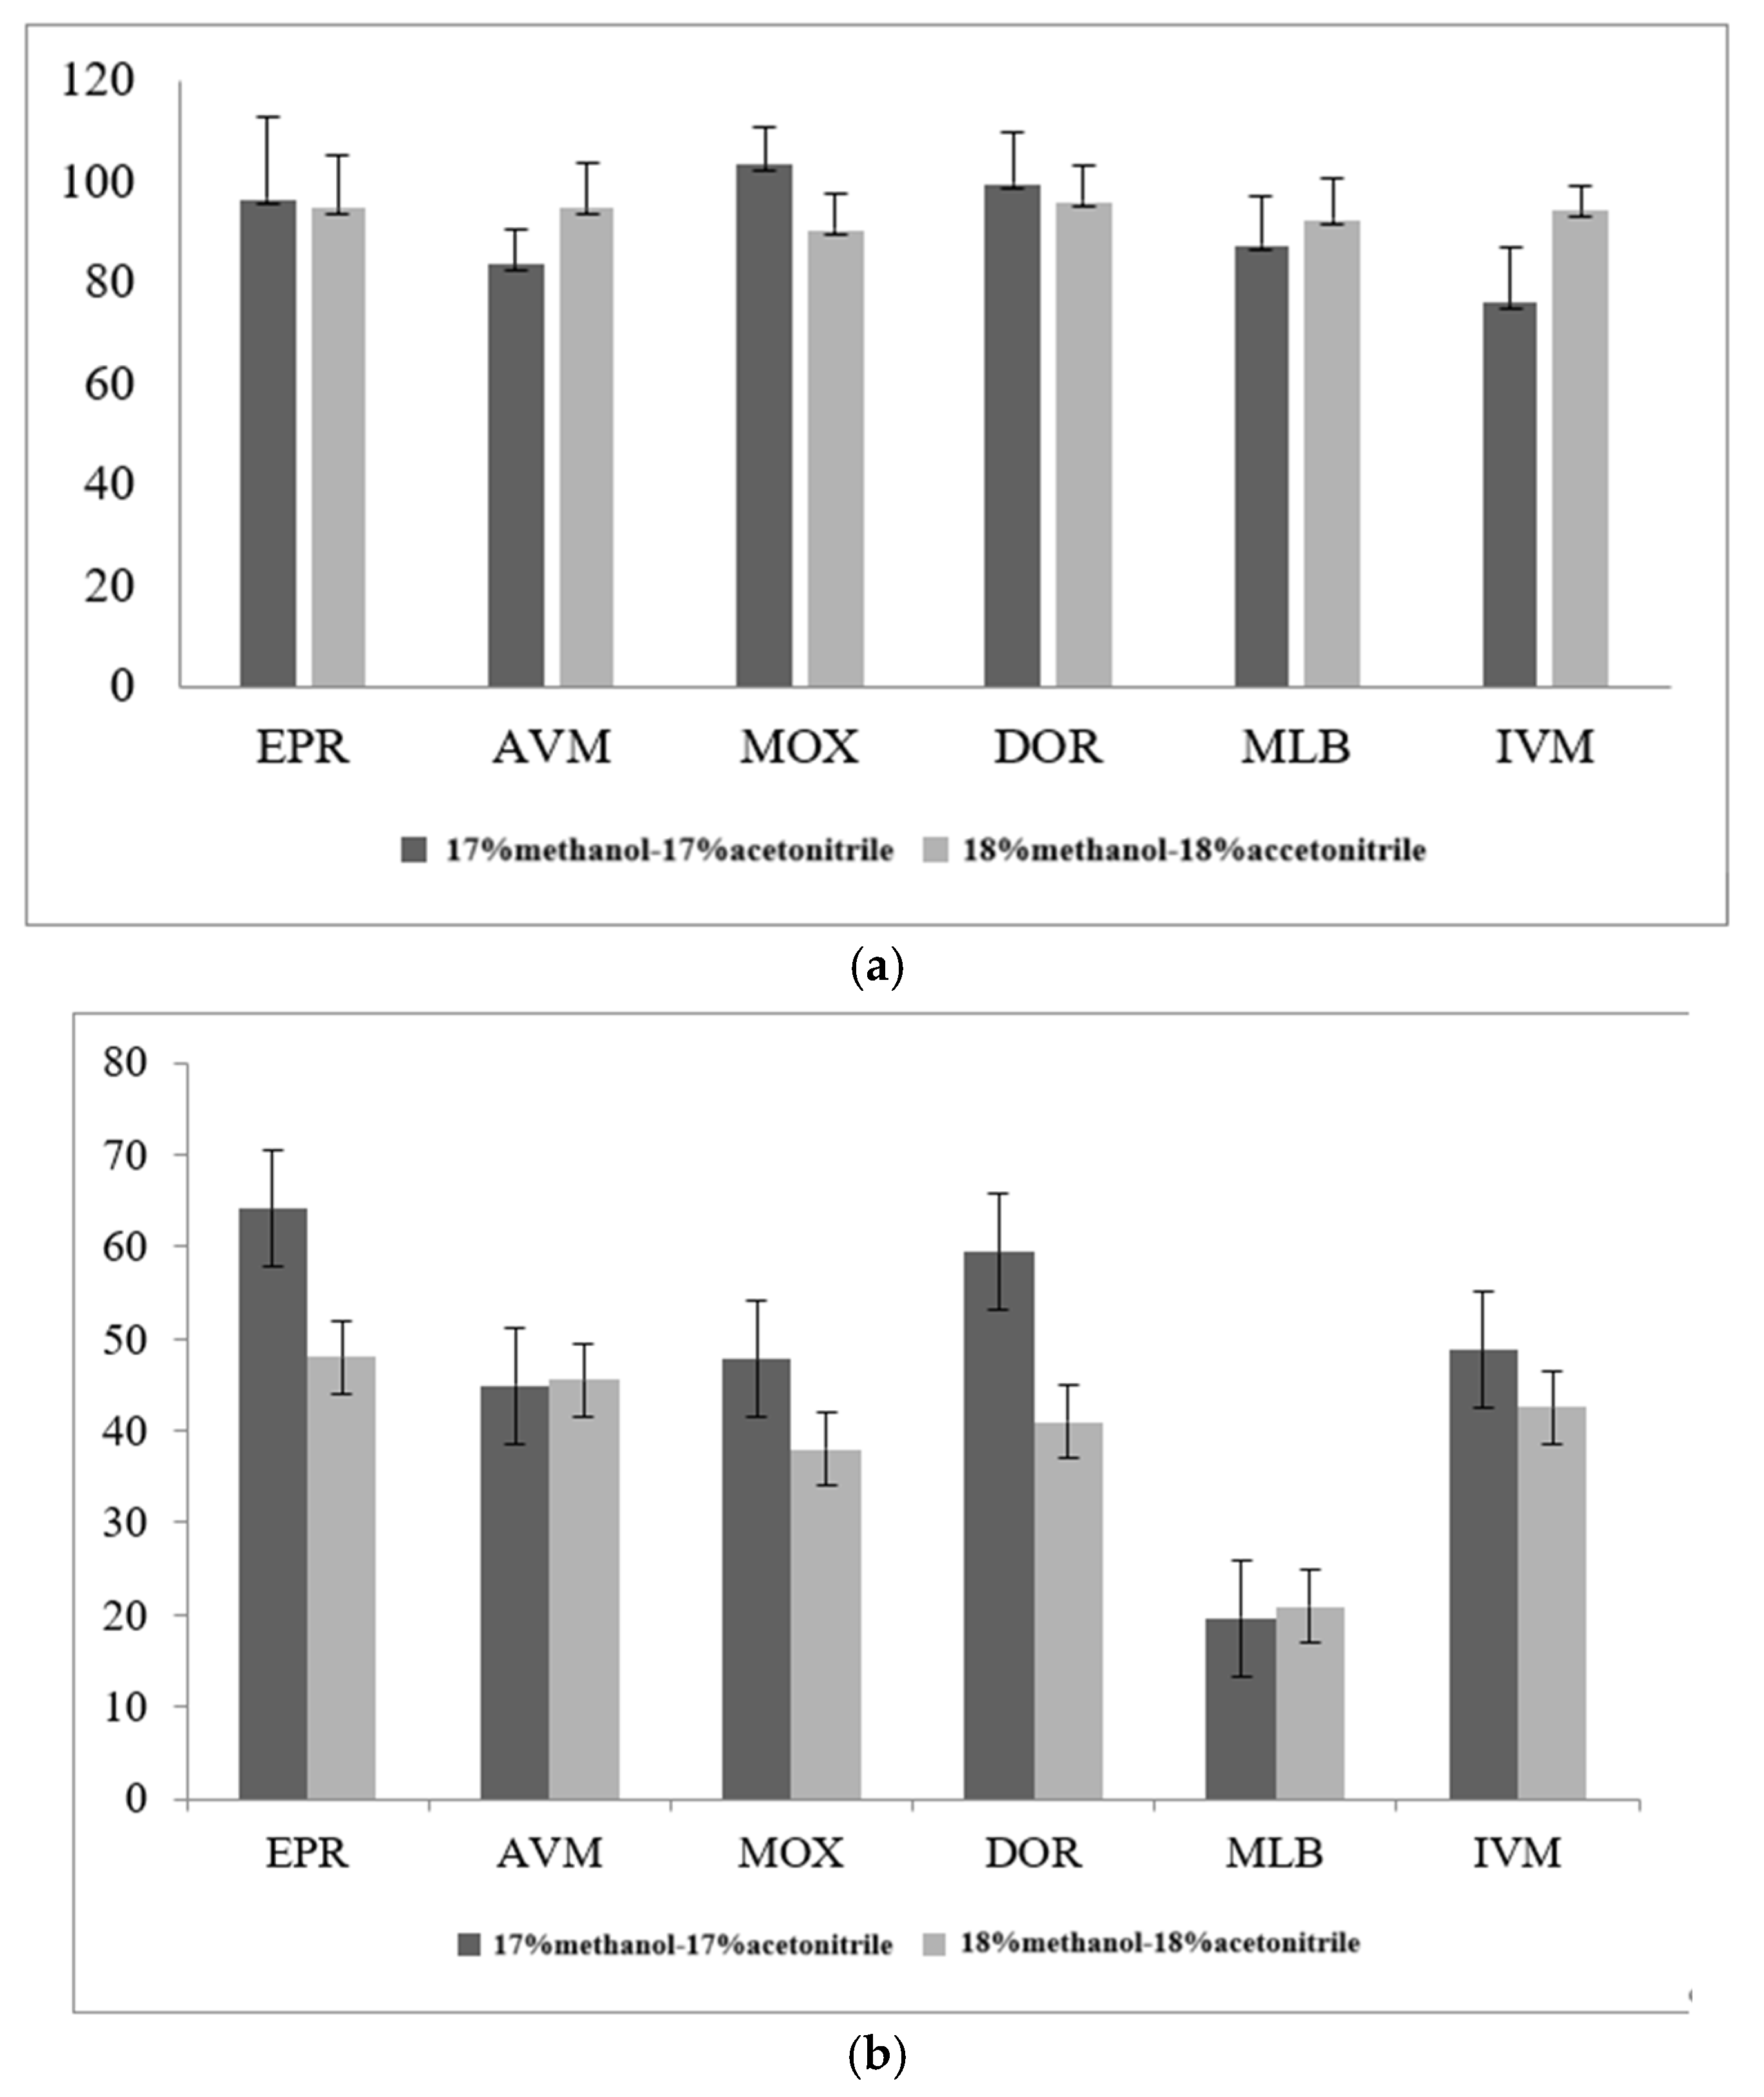
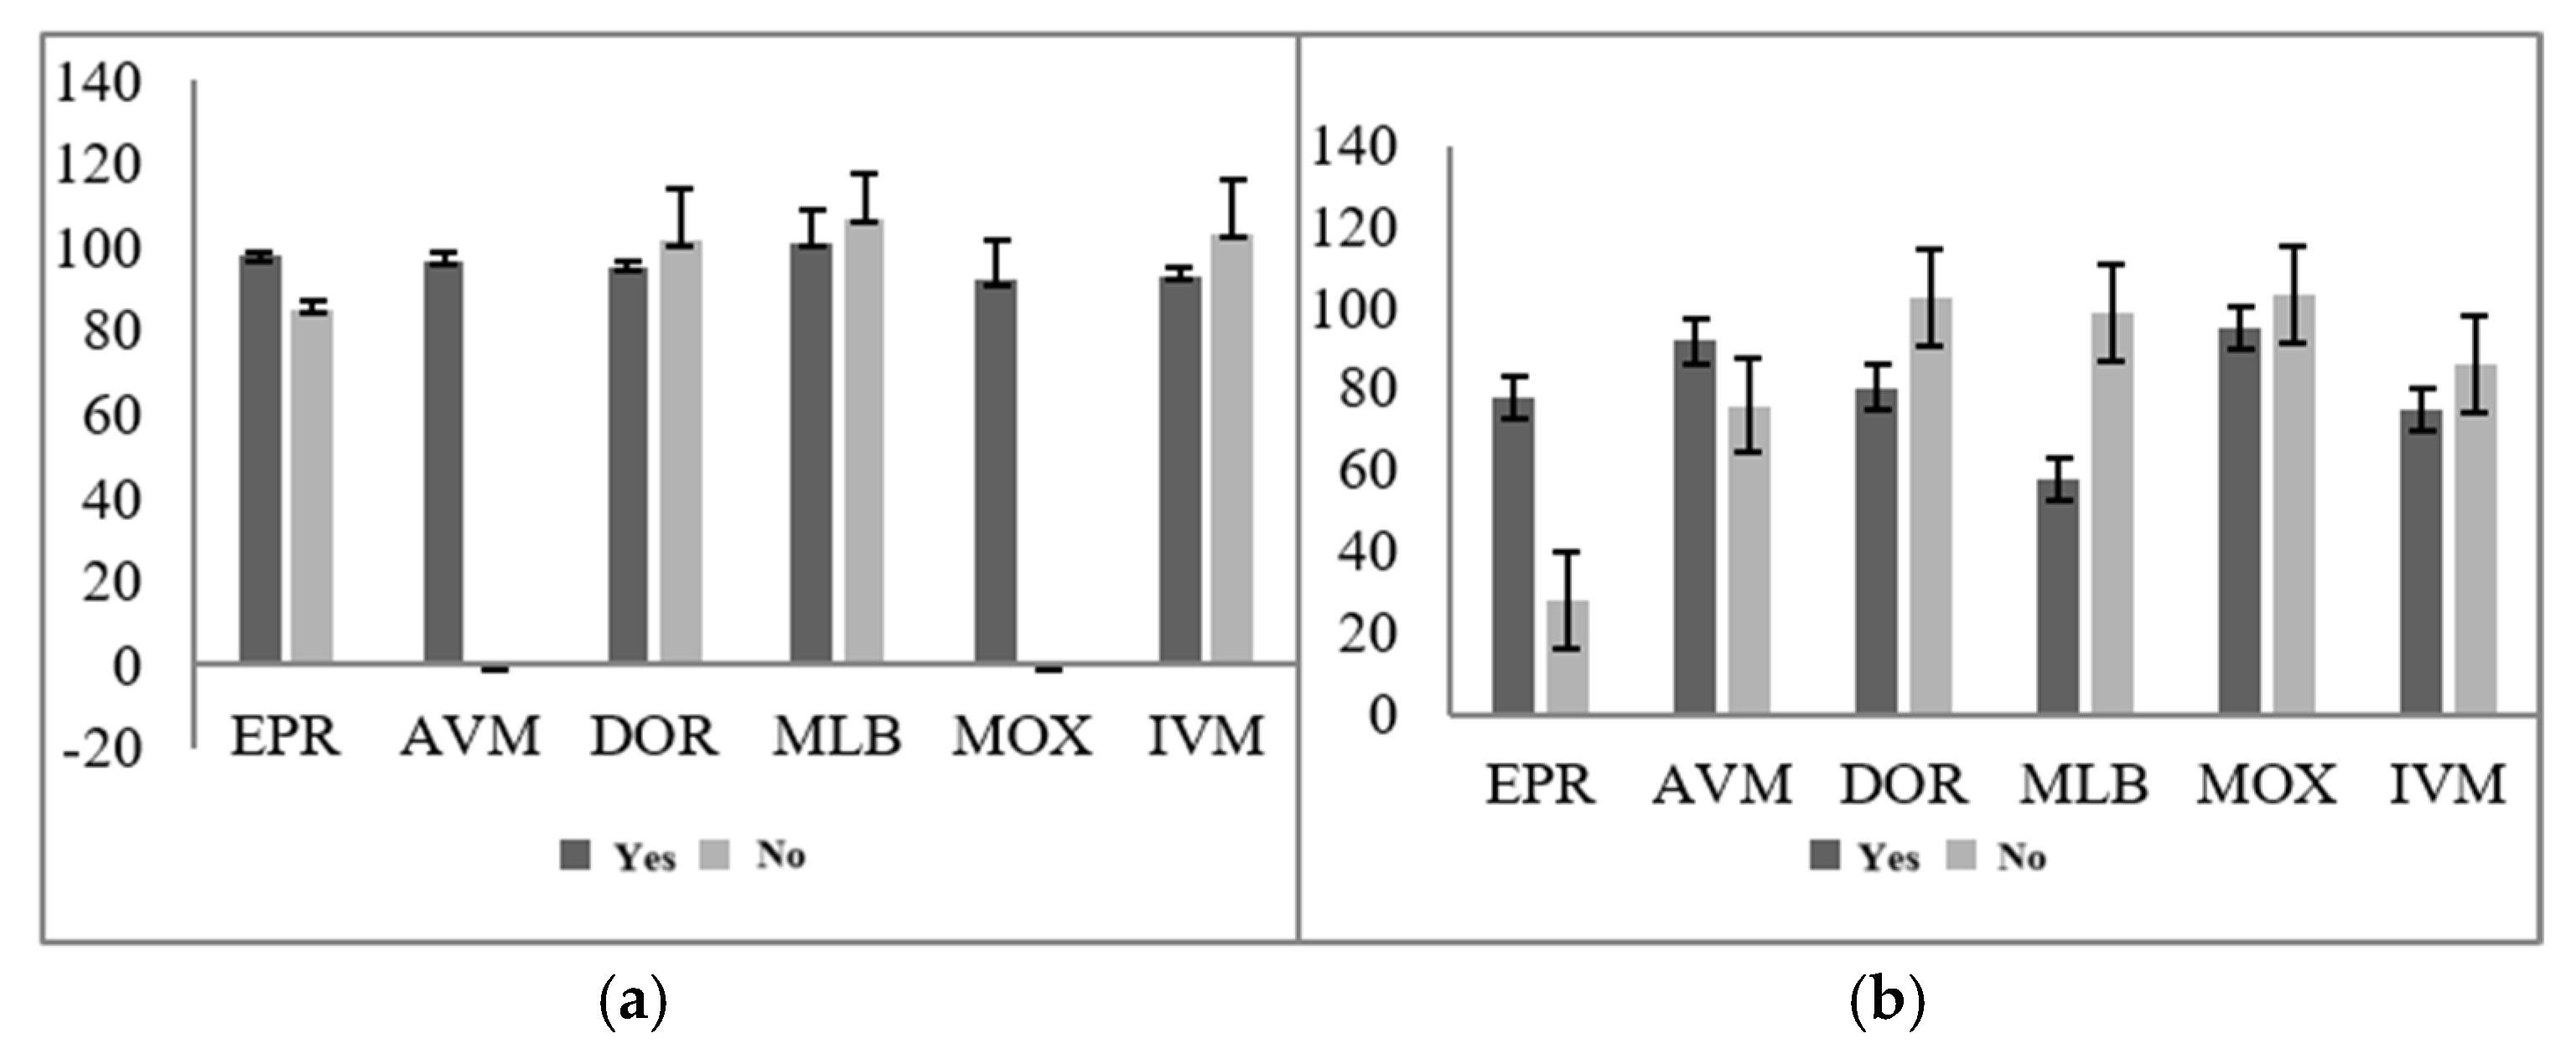
3.2.3. Optimization of Purification Conditions of Solid-Phase Purification Column
3.2.4. Improvement of Sample Preparation Conditions
3.3. Method Validation
4. Conclusions
Author Contributions
Funding
Institutional Review Board Statement
Informed Consent Statement
Data Availability Statement
Acknowledgments
Conflicts of Interest
References
- Lespine, A. Lipid-like properties and pharmacology of the anthelmintic macrocyclic lactones. Expert Opin. Drug Metab. Toxicol. 2013, 9, 1581–1595. [Google Scholar] [CrossRef] [PubMed]
- Rúbies, A.; Antkowiak, S.; Granados, M.; Companyó, R.; Centrich, F. Determination of avermectins: A QuEChERS approach to the analysis of food samples. Food Chem. 2015, 181, 57–63. [Google Scholar] [CrossRef] [PubMed]
- Merola, V.M.; Eubig, P.A. Toxicology of avermectins and milbemycins (macrocylic lactones) and the role of P-glycoprotein in dogs and cats. Vet. Clin. N. Am. Small Anim. Pract. 2012, 42, 313–333. [Google Scholar] [CrossRef]
- Bai, S.H.; Ogbourne, S. Eco-toxicological effects of the avermectin family with a focus on abamectin and ivermectin. Chemosphere 2016, 154, 204–214. [Google Scholar] [CrossRef]
- GB 5009.295-2023; General Rules for Validation of Chemical Analytical Methods. National Food Safety Standard: Beijing, China, 2023.
- Inoue, K.; Yoshimi, Y.; Hino, T.; Oka, H. Simultaneous determination of avermectins in bovine tissues by LC-MS/MS. J. Sep. Sci. 2009, 32, 3596–3602. [Google Scholar] [CrossRef] [PubMed]
- Wang, F.; Chen, J.; Cheng, H.; Tang, Z.; Zhang, G.; Niu, Z.; Pang, S.; Wang, X.; Lee, F.S. Multi-residue method for the confirmation of four avermectin residues in food products of animal origin by ultra-performance liquid chromatography-ta ndem mass spectrometry. Food Addit. Contam. Part A Chem. Anal. Control Expo. Risk Assess. 2011, 28, 627–639. [Google Scholar] [CrossRef]
- Zhang, H.-X.; Lu, W.; Xia, H.; Gong, Y.; Peng, X.-T.; Feng, Y.-Q. Rapid and Sensitive Detection of Avermectin Residues in Edible Oils by Magnetic Solid-Phase Extraction Combined with Ultra-High-Pressure Liquid C hromatography-Tandem Mass Spectrometry. Food Anal. Methods 2017, 10, 3201–3208. [Google Scholar] [CrossRef]
- Holčapek, M.; Jirásko, R.; Lísa, M. Recent developments in liquid chromatography-mass spectrometry and related techniques. J. Chromatogr. A 2012, 1259, 3–15. [Google Scholar] [CrossRef]
- Korfmacher, W.A. Principles and applications of LC-MS in new drug discovery. Drug Discov. Today 2005, 10, 1357–1367. [Google Scholar] [CrossRef]
- Taylor, P.J. Matrix effects: The Achilles heel of quantitative high-performance liquid chromatography–electrospray–tandem mass spectrometry. Clin. Biochem. 2005, 38, 328–334. [Google Scholar] [CrossRef]
- Van De Steene, J.C.; Lambert, W.E. Comparison of matrix effects in HPLC-MS/MS and UPLC-MS/MS analysis of nine basic pharmaceuticals in surface waters. J. Am. Soc. Mass Spectrom. 2008, 19, 713–718. [Google Scholar] [CrossRef] [PubMed]
- Ozdemir, N.; Kahraman, T. Rapid confirmatory analysis of avermectin residues in milk by liquid chromatography tandem mass spectrometry. J Food Drug Anal. 2016, 24, 90–94. [Google Scholar] [CrossRef]
- Zhan, J.; Zhong, Y.Y.; Yu, X.J.; Peng, J.F.; Chen, S.; Yin, J.Y.; Zhang, J.J.; Zhu, Y. Multi-class method for determination of veterinary drug residues and other contaminants in infant formula by ultra performance liquid chromatography- tandem mass spectrometry. Food Chem. 2013, 138, 827–834. [Google Scholar] [CrossRef]
- Rübensam, G.; Barreto, F.; Hoff, R.B.; Pizzolato, T.M. Determination of avermectin and milbemycin residues in bovine muscle by liquid chromatography-tandem mass spectrometry and fluorescence detection using solvent extraction and low temperature cleanup. Food Control 2013, 29, 55–60. [Google Scholar] [CrossRef]
- Wang, C.; Wang, Z.; Jiang, W.; Mi, T.; Shen, J. A monoclonal antibody-based ELISA for multiresidue determination of avermectins in milk. Molecules 2012, 17, 7401–7414. [Google Scholar] [CrossRef] [PubMed]
- De Oliveira Ferreira, F.; Rodrigues-Silva, C.; Rath, S. On-line solid-phase extraction-ultra high performance liquid chromatography-tandem mass spectrometry for the determination of avermectins and milbemy cin in soils. J. Chromatogr. A 2016, 1471, 118–125. [Google Scholar] [CrossRef]
- Matuszewski, B.K.; Constanzer, M.L.; Chavez-Eng, C.M. Strategies for the assessment of matrix effect in quantitative bioanalytical methods based on HPLC− MS/MS. Anal. Chem. 2003, 75, 3019–3030. [Google Scholar] [CrossRef] [PubMed]
- Boti, V.; Martinaiou, P.; Gkountouras, D.; Albanis, T. Target and suspect screening approaches for the identification of emerging and other contaminants in fish feeds using high resolution mass spectrometry. Environ. Res. 2024, 251, 118739. [Google Scholar] [CrossRef]
- Tao, Y.; Yu, G.; Chen, D.; Pan, Y.; Liu, Z.; Wei, H.; Peng, D.; Huang, L.; Wang, Y.; Yuan, Z. Determination of 17 macrolide antibiotics and avermectins residues in meat with accelerated solvent extraction by liquid chromatography-tandem mass s pectrometry. J. Chromatogr. B Anal. Technol. Biomed. Life Sci. 2012, 897, 64–71. [Google Scholar] [CrossRef]
- Ramos, L.; Kristenson, E.M.; Brinkman, U.T. Current use of pressurised liquid extraction and subcritical water extraction in environmental analysis. J. Chromatogr. A 2002, 975, 3–29. [Google Scholar] [CrossRef]
- Hennion, M.C. Solid-phase extraction: Method development, sorbents, and coupling with liquid chromatography. J. Chromatogr. A 1999, 856, 3–54. [Google Scholar] [CrossRef] [PubMed]
- Senta, I.; Krizman-Matasic, I.; Terzic, S.; Ahel, M. Comprehensive determination of macrolide antibiotics, their synthesis intermediates and transformation products in wastewater effluents and ambient waters by liquid chromatography-tandem mass spectrometry. J. Chromatogr. A 2017, 1509, 60–68. [Google Scholar] [CrossRef] [PubMed]
- Anastassiades, M.; Lehotay, S.J.; Stajnbaher, D.; Schenck, F.J. Fast and easy multiresidue method employing acetonitrile extraction/partitioning and “dispersive solid-phase extraction” for the determination of pesticide residues in produce. J. AOAC Int. 2003, 86, 412–431. [Google Scholar] [CrossRef] [PubMed]
- Subirats, X.; Reinstadler, S.; Porras, S.P.; Raggi, M.A.; Kenndler, E. Comparison of methanol and acetonitrile as solvents for the separation of sertindole and its major metabolites by capillary zone electrophoresis. Electrophoresis 2005, 26, 3315–3324. [Google Scholar] [CrossRef]
- Gonzalez-Ruiz, V.; León, A.G.; Olives, A.I.; Martin, M.A.; Menendez, J.C. Eco-friendly liquid chromatographic separations based on the use of cyclodextrins as mobile phase additives. Green Chem. 2011, 13, 115–126. [Google Scholar] [CrossRef]
- Maštovská, K.; Lehotay, S.J. Evaluation of common organic solvents for gas chromatographic analysis and stability of multiclass pesticide residues. J. Chromatogr. A 2004, 1040, 259–272. [Google Scholar] [CrossRef]
- European Commission. Commission Decision 2002/657/EC: Implementing Council Directive 96/23/EC Concerning the Performance of Analytical Methods and the Interpretation of Results; European Commission: Brussels, Belgium, 2002. [Google Scholar]


| Time (min) | Solvent A (%) | Solvent B (%) |
|---|---|---|
| 0 | 15 | 85 |
| 0.5 | 15 | 85 |
| 2 | 3 | 97 |
| 4 | 3 | 97 |
| 5 | 15 | 85 |
| 6 | 15 | 85 |
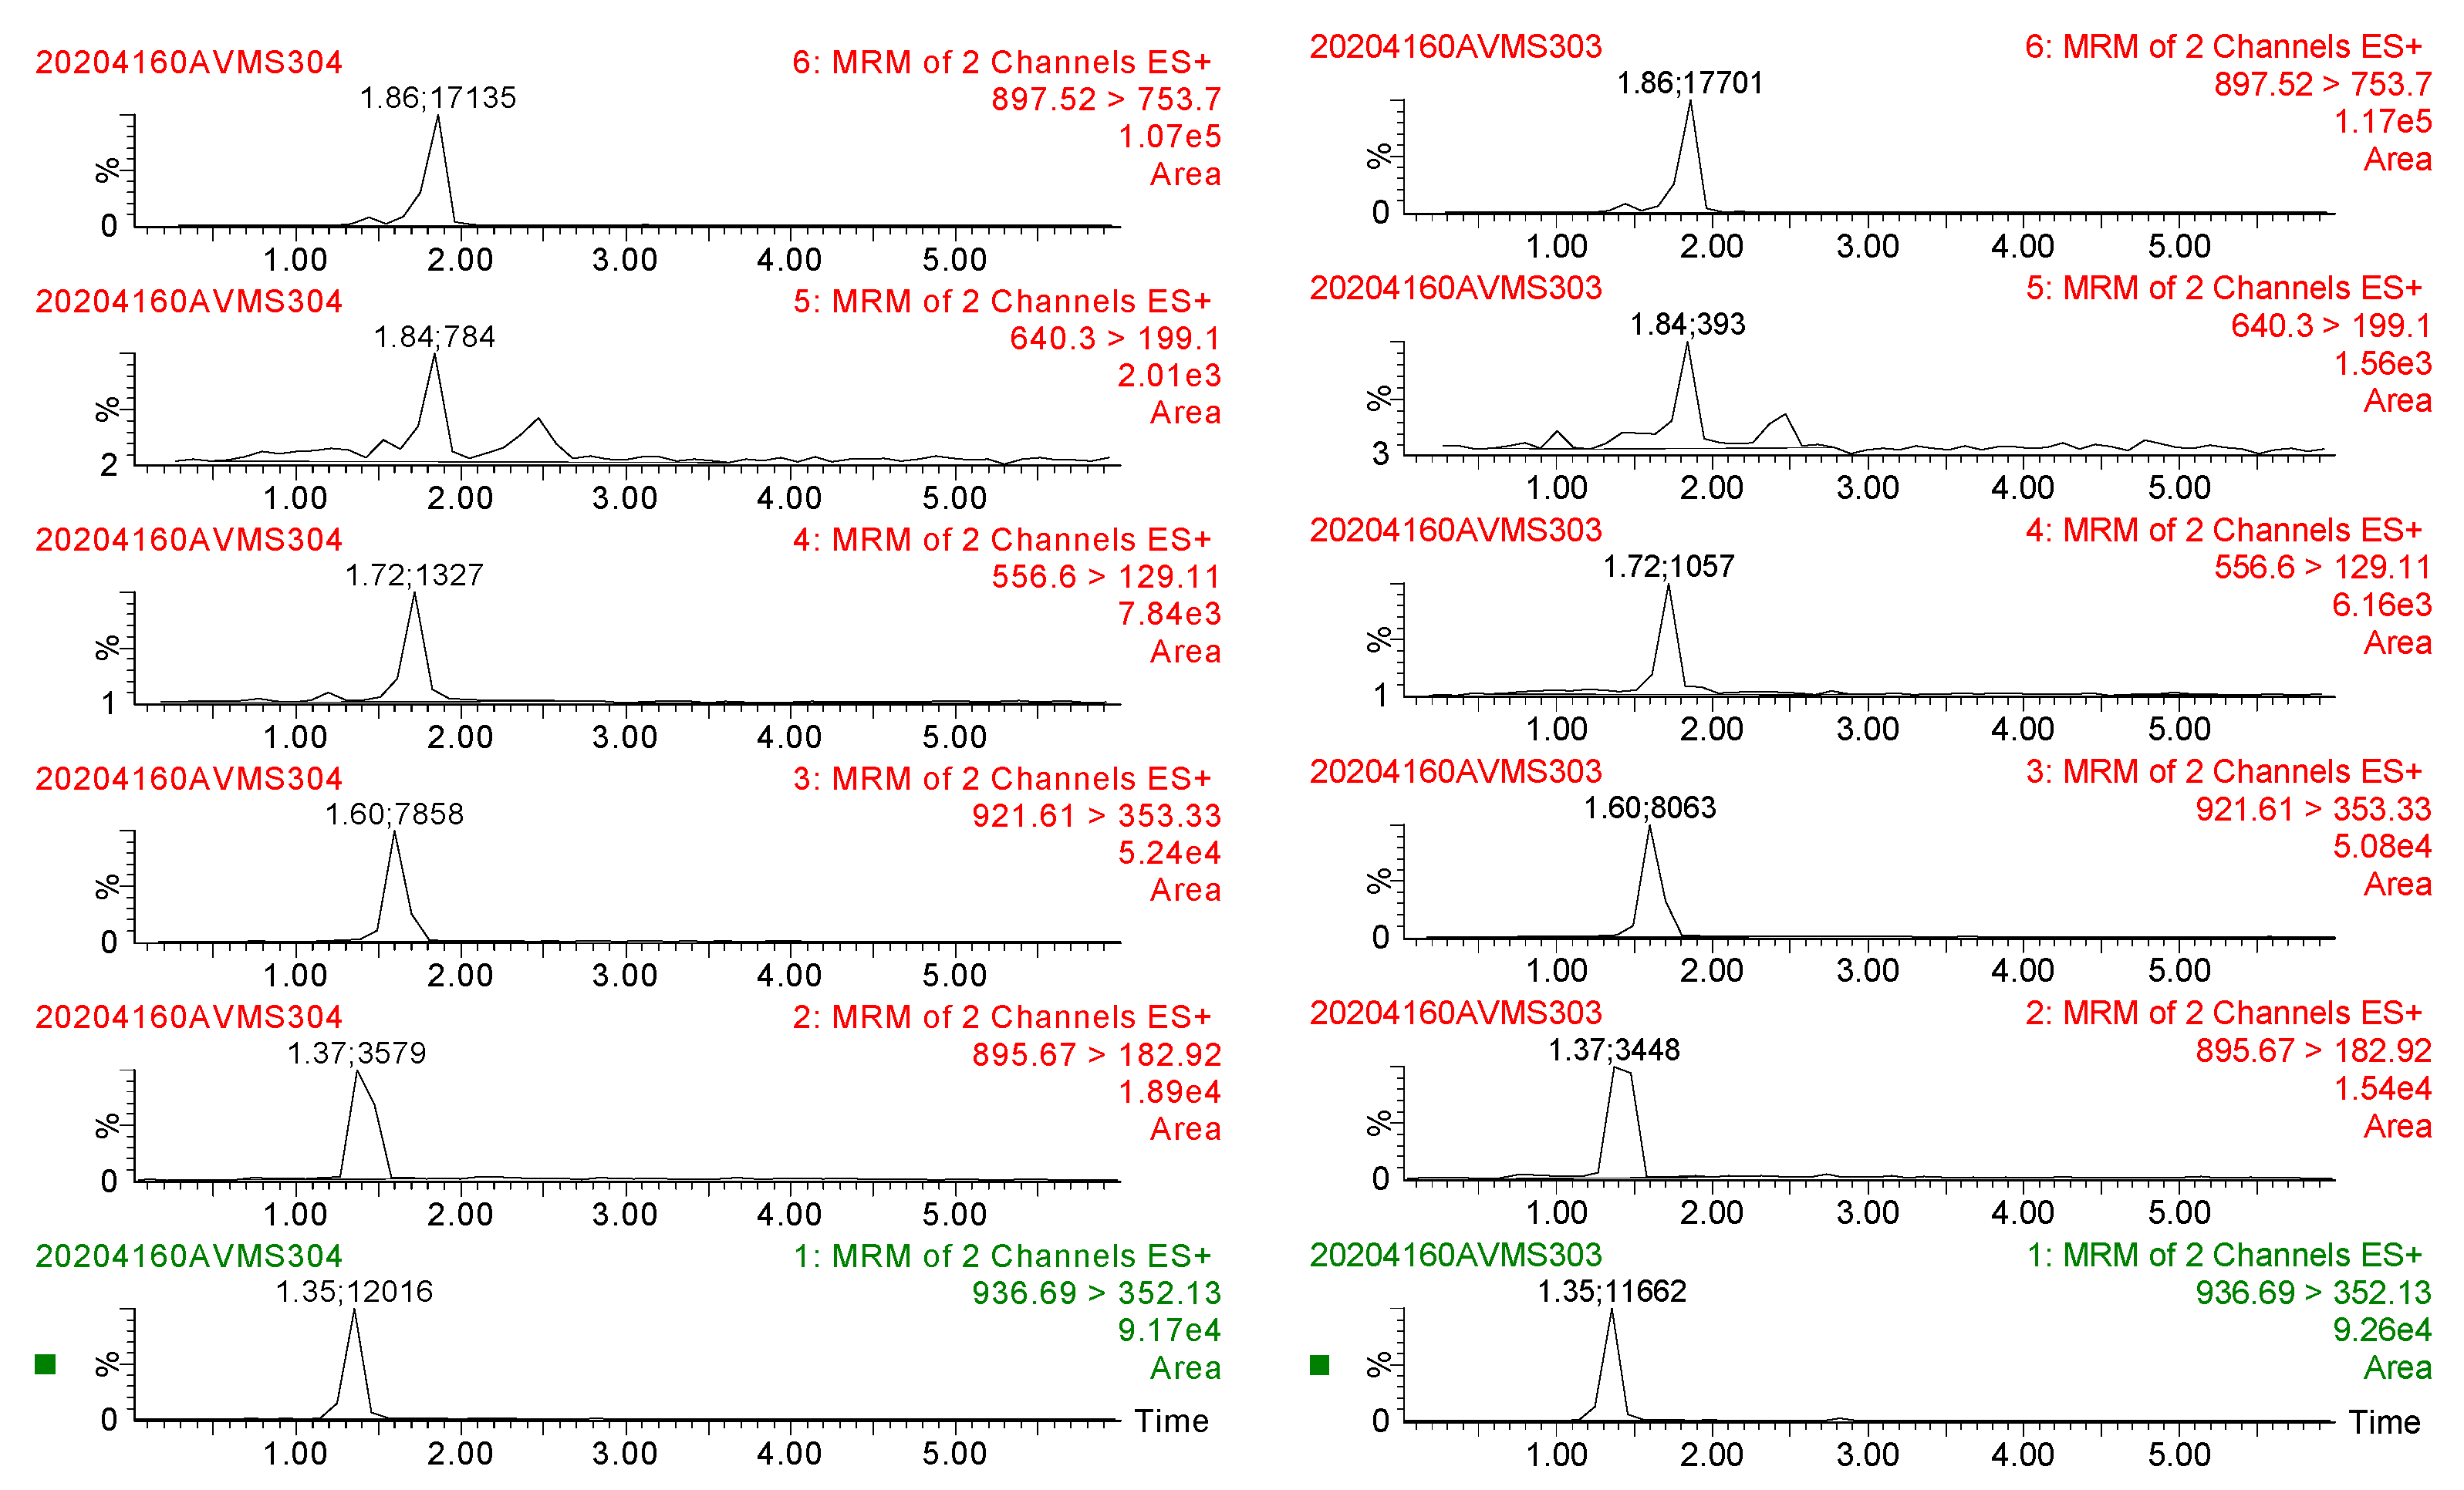
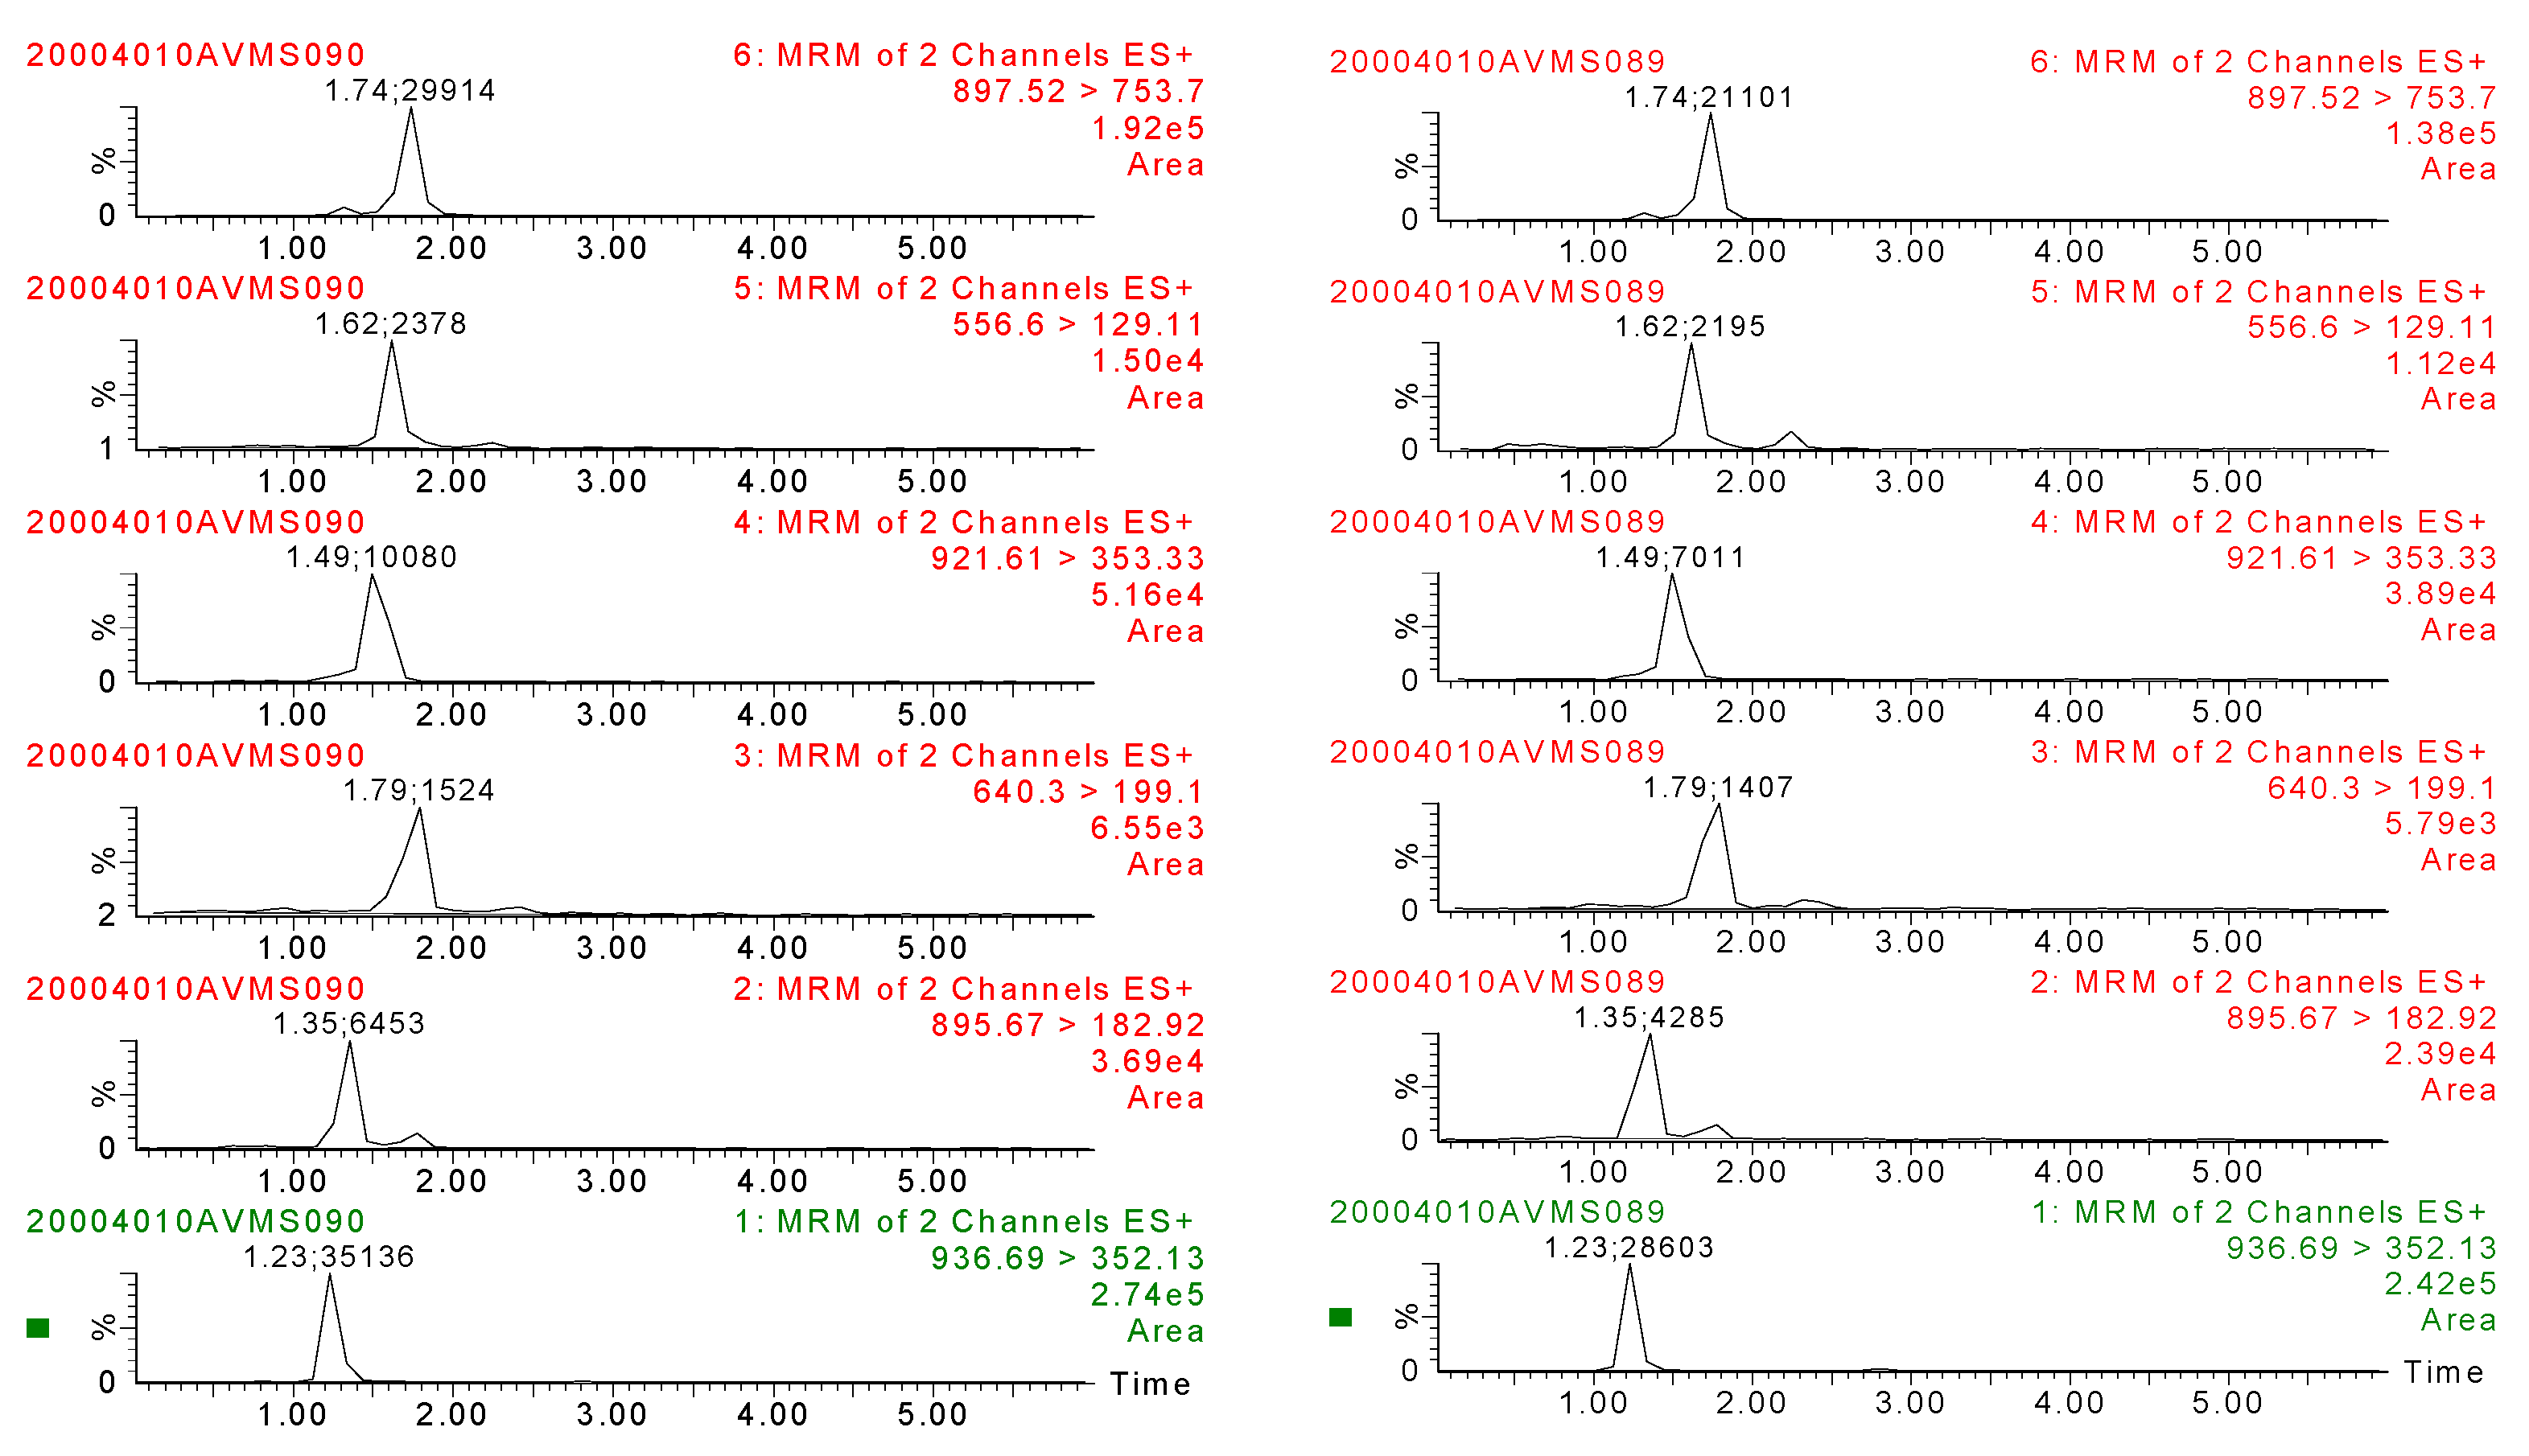
| Analyte | Parent Ion (m/z) | Daughter Ion (m/z) | Taper Hole Voltage (V) | Collision Energy (eV) |
|---|---|---|---|---|
| Acetyl avermectin | 936.69 | 352.13 a/490.27 | 70 | 60/60 |
| Abamectin B1a | 895.67 | 182.92 a/327.40 | 70 | 60/60 |
| Doramectin | 921.61 | 353.33 a/777.70 | 70 | 50/50 |
| Milbemycin | 556.60 | 129.11 a/169.33 | 40 | 40/40 |
| Moxidectin | 640.30 | 199.10 a/528.30 | 30 | 25/9 |
| Ivermectin H2B1a | 897.52 | 609.35/753.70 a | 70 | 45/45 |
| Feed | Added Concentration (μg/g) | Recovery Rate (%) | Intra Batch Coefficient of Variation (%) | Inter Batch Coefficient of Variation (%) |
|---|---|---|---|---|
| Chicken compound feed | 0.05 | 91.27 | 2.09 | 2.43 |
| 0.5 | 90.38 | 3.51 | 4.75 | |
| 5.0 | 93.19 | 3.32 | 4.70 | |
| Concentrated chicken feed | 0.1 | 92.44 | 7.74 | 8.03 |
| 1.0 | 90.06 | 1.98 | 3.94 | |
| 10.0 | 95.25 | 6.08 | 6.52 | |
| Chicken premix feed | 0.5 | 91.77 | 5.55 | 6.18 |
| 5.0 | 95.26 | 4.70 | 5.35 | |
| 50.0 | 97.72 | 3.80 | 4.90 | |
| Pig compound feed | 0.05 | 87.13 | 4.95 | 5.17 |
| 0.5 | 82.75 | 4.67 | 4.85 | |
| 5.0 | 85.48 | 2.88 | 4.66 | |
| Concentrated pig feed | 0.1 | 81.17 | 9.97 | 8.74 |
| 1.0 | 83.76 | 4.85 | 11.76 | |
| 10.0 | 88.45 | 5.72 | 9.28 | |
| Pig premix feed | 0.5 | 98.07 | 10.14 | 10.59 |
| 5.0 | 96.82 | 7.24 | 8.82 | |
| 50.0 | 95.44 | 5.08 | 6.75 | |
| Vitamin supplements | 0.05 | 90.50 | 4.37 | 5.55 |
| 0.5 | 91.73 | 6.42 | 7.12 | |
| 5.0 | 88.42 | 3.79 | 4.71 | |
| Cattle concentrate | 0.1 | 85.78 | 7.90 | 10.76 |
| 1.0 | 83.12 | 11.26 | 12.55 | |
| 10.0 | 81.94 | 9.97 | 10.87 |
| Feed | Added Concentration (μg/g) | Recovery Rate (%) | Intra Batch Coefficient of Variation (%) | Inter Batch Coefficient of Variation (%) |
|---|---|---|---|---|
| Chicken compound feed | 0.05 | 89.33 | 3.42 | 4.57 |
| 0.5 | 87.36 | 4.18 | 5.90 | |
| 5.0 | 86.10 | 4.07 | 5.82 | |
| Concentrated chicken feed | 0.1 | 91.52 | 8.46 | 9.26 |
| 1.0 | 87.77 | 3.70 | 4.51 | |
| 10.0 | 90.45 | 7.85 | 7.95 | |
| Chicken premix feed | 0.5 | 89.08 | 7.17 | 8.62 |
| 5.0 | 93.26 | 5.63 | 6.38 | |
| 50.0 | 95.36 | 4.85 | 6.07 | |
| Pig compound feed | 0.05 | 85.37 | 5.76 | 8.42 |
| 0.5 | 80.42 | 8.02 | 9.65 | |
| 5.0 | 83.55 | 3.94 | 5.74 | |
| Concentrated pig feed | 0.1 | 82.73 | 10.11 | 11.66 |
| 1.0 | 80.96 | 7.05 | 8.09 | |
| 10.0 | 85.77 | 7.29 | 8.75 | |
| Pig premix feed | 0.5 | 96.64 | 11.33 | 10.93 |
| 5.0 | 95.28 | 5.82 | 7.80 | |
| 50.0 | 90.78 | 6.78 | 9.48 | |
| Vitamin supplements | 0.05 | 87.72 | 5.46 | 6.75 |
| 0.5 | 86.66 | 7.39 | 8.82 | |
| 5.0 | 84.53 | 4.74 | 5.46 | |
| Cattle concentrate | 0.1 | 83.18 | 8.29 | 9.73 |
| 1.0 | 80.07 | 10.78 | 11.16 | |
| 10.0 | 80.22 | 10.32 | 11.49 |
| Feed | Added Concentration (μg/g) | Recovery Rate (%) | Intra Batch Coefficient of Variation (%) | Inter Batch Coefficient of Variation (%) |
|---|---|---|---|---|
| Chicken compound feed | 0.05 | 92.72 | 5.48 | 6.68 |
| 0.5 | 92.99 | 9.12 | 10.62 | |
| 5.0 | 95.58 | 7.06 | 8.37 | |
| Concentrated chicken feed | 0.1 | 94.09 | 5.55 | 6.90 |
| 1.0 | 95.51 | 8.17 | 9.54 | |
| 10.0 | 97.76 | 5.92 | 6.95 | |
| Chicken premix feed | 0.5 | 93.82 | 6.34 | 8.49 |
| 5.0 | 97.89 | 7.11 | 8.82 | |
| 50.0 | 98.80 | 4.65 | 5.79 | |
| Pig compound feed | 0.05 | 88.48 | 5.85 | 7.37 |
| 0.5 | 85.72 | 5.90 | 7.80 | |
| 5.0 | 87.97 | 5.36 | 7.72 | |
| Concentrated pig feed | 0.1 | 84.79 | 11.32 | 10.09 |
| 1.0 | 85.65 | 5.76 | 6.66 | |
| 10.0 | 90.29 | 6.80 | 7.82 | |
| Pig premix feed | 0.5 | 97.02 | 11.27 | 12.52 |
| 5.0 | 97.77 | 8.03 | 10.00 | |
| 50.0 | 96.64 | 6.22 | 8.43 | |
| Vitamin supplements | 0.05 | 92.70 | 5.72 | 6.07 |
| 0.5 | 90.84 | 7.94 | 8.86 | |
| 5.0 | 90.56 | 5.59 | 7.54 | |
| Cattle concentrate | 0.1 | 89.63 | 8.06 | 7.98 |
| 1.0 | 88.45 | 10.47 | 11.36 | |
| 10.0 | 83.74 | 10.12 | 13.38 |
| Feed | Added Concentration (μg/g) | Recovery Rate (%) | Intra Batch Coefficient of Variation (%) | Inter Batch Coefficient of Variation (%) |
|---|---|---|---|---|
| Chicken compound feed | 0.05 | 84.52 | 3.76 | 4.76 |
| 0.5 | 80.67 | 4.87 | 5.59 | |
| 5.0 | 83.99 | 5.98 | 6.80 | |
| Concentrated chicken feed | 0.1 | 87.75 | 9.18 | 10.03 |
| 1.0 | 85.08 | 3.75 | 5.59 | |
| 10.0 | 91.22 | 7.72 | 8.11 | |
| Chicken premix feed | 0.5 | 86.64 | 7.67 | 8.76 |
| 5.0 | 90.90 | 6.08 | 7.95 | |
| 50.0 | 95.57 | 9.92 | 11.04 | |
| Pig compound feed | 0.05 | 85.70 | 7.67 | 8.88 |
| 0.5 | 84.49 | 7.76 | 8.92 | |
| 5.0 | 86.19 | 5.61 | 6.64 | |
| Concentrated pig feed | 0.1 | 85.53 | 10.85 | 11.09 |
| 1.0 | 84.74 | 6.76 | 7.80 | |
| 10.0 | 85.07 | 6.70 | 7.92 | |
| Pig premix feed | 0.5 | 91.82 | 11.55 | 10.61 |
| 5.0 | 94.76 | 9.13 | 10.07 | |
| 50.0 | 93.80 | 6.60 | 7.53 | |
| Vitamin supplements | 0.05 | 88.56 | 7.34 | 8.57 |
| 0.5 | 87.79 | 7.89 | 8.86 | |
| 5.0 | 87.47 | 5.63 | 7.90 | |
| Cattle concentrate | 0.1 | 82.80 | 8.22 | 9.49 |
| 1.0 | 81.90 | 12.84 | 13.69 | |
| 10.0 | 80.93 | 11.48 | 12.25 |
| Feed | Added Concentration (μg/g) | Recovery Rate (%) | Intra Batch Coefficient of Variation (%) | Inter Batch Coefficient of Variation (%) |
|---|---|---|---|---|
| Chicken compound feed | 0.05 | 90.01 | 3.82 | 4.09 |
| 0.5 | 90.42 | 4.75 | 6.74 | |
| 5.0 | 95.55 | 5.78 | 6.92 | |
| Concentrated chicken feed | 0.1 | 90.18 | 9.07 | 10.38 |
| 1.0 | 83.64 | 5.57 | 7.72 | |
| 10.0 | 91.16 | 9.82 | 10.52 | |
| Chicken premix feed | 0.5 | 89.35 | 5.46 | 7.28 |
| 5.0 | 92.73 | 7.78 | 8.95 | |
| 50.0 | 95.00 | 9.12 | 10.41 | |
| Pig compound feed | 0.05 | 83.96 | 8.33 | 9.90 |
| 0.5 | 81.92 | 6.78 | 7.92 | |
| 5.0 | 83.27 | 5.29 | 6.67 | |
| Concentrated pig feed | 0.1 | 80.18 | 8.16 | 9.76 |
| 1.0 | 82.79 | 6.54 | 7.88 | |
| 10.0 | 95.55 | 6.87 | 9.04 | |
| Pig premix feed | 0.5 | 99.65 | 9.95 | 10.56 |
| 5.0 | 97.38 | 8.61 | 9.90 | |
| 50.0 | 97.01 | 6.72 | 8.75 | |
| Vitamin supplements | 0.05 | 90.22 | 9.14 | 10.37 |
| 0.5 | 89.67 | 7.60 | 8.65 | |
| 5.0 | 85.45 | 6.85 | 7.74 | |
| Cattle concentrate | 0.1 | 83.76 | 6.69 | 7.80 |
| 1.0 | 82.39 | 10.75 | 11.13 | |
| 10.0 | 82.72 | 9.17 | 10.45 |
| Feed | Added Concentration (μg/g) | Recovery Rate (%) | Intra Batch Coefficient of Variation (%) | Inter Batch Coefficient of Variation (%) |
|---|---|---|---|---|
| Chicken compound feed | 0.05 | 89.90 | 6.57 | 7.09 |
| 0.5 | 89.64 | 5.32 | 6.18 | |
| 5.0 | 91.45 | 5.56 | 6.65 | |
| Concentrated chicken feed | 0.1 | 90.35 | 8.14 | 9.53 |
| 1.0 | 89.56 | 5.42 | 6.92 | |
| 10.0 | 91.82 | 7.73 | 9.94 | |
| Chicken premix feed | 0.5 | 90.47 | 6.05 | 7.36 |
| 5.0 | 93.25 | 5.47 | 7.77 | |
| 50.0 | 95.83 | 4.43 | 6.98 | |
| Pig compound feed | 0.05 | 85.28 | 5.96 | 9.04 |
| 0.5 | 81.14 | 5.61 | 7.82 | |
| 5.0 | 83.07 | 3.82 | 7.67 | |
| Concentrated pig feed | 0.1 | 82.64 | 10.04 | 11.12 |
| 1.0 | 81.19 | 7.76 | 7.85 | |
| 10.0 | 85.75 | 6.80 | 7.96 | |
| Pig premix feed | 0.5 | 95.55 | 11.17 | 10.99 |
| 5.0 | 93.42 | 8.62 | 9.92 | |
| 50.0 | 94.74 | 6.87 | 7.08 | |
| Vitamin supplements | 0.05 | 87.05 | 6.65 | 7.85 |
| 0.5 | 89.67 | 7.48 | 9.74 | |
| 5.0 | 86.83 | 6.70 | 9.97 | |
| Cattle concentrate | 0.1 | 83.48 | 8.23 | 9.43 |
| 1.0 | 80.92 | 10.96 | 11.16 | |
| 10.0 | 80.78 | 10.51 | 11.82 |
Disclaimer/Publisher’s Note: The statements, opinions and data contained in all publications are solely those of the individual author(s) and contributor(s) and not of MDPI and/or the editor(s). MDPI and/or the editor(s) disclaim responsibility for any injury to people or property resulting from any ideas, methods, instructions or products referred to in the content. |
© 2025 by the authors. Licensee MDPI, Basel, Switzerland. This article is an open access article distributed under the terms and conditions of the Creative Commons Attribution (CC BY) license (https://creativecommons.org/licenses/by/4.0/).
Share and Cite
Cheng, C.; Chen, Y.; Liu, X.; Lei, Y.; Qin, Q.; Cheng, L. Development and Validation of the Multi-Residue Method for Identification and Quantitation of Six Macrolide Antiparasitic Drugs. Appl. Sci. 2025, 15, 6013. https://doi.org/10.3390/app15116013
Cheng C, Chen Y, Liu X, Lei Y, Qin Q, Cheng L. Development and Validation of the Multi-Residue Method for Identification and Quantitation of Six Macrolide Antiparasitic Drugs. Applied Sciences. 2025; 15(11):6013. https://doi.org/10.3390/app15116013
Chicago/Turabian StyleCheng, Chuanmin, Yannan Chen, Xinyu Liu, Yanmin Lei, Qianxi Qin, and Linli Cheng. 2025. "Development and Validation of the Multi-Residue Method for Identification and Quantitation of Six Macrolide Antiparasitic Drugs" Applied Sciences 15, no. 11: 6013. https://doi.org/10.3390/app15116013
APA StyleCheng, C., Chen, Y., Liu, X., Lei, Y., Qin, Q., & Cheng, L. (2025). Development and Validation of the Multi-Residue Method for Identification and Quantitation of Six Macrolide Antiparasitic Drugs. Applied Sciences, 15(11), 6013. https://doi.org/10.3390/app15116013