Article

Application of Electrical Resistivity Tomography Method Combined with Cross-Well Seismic Computed Tomography Method in Karst Detection in Complex Urban Environment

1
School of Resource and Civil Engineering, Northeastern University, Shenyang 110819, China
2
School of Resource and Materials, Northeastern University at Qinhuangdao, Qinhuangdao 066004, China
*
Author to whom correspondence should be addressed.
Appl. Sci. 2025, 15(10), 5756; https://doi.org/10.3390/app15105756
Submission received: 18 January 2025 / Revised: 13 May 2025 / Accepted: 17 May 2025 / Published: 21 May 2025
(This article belongs to the Section Earth Sciences)

Abstract

:
Facing the problems in determining the distribution range of karst areas and detecting karst caves under the restrictions of complex building and human exploration environments on the urban surface, taking the karst detection of Tianmeixin village and its southern pond in the north extension section of Guanghua Intercity Railway Line 18 as the application research object, based on the formation mechanism of karst and the existing geophysical detection methods, the electrical resistivity tomography method with a large detection range and the cross-well seismic computed tomography method with a high detection accuracy are used to carry out application research on concealed karst cave detection, which are two geophysical technical detection methods with strong adaptability and anti-interference ability. The results show that the optimized combination of geophysical exploration techniques can effectively overcome the limitations of the environment, draw the main karst development areas, reveal the interface between rock and soil, and accurately characterize the size and shape of karst caves. The electrical resistivity tomography method was used to find a number of potential water conduction channels in the middle zone between Tianmeixin village and the south river. The overall distribution characteristics of karst in Tianmeixin village were summarized, and the key detection areas were drawn. This conclusion was verified by several sets of cross-well seismic computed tomography profiles, which provided a reference for the layout of the subsequent cross-well seismic computed tomography imaging method and greatly reduced the workload of drilling, shortened the construction period, saved on detection costs, and reduced the impact on the production and life of residents.

1. Introduction

Since the opening of the London Metropolitan Railway in 1863, the underground has been widely used around the world [1]. Especially in some developed countries and regions, the subway has greatly alleviated many problems such as urban ground traffic congestion with its advantages of high capacity, convenience, and environmental protection, saved urban space, and become an important part of urban transportation. With the continuous development and expansion of the city, the subway network has also been continuously improved and expanded, covering more areas of the city and greater numbers of people, forming a huge underground transportation network to provide convenience for urban residents [2,3,4]. However, the global karst area reaches 22 million square kilometers and is widely distributed in 130 countries and regions, which makes it inevitable to encounter karst hazards in the process of subway construction, which poses potential safety hazards to shield construction and subway operation [5,6,7,8,9,10], Moreover, the karst geological conditions in urban areas are complex, the human interference is large, and there are many uncertain factors, which makes it difficult to accurately identify and locate them [11,12,13,14]. This topic has attracted many scholars to study the application of karst cave detection technology [15], and they have gradually developed a variety of geophysical exploration methods such as the electrical resistivity tomography method [16,17,18,19], geological radar [20,21], cross-well seismic computed tomography [22,23,24,25,26], the microgravity method [27], the transient electromagnetic method [28,29], etc. Each method has its own advantages and disadvantages: The electrical resistivity tomography method has a high data acquisition density and a large detection range, but its resolution is not high; it is suitable for the qualitative evaluation of karst in early exploration. Geological radar uses high-frequency electromagnetic waves to detect the underground, with accurate results; however, the exploration distance is limited and it can only image the shallow strata, and the burial depth of the subway exceeds its effective detection range. Cross-well seismic computed tomography requires data acquisition inside the borehole, which has high accuracy; however, there is a lot of preparatory work in the early stage and the cost is relatively high. The microgravity method has a good detection effect on shallow-buried and small-target anomalous bodies based on the density difference between rock and soil masses and karst caves, but it is easily affected by the surrounding traffic and human flow activities. The transient electromagnetic method is sensitive to water-containing geological bodies, but its drawback is that it is easily disturbed by the surrounding metal structures. and because there are many interpretive results in the interpretation of geophysical exploration methods, two or more geophysical exploration methods are mostly used for detection in actual exploration, supplemented by engineering drilling to test their reliability [30,31,32]. Therefore, how to make reasonable use of the existing geophysical exploration technology to locate underground karst hazards, and how to choose an economical, rapid combination of geophysical prospecting methods among a variety of geophysical exploration methods to accurately identify underground karst hazards, is a technical problem worthy of study [33,34,35,36].
In view of this, this paper takes the underground karst area of Tianmeixin village in the northern extension of Guanghua Intercity Railway Line 18 as the research object, combines the results of preliminary engineering investigations, comprehensively considers the detection requirements and the complex hydrological, geological, geomorphological, and built environment faced by the detection area, optimizes a combination of the electrical resistivity tomography method and the cross-well seismic computed tomography method and borehole verification and other technical methods to detect the development range of underground karst areas, possible water channels, and the accurate locations of hidden karst caves, and solves the technical problems of hidden karst detection under the constraints of complex engineering geological conditions in the city. At the same time, the application research of this detection technology method can also provide a theoretical basis and technical guidance for the detection and evaluation of hidden karst under similar engineering geological conditions.

2. Materials and Methods

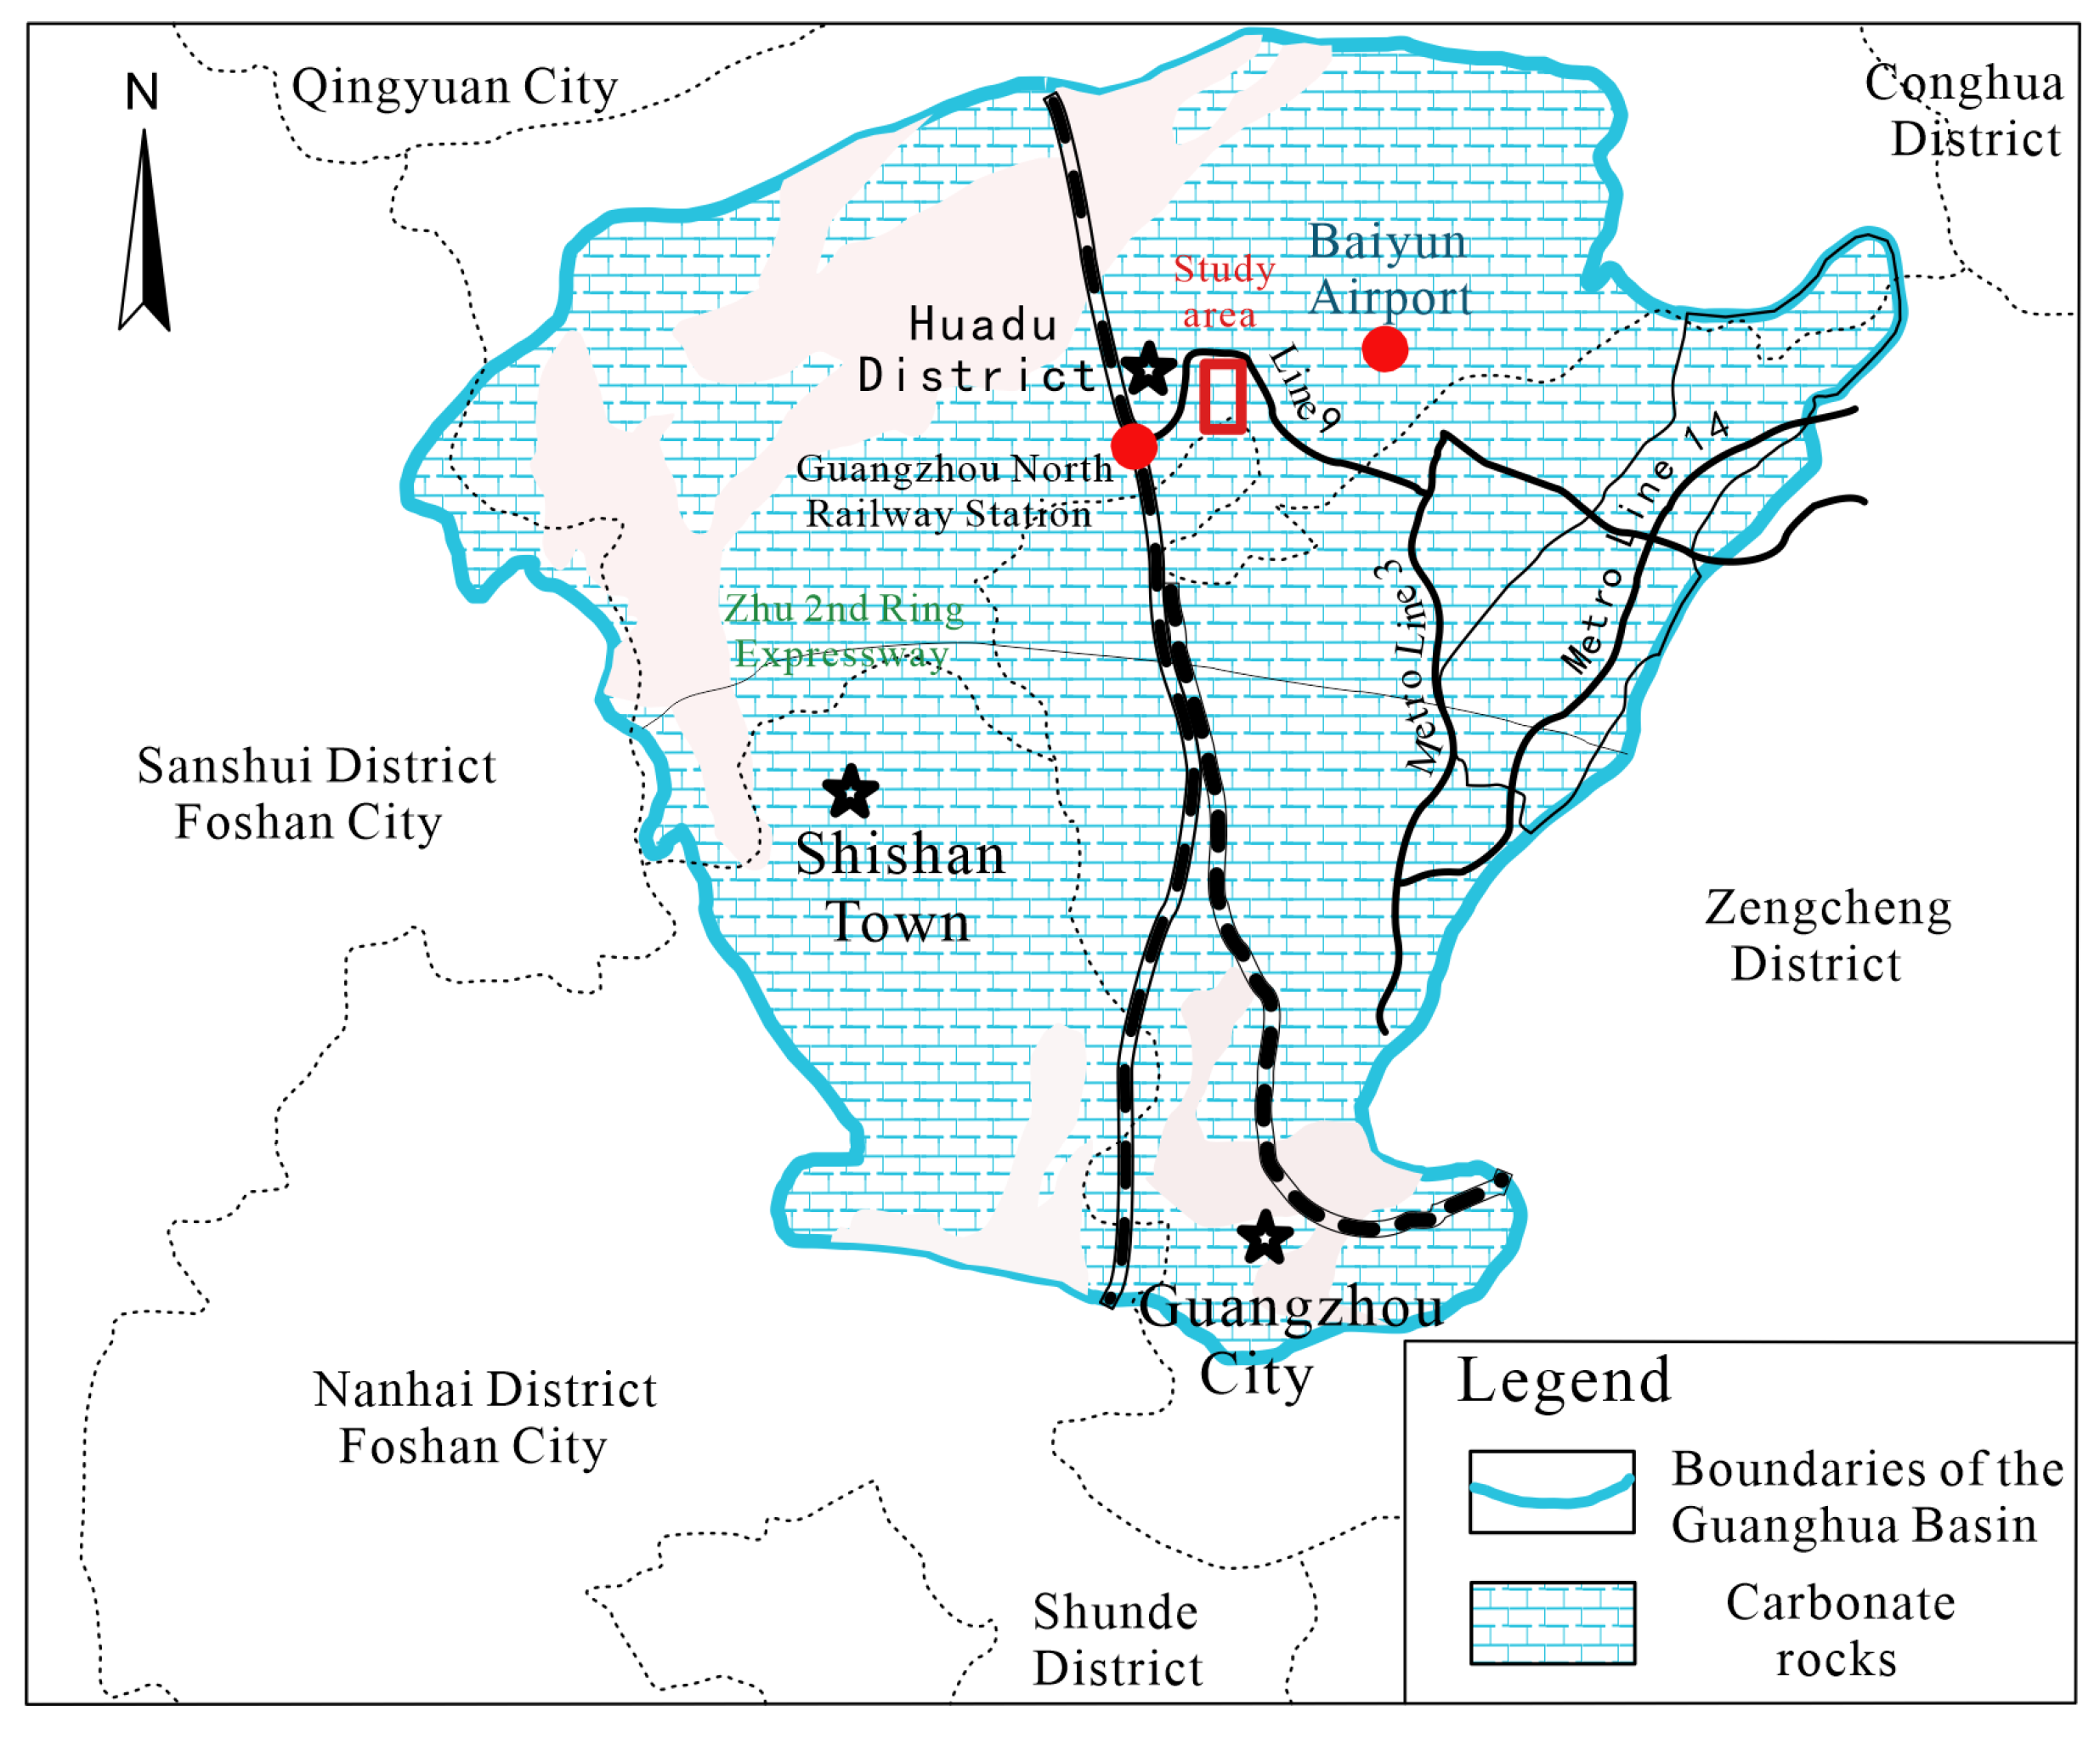
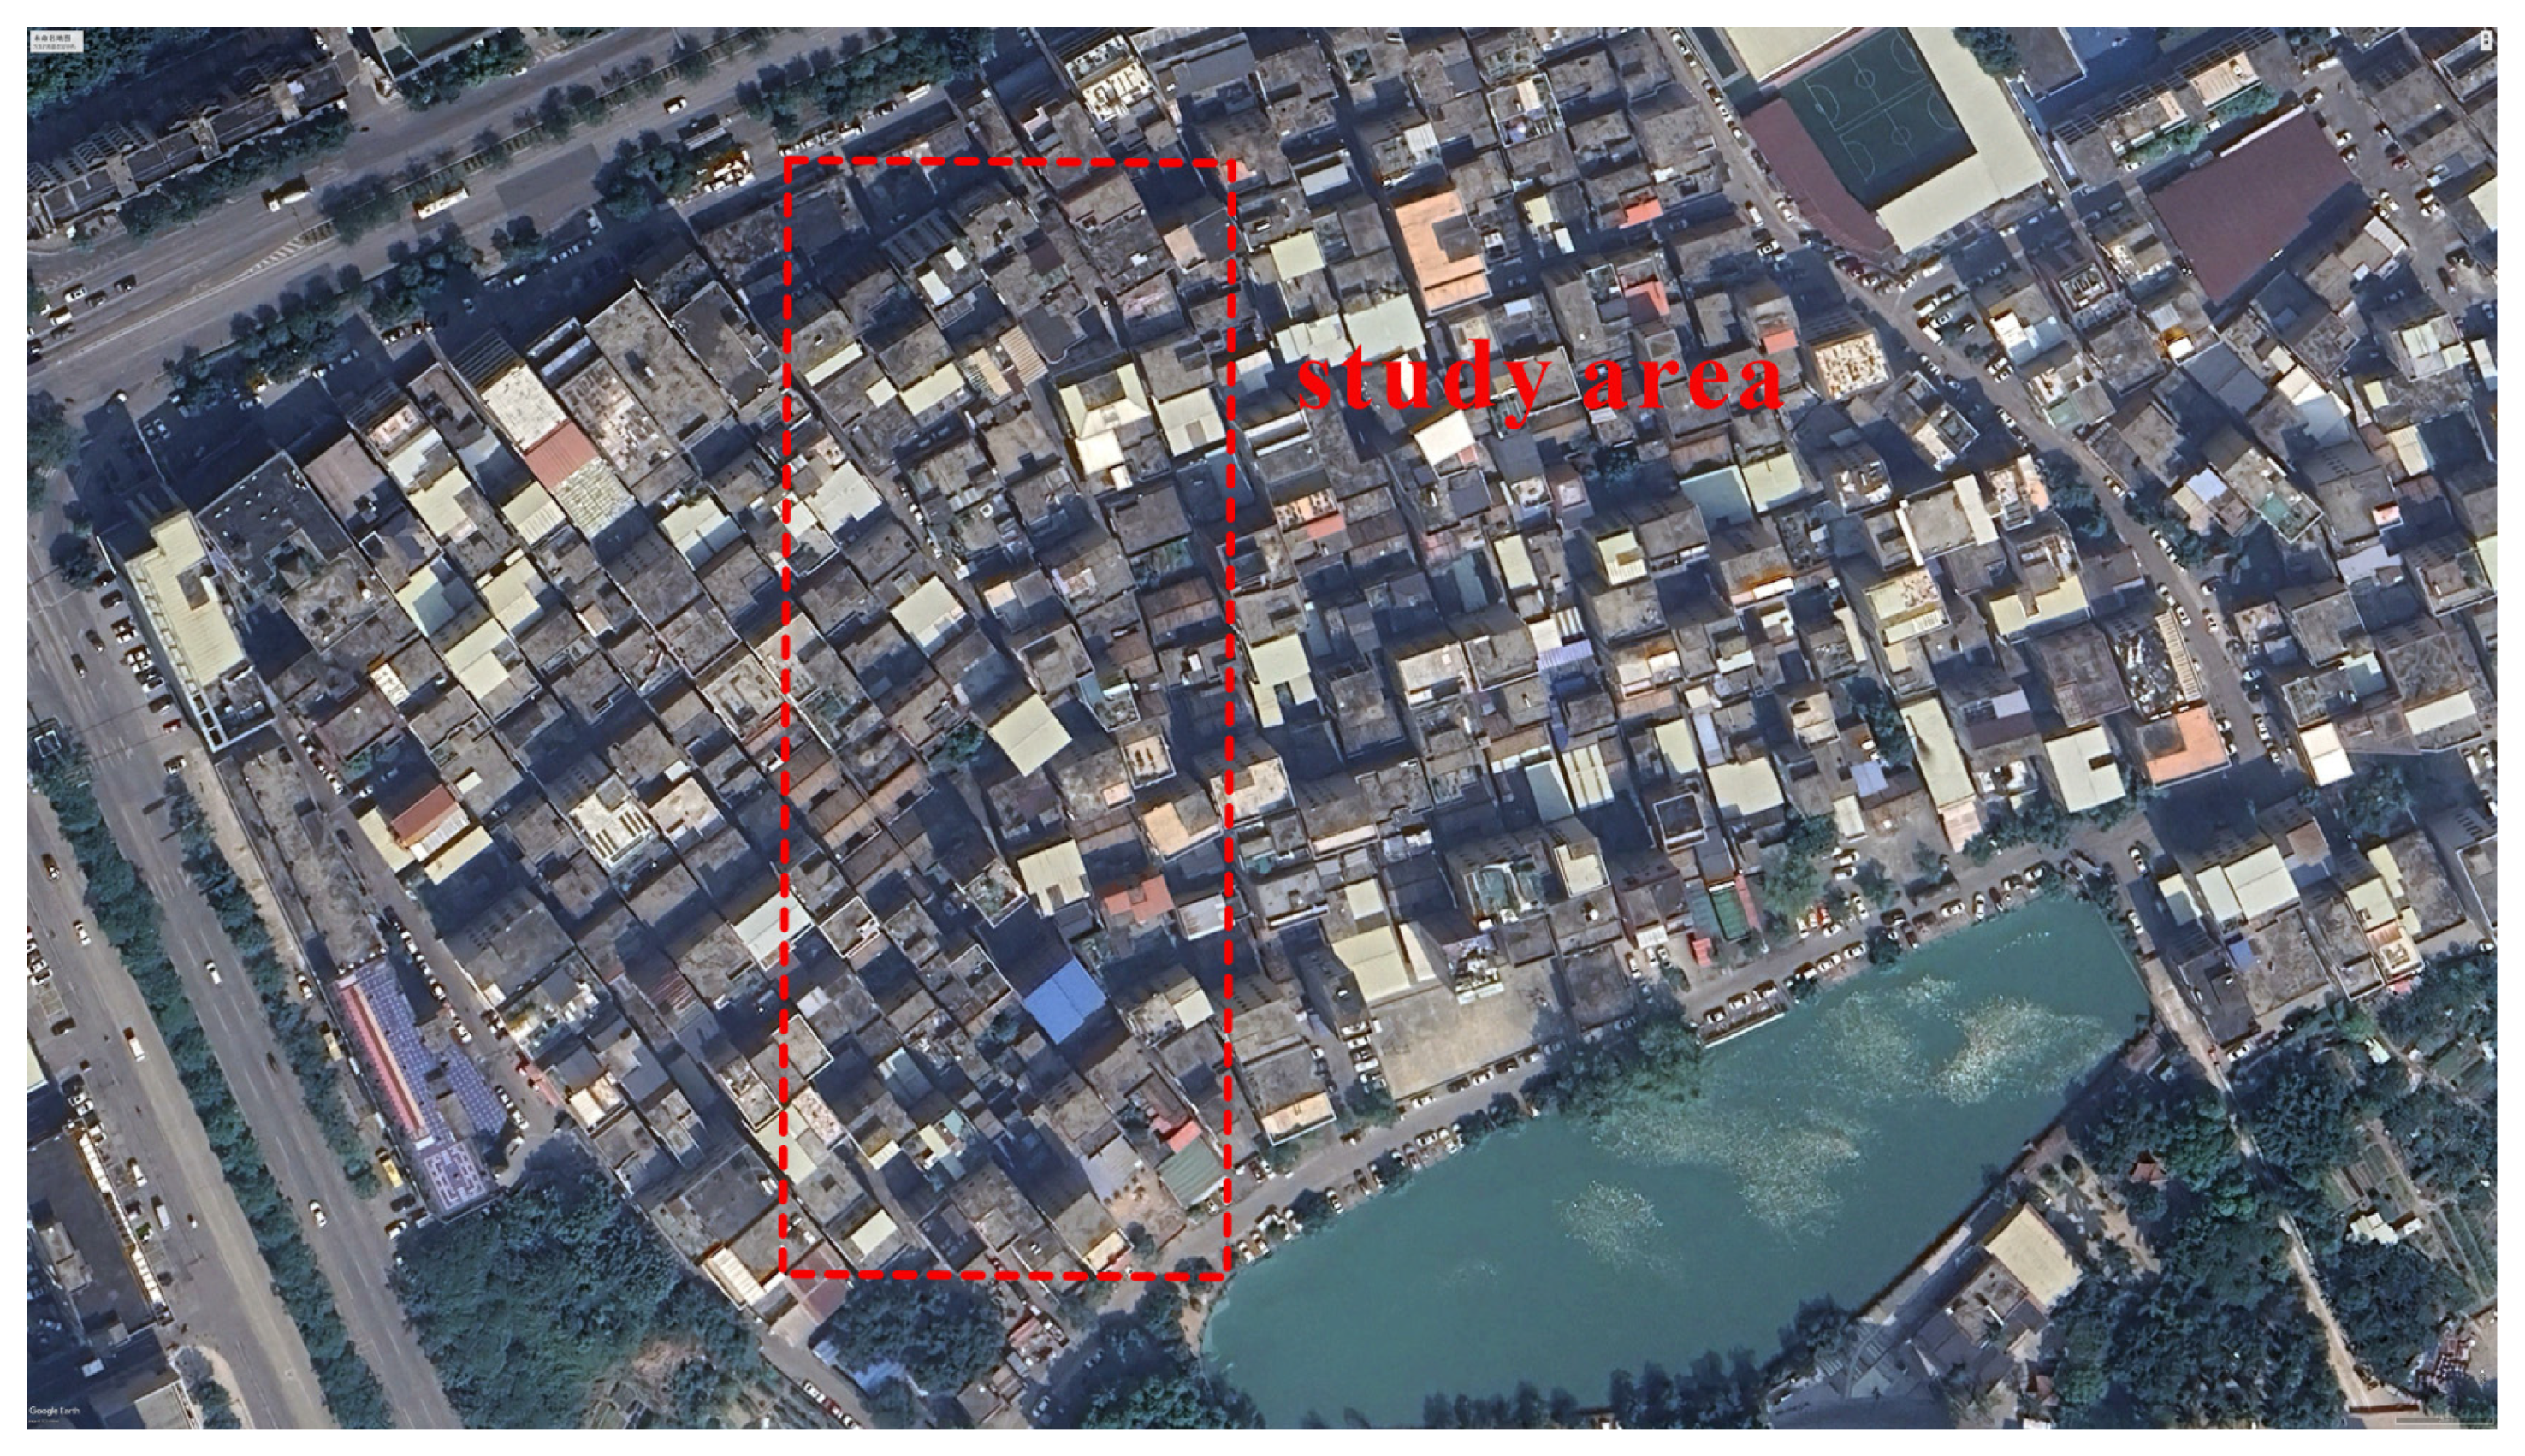
2.1. Geological Setting in Study Area
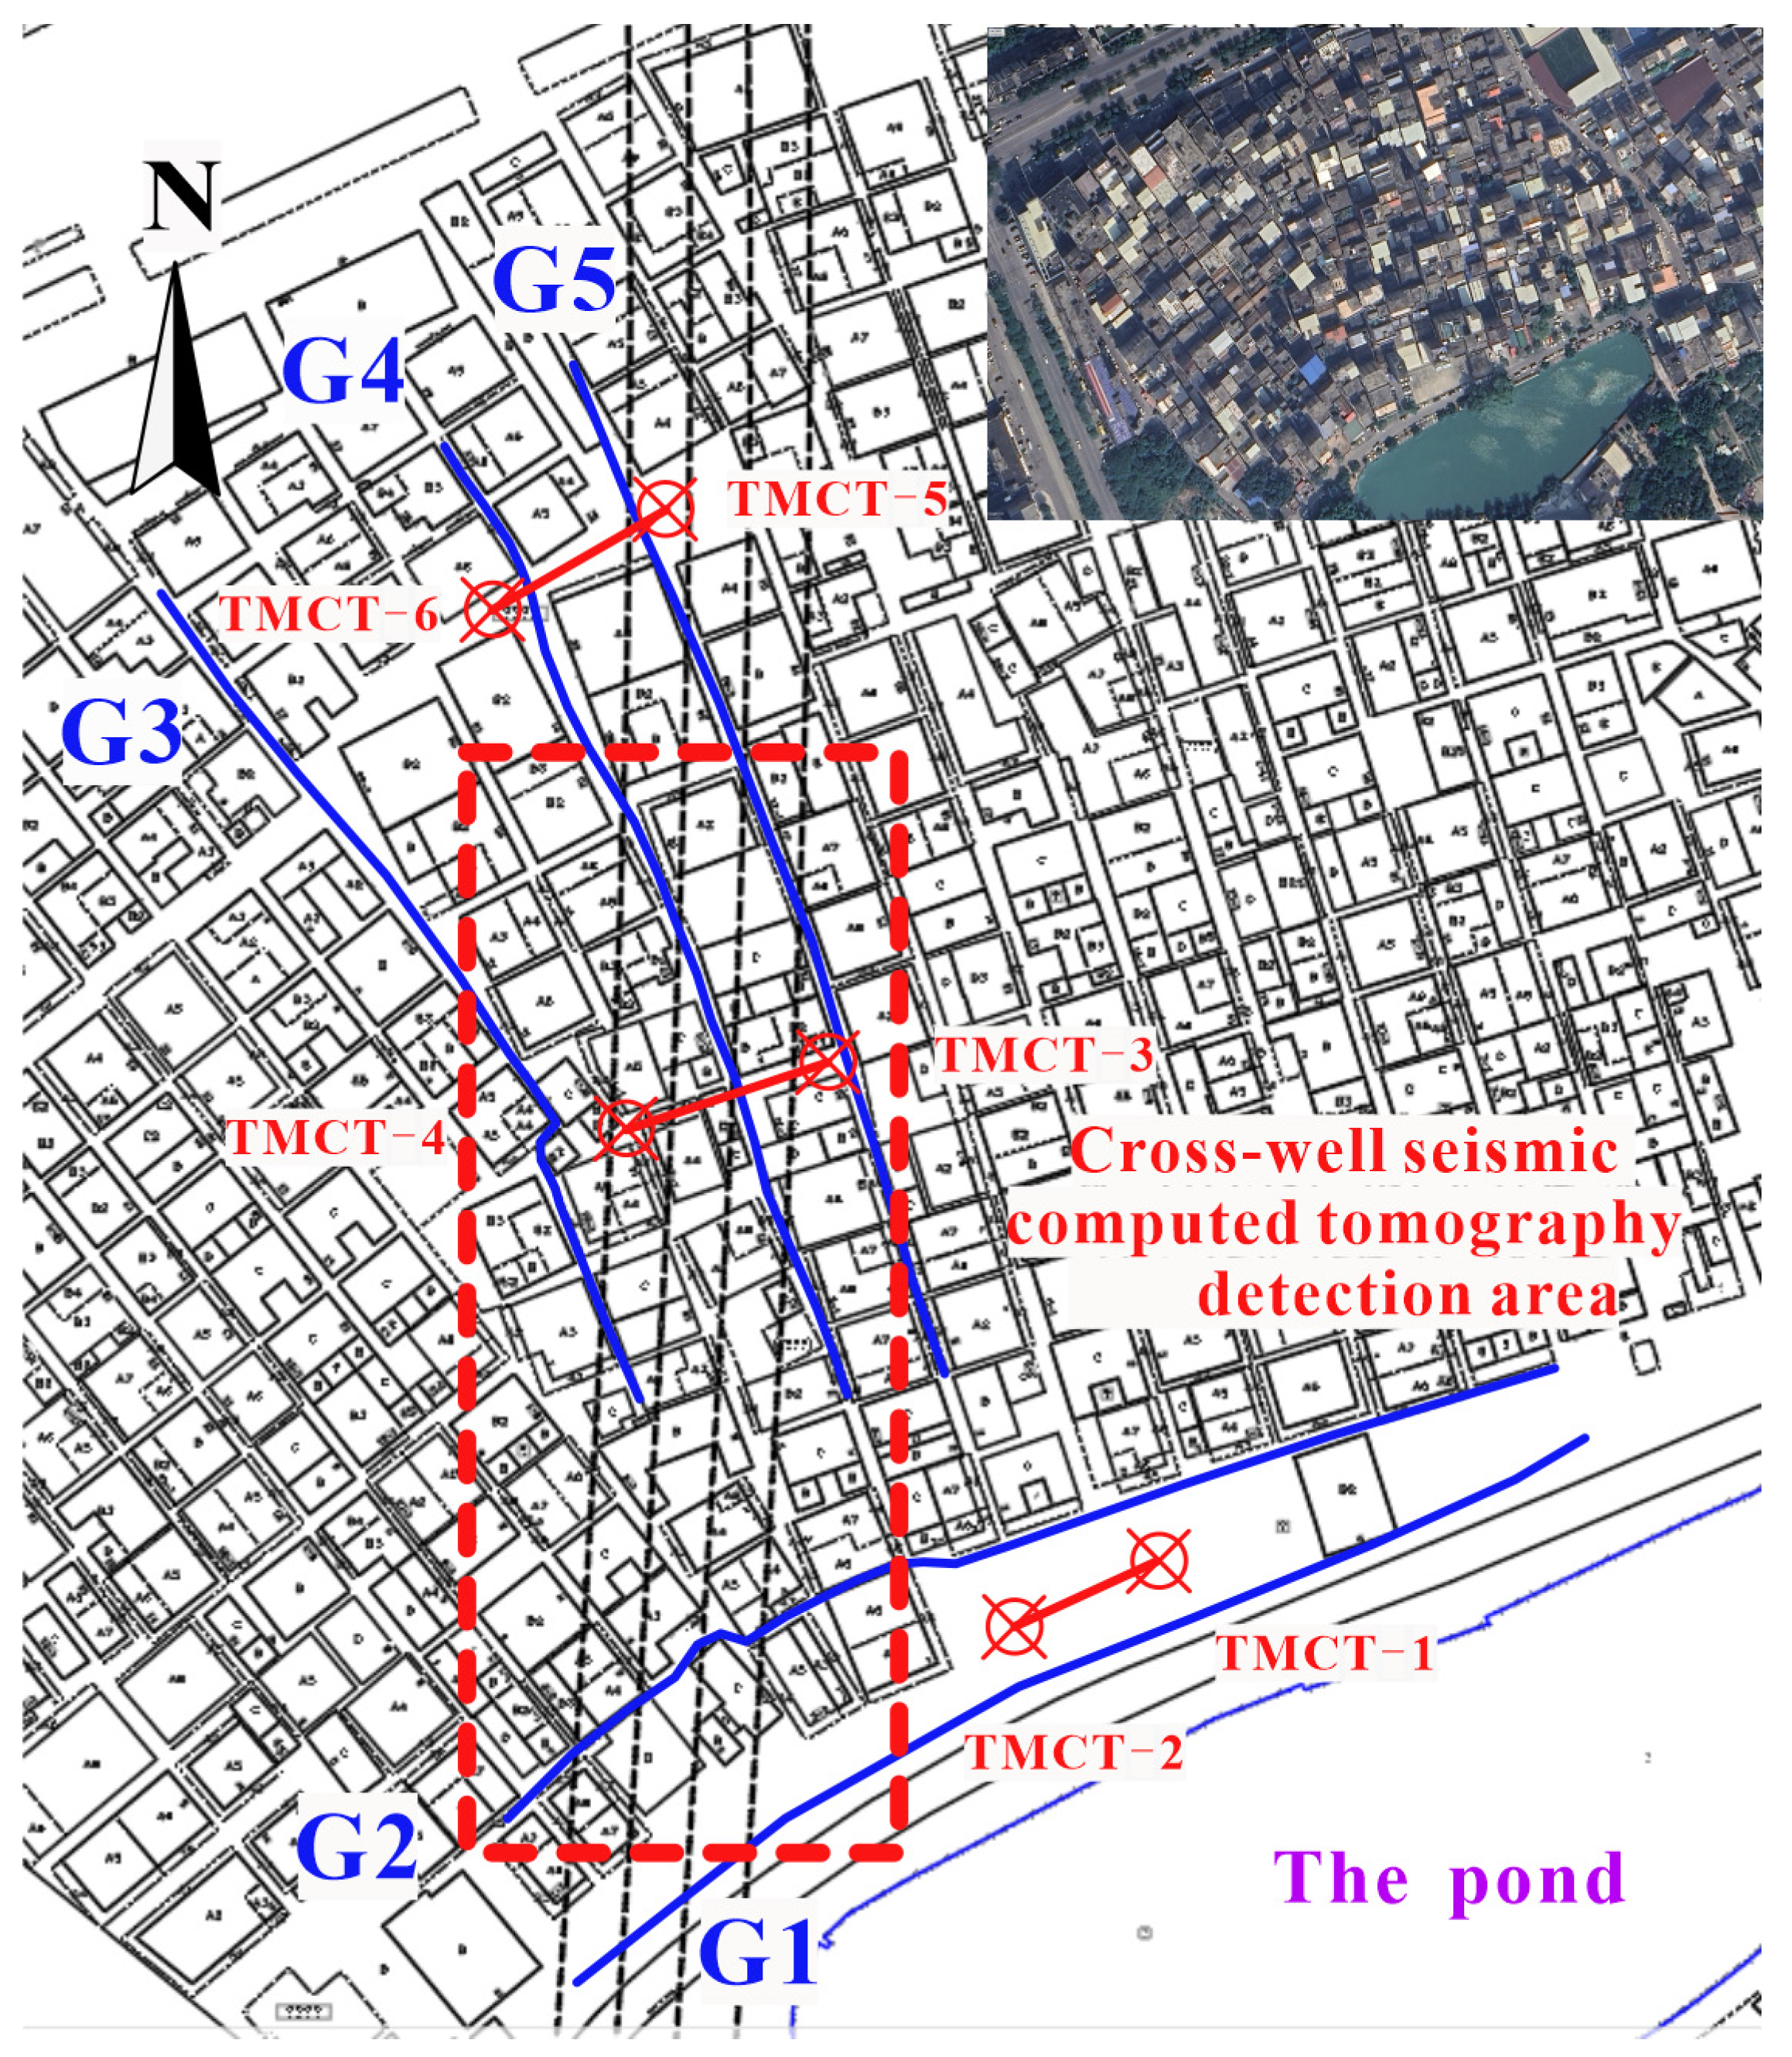
The Guanghua Basin is located in the northern part of the Pearl River Delta, with a dense river network, abundant precipitation, tectonic control by the Guangcong fault, and the tectonic pattern is dominated by the NE direction. The central and southern part of the basin is mainly composed of huge thick carbonate deposits accumulated in the Late Devonian period, and has experienced many times of transgression and crustal uplift in the geological history [37,38]. The above conditions are extremely favorable for the formation of cover karst.
The detection application research area is a subway station of Line 18 of Guanghua Intercity Railway, which is located in the center of Huadu District, Guangzhou. Guangzhou North Railway Station is 3 km to the west, and Guangzhou Baiyun International Airport is 7 km to the southeast. It is an important hub connecting the Tianhe and Huadu administrative regions (Figure 1). The shield tunneling machine started from this station, and the subway line passes through Tianmeixin village. According to the previous drilling results, the strata distributed in the study area are mainly Quaternary Holocene (Q4) and Upper Pleistocene (Q3), and the Middle Pleistocene (Q2) and Lower Pleistocene (Q1) are missing. The Holocene is composed of artificial fill, a silt layer, and a silty sand layer, while the Upper Pleistocene is mainly an alluvial-flood soil layer and residual soil layer. The lower bedrock of the exploration study area is mainly the limestone of the Lower Carboniferous Datang Terrace (C1ds) Member. The thickness of the Quaternary cover layer is 8–30 m, the cover karst is relatively developed, and the hole-finding rate of the drilling is 49.43%. The karst cave exposed by drilling is generally in a semi-filled state, and the filling material is mostly gravel and limestone debris. In addition, according to a large number of dropdown and water leakage events in the drilling construction records, it is judged that the beaded karst caves are connected to each other, which brings safety risks such as gusher sand to the construction.
The construction site is a typical urban village (Figure 2), the construction is dense, the roadway is narrow, the flow of people is large, a considerable part of the area is difficult to carry out drilling construction for underground detection, and there is a natural pond and a river in the south of it, the groundwater is shallow, and it is very likely that there is a water diversion channel formed after the dissolution of limestone, so that a water inrush accident may occur during shield construction, and it is urgent to select appropriate geophysical detection methods to evaluate the development of underground karst, and make targeted treatments, to find potential water-conducting structures and karst fissures, and to draw and locate karst caves, so as to provide a reference for the next step of cross-well seismic computed tomography borehole layout and other karst treatment methods.
According to the detailed geotechnical investigation report of this section and the geotechnical engineering investigation code for urban rail transit [39], the physical property parameters of the main geological bodies in the study area are shown in Table 1. There are obvious differences in longitudinal wave velocity and resistivity between different geological bodies, especially the karst caves and dissolution areas which have obvious characteristics of low resistivity and low wave velocity compared with intact bedrock, which have the prerequisites for corresponding geophysical exploration and research.

2.2. Methods

The exploration of karst hidden dangers in the Tianmeixin village working area and the southern pond of Guanghua Intercity Railway Line 18 is carried out according to the difference in the obtained geological physical property parameters by adopting geophysical exploration techniques with good anti-interference ability and high resolution. The specific methods are the electrical resistivity tomography method and the cross-well seismic computed tomography method. Firstly, electrical resistivity tomography measurement lines were used to detect the spatial distribution of resistivity of underground rock and soil between the pond and Tianmeixin village, in order to find possible water conduction channels between the pond and the construction area. Secondly, three electrical resistivity tomography measurement lines were arranged in parallel along the extension direction of the subway line in Tianmeixin village to find out the distribution of the geotechnical interface, the buried depth and scale of the hidden karst cave, and the overall distribution law. Finally, based on the above electrical resistivity tomography method detection results, engineering drilling verification and cross-well seismic computed tomography detection verification were carried out on the karst abnormal area, and the karst development boundary and the next cross-well seismic computed tomography detection range were drawn, so as to solve the hazards of hidden karst and possible water-conducting fractures in the project.
The coordinates and elevation information of boreholes and measuring electrode positions involved in this karst detection application research were recorded by RTK (Real Time Kinematic) of Zhonghaida Satellite Navigation Technology Company (Guangzhou, China). The positioning accuracy was up to a centimeter, providing precise data for the subsequent grouting drilling.

2.2.1. Electrical Resistivity Tomography Method

Electrical resistivity tomography (ERT) is a geophysical exploration technique method widely used to image the shallow subsurface by measuring differences in the electrical conductivity of the subsurface. Evolved from the traditional direct current (DC) resistivity method, ERT addresses engineering and geological challenges by mapping the distribution of the subsurface electric field. During a survey, a linear array of electrodes is placed along the ground in the area of interest. A typical measuring unit consists of four equidistant electrodes labelled A, M, N, and B. Electrodes A and B serve as current injectors, while electrodes M and N measure the resulting voltage to calculate apparent resistivity. The electrodes are systematically moved along the survey line to collect data across the entire profile until the measurement is complete.
As shown in Figure 3, this survey arranged 2 groups of electrical resistivity tomography survey lines, a total of 5 sections, 1 of which was nearly parallel to G1 and G2 arranged on the side of the road by the pond, with a distance of about 10 m between the 2 survey lines, to detect possible water diversion channels, and the other set of survey lines G3–G5 were laid along the alley along the inside of Tianmeixin village, and the extension direction of the subway was obliquely intersected to detect the overall distribution of karst in the profile. The detection equipment uses the EDGMD-60 electrical resistivity tomography measurement system developed by Chongqing Dingfeng Geological Exploration Instrument Co., Ltd. (Chongqing, China), and the basic composition of the equipment is shown in Figure 4A. Five measuring lines use 96 measuring electrodes, the electrode spacing is 2 m, the measuring line length is 192 m; due to the limitation of the surface cement pavement, detection using clay-wrapped non-polarized electrodes is used instead of copper electrodes. Before the measurement of the whole circuit of each electrode on and off and grounding resistance tests, the electrode that does not meet the standard is poured with salt water and undergoes electric drilling to increase the buried depth and other treatment to reduce noise. The power supply voltage is 400 V during detection, and the Wenner measuring device is used for data acquisition, with a minimum isolation factor of 1, a maximum isolation factor of 31, a maximum measurement depth of 62 m, and 1584 data points for each profile.
For the collected apparent resistivity data, after data import, format conversion, and pre-processing, relevant software is used to calculate and process Zodi inversion, the true resistivity distribution at a certain depth underground is obtained, and the resistivity profile contour map is made. Finally, the geological and geophysical interpretation is carried out, and the karst cave anomaly area and the possible water conduction structure area are circle-drawn.

2.2.2. Cross-Well Seismic Computed Tomography Method

Cross-well seismic computed tomography is mainly based on the difference in p-wave velocity between rock and soil mass and karst caves to realize the imaging of underground karst areas. The detection process needs to transmit multiple artificial seismic waves from different depths of one borehole, set up multiple detectors in another borehole to receive the seismic waves and obtain the first arrival time of the seismic waves on each geophone, then iteratively invert the wave velocity distribution between the two boreholes, and draw karst caves according to velocity.
The cross-well seismic computed tomography method adopts the cross-hole seismic system developed by Geotomographie Company in Bad Salzdetfurth, Germany, and the high-performance seismometer of Seismic Source in the United States. The IPG1005 high-voltage energy storage transmitter of the in-hole launching system has a working voltage of 5 KV and an output energy of 1000 joules. The spark source SBS42P emits a P-wave source with a frequency of 5 KHz into the hole. The receiving device is the BHC-3 hydrophone chain, the standard pitch is 1 m, the hydrophone is equipped with a preamplifier, the maximum amplification can be 20 dB, the channel is 24, and the resonance frequency is 20 KHz. The borehole depth used was 5 m below the tunnel floor. During data collection, the number of shot points was adjusted according to the borehole depth and groundwater level, and data superposition was collected six times at each point to reduce background noise interference.
The equipment used and the on-site acquisition process are shown in Figure 4B.
After bad track elimination, initial extraction and inversion iteration of the collected seismic wave data are carried out using relevant software, the obtained wave velocity image is interpreted according to the in situ wave velocity test results, the interface of the rock and soil layer is identified, and the location, size, and shape of the concealed karst cave are delineated.

3. Results

Geogiga RImager 7.0 and Geogiga XW Tomo (Geogiga Seismic Pro 8.3) are used in the inversion and geological interpretation of the collected data of the electrical resistivity tomography method and the cross-well seismic computed tomography method. At the same time, comparison and mutual verification are carried out with the drilling records to improve the reliability of the detection results.

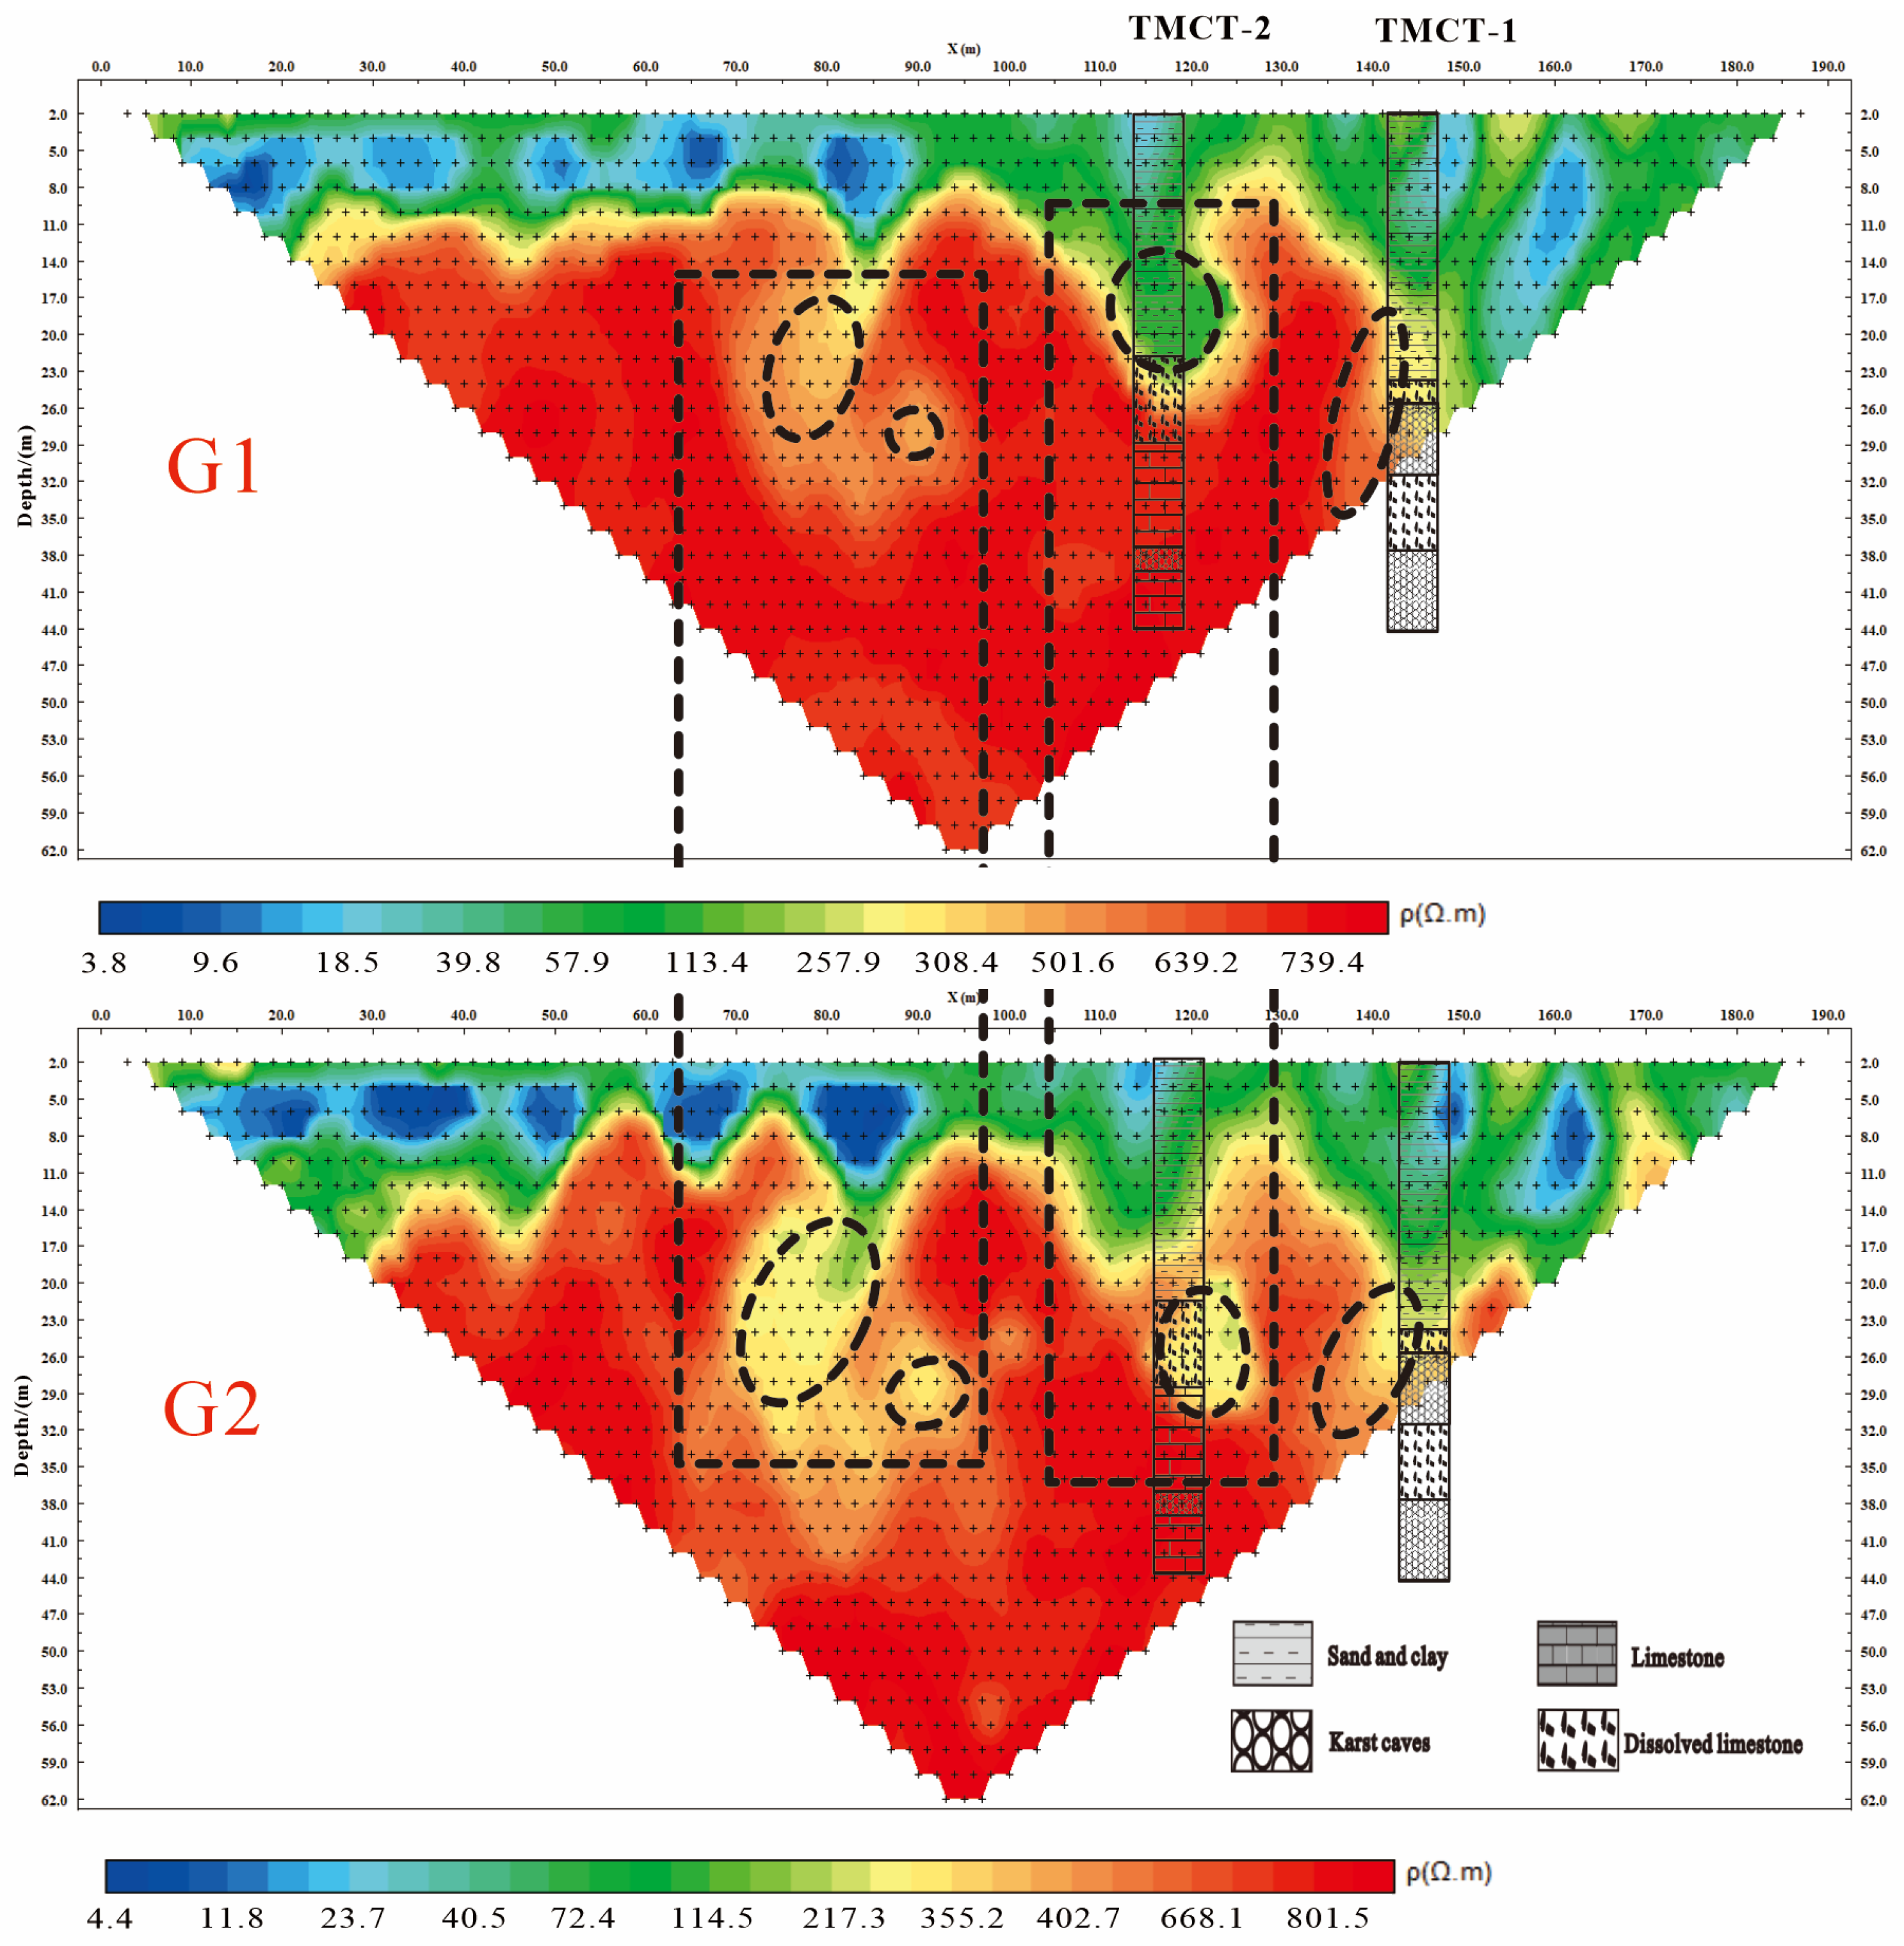
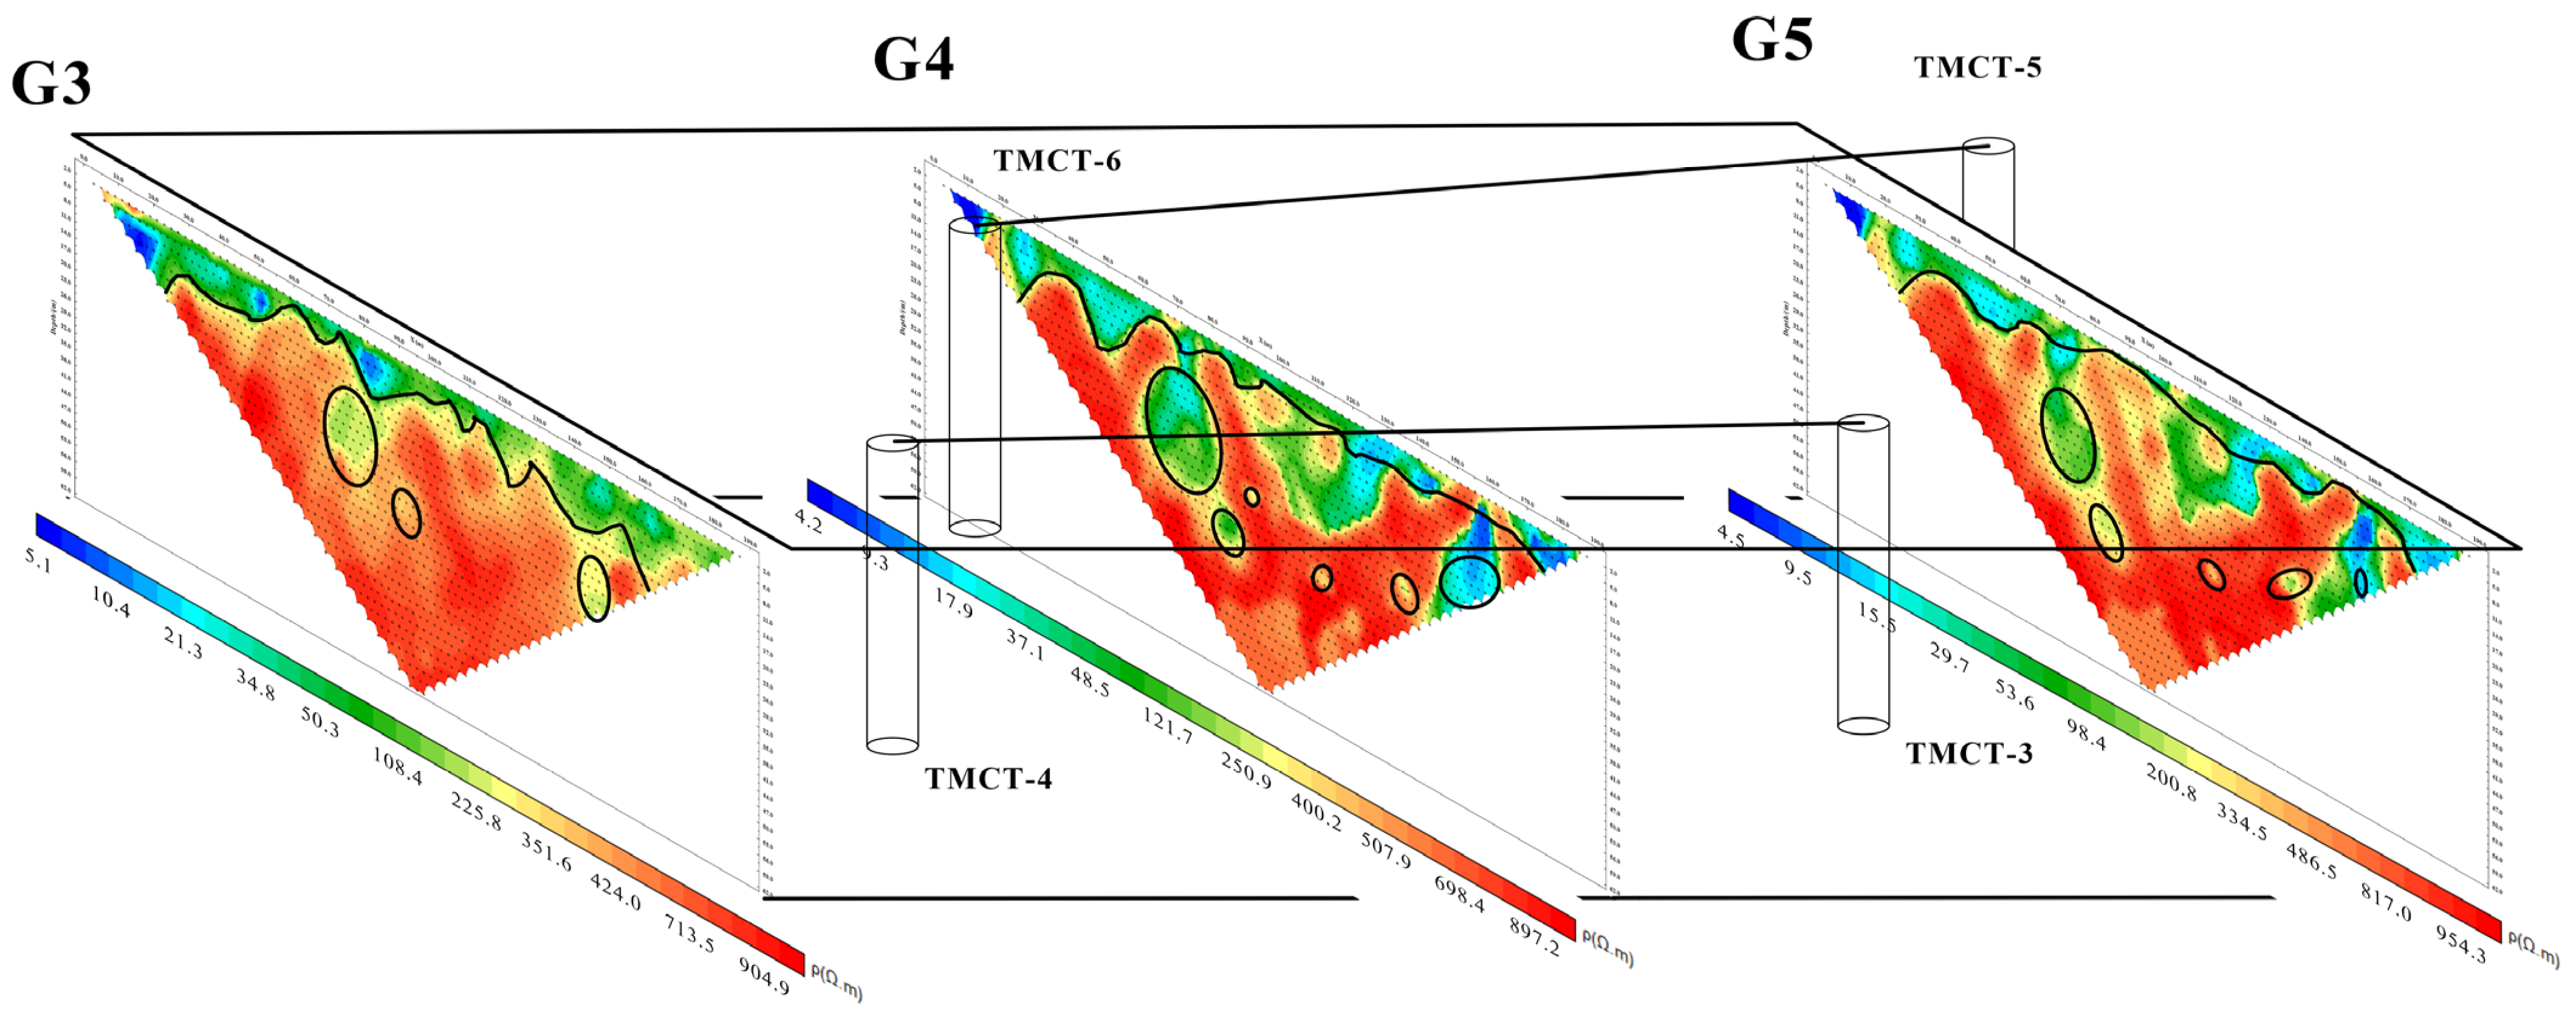
3.1. Electrical Resistivity Tomography Results

The inversion and interpretation results of G1 and G2 profiles by electrical resistivity tomography method are shown in Figure 5. The interface between the rock and soil layers obtained by inversion is clear and has varying depth. The thickness of the Quaternary cover layer is 5–29 m, and the resistivity value range is 4–100 Ω.m. The resistivity values in karst areas range from roughly 100 to 350 Ω·m, and the resistivity values of the limestone formation range from 400 to 800 Ω·m.
Four karst abnormal areas are found in two sections, which are grouped in pairs and located at 70–90 m and depth 14–29 m in section 1 and 110–140 m and depth 20–32 m in section 2, respectively. At the same time, the similarity of the karst low-velocity anomaly in the two sections proves that the karst is connected in the south–north direction, and it is inferred that the karst has two potential water conduction channels, which make the groundwater flow northward and control the karst development in Tianmeixin village. TMCT 1 and TMCT 2 are located in the middle of the two sections at 118 m and 143 m of the survey line, which verifies the existence of a karst area in the east of the section (Drilling results will be discussed in Section 3.2).
The electrical resistivity tomography measurement lines G3–G5 are arranged at the inner streets of Tianmeixin village from north to south. The distance between the G3 and G4 measurement lines is about 28 m, and the distance between the G4 and G5 measurement lines is about 18 m. The interpretation results are shown in Figure 6. The range of resistivity values of layers and karst areas in this area is roughly the same as that of the G1 and G2 profiles, and the highest resistivity value of the limestone layer reaches 1000 Ω·m, higher than that of the G2 profile at 800 Ω·m, which is considered to be caused by the low water content of rocks far away from the pond. There are many low-resistance abnormal areas in the three sections, among which two are large karst areas, located at 70–95 m and depth 14–29 m in the survey line and 155–170 m and depth 5–32 m in the survey line, respectively. The other low-resistance abnormal areas are small and distributed around the two large karst areas.
On the whole, the karst area is mainly distributed in the middle and south of the survey line, and there is less karst in the northern region. Among them, the resistivity of the limestone below the X-axis 0–60 m interface is higher than 800 Ω·m, and there is no low-resistance abnormal area. It is speculated that as the distance from the southern pond increases, the dissolution effect of groundwater in the area north of 60 m of the survey line weakens, the water content of the limestone layer is low, the karst is not well developed, and the overall resistivity is relatively high. In order to verify this conjecture, four boreholes, TMCT 3–TMCT 6, were designed on both sides of the survey line, and cross-well seismic computed tomography detection was carried out.

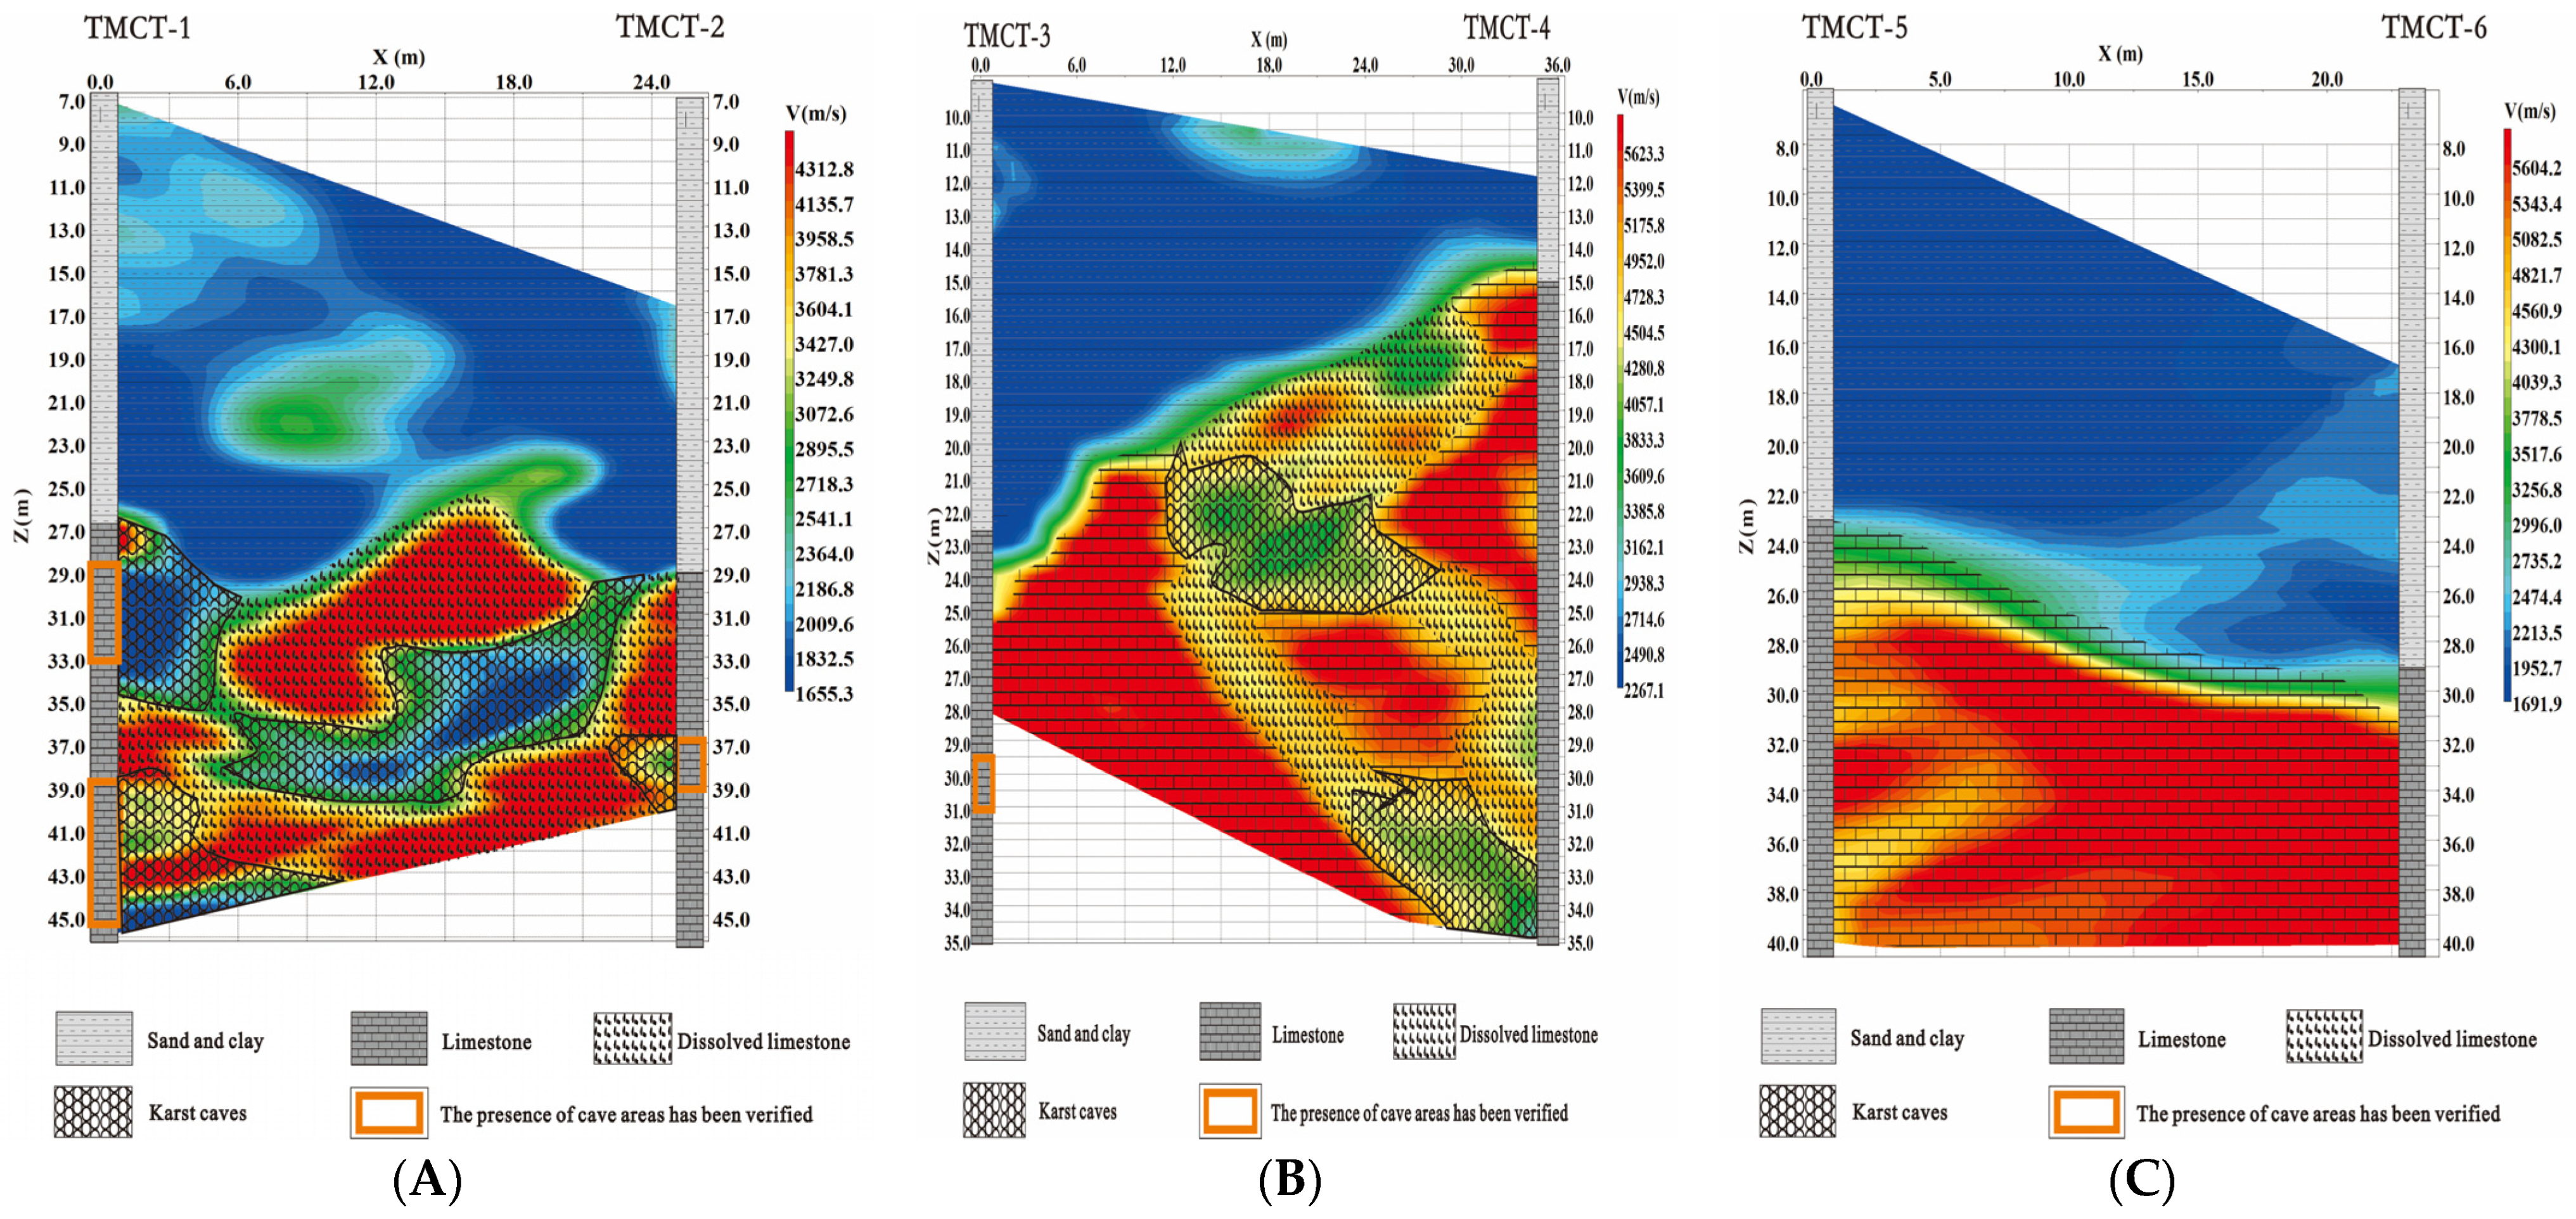
3.2. Cross-Well Seismic Computed Tomography Results

The layout diagram of the cross-well seismic computed tomography imaging survey lines is presented in Figure 3. In this study, three representative groups of profiles were selected for detection, which were TMCT 1–TMCT 2, providing the cross-well seismic computed tomography profile in the south of the urban village near the pond to verify the potential water conduction channel at 120 m of the G1–G2 line of the electrical resistivity tomography method; TMCT 3–TMCT 4, providing the cross-well seismic computed tomography profile in the middle of the urban village and verifying the small karst at 135 m and 25 m depth in section G4; and TMCT 5–TMCT 6, providing the profile in the northernmost part of the urban village, verifying the integrity of the limestone in the 0–60 m blind area of the G3–G5 measurement line of the electrical resistivity tomography method. The six boreholes are mainly distributed at the roadside which is convenient for operation and inside the wide alley. The data processing results are shown in Figure 7.
In the section TMCT 1–TMCT 2, the wave velocity within the soil layer is less than 2000 m/s, while the maximum wave velocity in the bedrock region reaches approximately 4500 m/s. The geotechnical interface is situated at a depth of approximately 27 m. Numerous low-velocity anomalies are observed between the two boreholes. Specifically, low-velocity zones identified during drilling at depths of 29–33 m and 39–45 m in borehole 1, and 37–39 m in borehole 2, were confirmed to be karst cavities. Additionally, two large-scale interconnected anomalous traps were detected in the central section of the profile at depths of 33–39 m, exhibiting a wave velocity of 1800 m/s, which suggests the presence of bead-like karst cavities. The corollary for the G1–G2 profile of the electrical resistivity tomography method is proved.
In sections TMCT 3 to TMCT 4, the rock–soil interfaces exposed by boreholes exhibit depths of 23 m and 14 m, respectively. The intact bedrock exhibits a wave velocity of up to 5800 m/s. In the middle section and the vicinity of hole 4, a large low-velocity band with a wave velocity between 3200 and 4200 m/s is observed, which could be interpreted as filling caves. This indicates that the region is influenced by the groundwater dissolution process, but is significantly weakened relative to the southern region.
In sections TMCT 5 to TMCT 6, the majority of the bedrock maintains a wave velocity of approximately 5800 m/s, with only a minor low-velocity zone present near borehole 5, where the wave velocity still reaches 4500 m/s. This indicates that while the area is also affected by groundwater activity, the influence is comparatively weaker.
Based on the results of cross-well seismic computed tomography imaging interpretation and borehole records, it can be concluded that the rock–soil interface in this region exhibits significant variability, ranging from 14 to 35 m, without a clear pattern. The location of caves, bedrock wave velocity, and the distribution of dissolution zones are strongly correlated with proximity to the pond. From a large number of karst caves in the southernmost part to the TMCT 3–TMCT 4 section in the middle of Tianmeixin village, the karst area and the degree of erosion decreased significantly, and the minor karst of TMCT 5-TMCT 6 was no longer necessary to treat. Therefore, future cross-well seismic computed tomography detection efforts should prioritize the southern section of the network. In the northern region, boreholes may be reduced or eliminated as appropriate to minimize drilling operations. The next cross-well seismic computed tomography detection area is marked by the red box in Figure 3, which is reduced by about two-fifths compared with the original detection area, and the amount of drilling is reduced by nearly 20 holes.

4. Discussion

In the process of subway construction, it is very important to grasp the karst regional scope and karst distribution law along the line in advance for subsequent karst detection planning and reducing project risks. Dense infrastructure, high-rise buildings, and complex road conditions in urban environments pose challenges for drilling and many geophysical detection methods [40]. Electromagnetic noise from residential electricity, vibration from traffic, and interference such as steel and building materials can cover useful information. It greatly limits the detection effect of the geo-radar method, microseismic method, and transient electromagnetic method. Therefore, in order to realize the accurate detection of the karst distribution range and law, the appropriate combination of geophysical prospecting means should be selected according to the conditions of the construction site.
As a significant geophysical exploration technique, the electrical resistivity tomography method is widely used in the field of mineral resources and water-bearing structure detection, which is based on the resistivity difference in geological bodies to detect underground structures. Taking advantage of its strong anti-interference ability and large detection range, this paper sets up multiple survey lines in Tianmeixin village and near the southern pond and compares and analyzes the change trend of resistivity of each section. It is concluded that the karst development degree of the village is gradually increasing from north to south, and it is inferred that the connection between the southern pond and the underground water in Tianmeixin village is the main reason controlling the karst development. This indicates that the karst in this area may still be in the process of development, and the area is gradually increasing, which causes security risks to the long-term stability and subsequent operation of the subway tunnel. However, the measurement line of the electrical resistivity tomography method must be straight and has a minimum detection length requirement, which is often limited by the detection environment. Moreover, as the detection depth increases, the lateral detection range in the deep section decreases, and the interpretation results show an inverted trapezoidal shape with large detection blind spots on both sides. In addition, the resolution of the electrical resistivity tomography method is low, so it can only roughly locate the karst distribution area. It is difficult to describe the karst boundary precisely, and it is difficult to meet the detection requirements of engineering only using this method [41].
The cross-well seismic computed tomography method is selected as the final karst detection method because of its strong anti-interference ability and high detection accuracy. However, the cross-well seismic computed tomography method needs to carry out detection in the borehole, and the cost is high. In this detection, the narrow streets and alleys in the urban villages greatly limit the area where drilling construction can be carried out, so it is necessary to narrow the detection area as much as possible to reduce the amount of drilling construction. Therefore, on the basis of the electrical resistivity tomography detection results, this paper uses several groups of representative detection method profiles that are easy to carry out to verify the inference about the range of karst development, and the results of the three geophysical exploration methods are in good agreement. It also proves the reliability of the inversion results of the two geophysical prospecting methods. Finally, the karst development zone in the south of Tianmeixin village is drawn as the key detection area, and reasonably reduces the workload of cross-well seismic computed tomography detection.
In addition, due to the errors caused by the device type, noise interference, scale effect, travel time extraction, and other reasons in the process of detection and inversion [42], as well as considering the heterogeneity of underground rock and soil layers and the influence of groundwater, the geophysical parameters such as wave velocity and resistivity of each rock and soil layer and karst vary widely. For the abnormal geological body and karst range, it mostly depends on personal engineering experience to speculate and draw circles by comparing the results of various detection methods. Future research should also pay attention to the quantitative interpretation of various geophysical exploration methods to increase the reliability and applicability of the results.

5. Conclusions

The reasonable combination of the resistivity tomography method and the cross-well seismic computer tomography method can effectively overcome the interference and limitation of multiple factors in complex detection environments, find potential water conduction channels, and accurately locate the geotechnical interface and spatial position of hidden karst caves. The electrical resistivity tomography method has a large detection range, which can reflect the overall distribution characteristics of karst. The cross-well seismic computed tomography method can make up for the defects of the detection blind spot and the difficulty of describing the karst boundary shape in the electrical resistivity tomography method. The detection results show that the karst in Tianmeixin village is mainly distributed in the south of the village due to the influence of the groundwater system, and the karst development degree shows a trend of gradually weakening with the increase in distance from the pond, and the main occurrence depth is 10–42 m. In this study, according to the detection results, about two-fifths of the detection area was cut, nearly 20 drilling holes were reduced, the construction period was shortened, the detection cost was saved, and the impact on the production and life of residents was reduced.

Author Contributions

Conceptualization, J.F.; methodology, J.F. and S.J.; project administration, J.F.; writing—original draft, Y.Z.; data curation, J.M.; writing—review and editing, S.J. All authors have read and agreed to the published version of the manuscript.

Funding

This research received no external funding.

Institutional Review Board Statement

Not applicable.

Informed Consent Statement

Not applicable.

Data Availability Statement

The original contributions presented in the study are included in the article; further inquiries can be directed to the corresponding author.

Acknowledgments

Thank you to all the professors, reviewers, and editors who helped me with data collection and interpretation, manuscript writing, and revision.

Conflicts of Interest

The authors declare no conflicts of interest.

References

  1. Adler, S. The Great Society Subway: A History of the Washington Metro. J. Am. Hist. 2007, 93, 1281–1282. [Google Scholar] [CrossRef]
  2. Soriguera, F.; Martínez, I.; Sala, M.; Menéndez, M. Effects of low speed limits on freeway traffic flow. Transp. Res. Part C Emerg. Technol. 2017, 77, 257–274. [Google Scholar] [CrossRef]
  3. Wey, W.-M.; Zhang, H.; Chang, Y. Alternative transit-oriented development evaluation in sustainable built environment planning. Habitat Int. 2016, 55, 109–123. [Google Scholar] [CrossRef]
  4. Xue, Y.; Cao, X.; Ai, Y.; Xu, K.; Zhang, Y. Primary Air Pollutants Emissions Variation Characteristics and Future Control Strategies for Transportation Sector in Beijing, China. Sustainability 2020, 12, 4111. [Google Scholar] [CrossRef]
  5. Cui, Q.; Shen, S.; Xu, Y.; Wu, H.; Yin, Z. Mitigation of geohazards during deep excavations in karst regions with caverns: A case study. Eng. Geol. 2015, 195, 16–27. [Google Scholar] [CrossRef]
  6. Liao, S.; Liu, J.; Wang, R.; Li, Z. Shield tunneling and environment protection in Shanghai soft ground. Tunn. Undergr. Space Technol. 2009, 24, 454–465. [Google Scholar] [CrossRef]
  7. Sturk, R.; Olsson, L.; Johansson, J. Risk and decision analysis for large underground projects, as applied to the Stockholm Ring Road tunnels. Tunn. Undergr. Space Technol. 1996, 11, 157–164. [Google Scholar] [CrossRef]
  8. Xiong, C.H. Guangzhou Metro 8,9-line Distribution of Karst and the Impact of the Project. Guangdong Archit. Civ. Eng. 2014, 21, 59–62. [Google Scholar] [CrossRef]
  9. Xue, Y.; Li, X.; Li, G.; Qiu, D.; Gong, H.; Kong, F. An analytical model for assessing soft rock tunnel collapse risk and its engineering application. Geomech. Eng. 2020, 23, 441–454. [Google Scholar] [CrossRef]
  10. Zhang, Q.; Tian, S.; Mo, Y.; Dong, X.; Hao, S. An expert system for prediction of Karst disaster in excavation of tunnels or underground structures through a carbonate rock area. Tunn. Undergr. Space Technol. 1993, 8, 373–378. [Google Scholar] [CrossRef]
  11. Fan, Y.S.; Zhang, Y.T. Analysis of main methods and difficulties of cavern survey in Wuhan metro. Resour. Environ. Eng. 2017, 31, 60–65. [Google Scholar] [CrossRef]
  12. Han, M.; Li, Z.; Mei, G.; Bao, X.; Jia, J.; Liu, L.; Li, Y. Characteristics of subway excavation in soft soil and protective effects of partition wall on the historical building and pile foundation building. Bull. Eng. Geol. Environ. 2022, 81, 307. [Google Scholar] [CrossRef]
  13. Zhong, S.; Wang, R. New landsonar method for survey of ground in busy town, karst caves in mountain and sea bottom on water. J. Eng. Geol. 2013, 21, 422–432. [Google Scholar]
  14. Stirbys, A.F.; Radwanski, Z.R.; Proctor, R.J.; Escandon, R.F. Los Angeles metro rail project–geologic and geotechnical design and construction constraints. Eng. Geol. 1999, 51, 203–224. [Google Scholar] [CrossRef]
  15. Liu, R.; Sun, H.; Qin, J.; Zheng, Z. A multi-geophysical approach to assess potential sinkholes in an urban area. Eng. Geol. 2023, 318, 107100. [Google Scholar] [CrossRef]
  16. Guo, D.D.; Zhao, L.H.; Gao, Z.J. High-density electrical method used in the application of karst collapse. Ground Water 2011, 33, 108–110. [Google Scholar]
  17. van Schoor, M. Detection of sinkholes using 2D electrical resistivity imaging. J. Appl. Geophys. 2002, 50, 393–399. [Google Scholar] [CrossRef]
  18. Tarik, L.; Benamara, A.; Chaibi, M.; Tarik, M.; Hritta, D.; Bouhali, K. Application and comparison of very low frequency electromagnetic and electrical resistivity techniques to investigate a Karstic Region: A case study of EL Hajeb Municipality, Morocco. J. Appl. Geophys. 2023, 215, 105121. [Google Scholar] [CrossRef]
  19. Jianjun, G.; Zhang, Y.X.; Xiao, L. An application of the high-density electrical resistivity method for detecting slide zones in deep-seated landslides in limestone areas. J. Appl. Geophys. 2020, 177, 104013. [Google Scholar] [CrossRef]
  20. Al-fares, W.; Bakalowicz, M.; Guérin, R.; Dukhan, M. Analysis of the karst aquifer structure of the Lamalou area (Hérault, France) with ground penetrating radar. J. Appl. Geophys. 2002, 51, 97–106. [Google Scholar] [CrossRef]
  21. Beres, M.; Luetscher, M.; Olivier, R. Integration of ground-penetrating radar and microgravimetric methods to map shallow caves. J. Appl. Geophys. 2001, 46, 249–262. [Google Scholar] [CrossRef]
  22. Azwin, I.N.; Saad, R.; Nordiana, M. Applying the Seismic Refraction Tomography for Site Characterization. APCBEE Procedia 2013, 5, 227–231. [Google Scholar] [CrossRef]
  23. Duan, C.; Yan, C.; Xu, B.; Zhou, Y. Crosshole seismic CT data field experiments and interpretation for karst caves in deep foundations. Eng. Geol. 2017, 228, 180–196. [Google Scholar] [CrossRef]
  24. Liu, Y.; Ng, Y.C.H.; Zhang, Y.; Yang, P.; Ku, T. Incorporating geotechnical and geophysical investigations for underground obstruction detection: A case study. Undergr. Space 2023, 11, 116–129. [Google Scholar] [CrossRef]
  25. Li, T.; Peng, T.; Guo, Y. Application of cross-hole seismic computerized tomography technology to karst caves survey. Hydrogeol. Eng. Geol. 2009, 36, 127–130. [Google Scholar]
  26. Hiltunen Dennis, R.; Dunn Patrick, W. Seismic Crosshole Tomography Studies of Foundation Sites in Karst Terrance. In Underground Construction and Ground Movement; American Society of Civil Engineers: Reston, VA, USA, 2012. [Google Scholar]
  27. Ardestani, V. Detecting, delineating and modeling the connected solution cavities in a dam site via microgravity data. Acta Geod. Geophys. 2013, 48, 123–138. [Google Scholar] [CrossRef]
  28. Xue, G.; Li, X. The technology of TEM tunnel prediction imaging. Chin. J. Geophys. 2008, 51, 894–900. [Google Scholar]
  29. Danielsen, J.E.; Auken, E.; Jørgensen, F.; Søndergaard, V.; Sørensen, K.I. The application of the transient electromagnetic method in hydrogeophysical surveys. J. Appl. Geophys. 2003, 53, 181–198. [Google Scholar] [CrossRef]
  30. Amanatidou, E.; Vargemezis, G.; Tsourlos, P. Combined application of seismic and electrical geophysical methods for karst cavities detection: A case study at the campus of the new University of Western Macedonia, Kozani, Greece. J. Appl. Geophys. 2021, 196, 104499. [Google Scholar] [CrossRef]
  31. Arifin, M.H.; Jamaluddin, T.A.; Husin, H.; Ismail, A.; Abbas, A.A.; Nordin, M.N.M.; Baioumy, H.; Kayode, J.S.; Ismail, N.; Othman, N.A.; et al. Comparison of geological mapping with electrical resistivity and ground penetration radar methods for rock fractured system study. Chiang Mai J. Sci. 2016, 43, 1346–1357. [Google Scholar]
  32. Carbonel, D.; Rodríguez Tribaldos, V.; McCalpin, J.; Linares, R.; Roqué, C.; Zarroca, M.; Guerrero, J.; Sasowsky, I. Evaluation of trenching, ground penetrating radar (GPR) and electrical resistivity tomography (ERT) for sinkhole characterization. Earth Surf. Process. Landf. 2014, 39, 214–227. [Google Scholar] [CrossRef]
  33. Perttu, N.; Persson, L.; Erlström, M.; Elming, S.-Å. Magnetic resonance sounding and radiomagnetotelluric measurements used to characterize a limestone aquifer in Gotland, Sweden. J. Hydrol. 2012, 424–425, 184–195. [Google Scholar] [CrossRef]
  34. Rossi, G.; Baradello, L.; Bolcato, S.; Bratus, A.; Picotti, S.; Wardell, N. Geophysical Integrated Approach to the Study of an Aquifer In a Karstic Area. In SEG Technical Program Expanded Abstracts 2002; Society of Exploration Geophysicists: Houston, TX, USA, 2002. [Google Scholar]
  35. Thierry, P.; Debeblia, N.; Bitri, A. Geophysical and geological characterisation of karst hazards in urban environments: Application to Orléans (France). Bull. Eng. Geol. Environ. 2005, 64, 139–150. [Google Scholar] [CrossRef]
  36. Wang, J.; Li, L.; Shi, S.; Sun, S.; Ba, X.; Zhang, Y. Fine Exploration and Control of Subway Crossing Karst Area. Appl. Sci. 2019, 9, 2588. [Google Scholar] [CrossRef]
  37. Ren, D.J.; Shen, S.L.; Cheng, W.C.; Zhang, N.; Wang, Z.F. Geological formation and geo-hazards during subway construction in Guangzhou. Environ. Earth Sci. 2016, 75, 934. [Google Scholar] [CrossRef]
  38. Meng, Y. Multi-Parameter Monitoring, Early Warning and Risk Prevention of Karst Collapse in Guanghua Basin. Ph.D. Thesis, China University of Geosciences, Wuhan, China, 2020. [Google Scholar]
  39. GB50307-2012; Code for Geotechnical Investigations of Urban Rail Transit. China Planning Press: Beijing, China, 2012.
  40. He, J.S.; Li, D.Q. Geophysical Exploration Methods for Strong Interference Urban Underground Space. Chin. J. Eng. Geophys. 2022, 19, 559–567. [Google Scholar]
  41. Tang, Z.G.; Cai, C.F.; Wu, L.J.; Li, W.J. Application of SeismicImaging method and High-Density Electrical Method in Karst Investigation. Constr. Des. Proj. 2024, 140–142. [Google Scholar] [CrossRef]
  42. Liu, D.X. Research and Application of Forward and Inverse Numerical Simulation of Karst Detection with High Density Electric Method. Master’s Thesis, Kunming University of Science and Technology, Kunming, China, 2021. [Google Scholar] [CrossRef]
Figure 1. Schematic diagram of internal traffic and carbonate distribution in Guanghua Basin (modified from Meng, 2020 [38]).
Applsci 15 05756 g001
Figure 2. Satellite images of study area.
Applsci 15 05756 g002
Figure 3. The electrical resistivity tomography method and cross-well seismic computed tomography method survey line layout in the study area.
Applsci 15 05756 g003
Figure 4. (A) Electrical resistivity tomography data acquisition. (B) Cross-well seismic computed tomography data acquisition.
Applsci 15 05756 g004
Figure 5. Inversion results and geological interpretation maps of resistivity tomography detection data from sections G1 and G2.
Applsci 15 05756 g005
Figure 6. Inversion results and geological interpretation maps of resistivity tomography detection data from sections G3–G5.
Applsci 15 05756 g006
Figure 7. Cross-well seismic computed tomography detection data inversion results and geological interpretation map. (A) TMCT 1–TMCT 2 section; (B) TMCT 3–TMCT 4 section; (C) TMCT 5–TMCT 6 section.
Applsci 15 05756 g007
Table 1. The reference range of longitudinal wave velocity and resistivity value of the main geological bodies in the study area.
Soil and Rock MassLongitudinal Wave Velocity (V)/m/sResisvity (p)/Ω·m
Regular RangeRegular Range
Clay (wet)800–20000.1–100
Sand (wet)1500–250050–500
Water14800.1–10
Limestone (karstified)2000–450050–500
Limestone (non-karstified)4000–6000100–10,000
Disclaimer/Publisher’s Note: The statements, opinions and data contained in all publications are solely those of the individual author(s) and contributor(s) and not of MDPI and/or the editor(s). MDPI and/or the editor(s) disclaim responsibility for any injury to people or property resulting from any ideas, methods, instructions or products referred to in the content.

