Fracture Threshold Analysis and Parameter Matching of Cut-Out Induced Bolts for Subway Couplers

Abstract
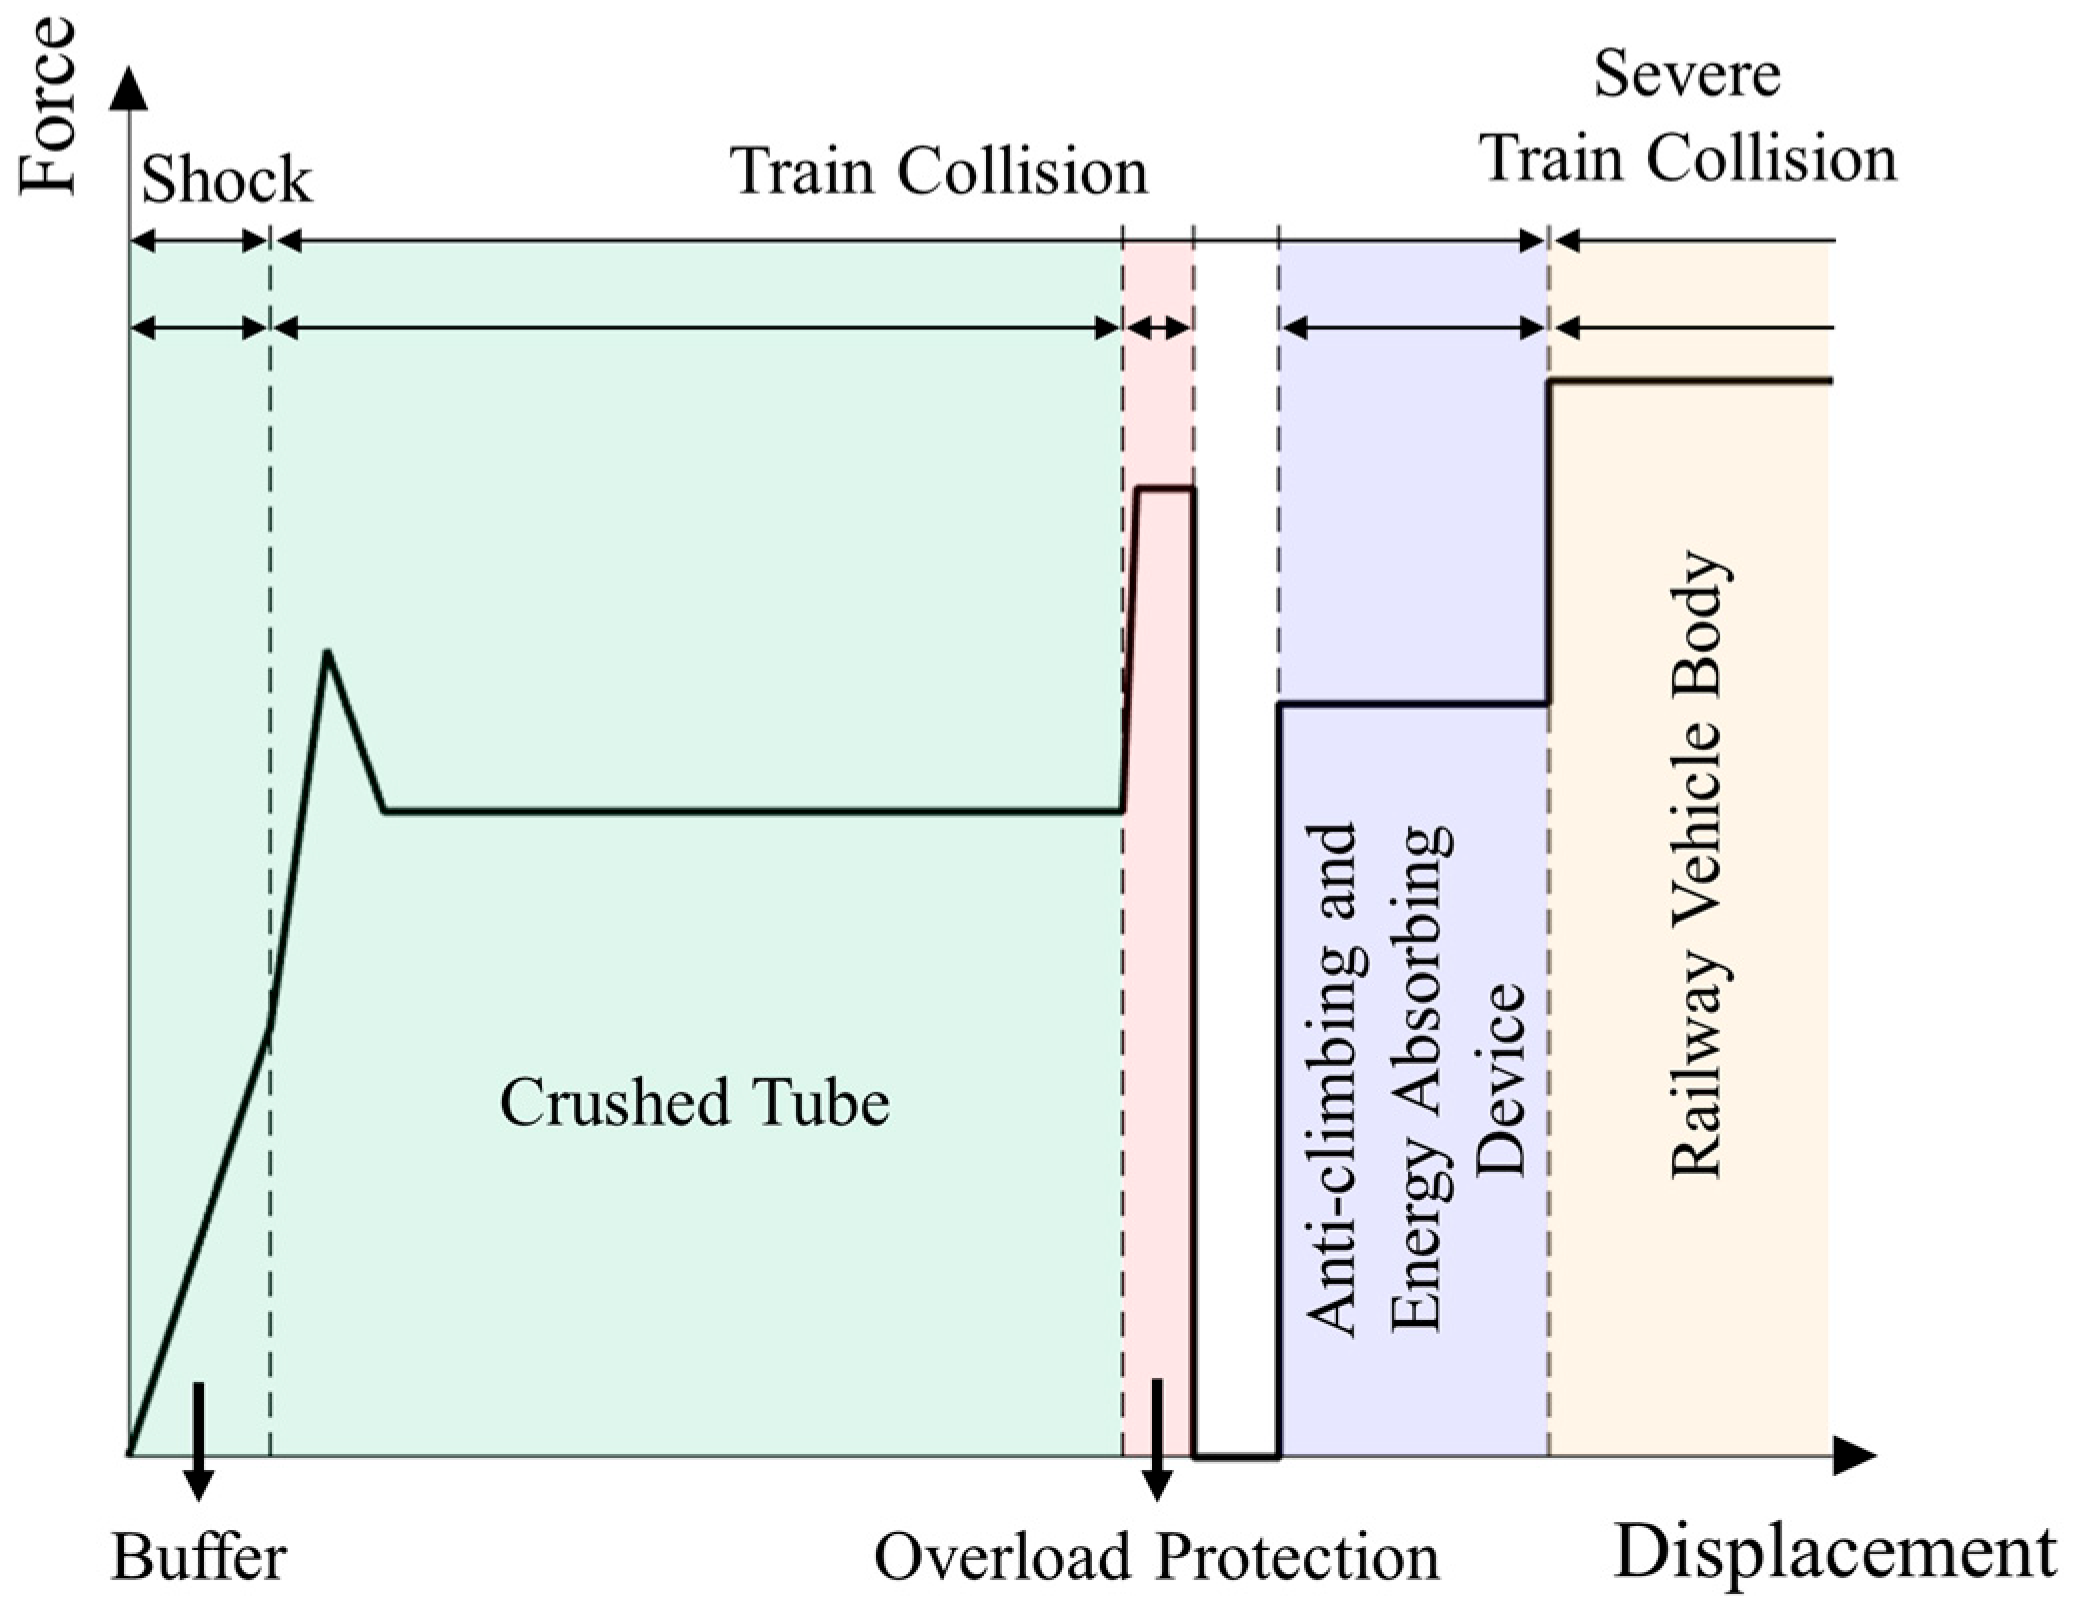
1. Introduction
2. Experiment and Simulation Analysis
2.1. Impact Experiment
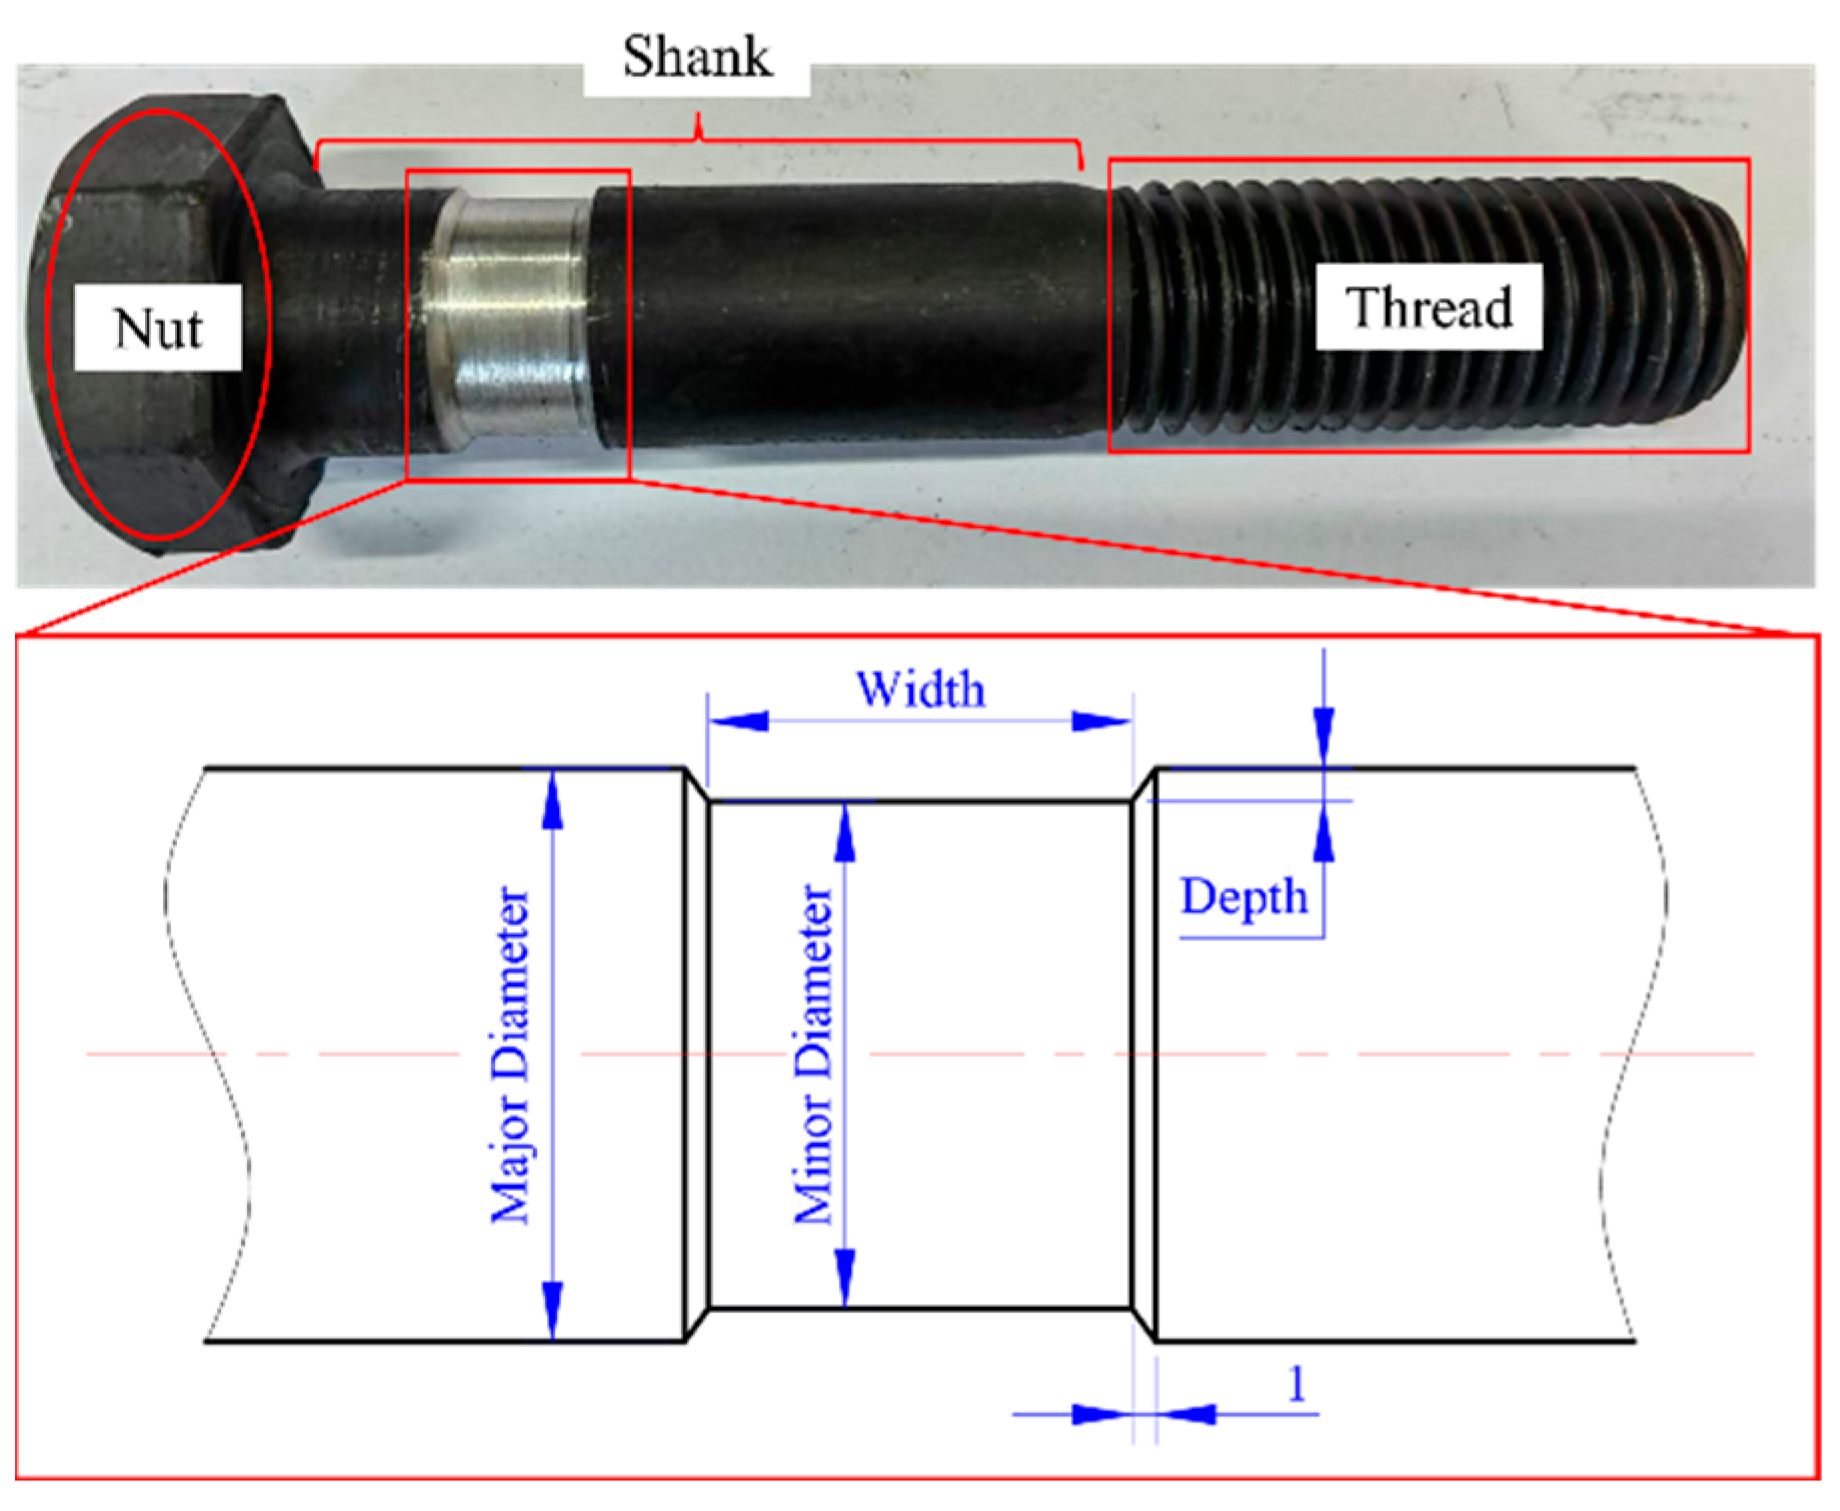
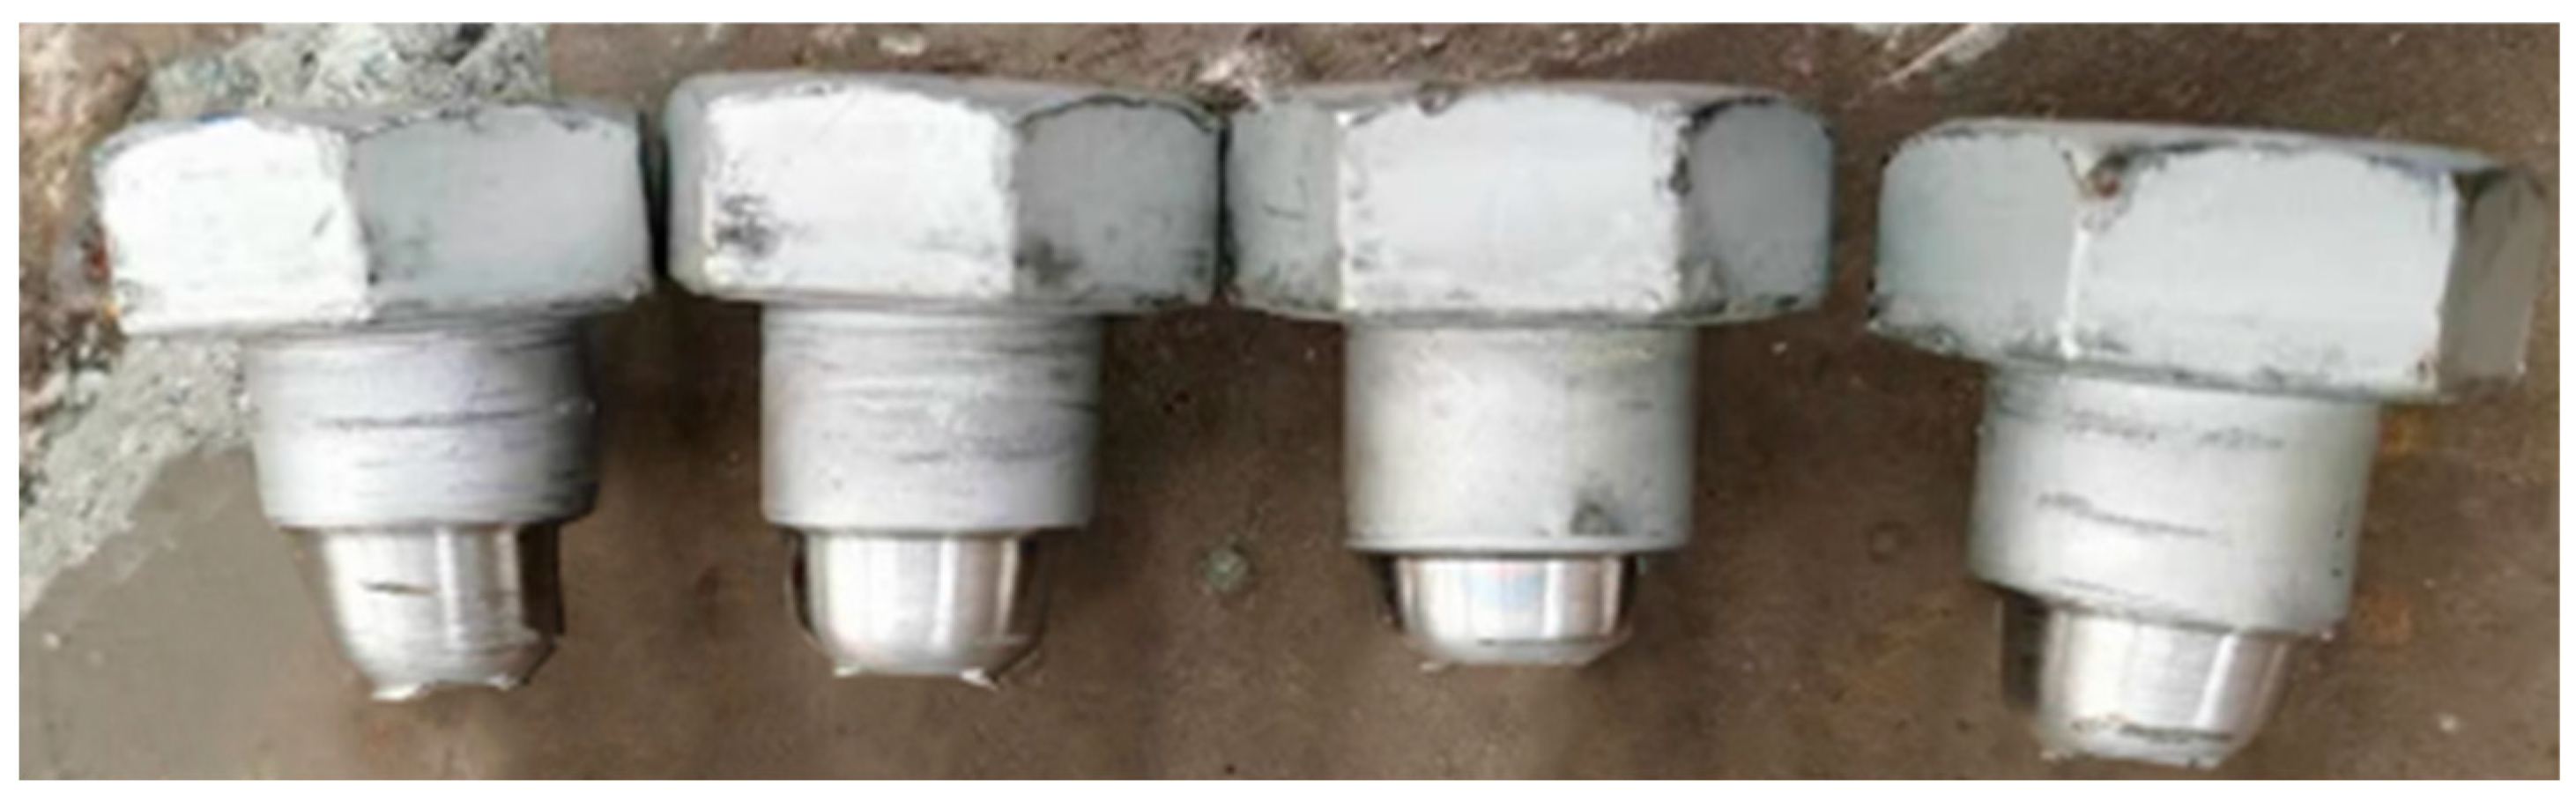
2.1.1. Cut-Out Induced Bolt
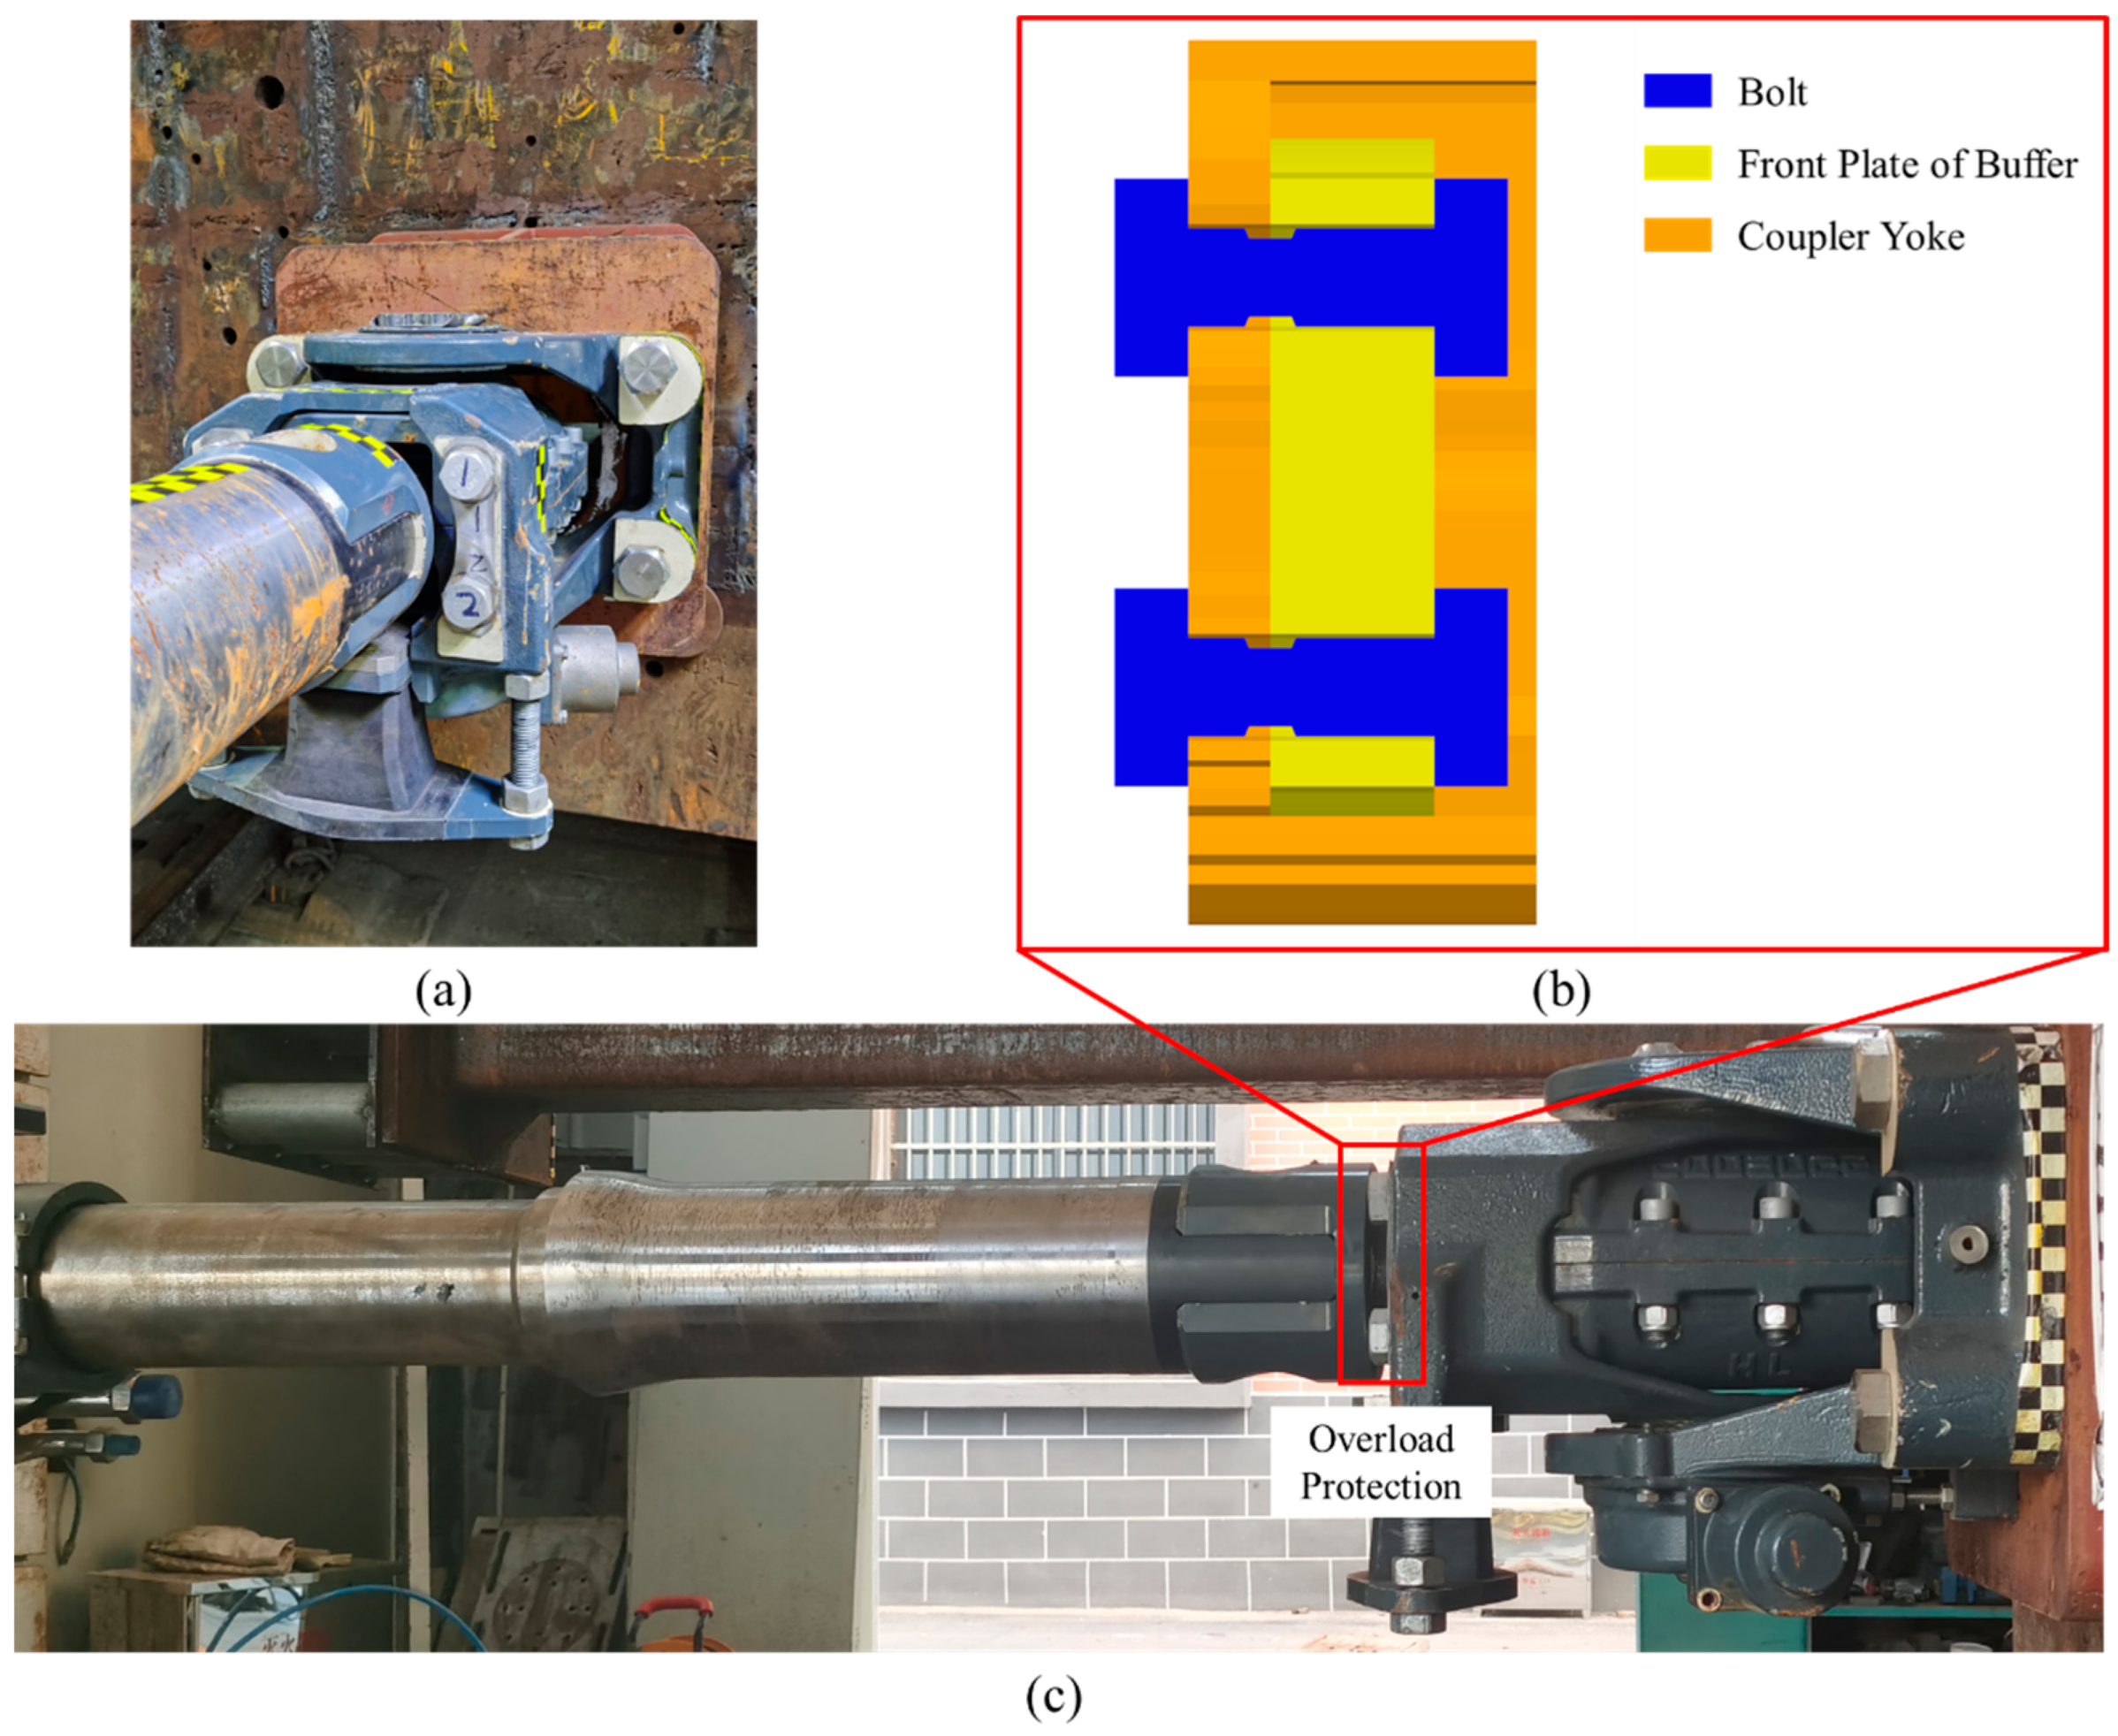
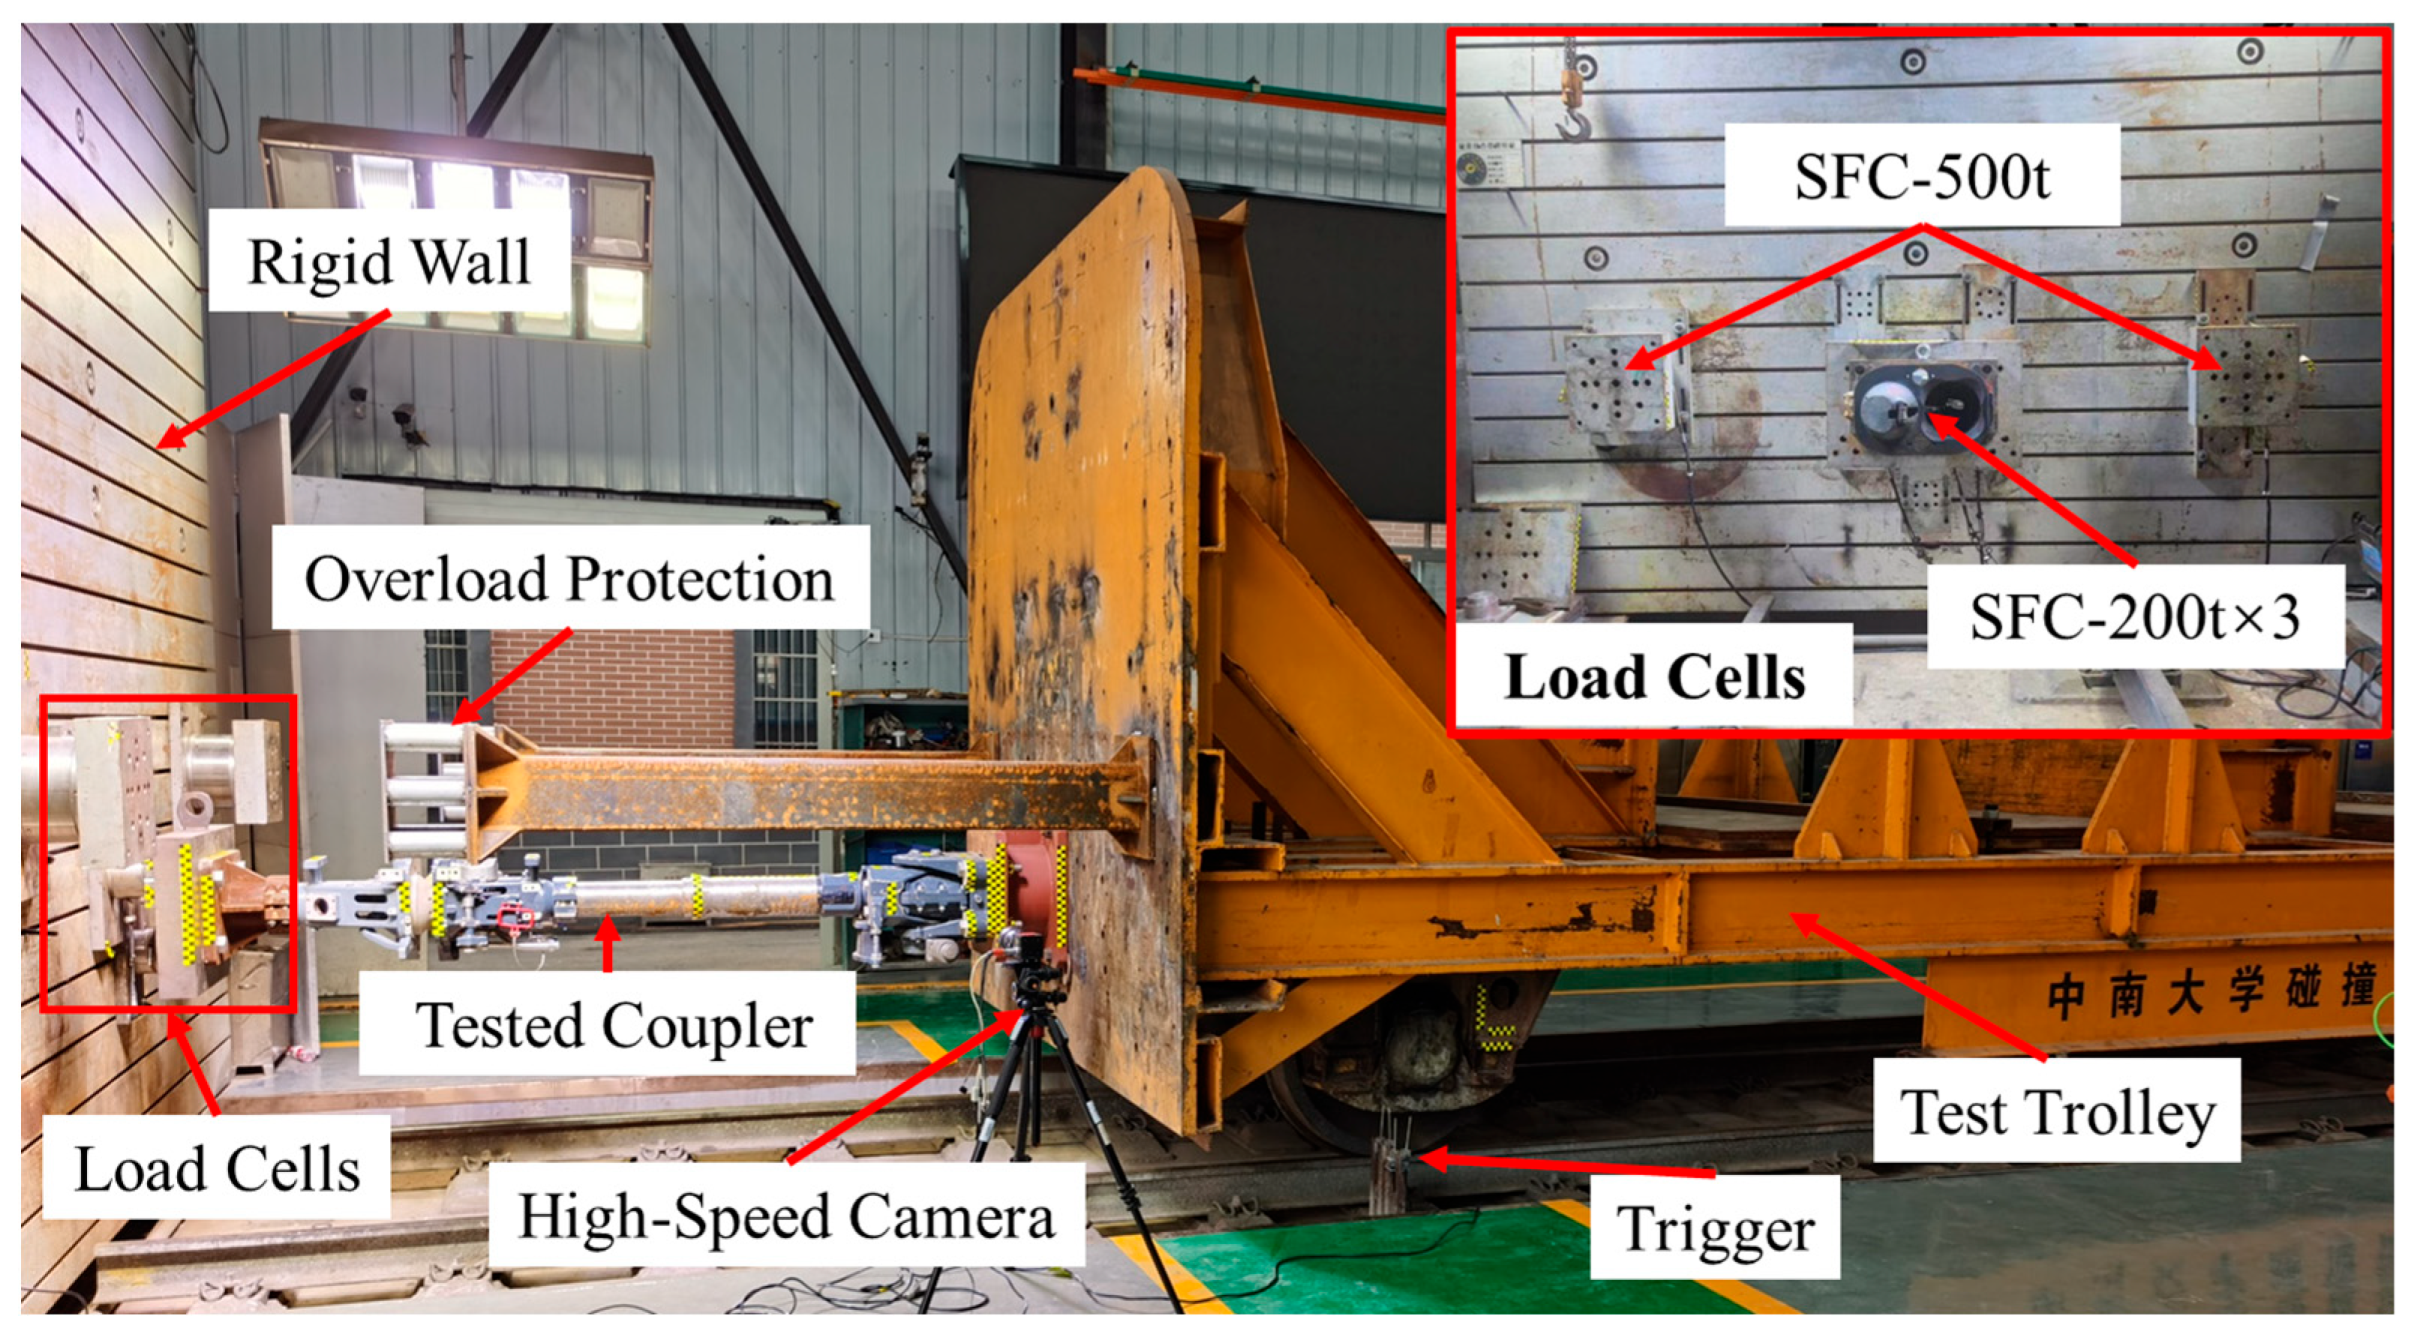
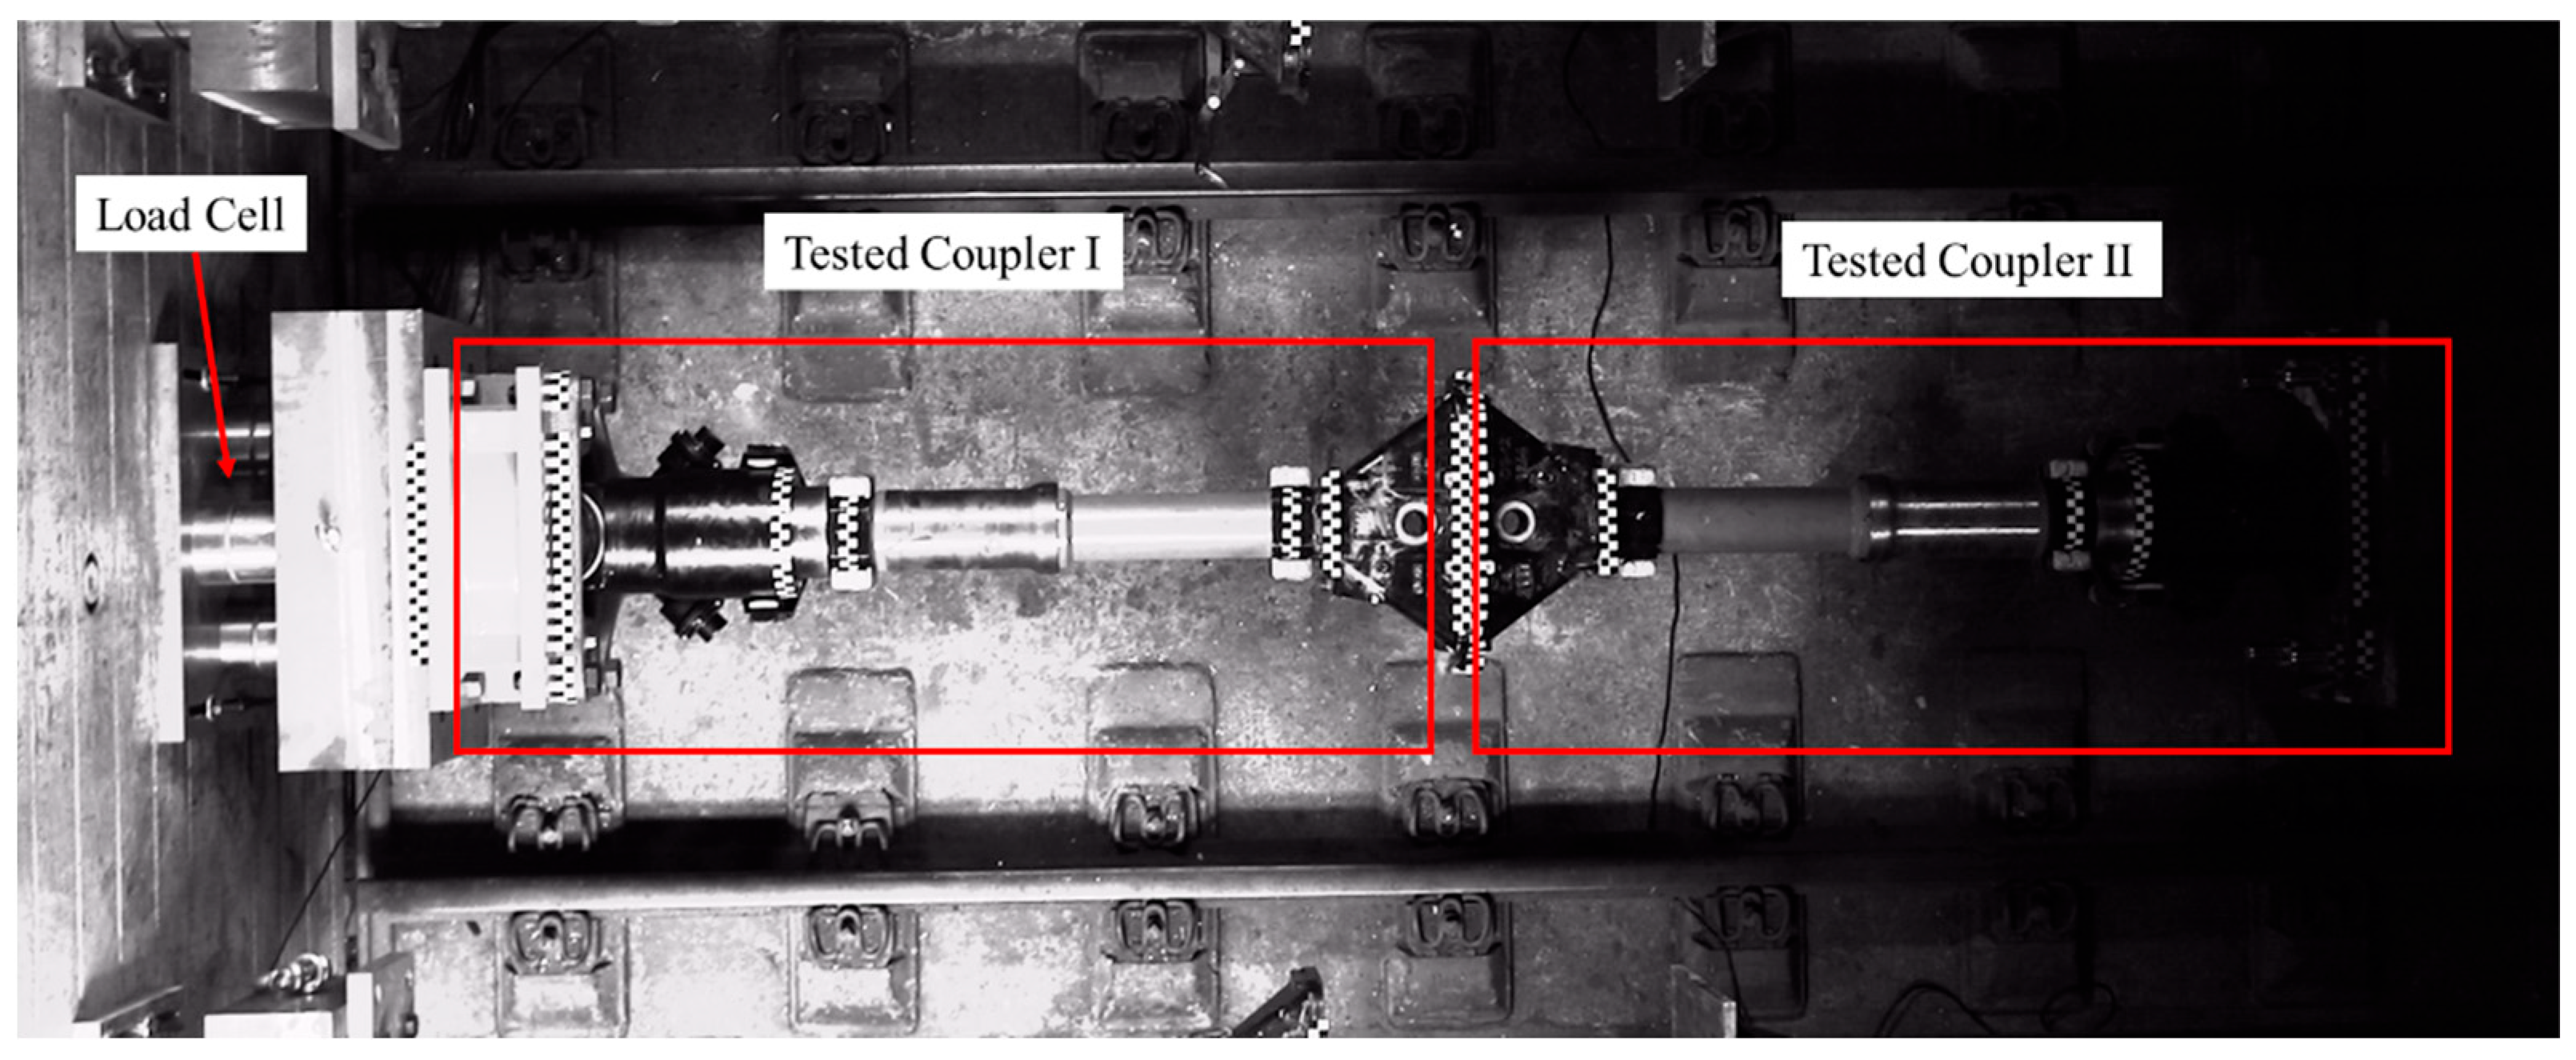
2.1.2. Experimental Setup
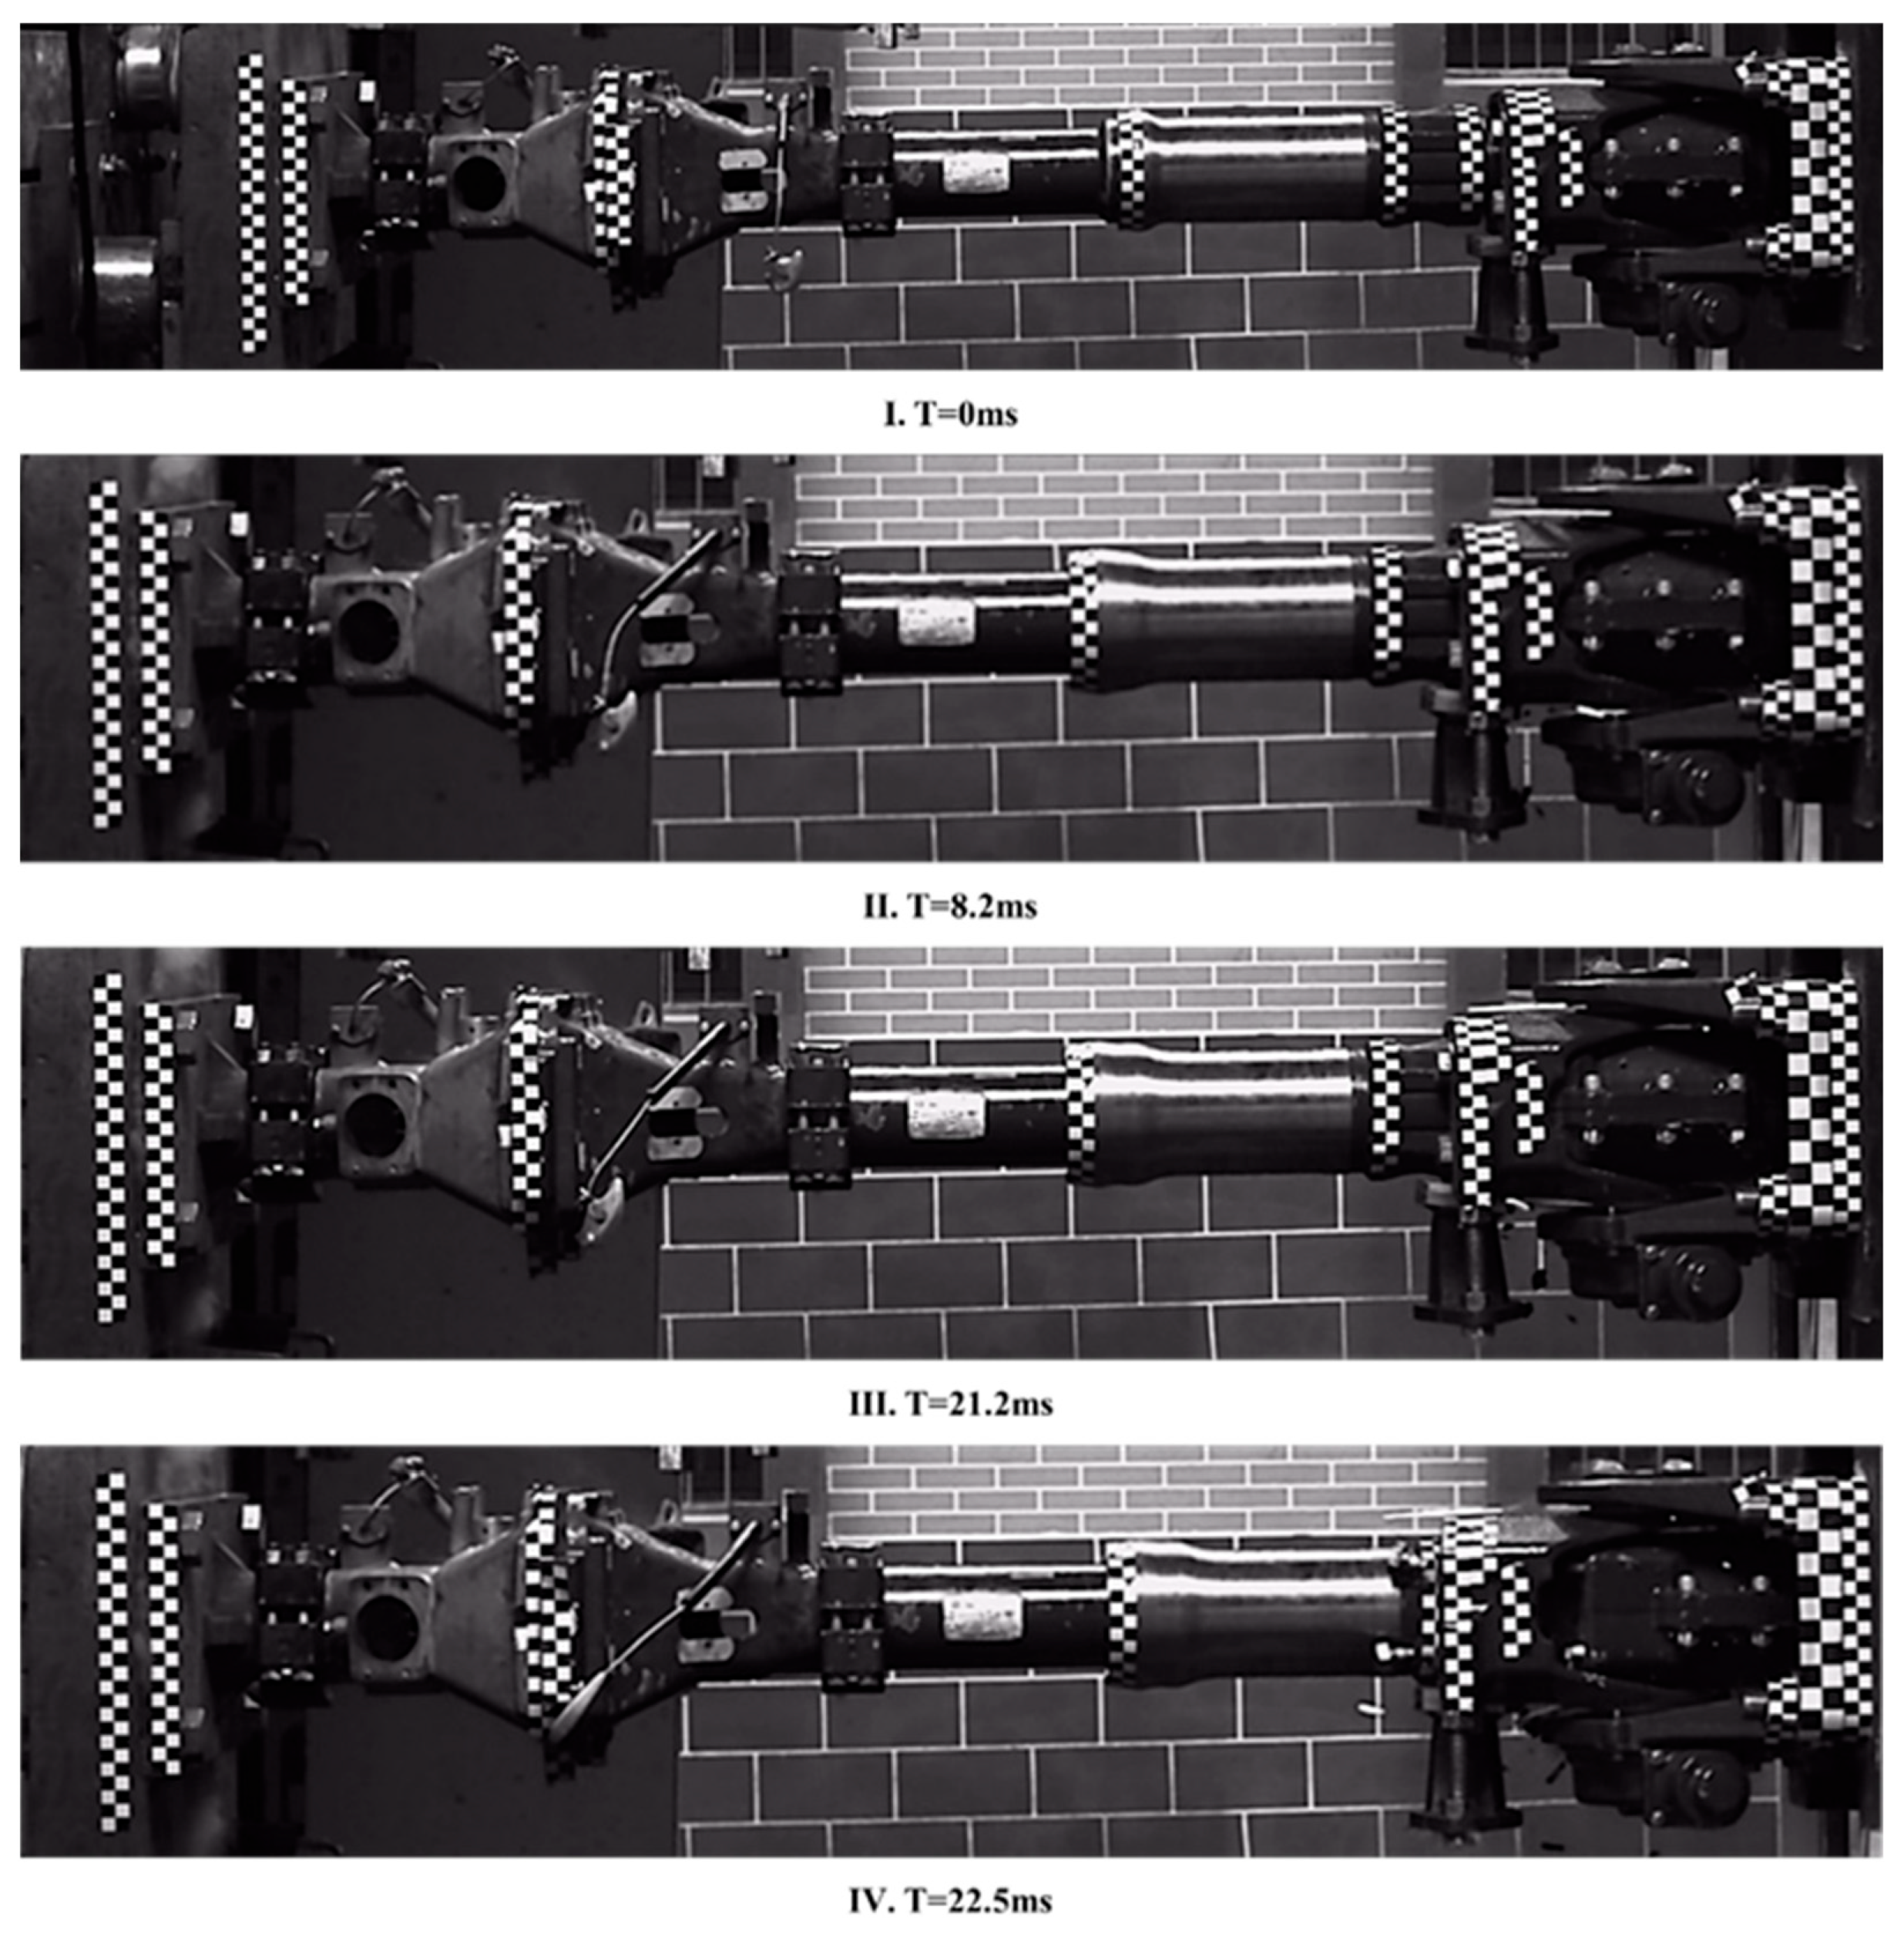
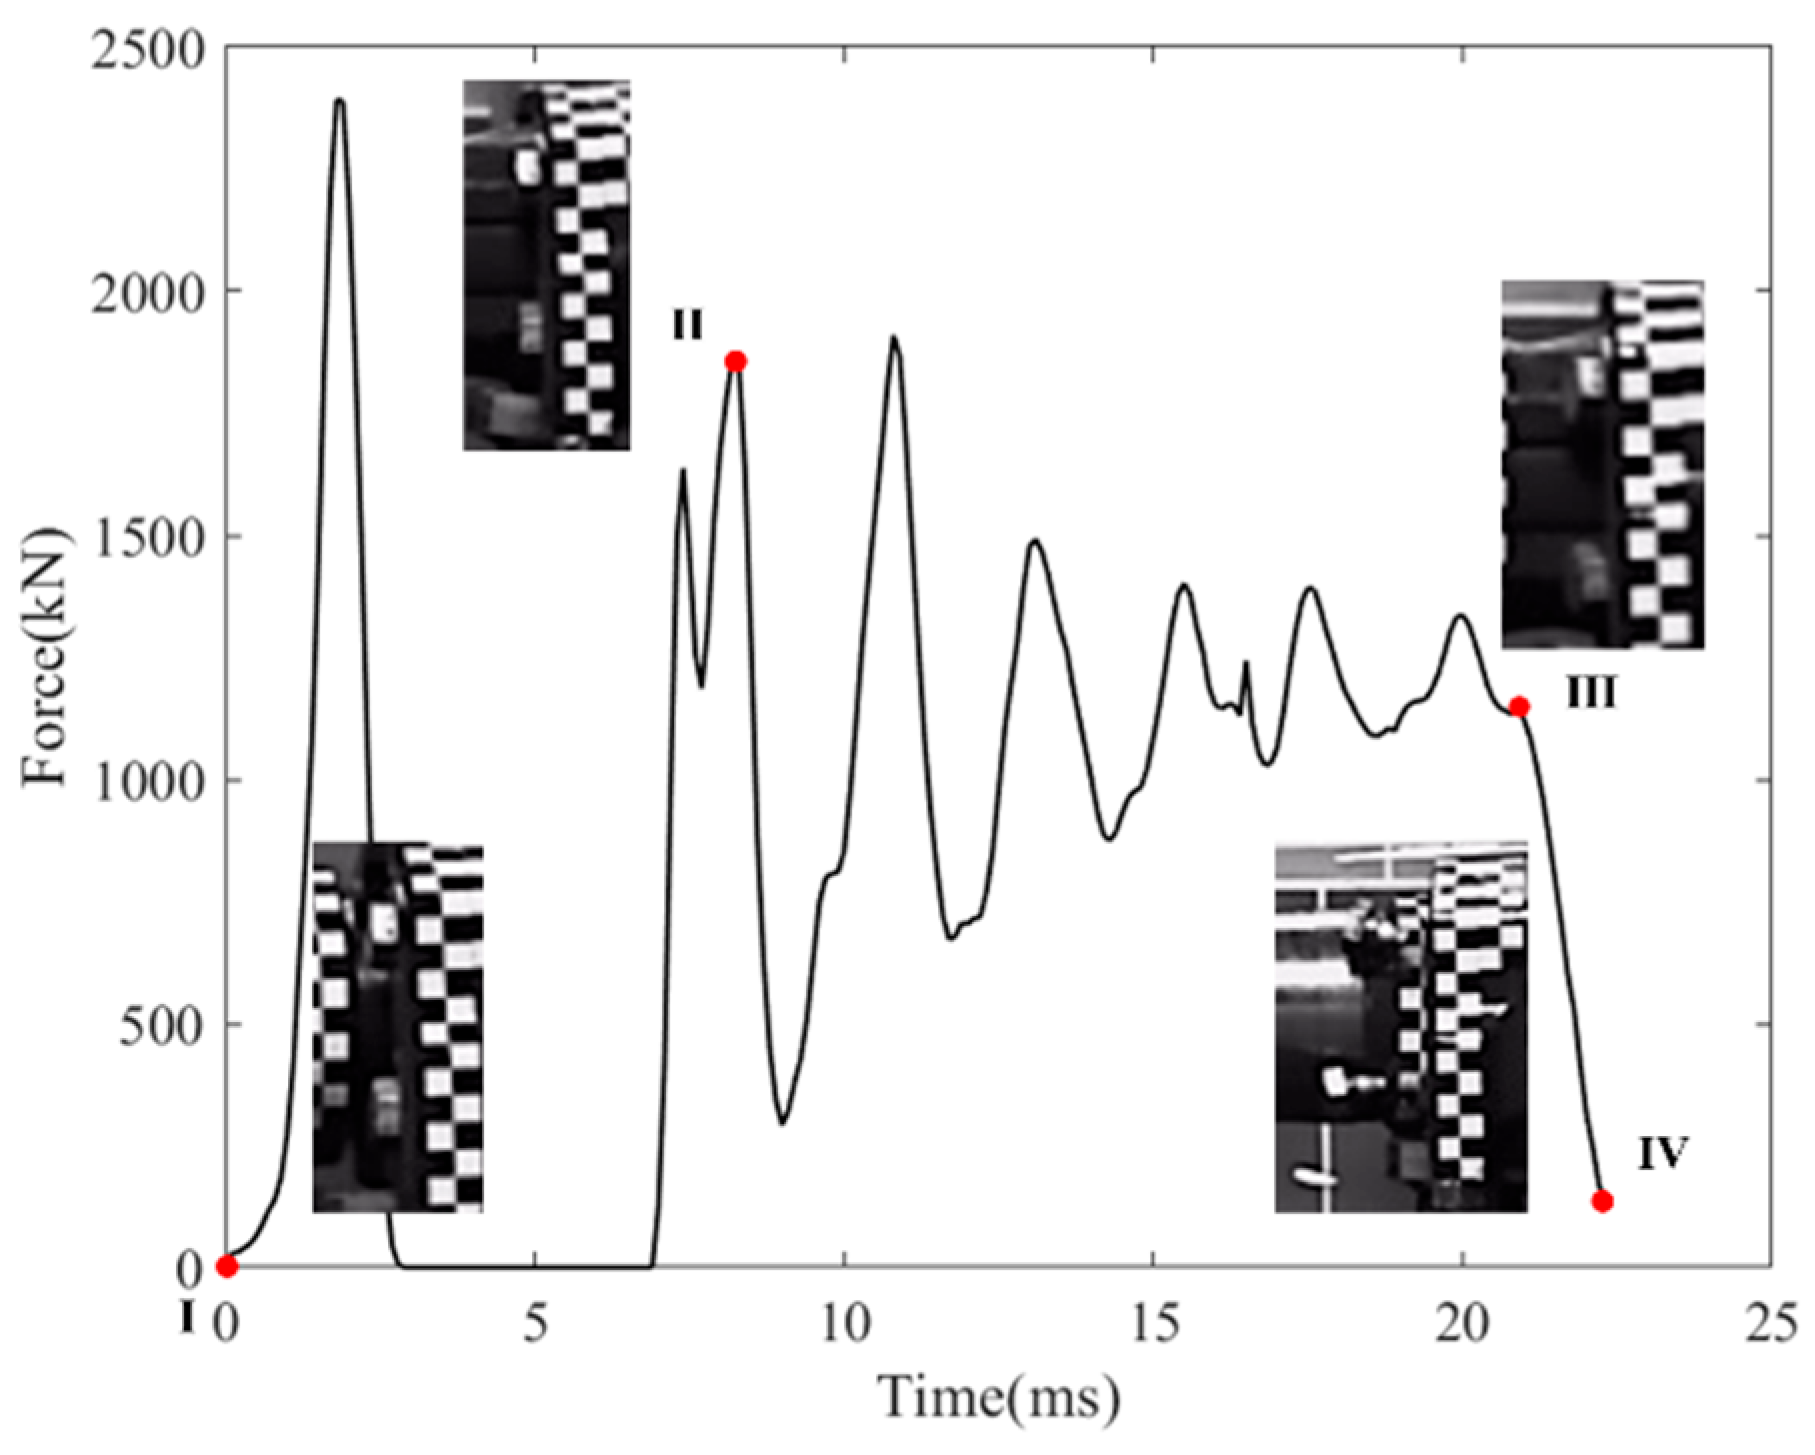
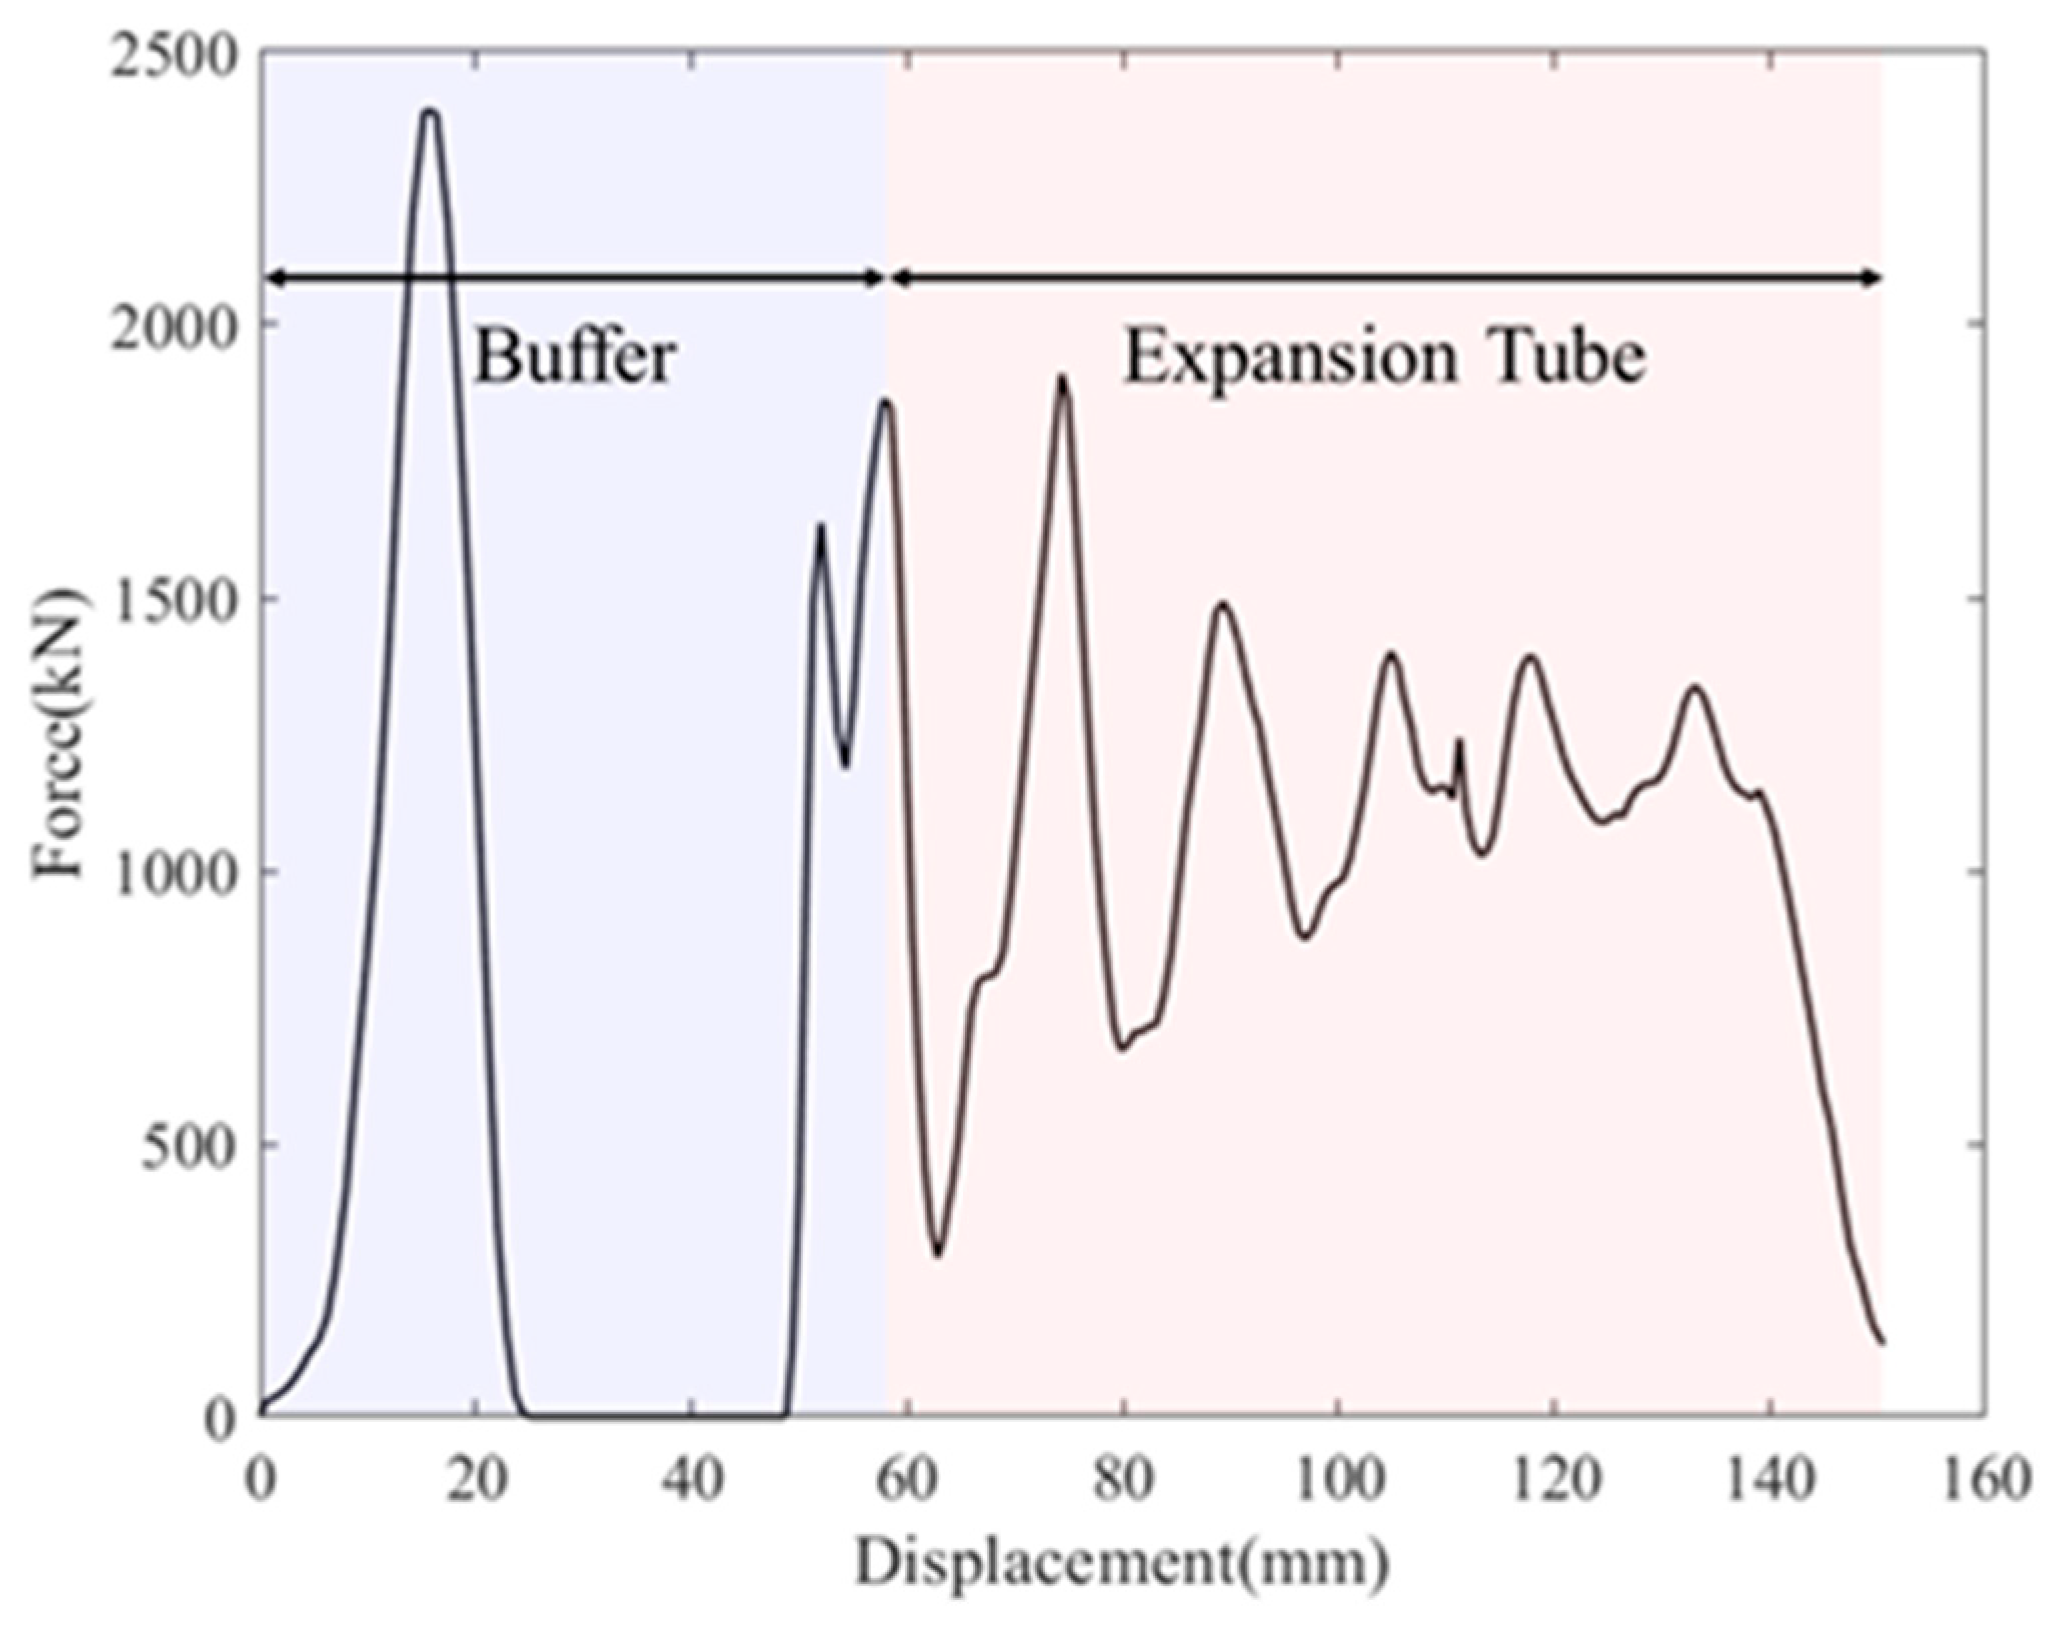
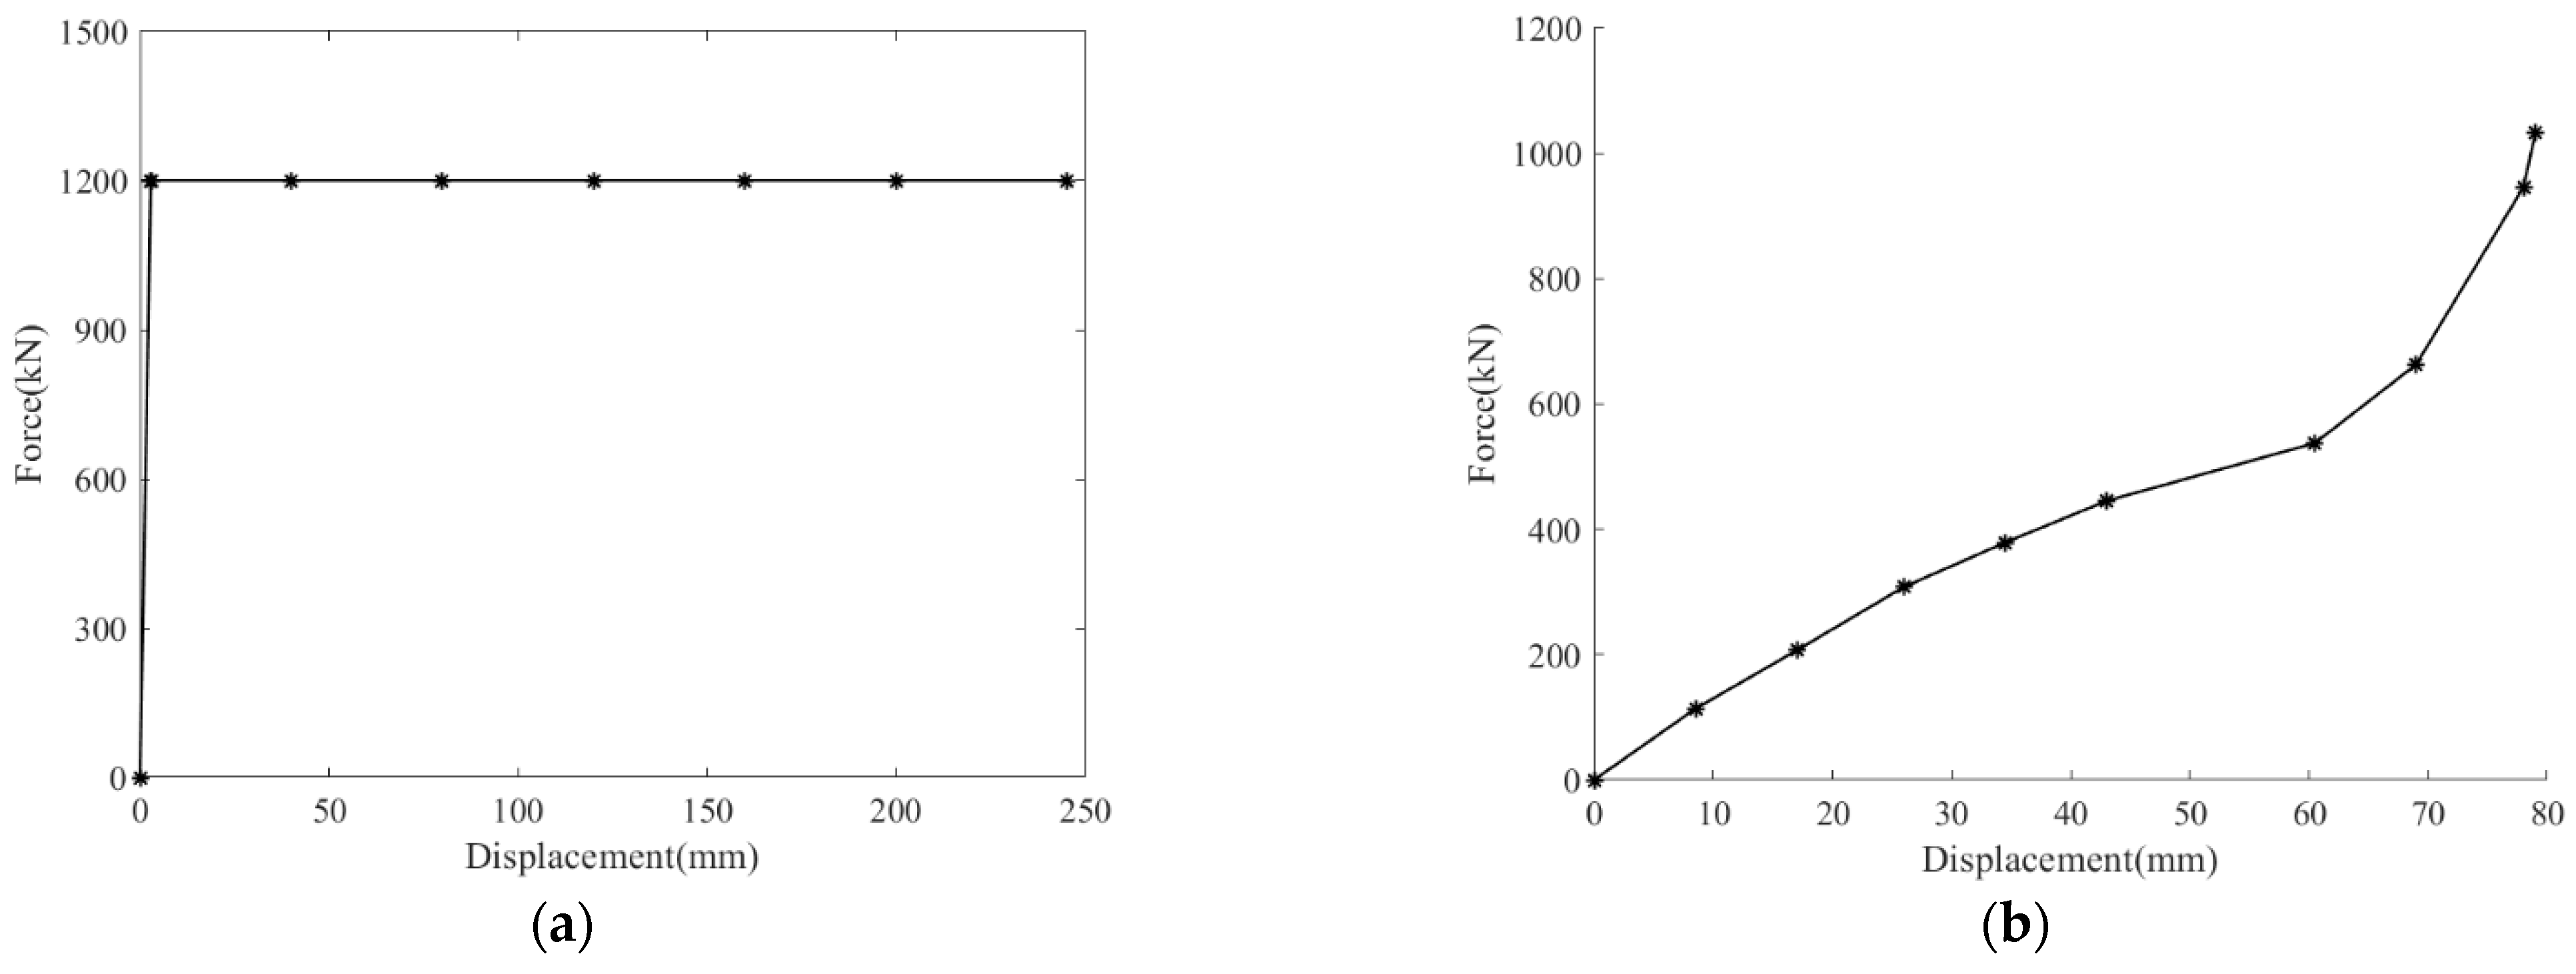
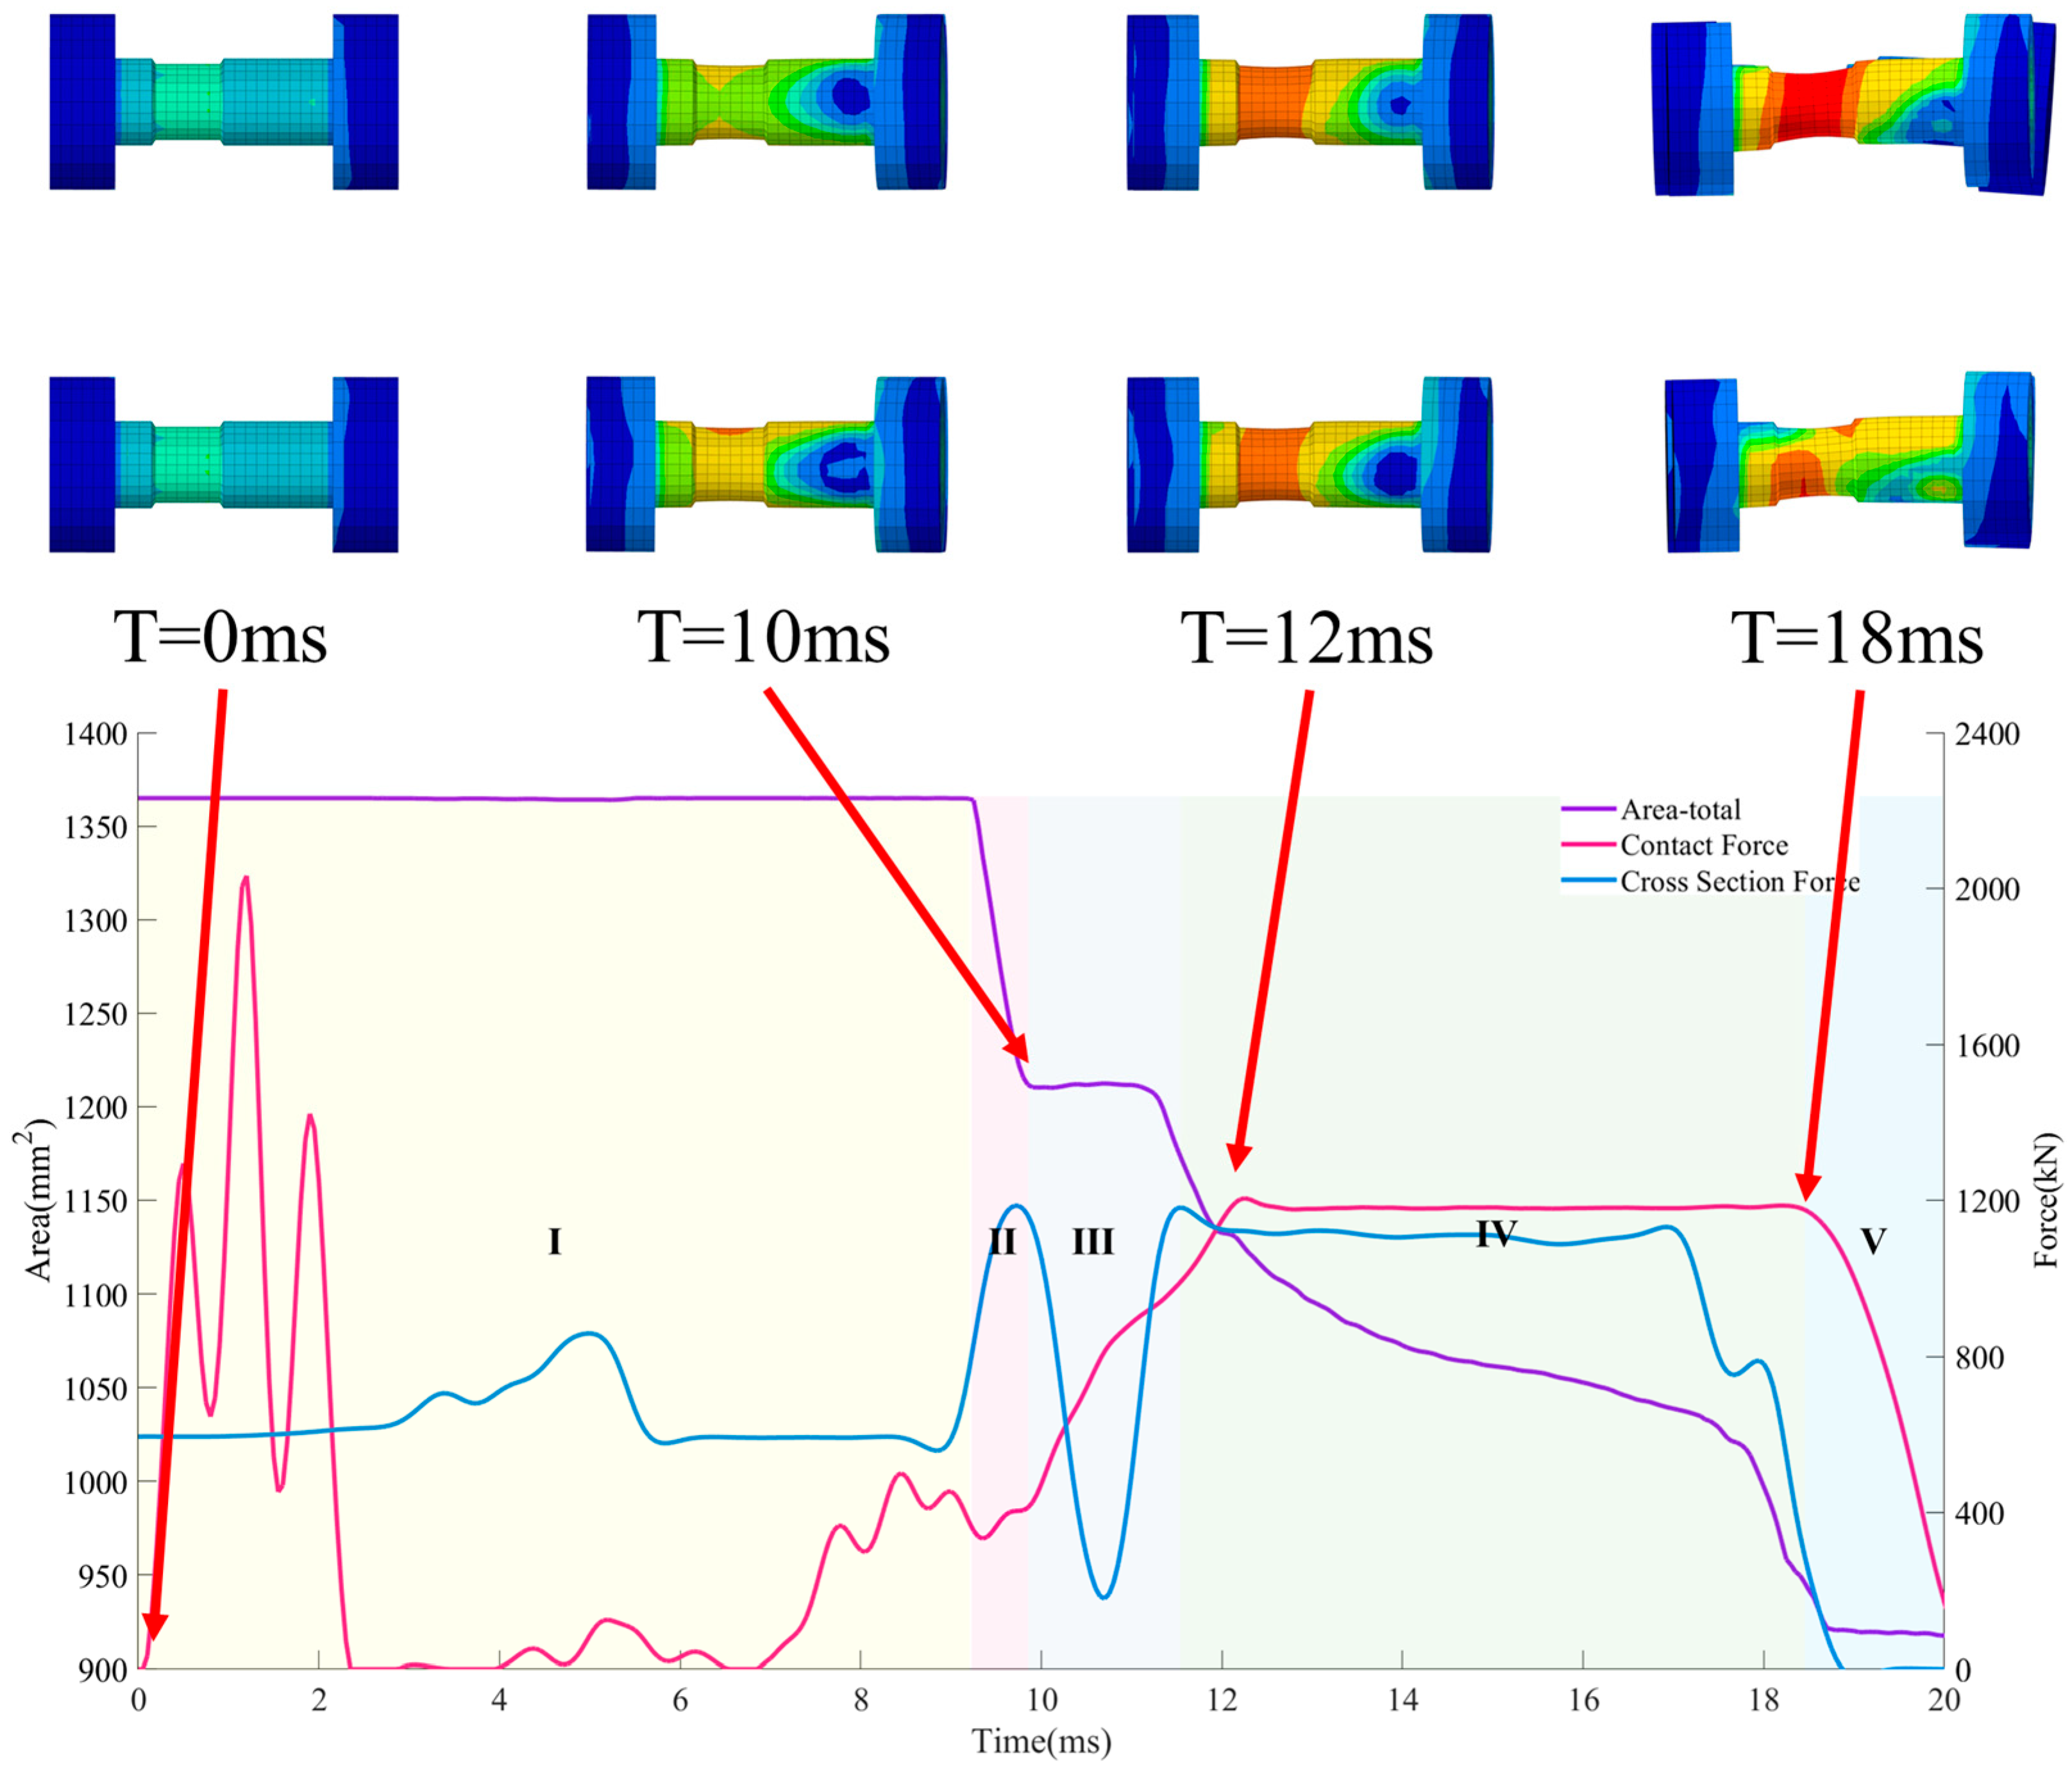
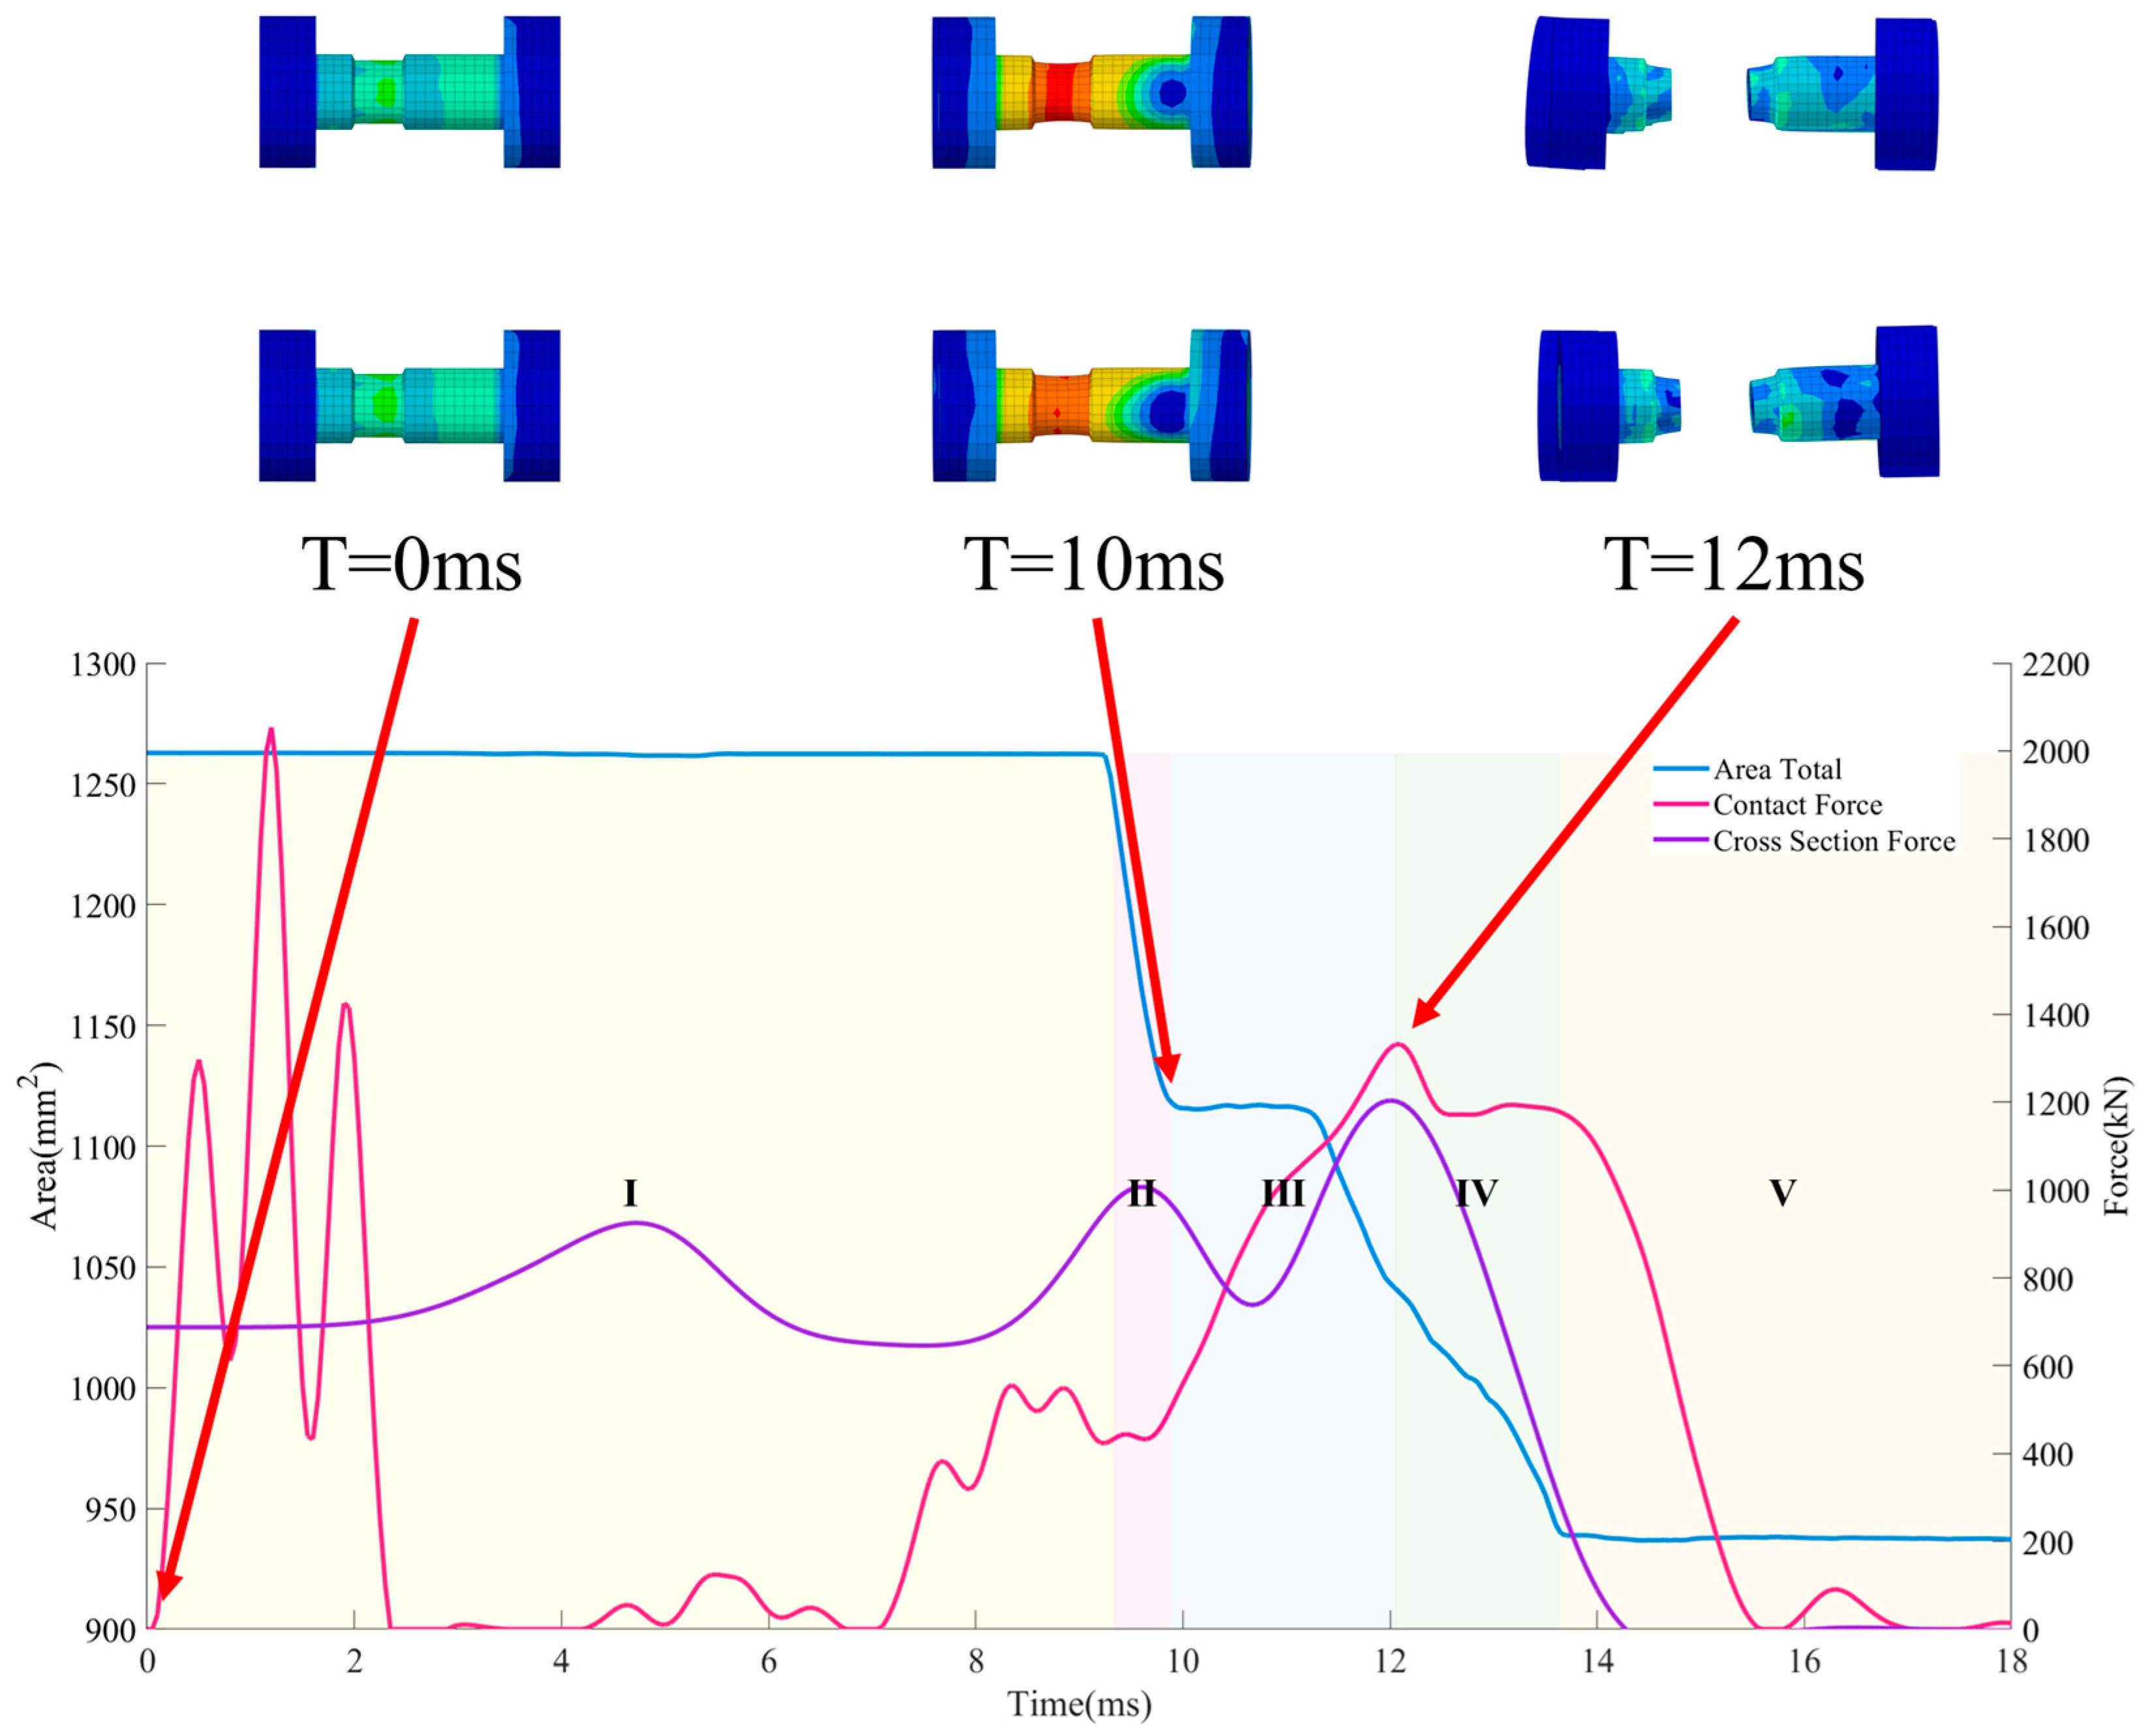
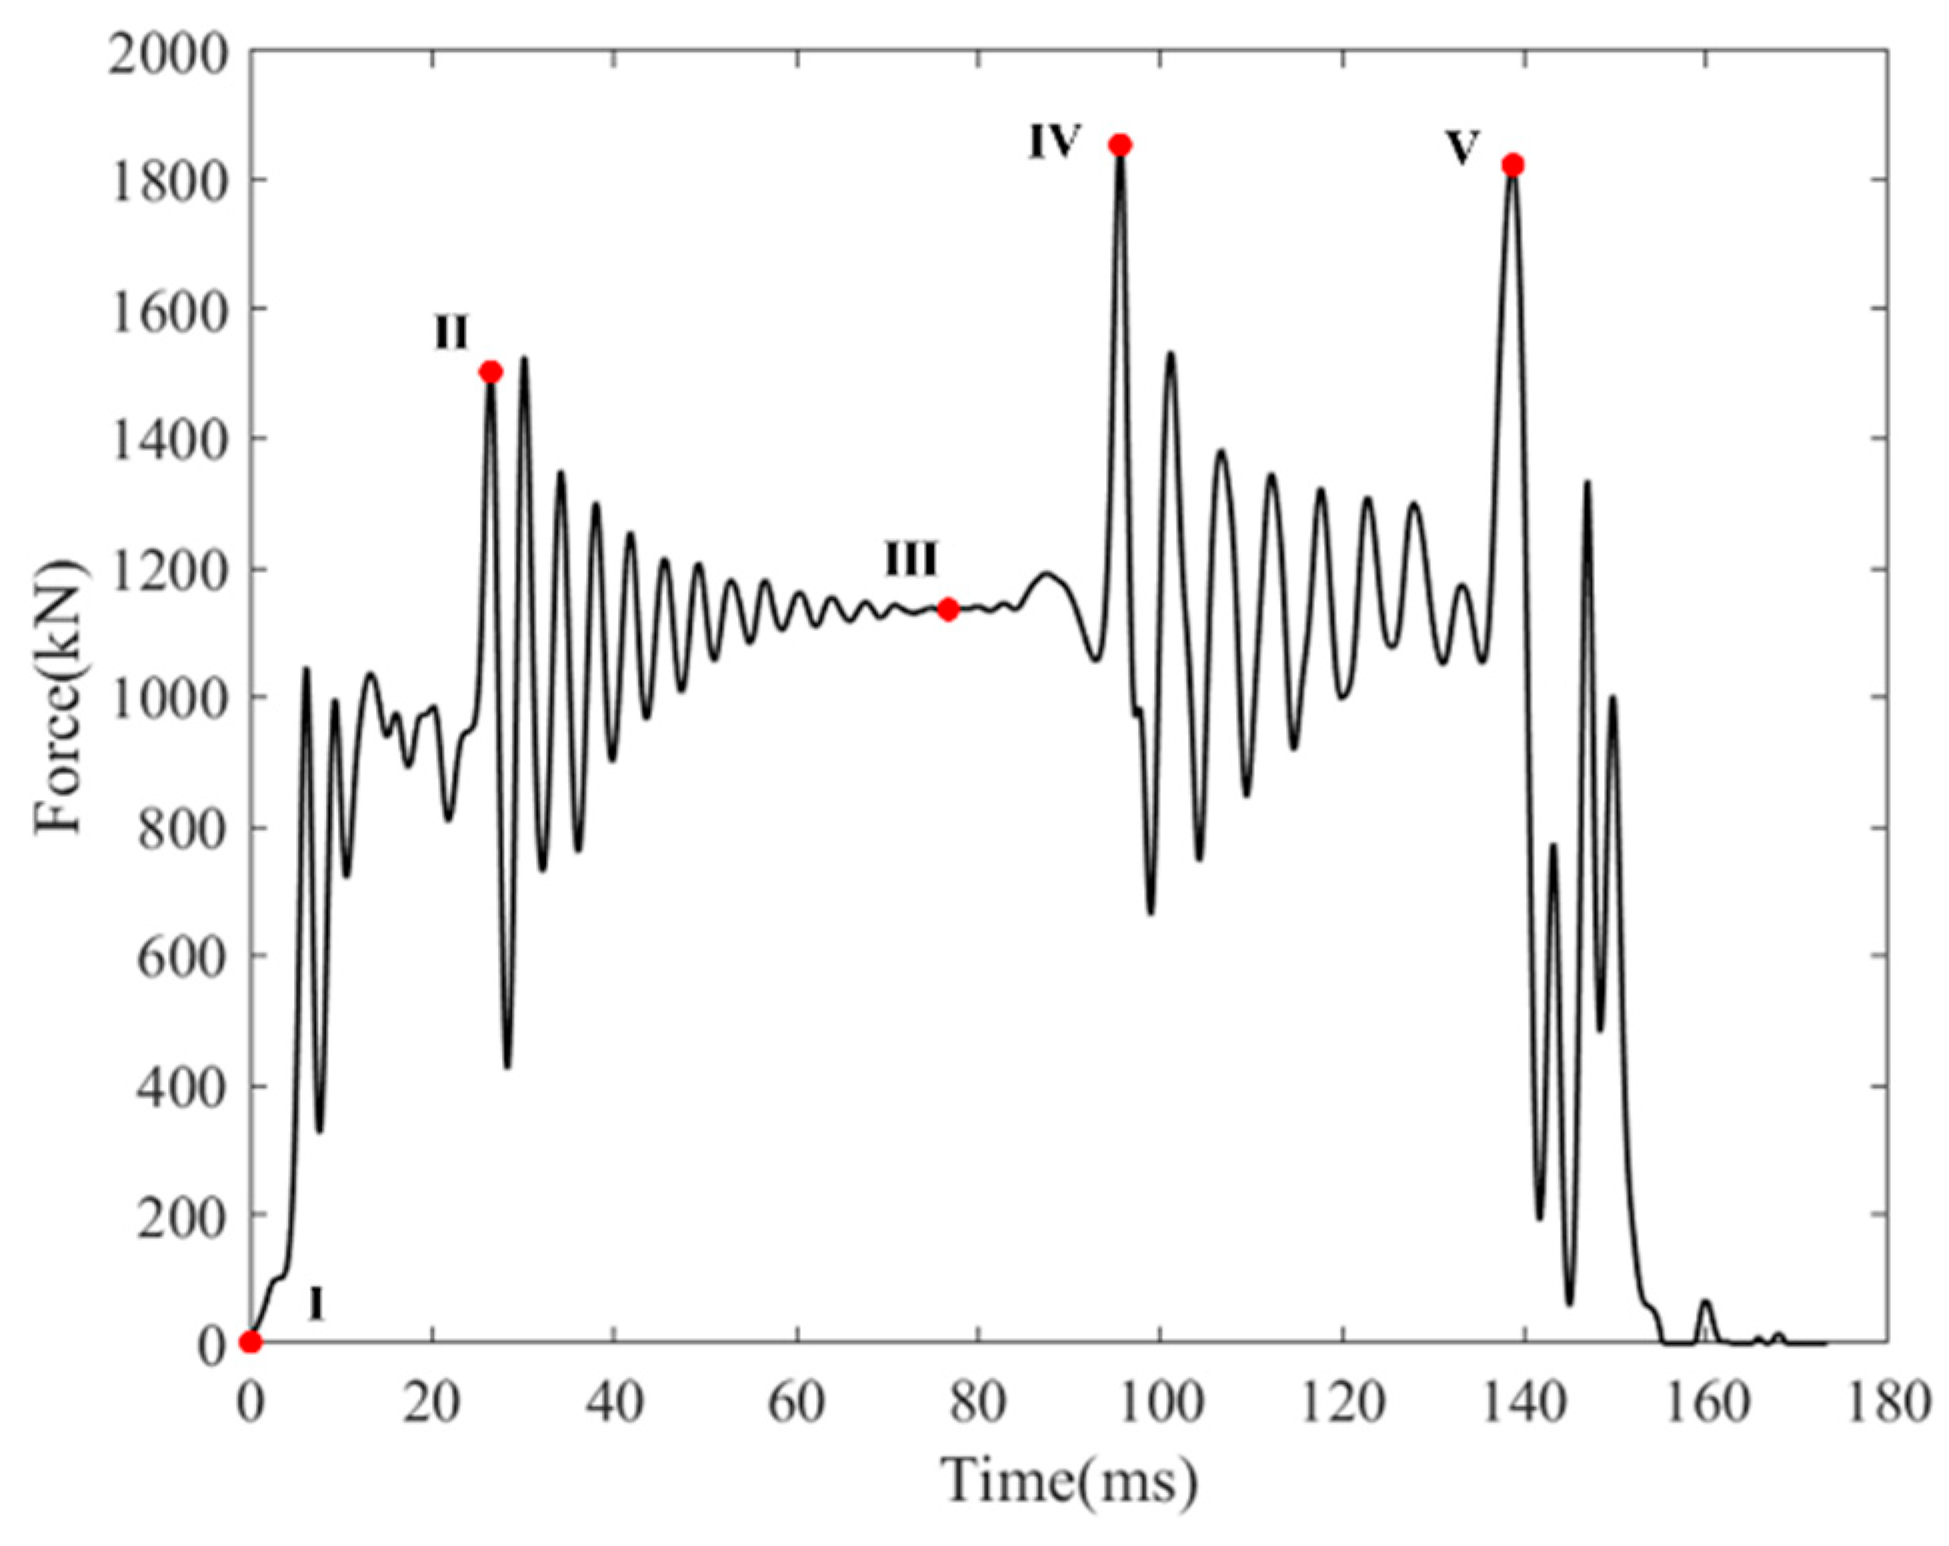
2.1.3. Results Analysis
2.2. Simulation Analysis
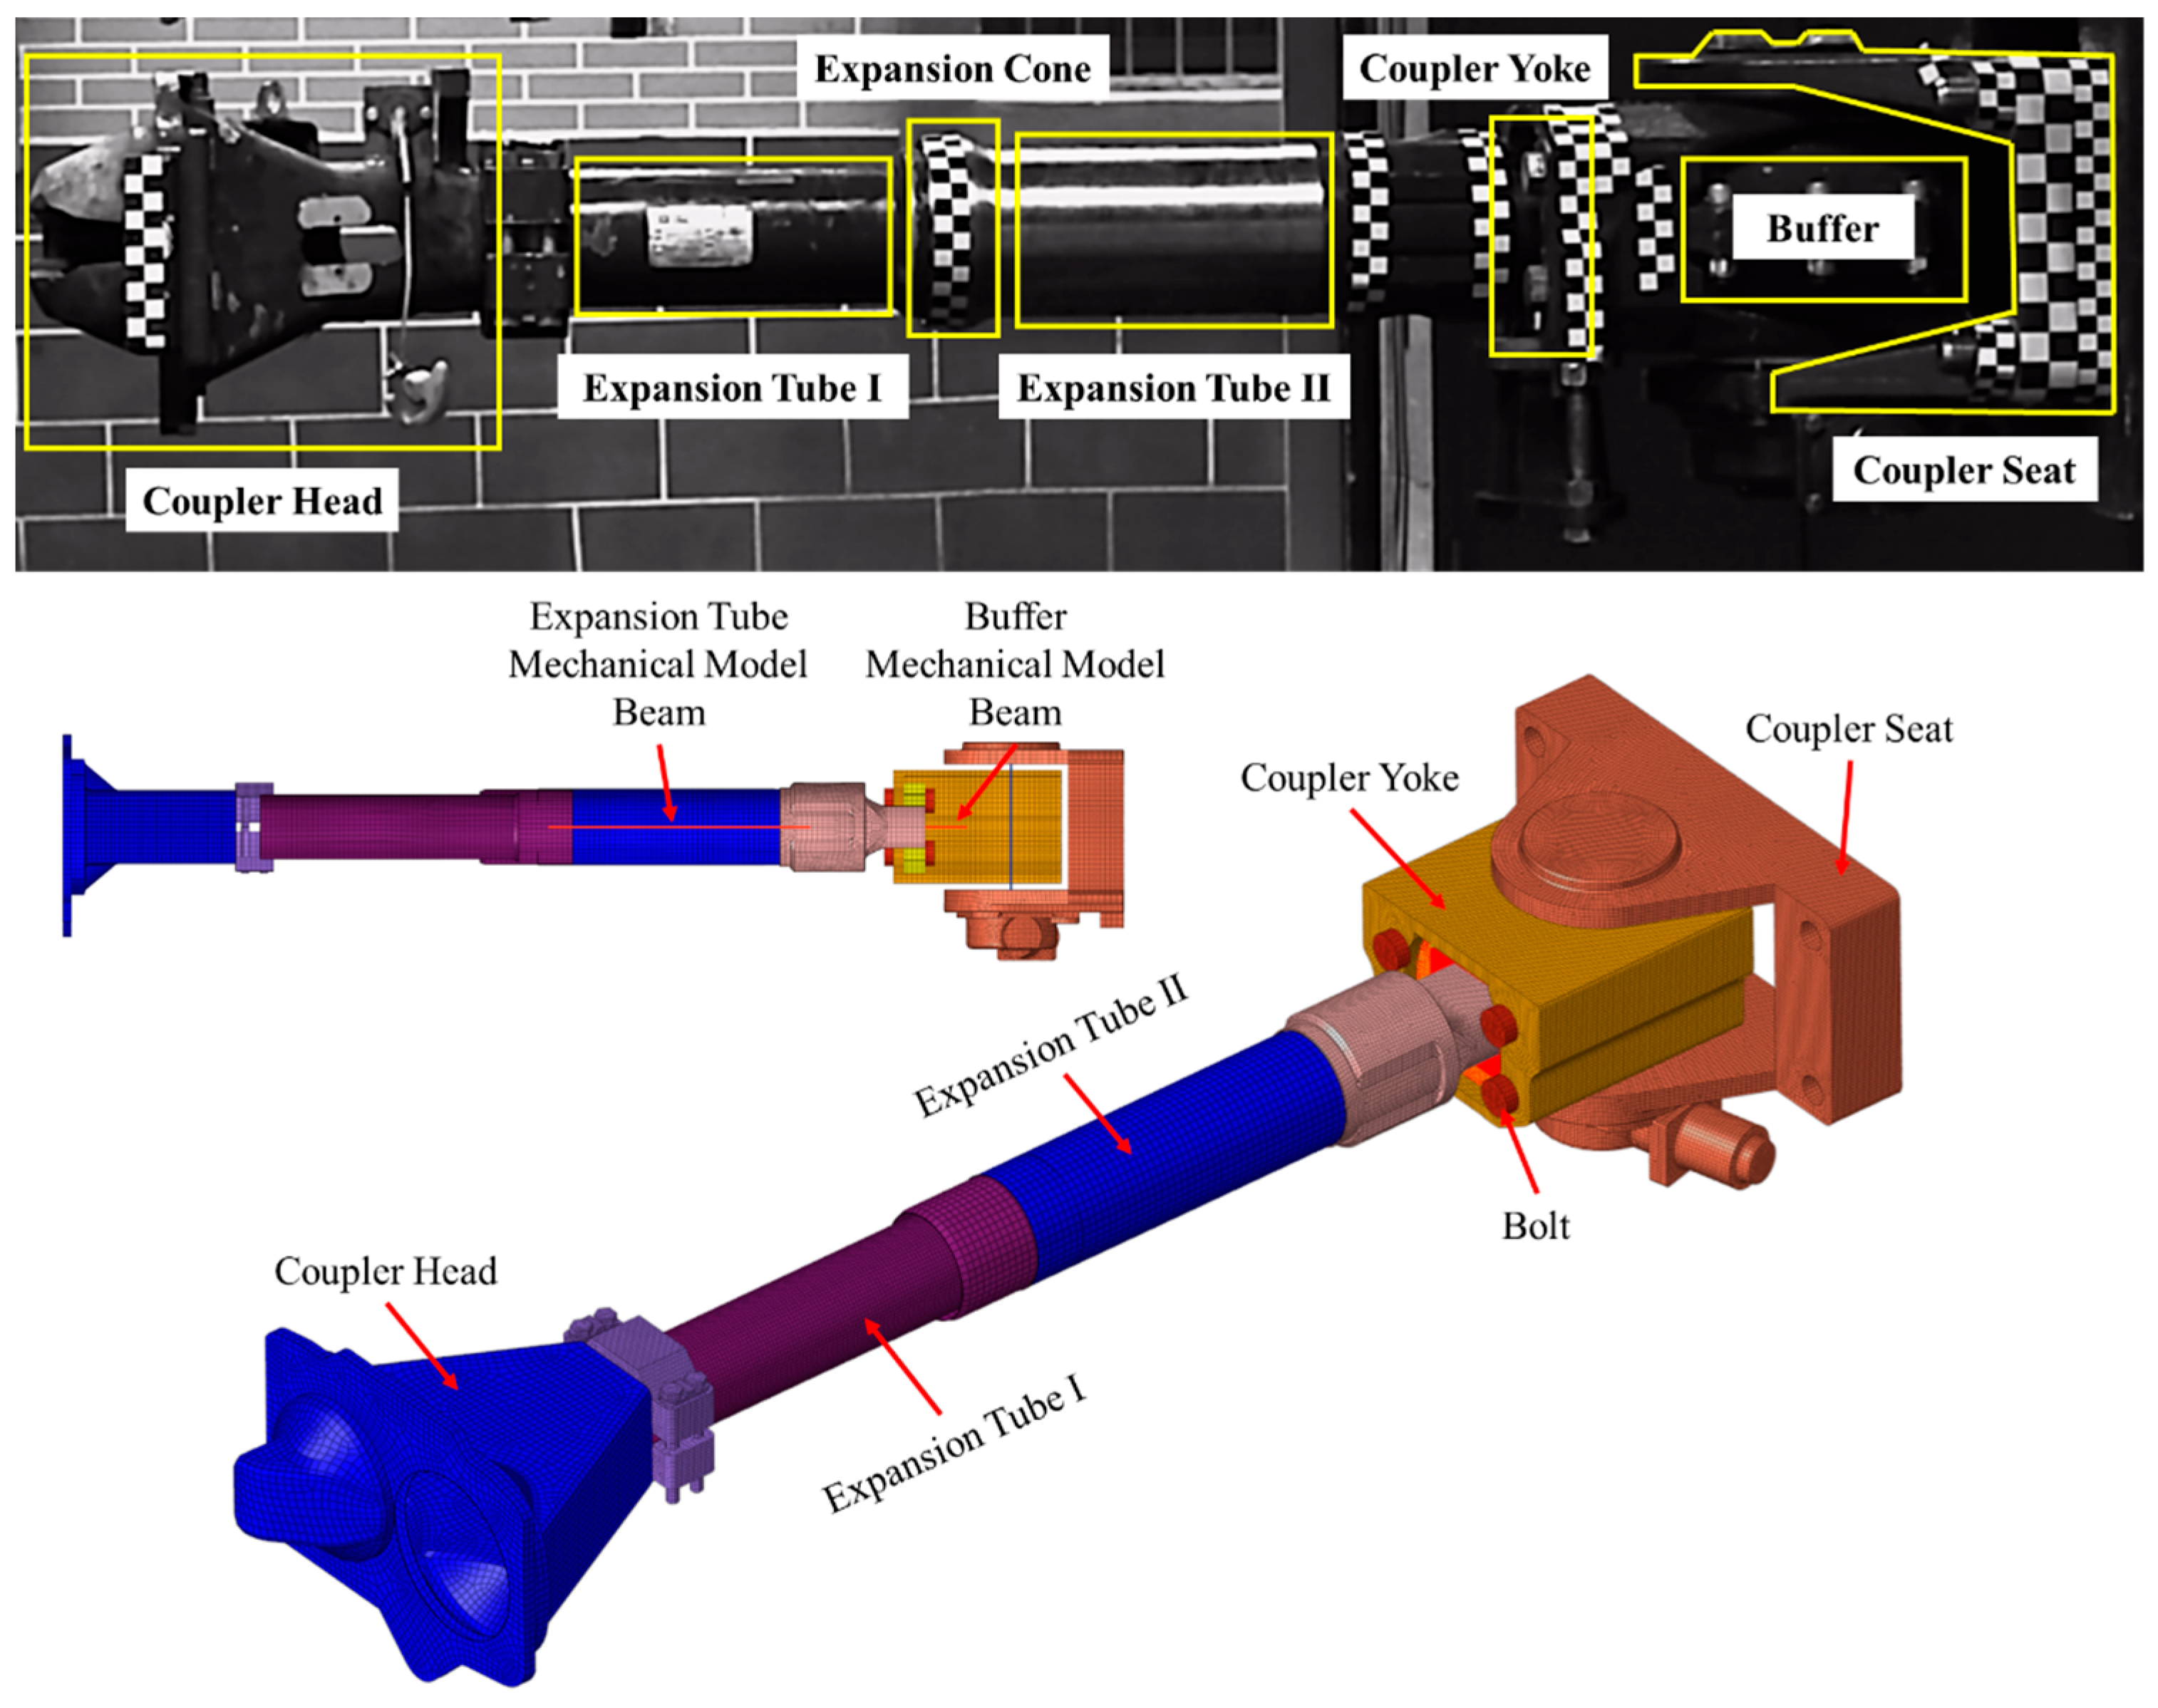
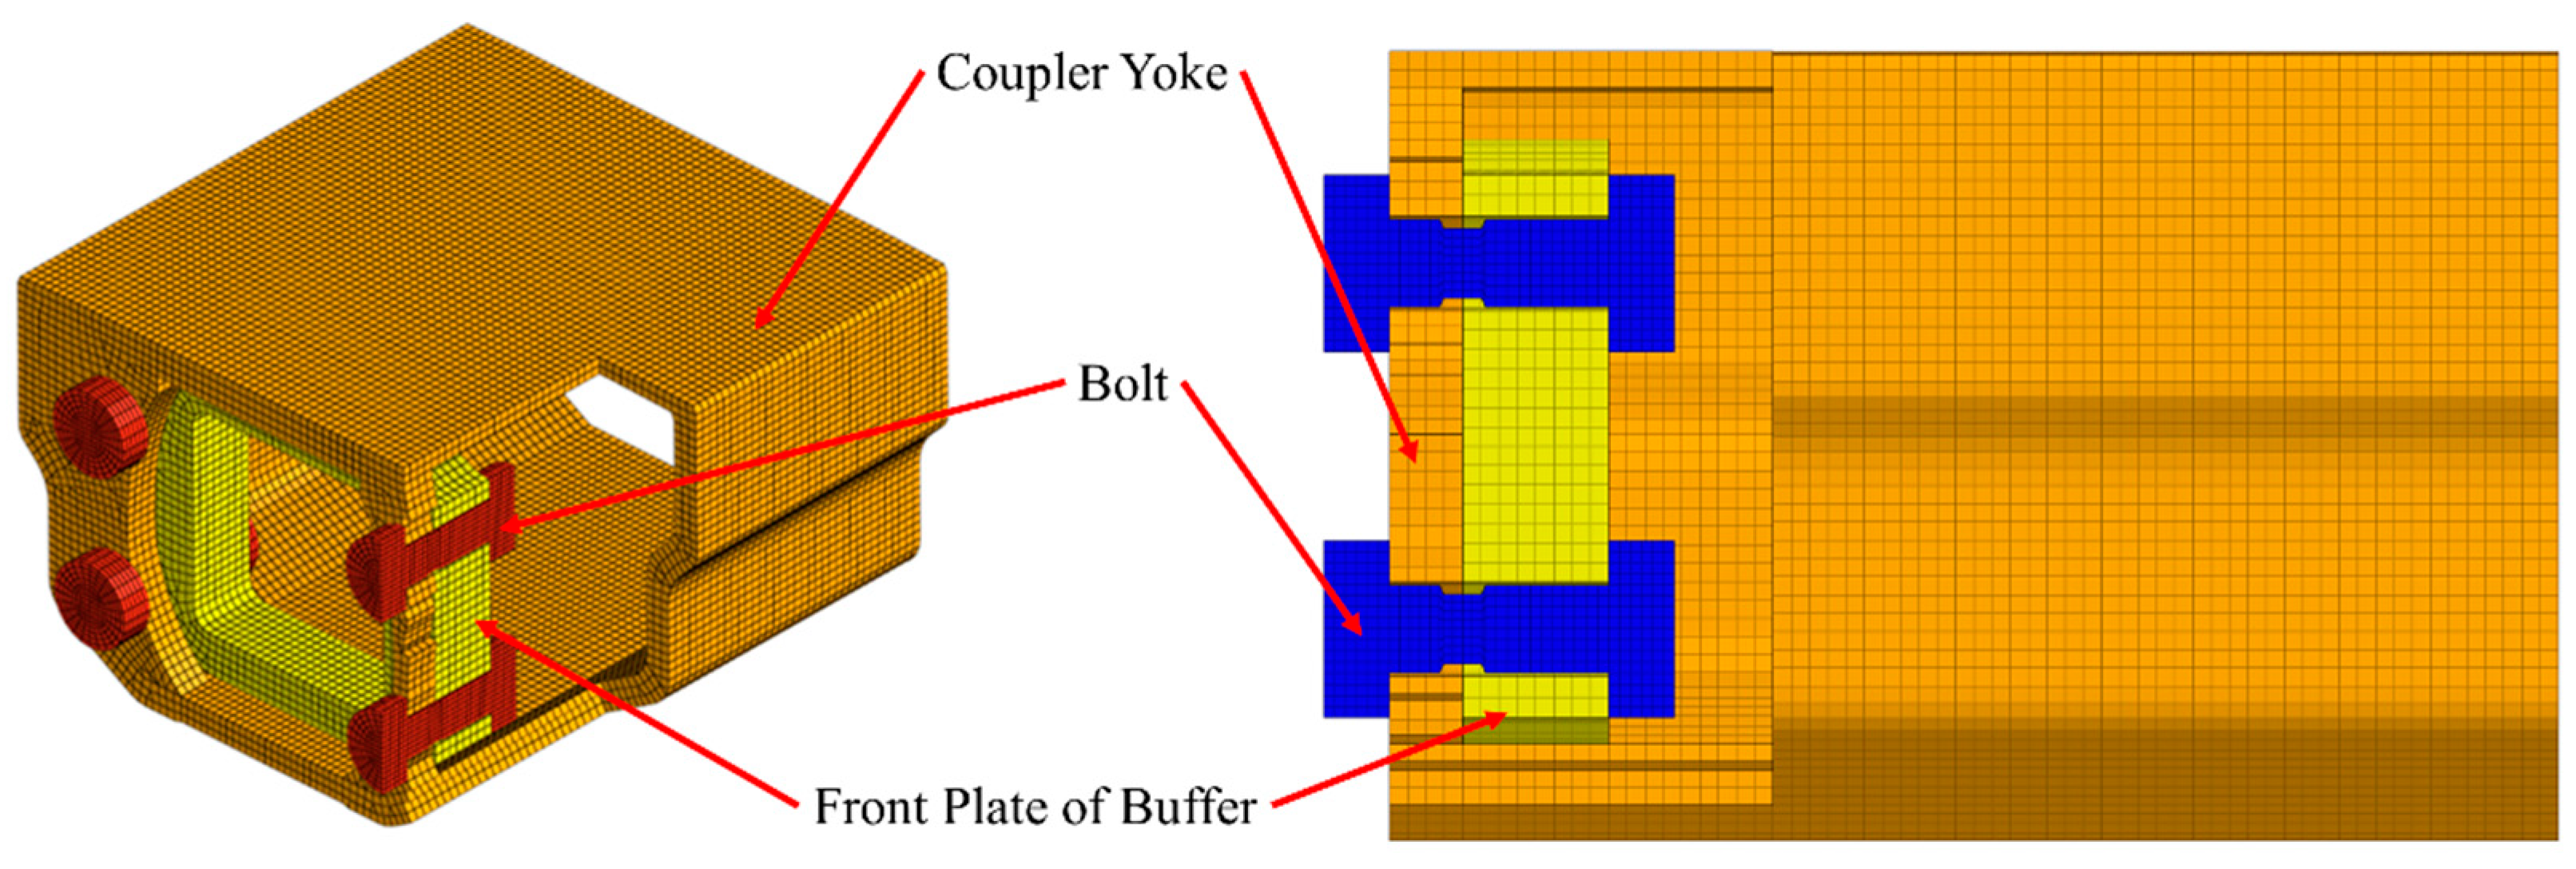
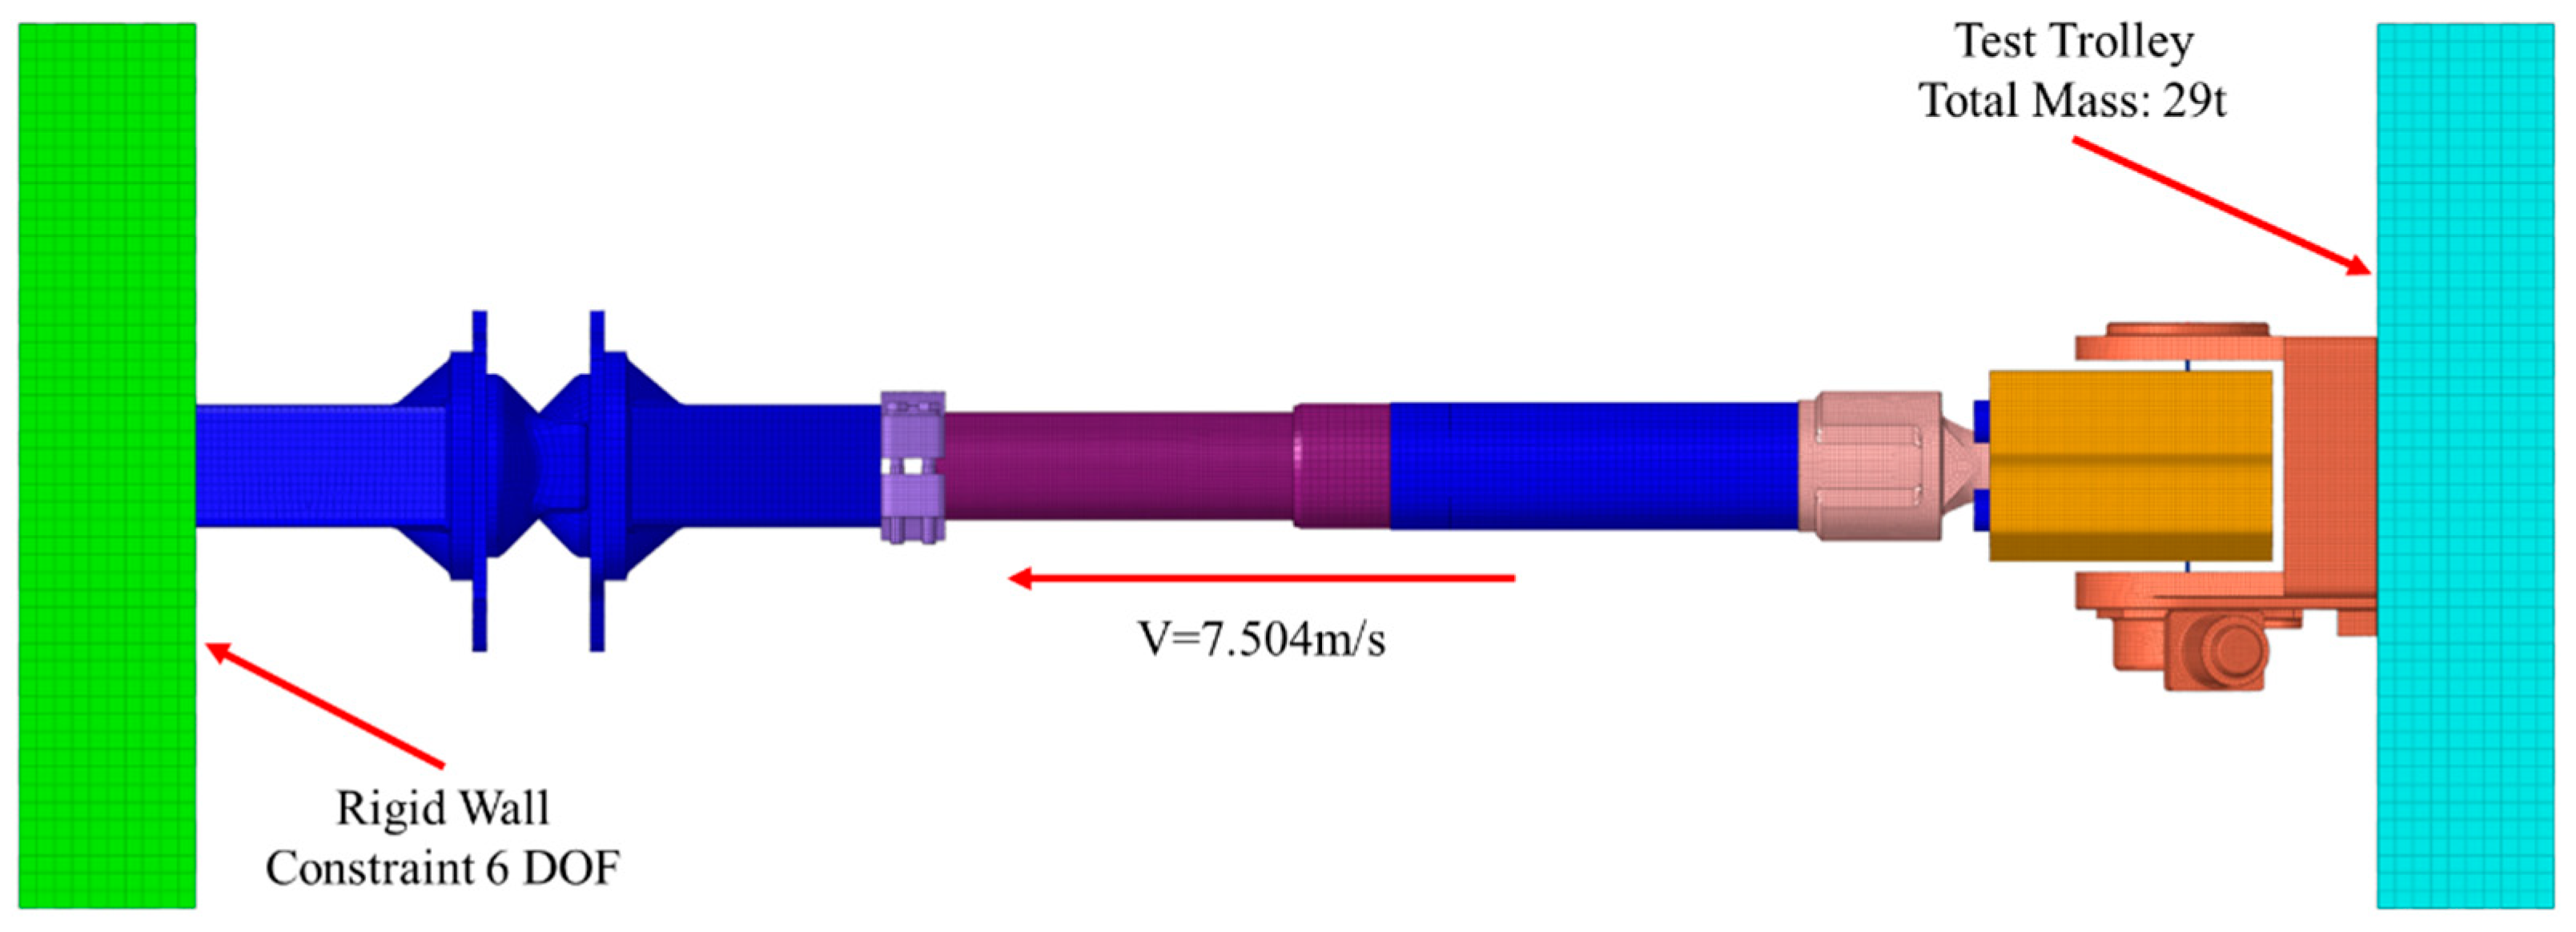
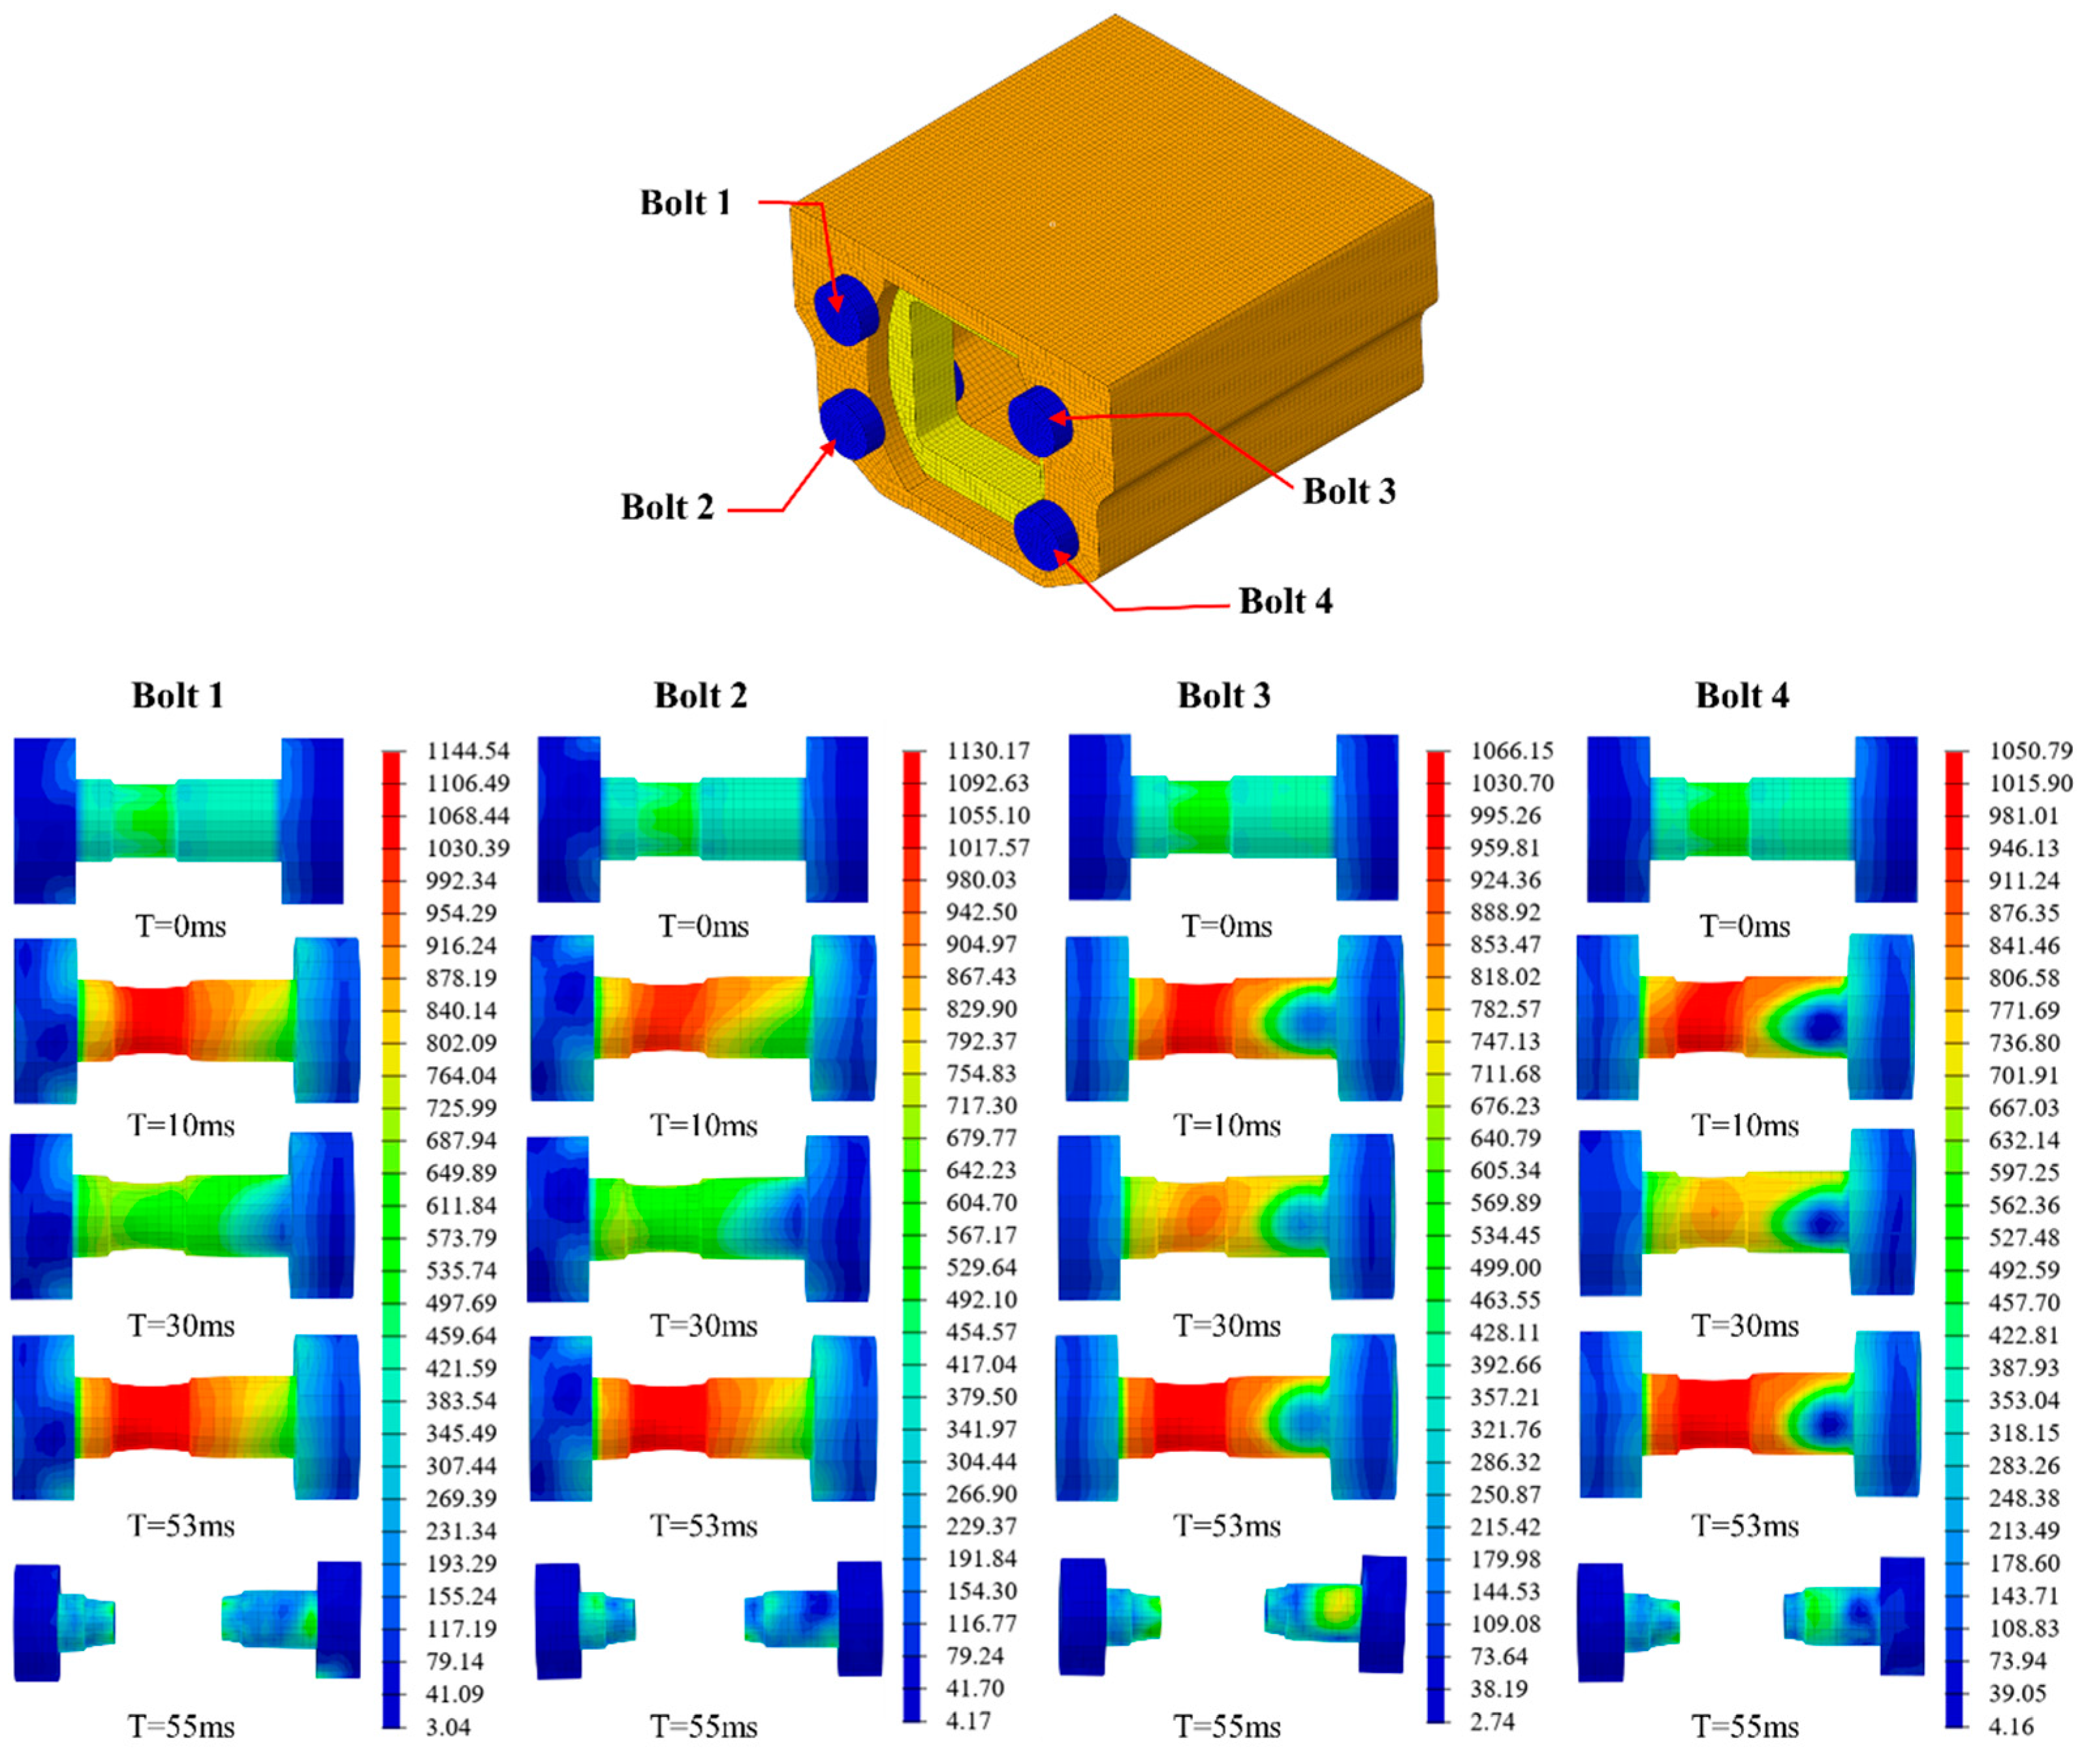
2.2.1. Finite Element Model
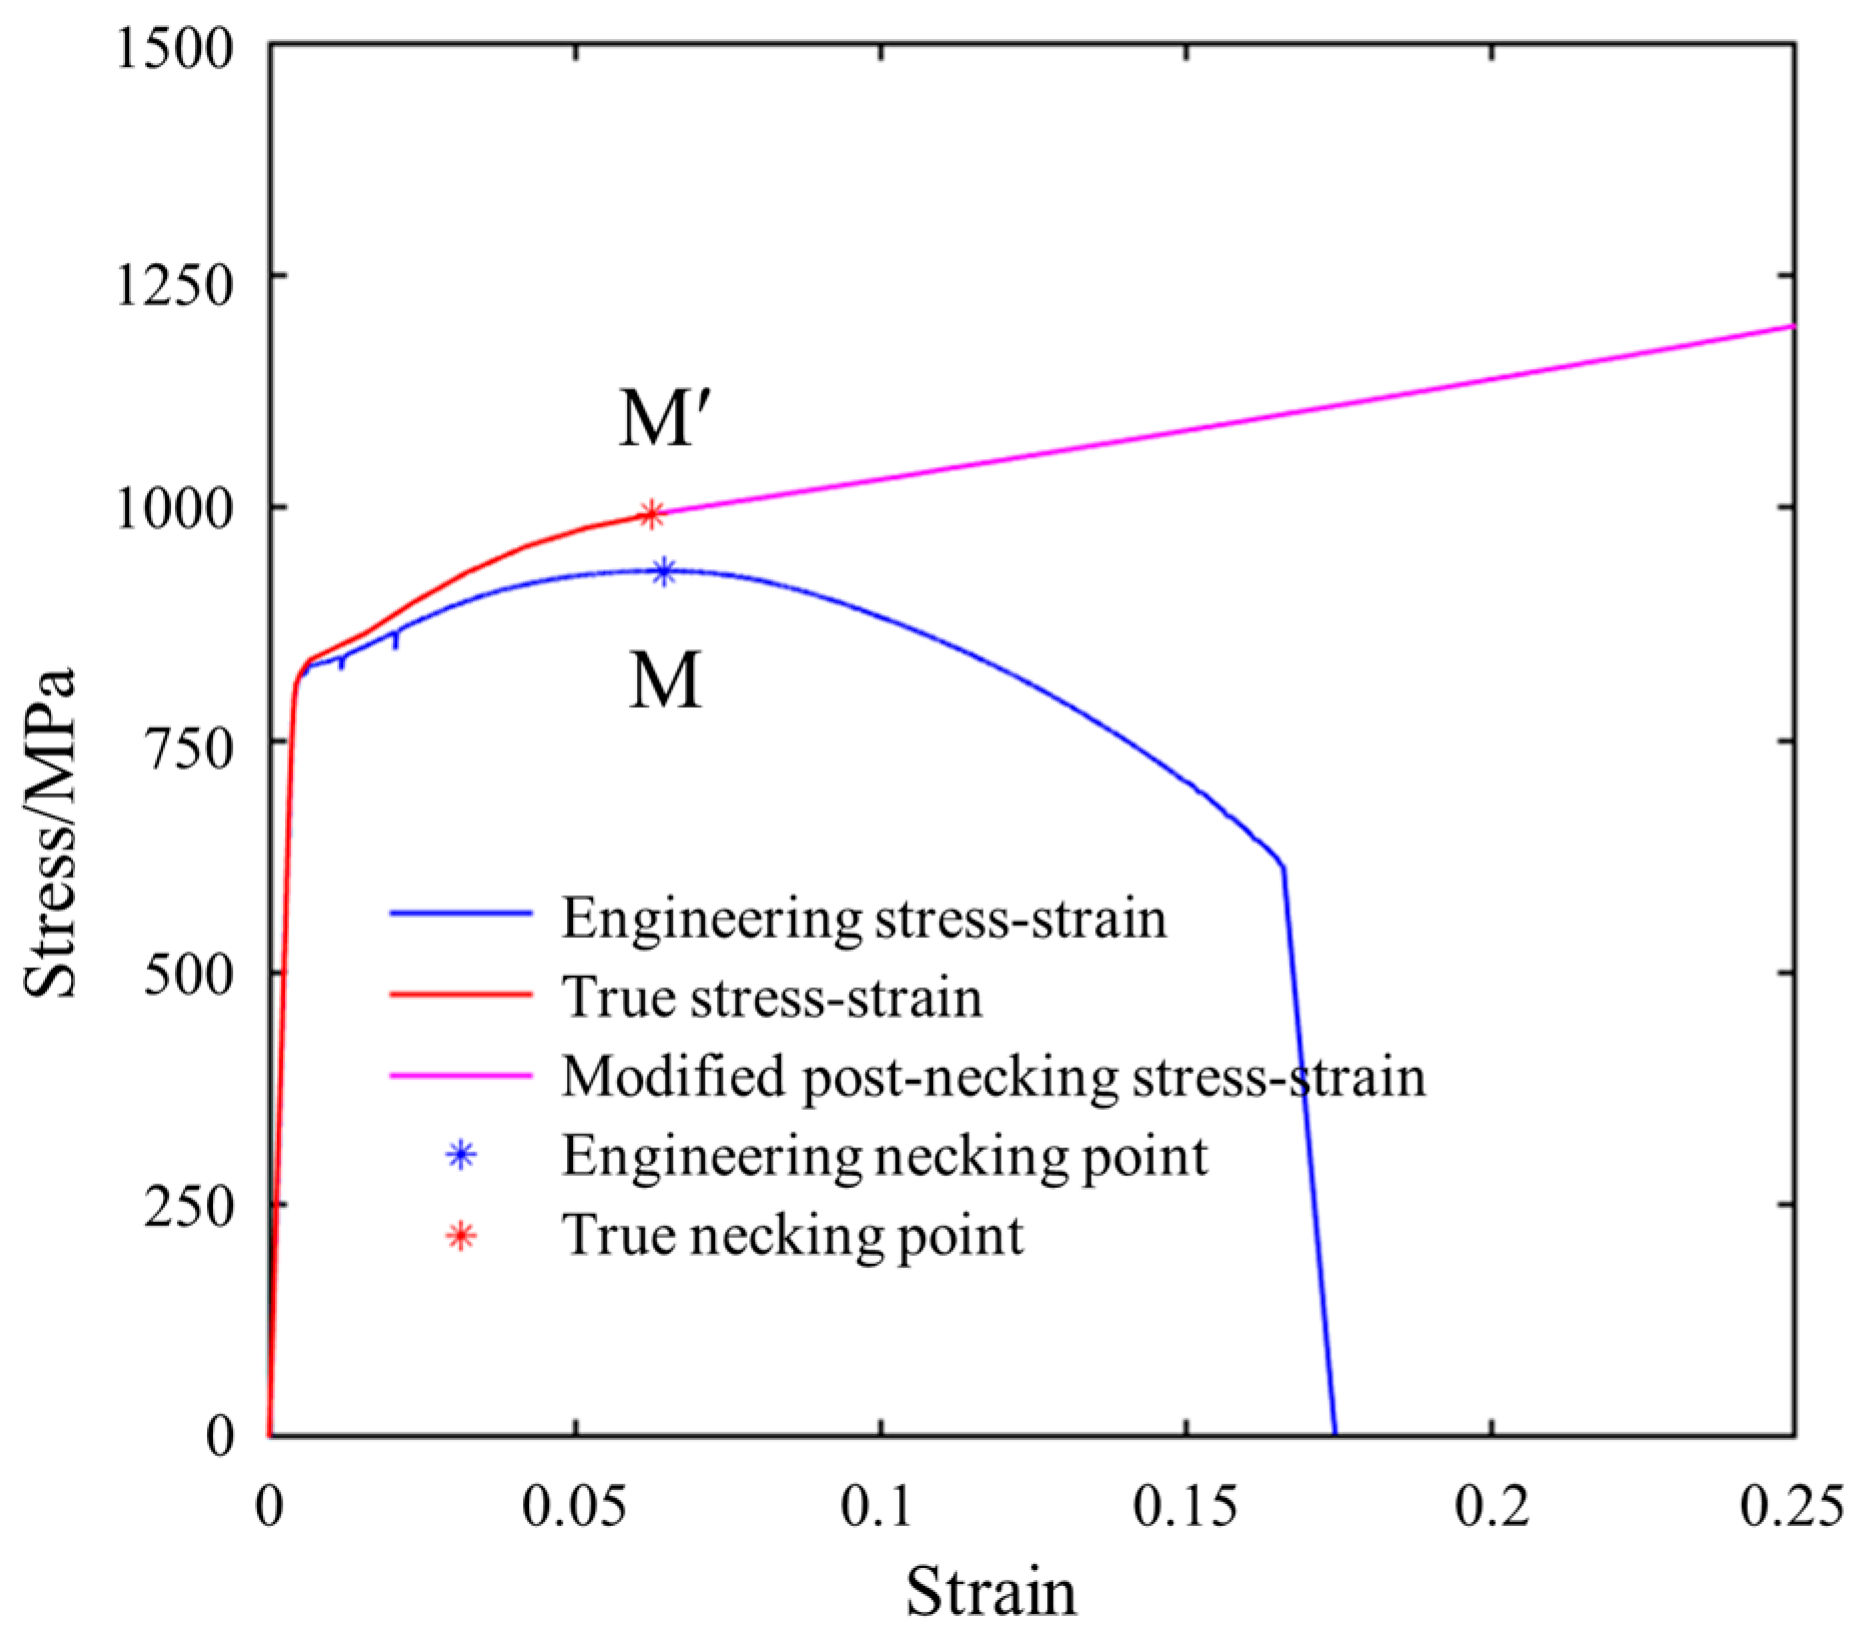
2.2.2. Material Parameter
- Buffer and expansion tube
- 2.
- Bolts and Other Components of Coupler
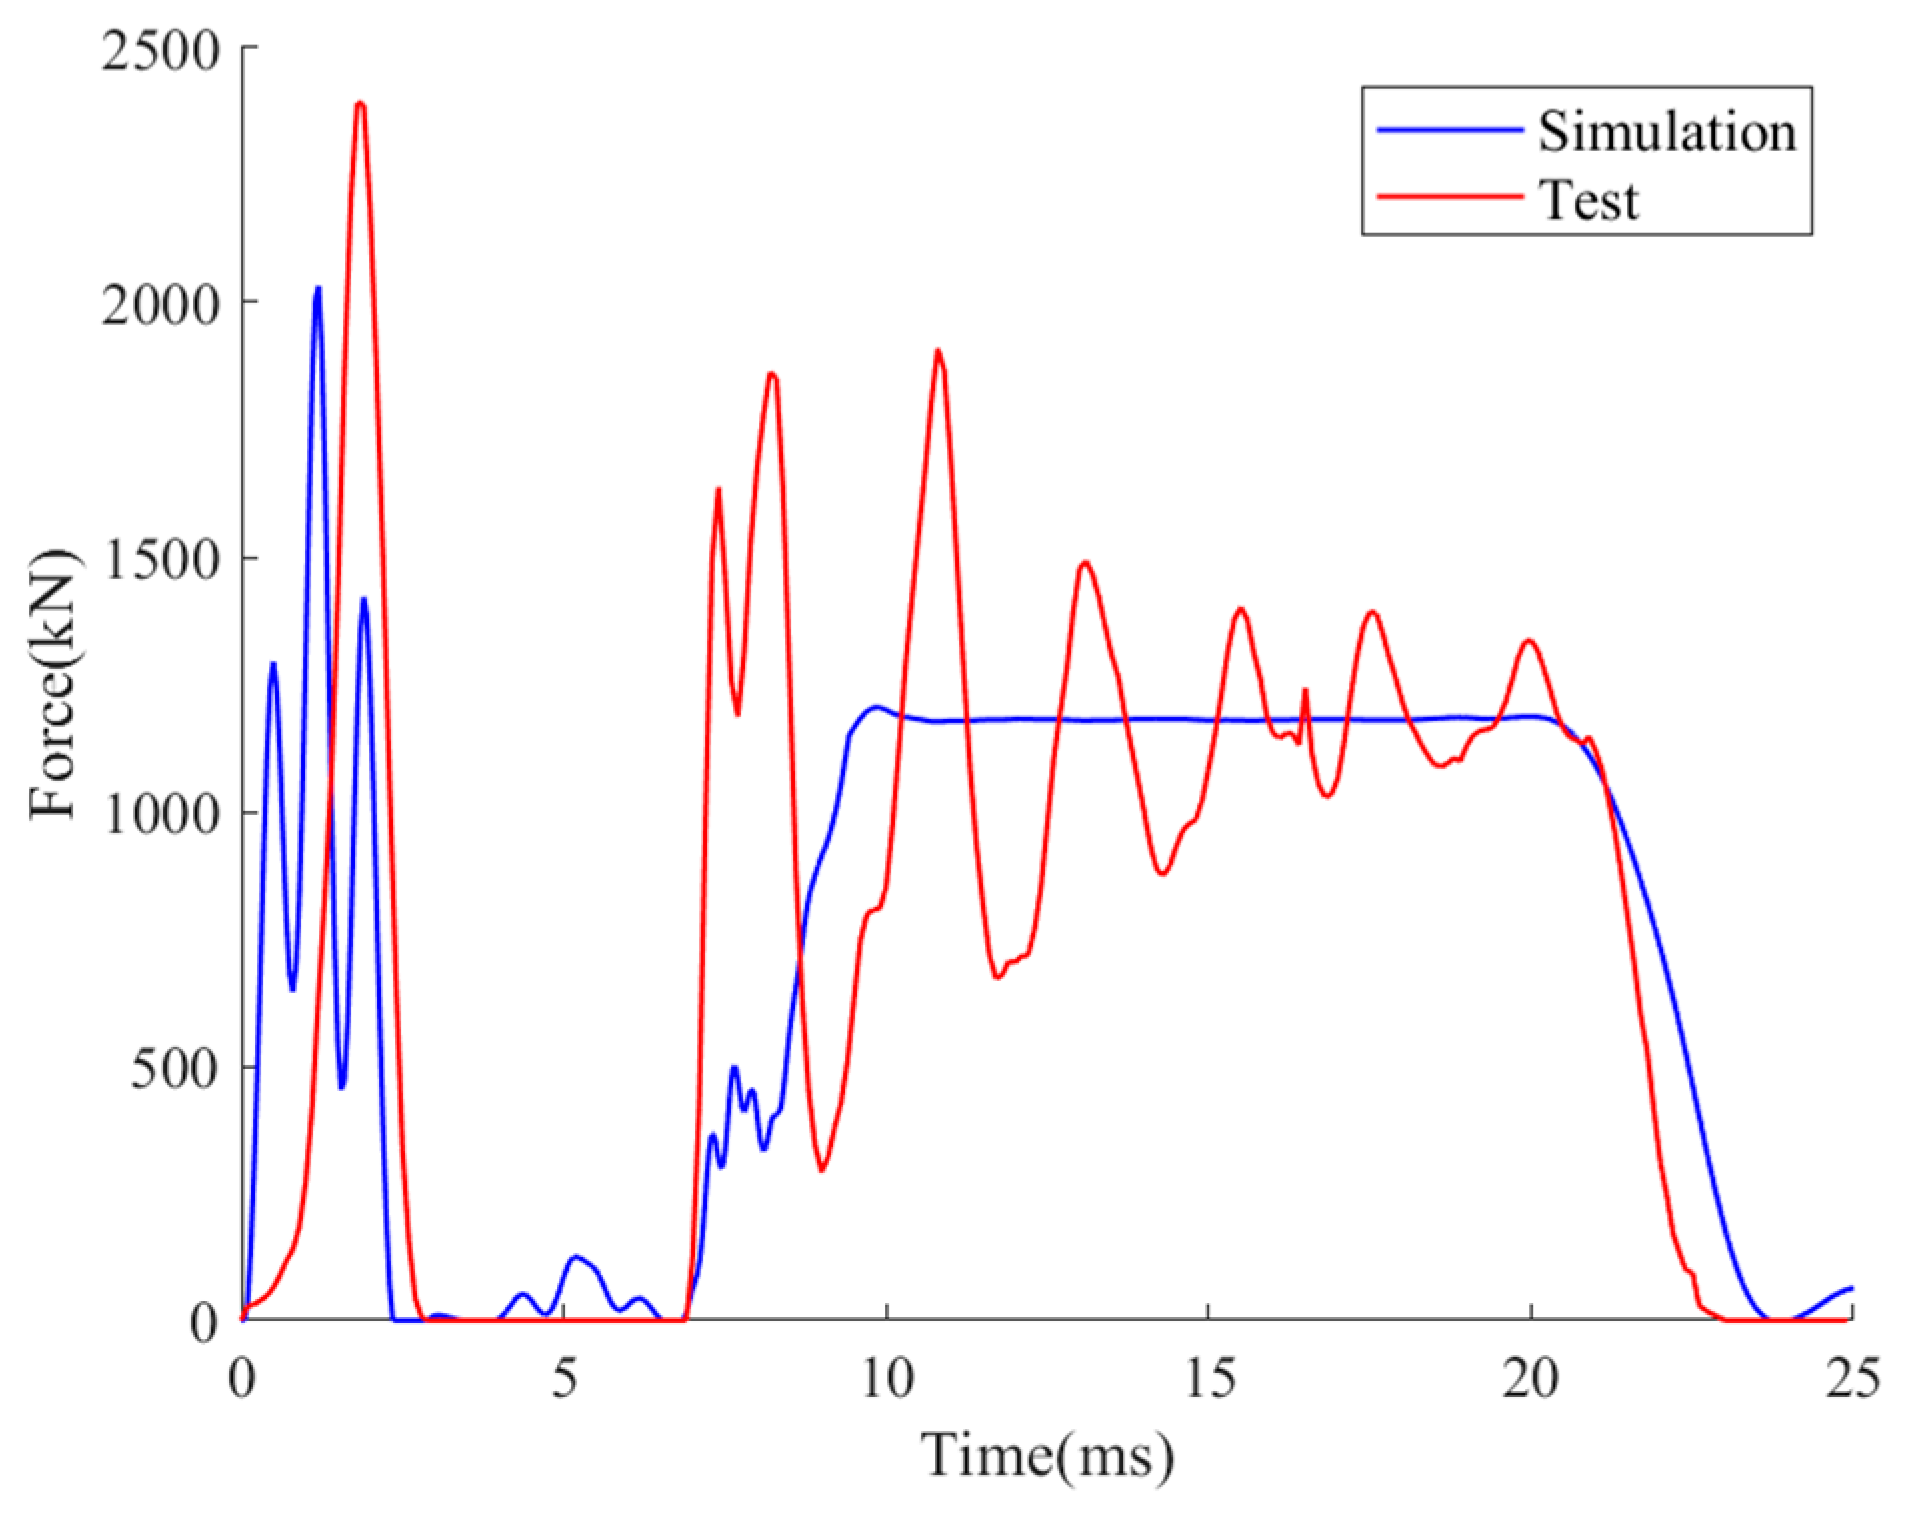
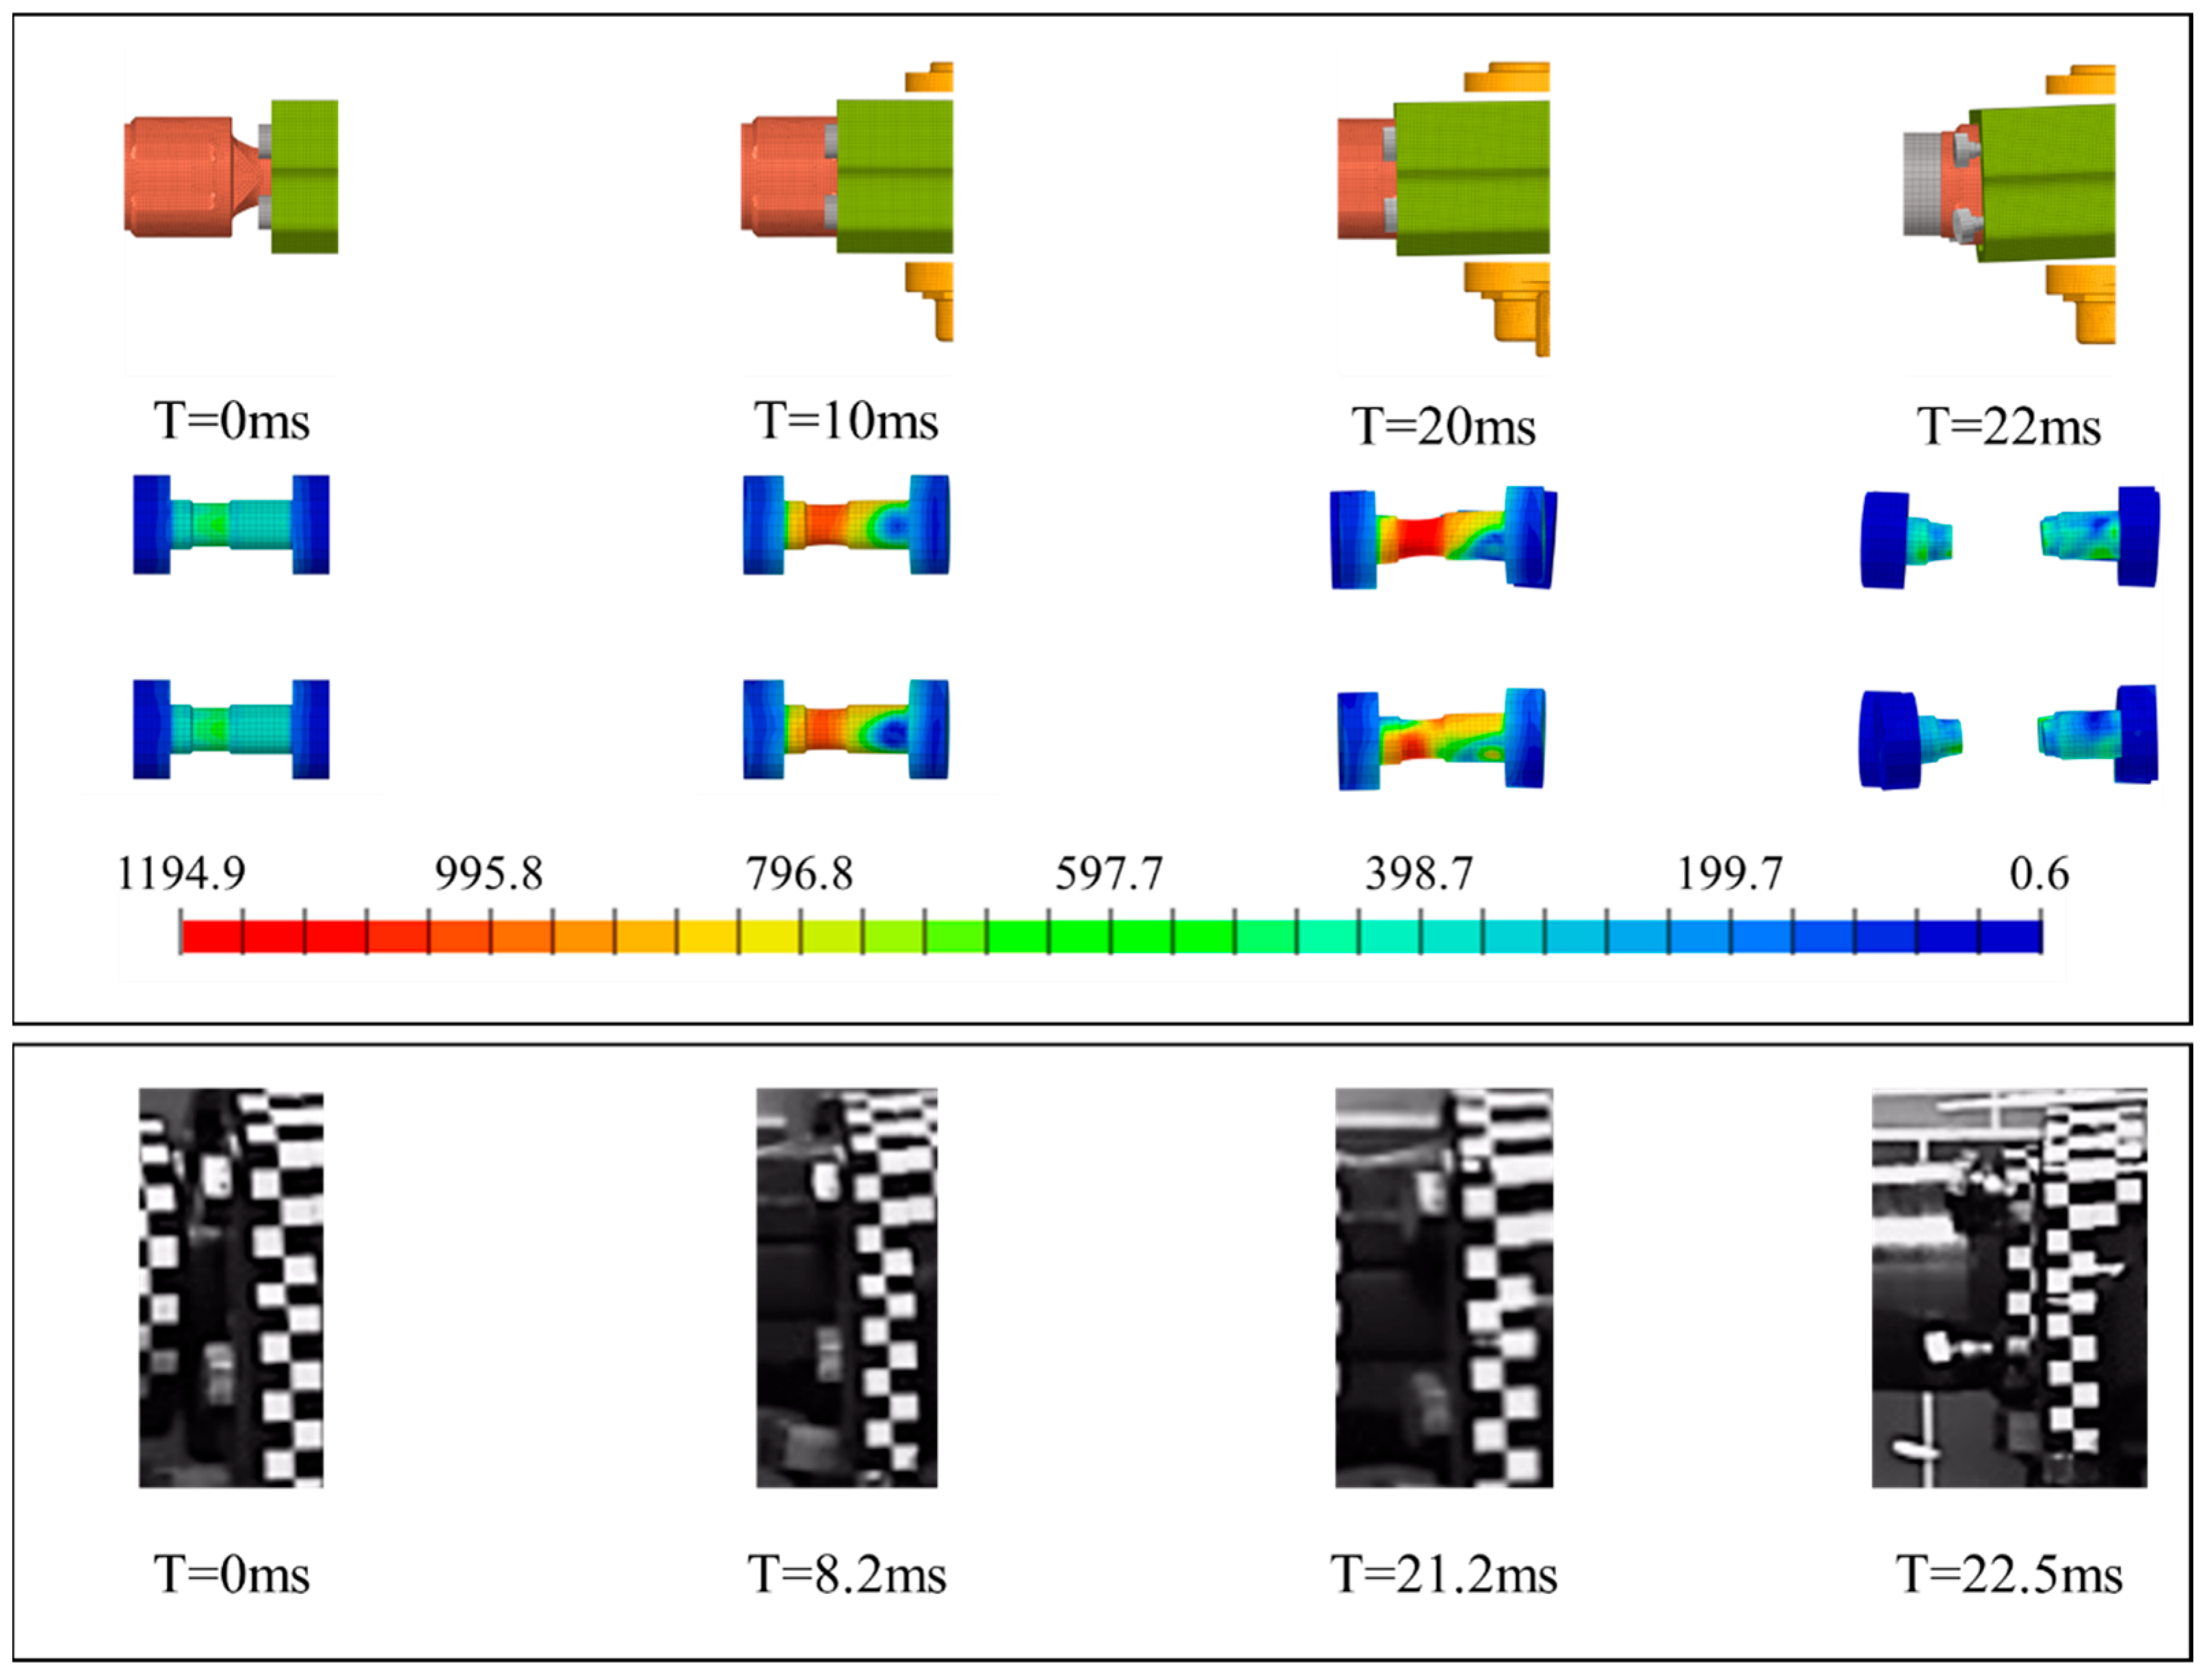
2.2.3. Validation
3. Effect of Cut-Out Zone Structural Parameters
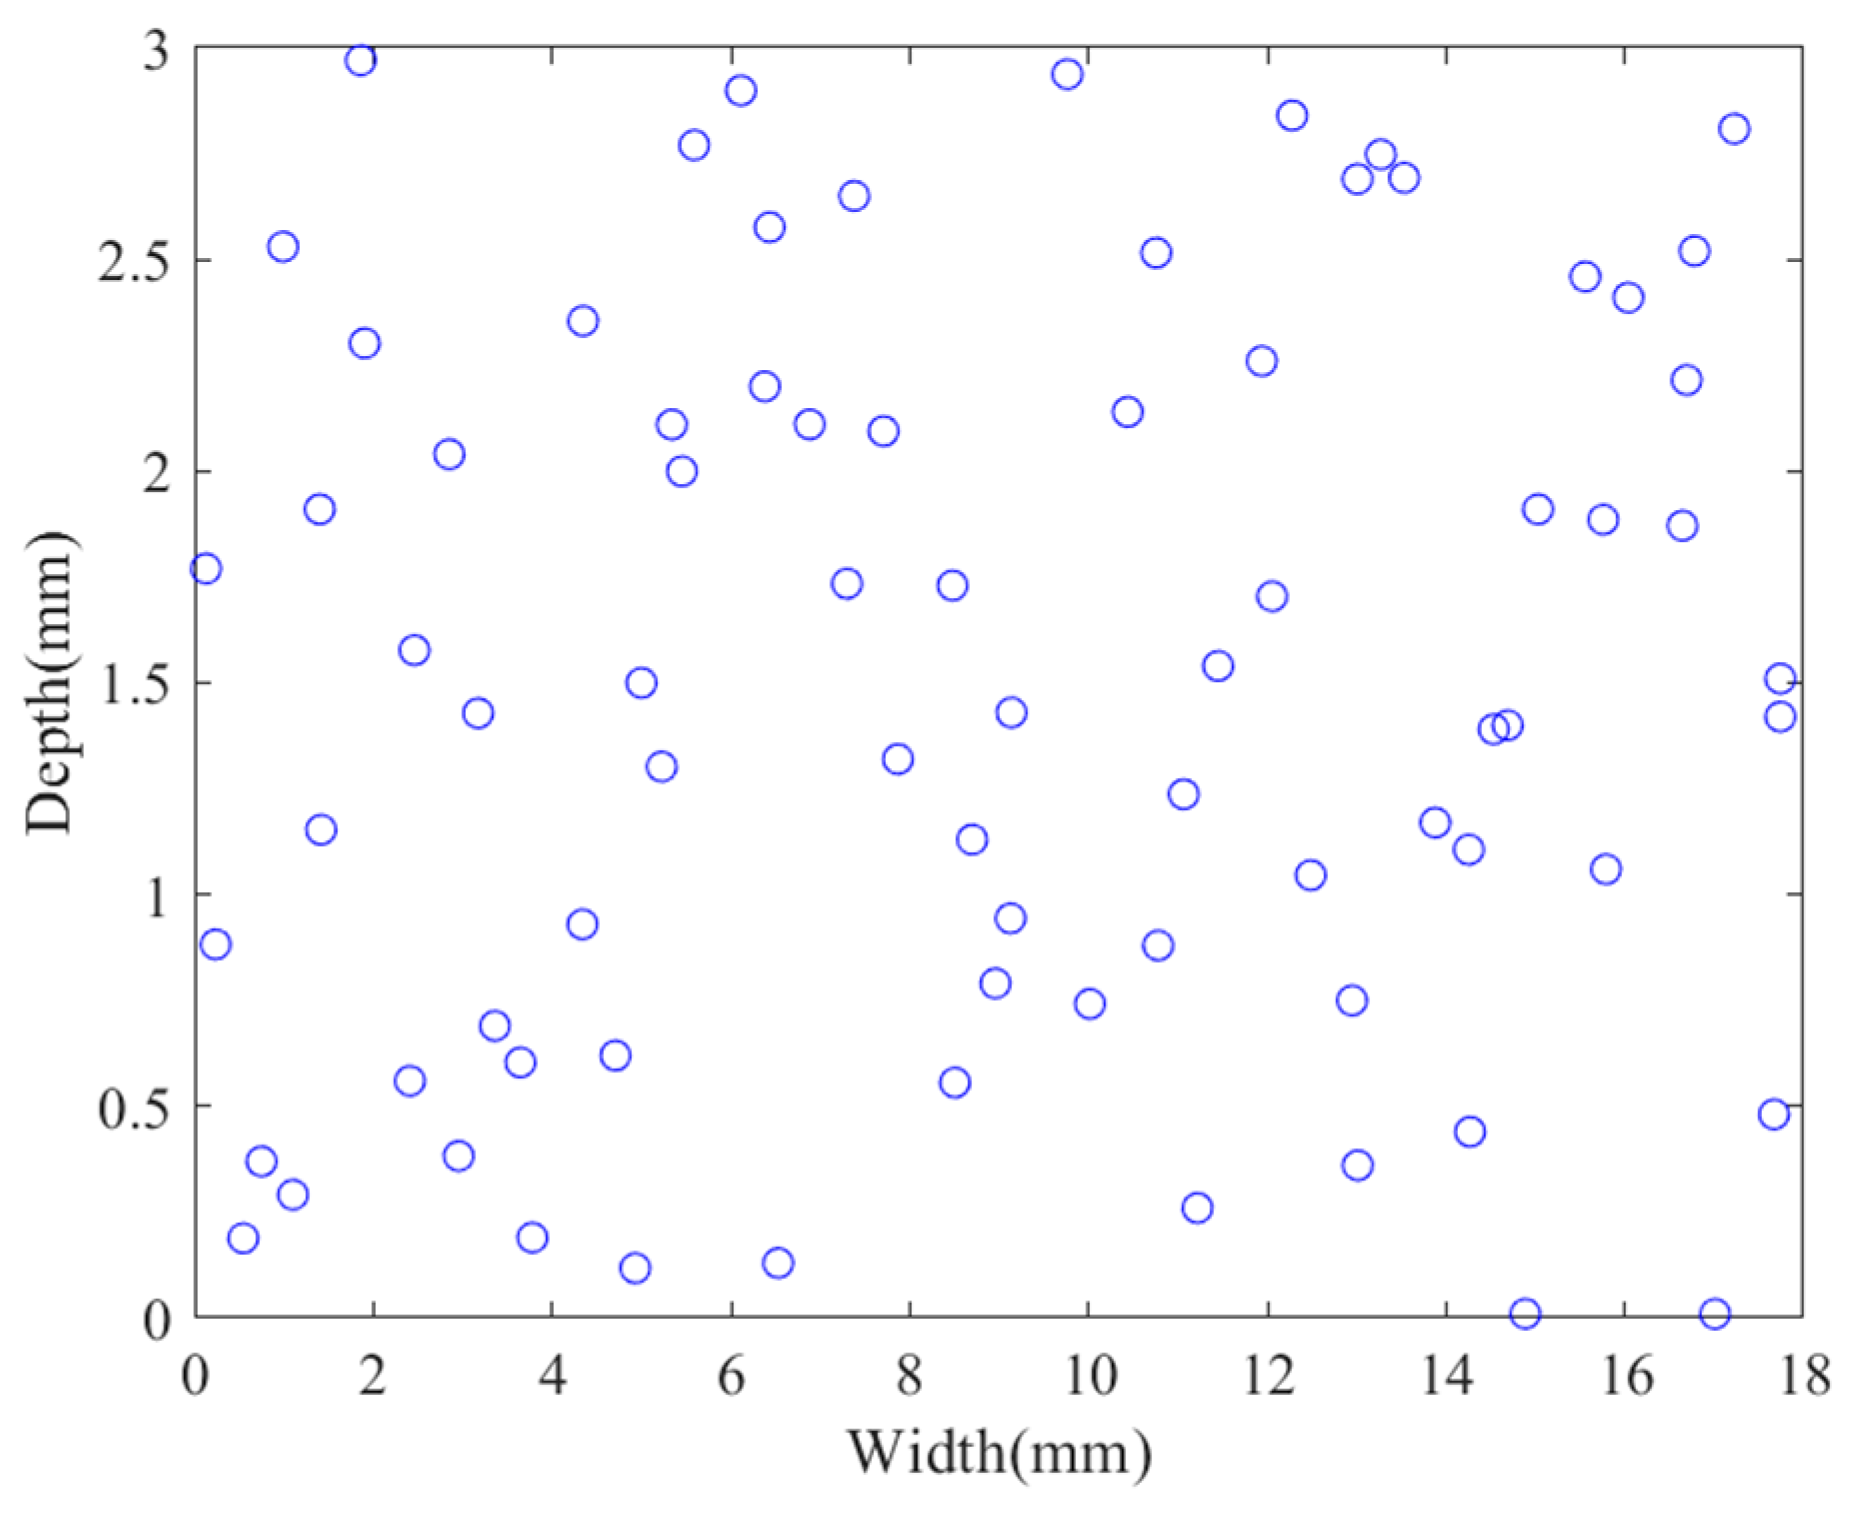
3.1. Design of Experiments (DOE)
3.2. Analysis of Bolt Failure Modes
3.3. The Establishment of the Surrogate Model
4. Fracture Threshold Optimization
4.1. Problem Definition
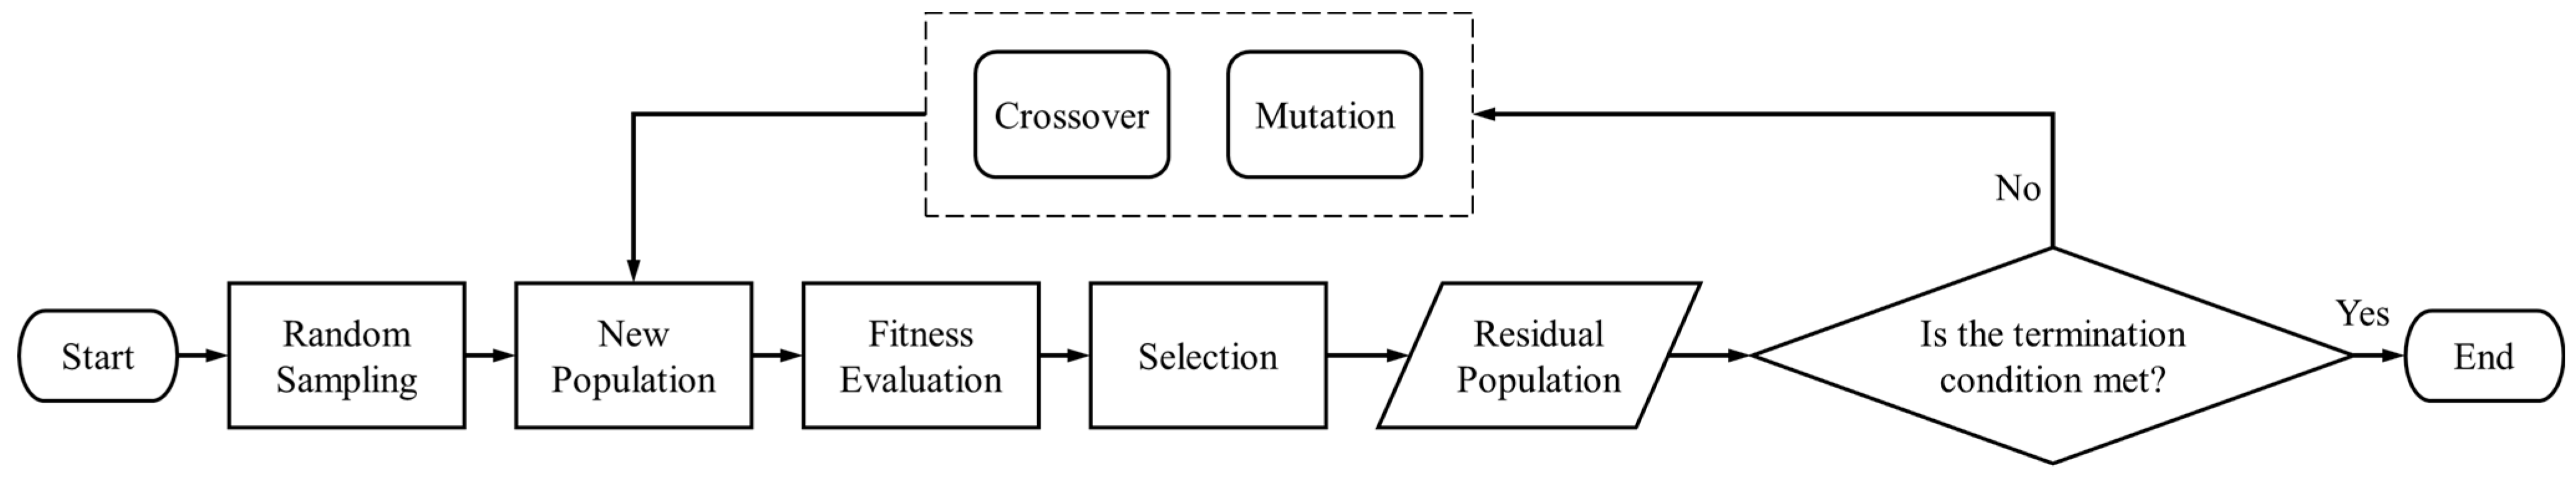
4.2. Algorithm and Process
4.3. Result Validation
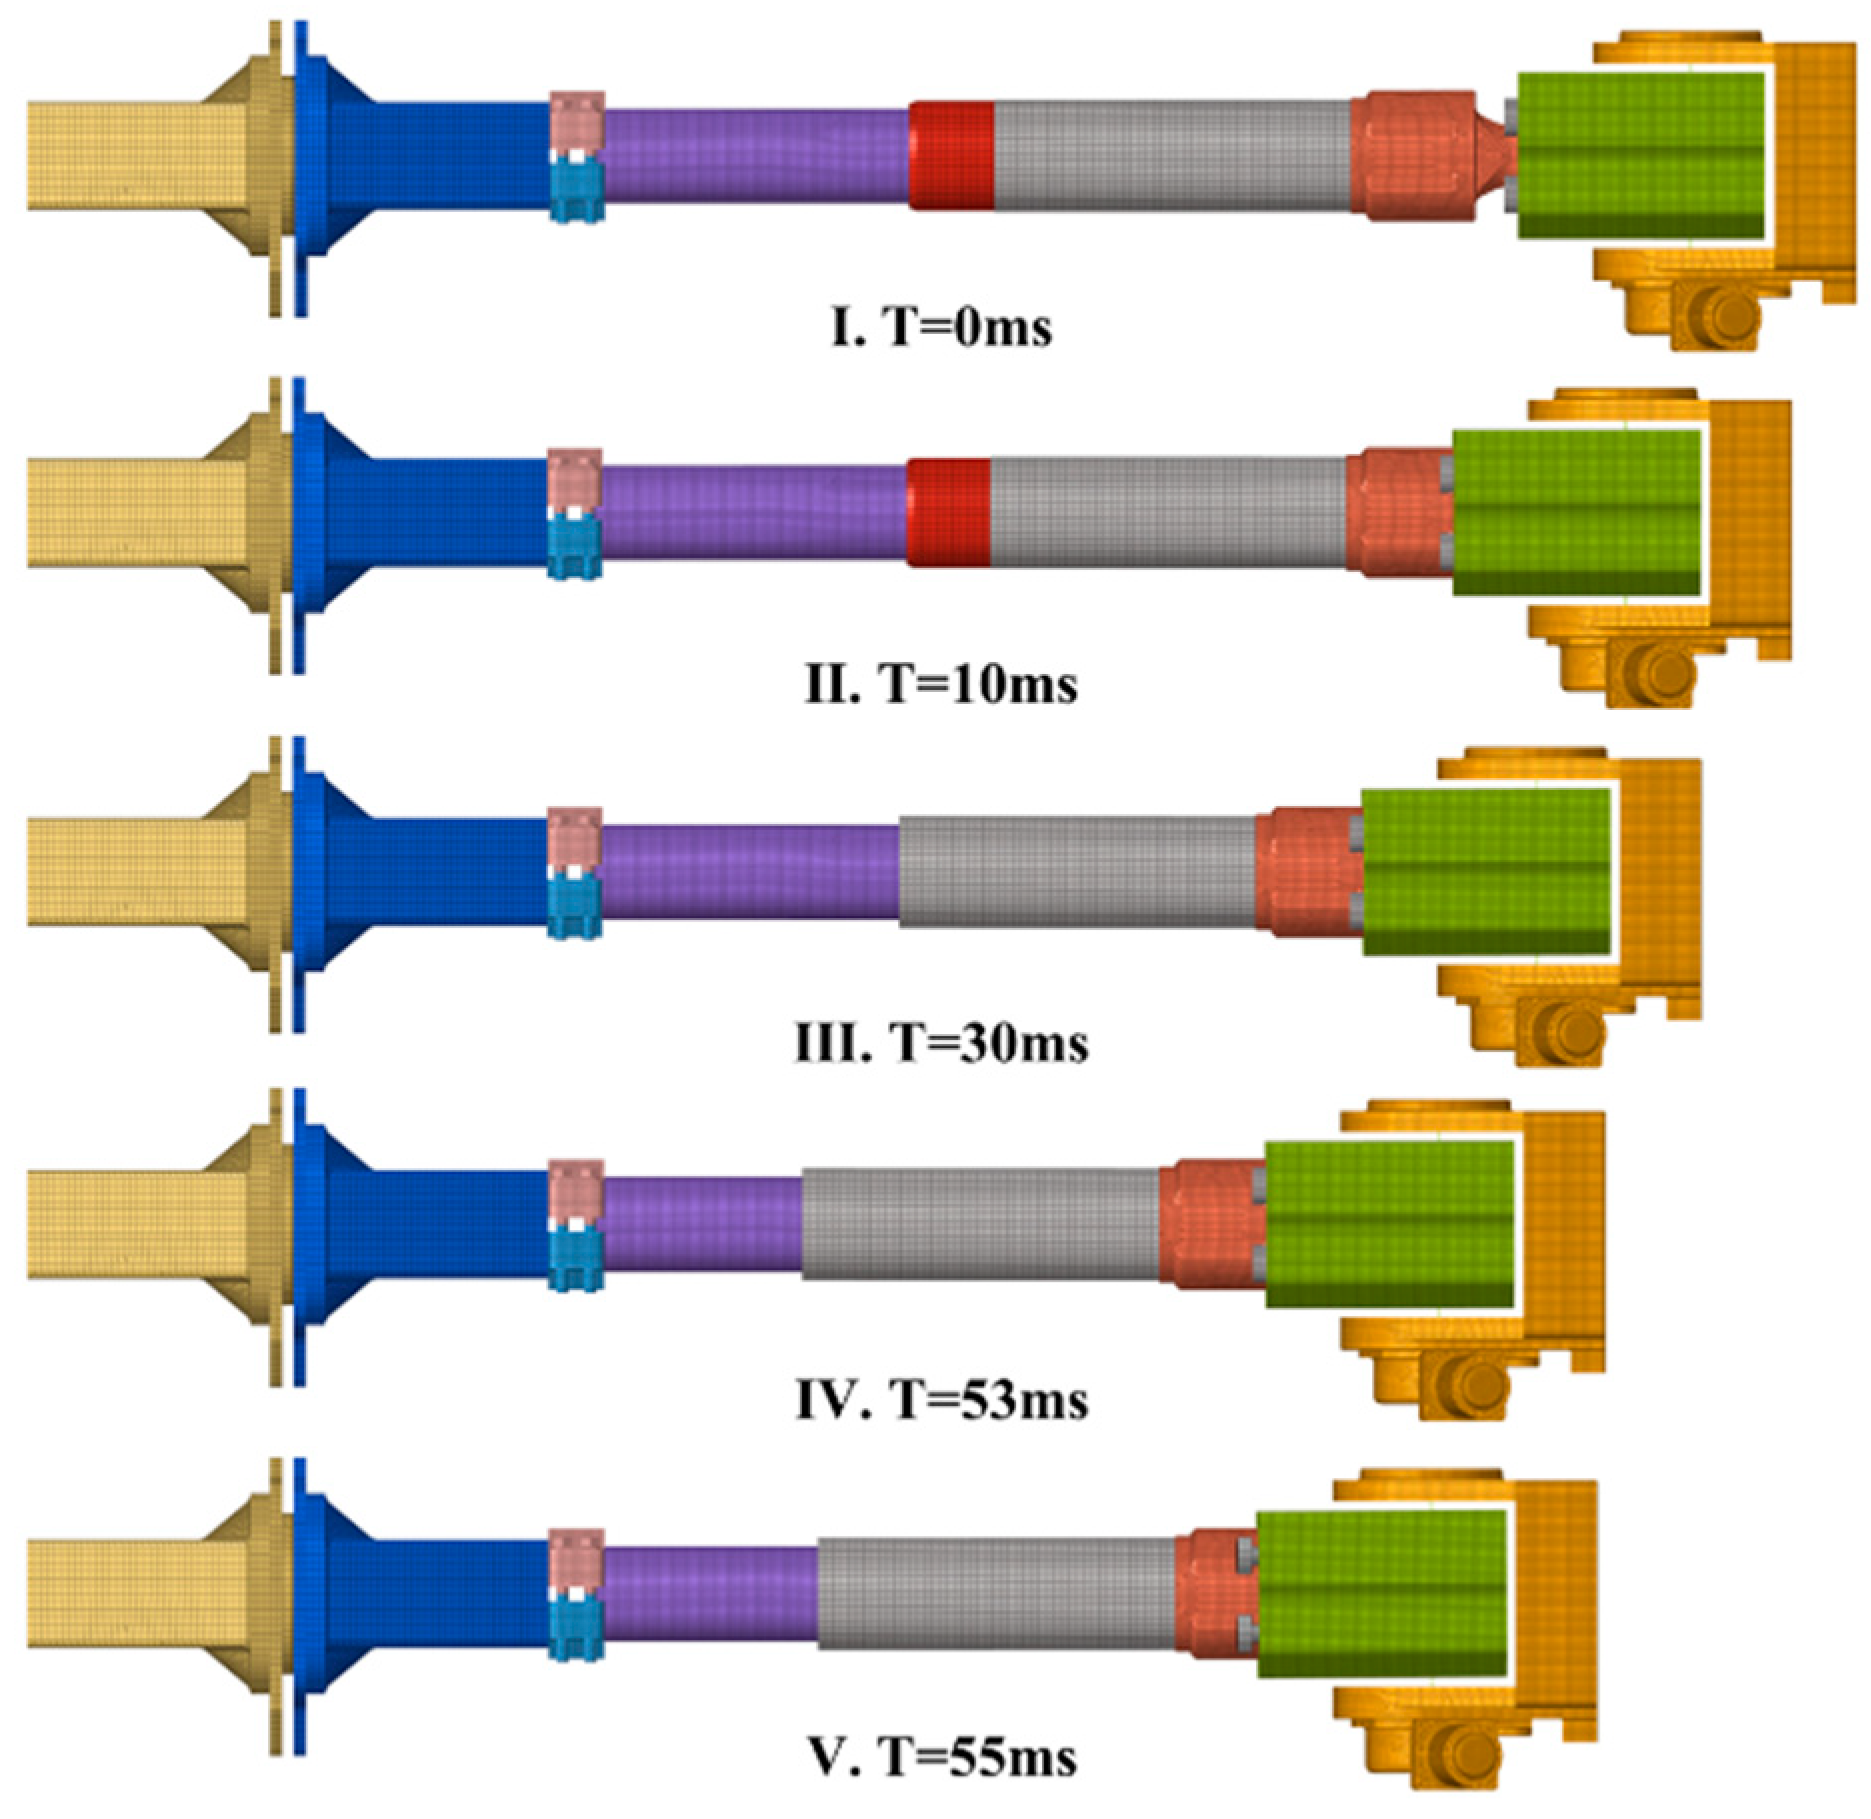
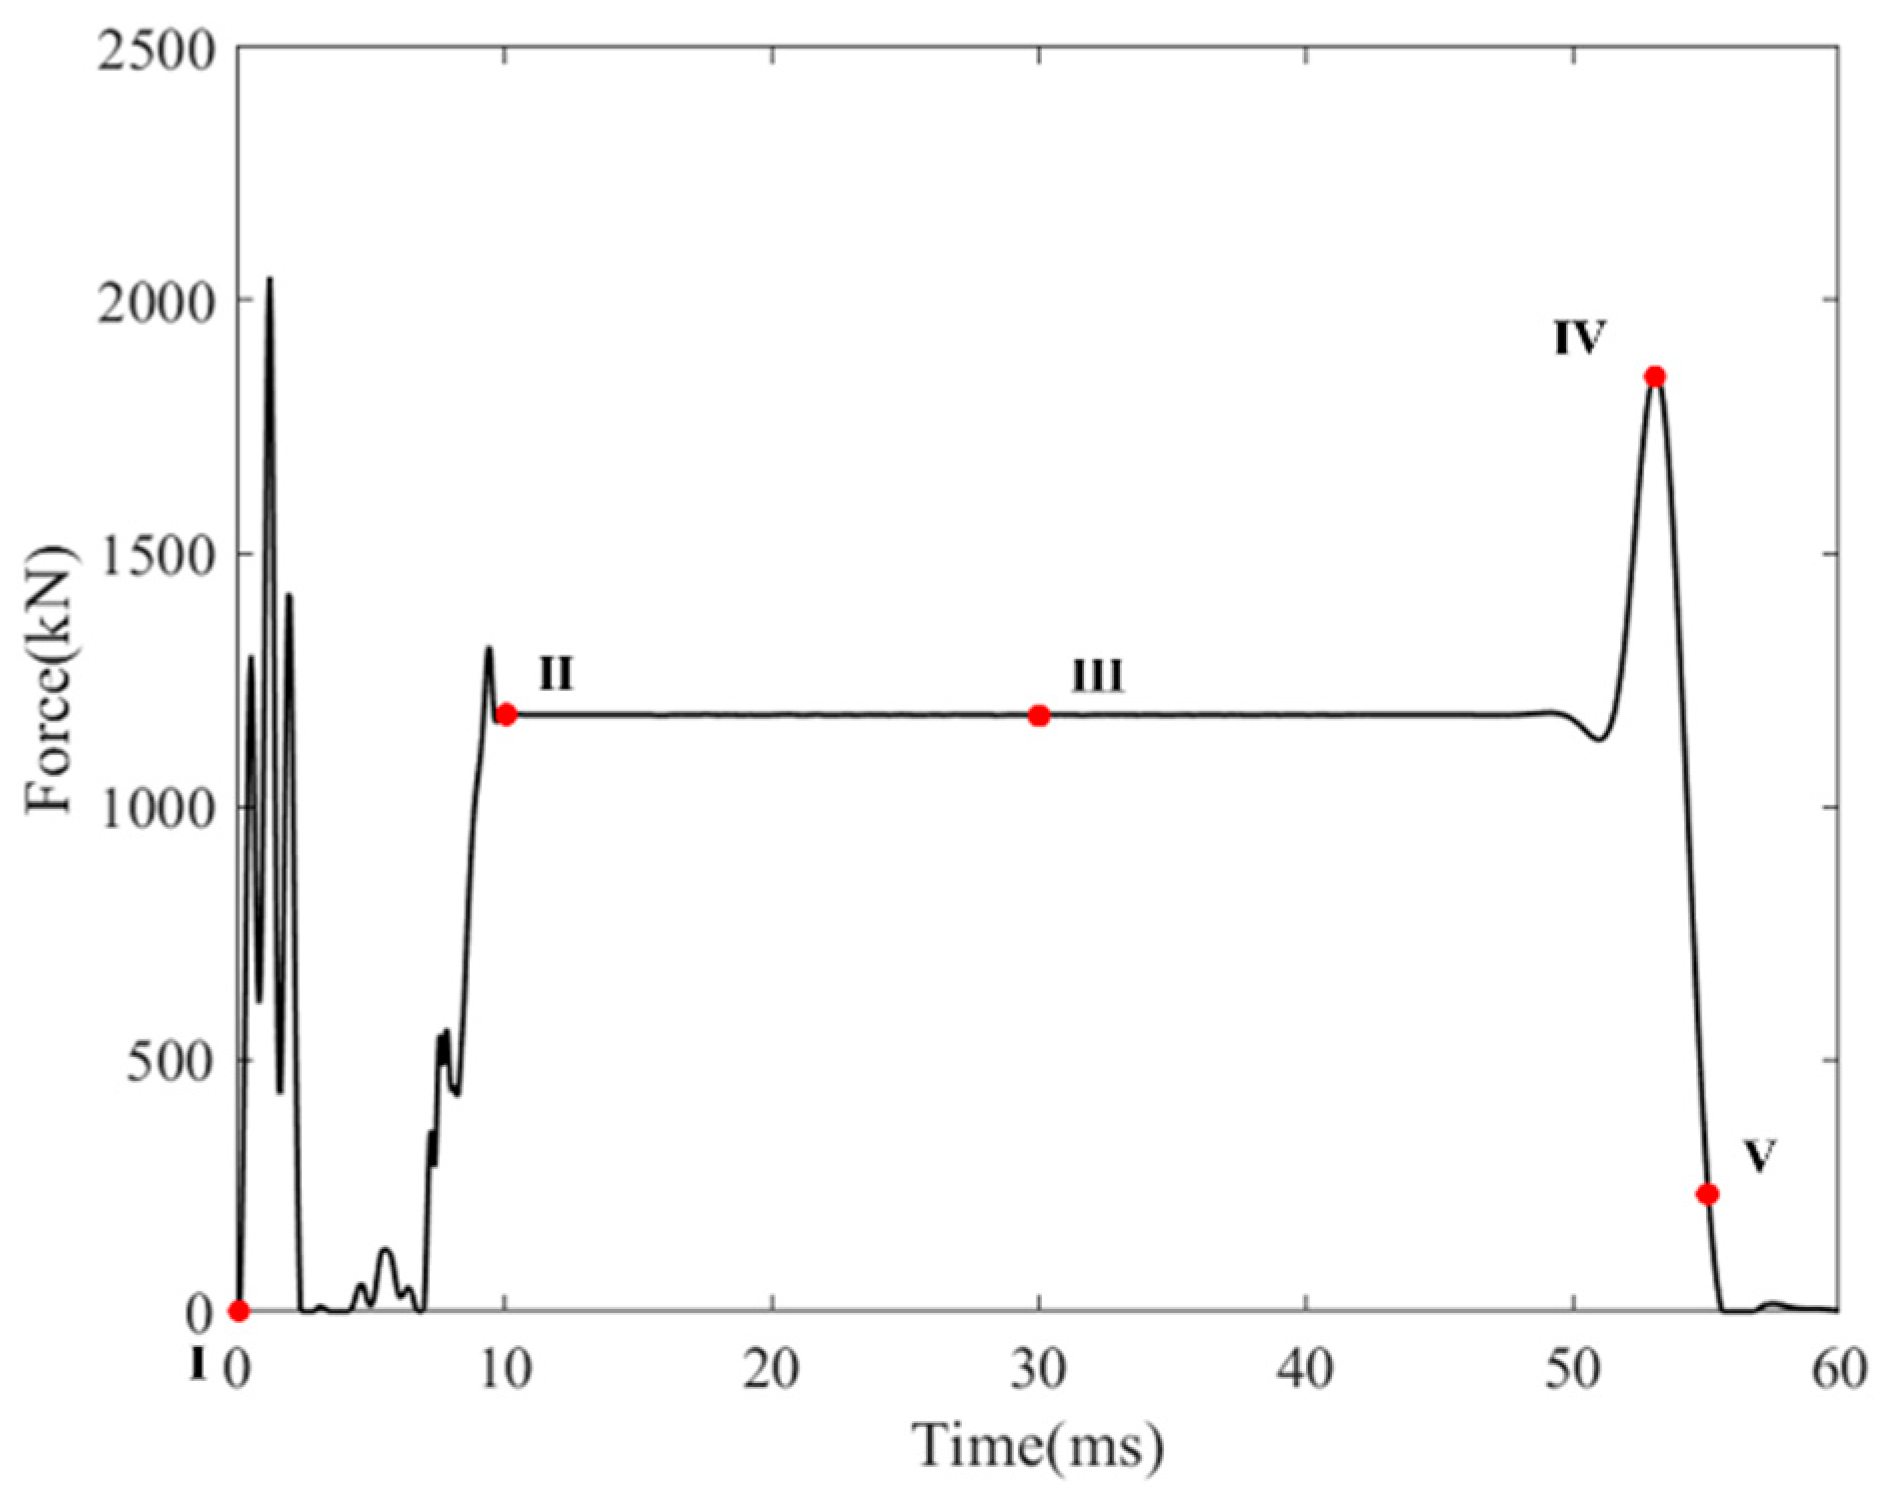
4.3.1. Simulation Validation
4.3.2. Experiment Validation
5. Conclusions
- The strength of the cut-out induced bolts need to match the collision dynamics behavior of the coupler. The bolts with excessive strength will prevent the timely disconnection of the coupler from the vehicle, leading to excessive impact acceleration and even climbing phenomena. The bolts with insufficient strength will cause the bolts to fail during the coupler’s operation, resulting in too low energy absorption by the coupler and preventing it from effectively absorbing kinetic energy.
- The simulation results indicate that during the coupler collision process, the peak force generated by the impact causes the cut-out induced bolts to neck, leading to a reduction in bolt strength. In the design of cut-out induced bolts, the influence of the peak impact force on the bolts should be considered, and a certain margin should be left in terms of strength.
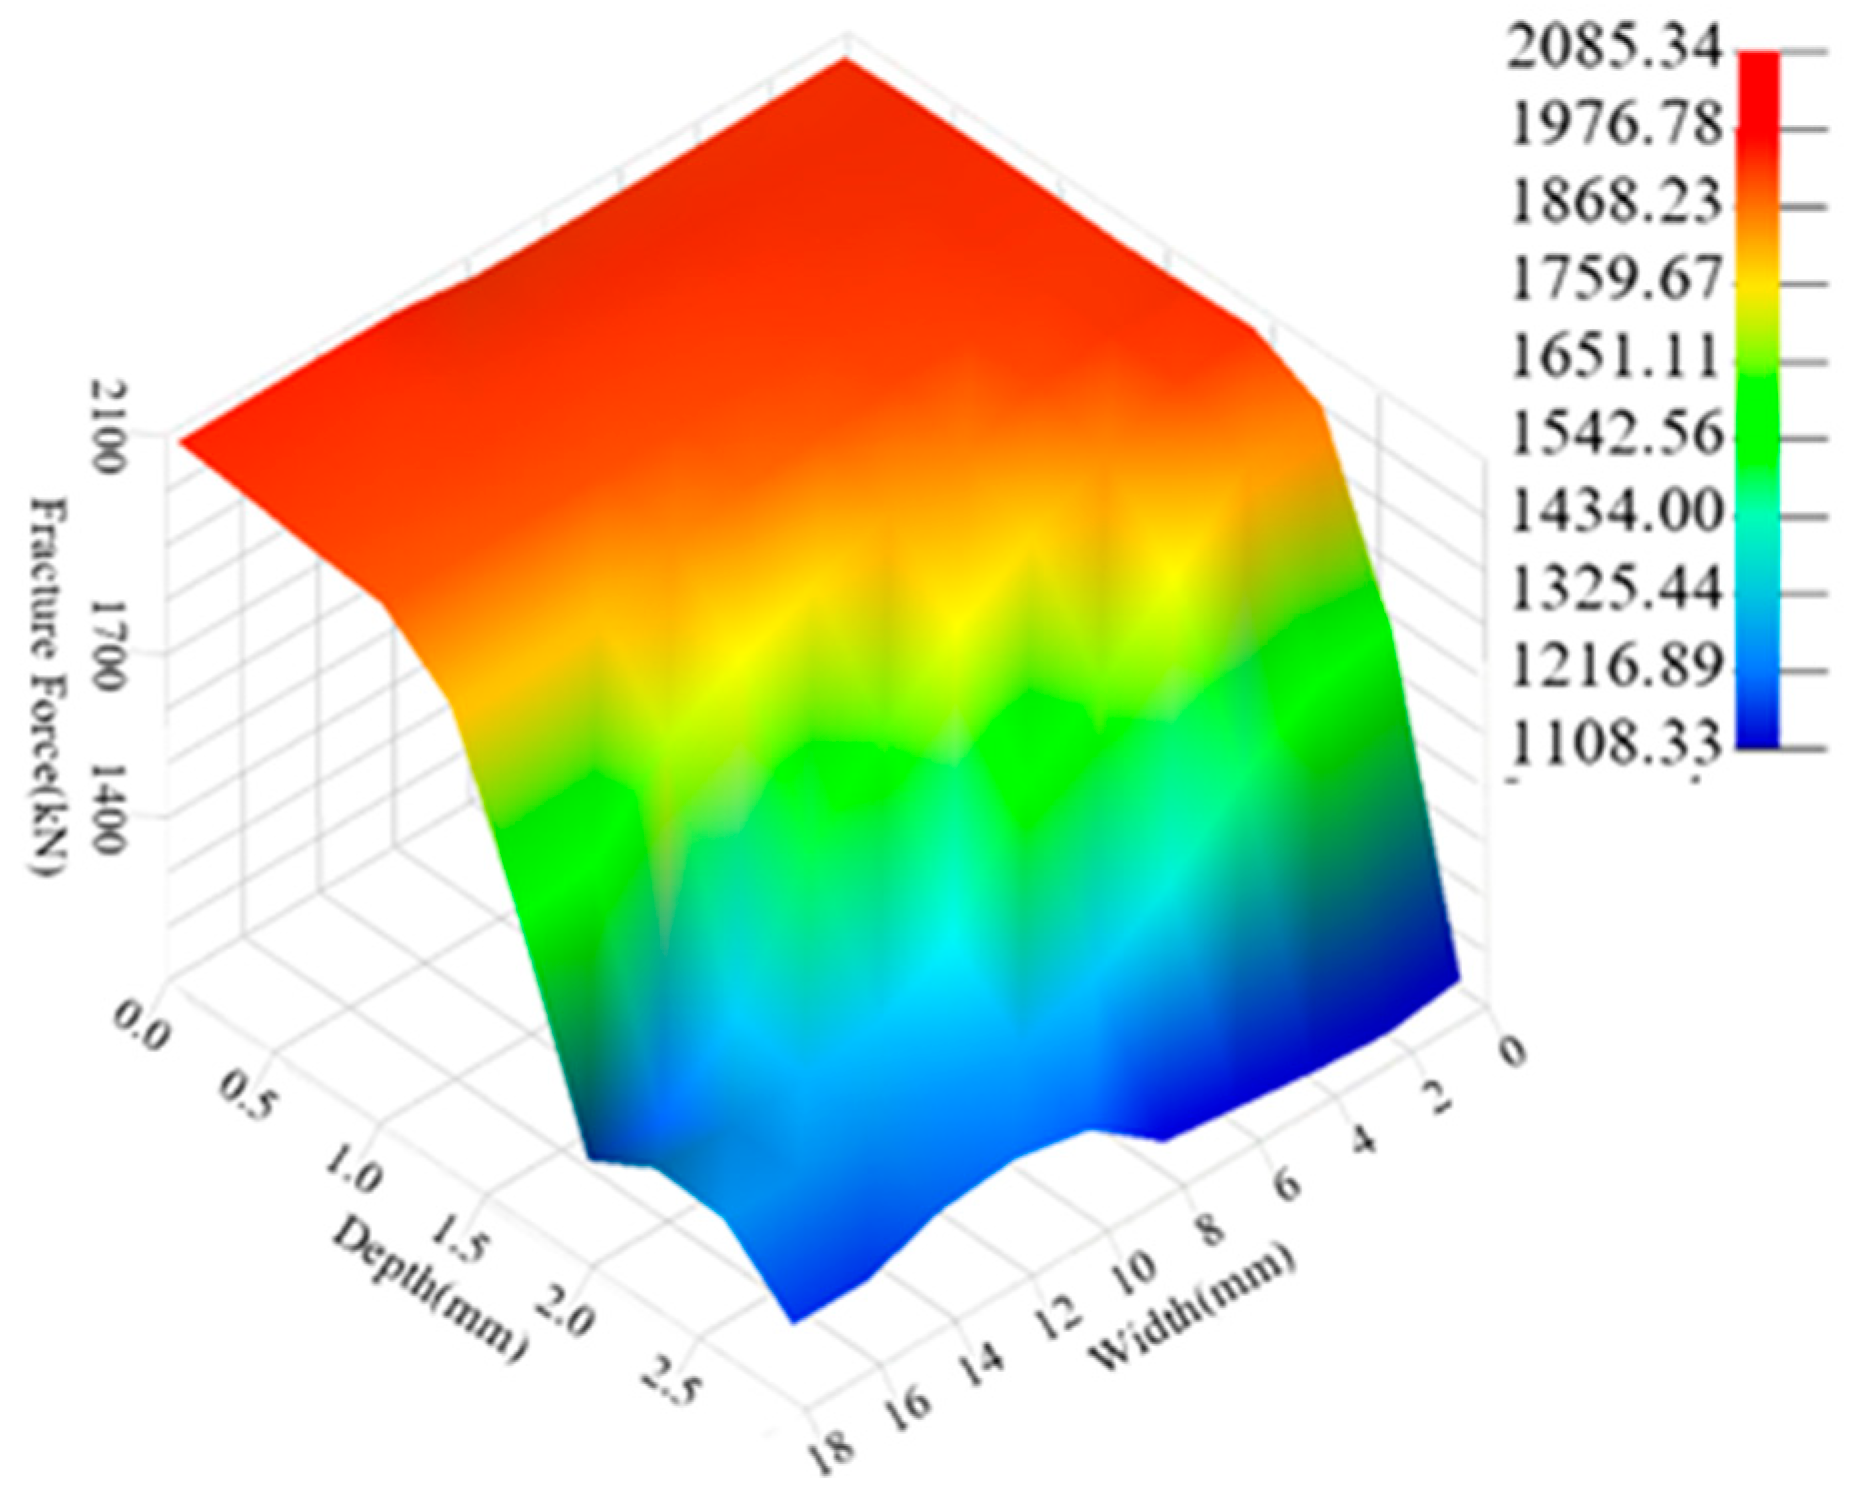
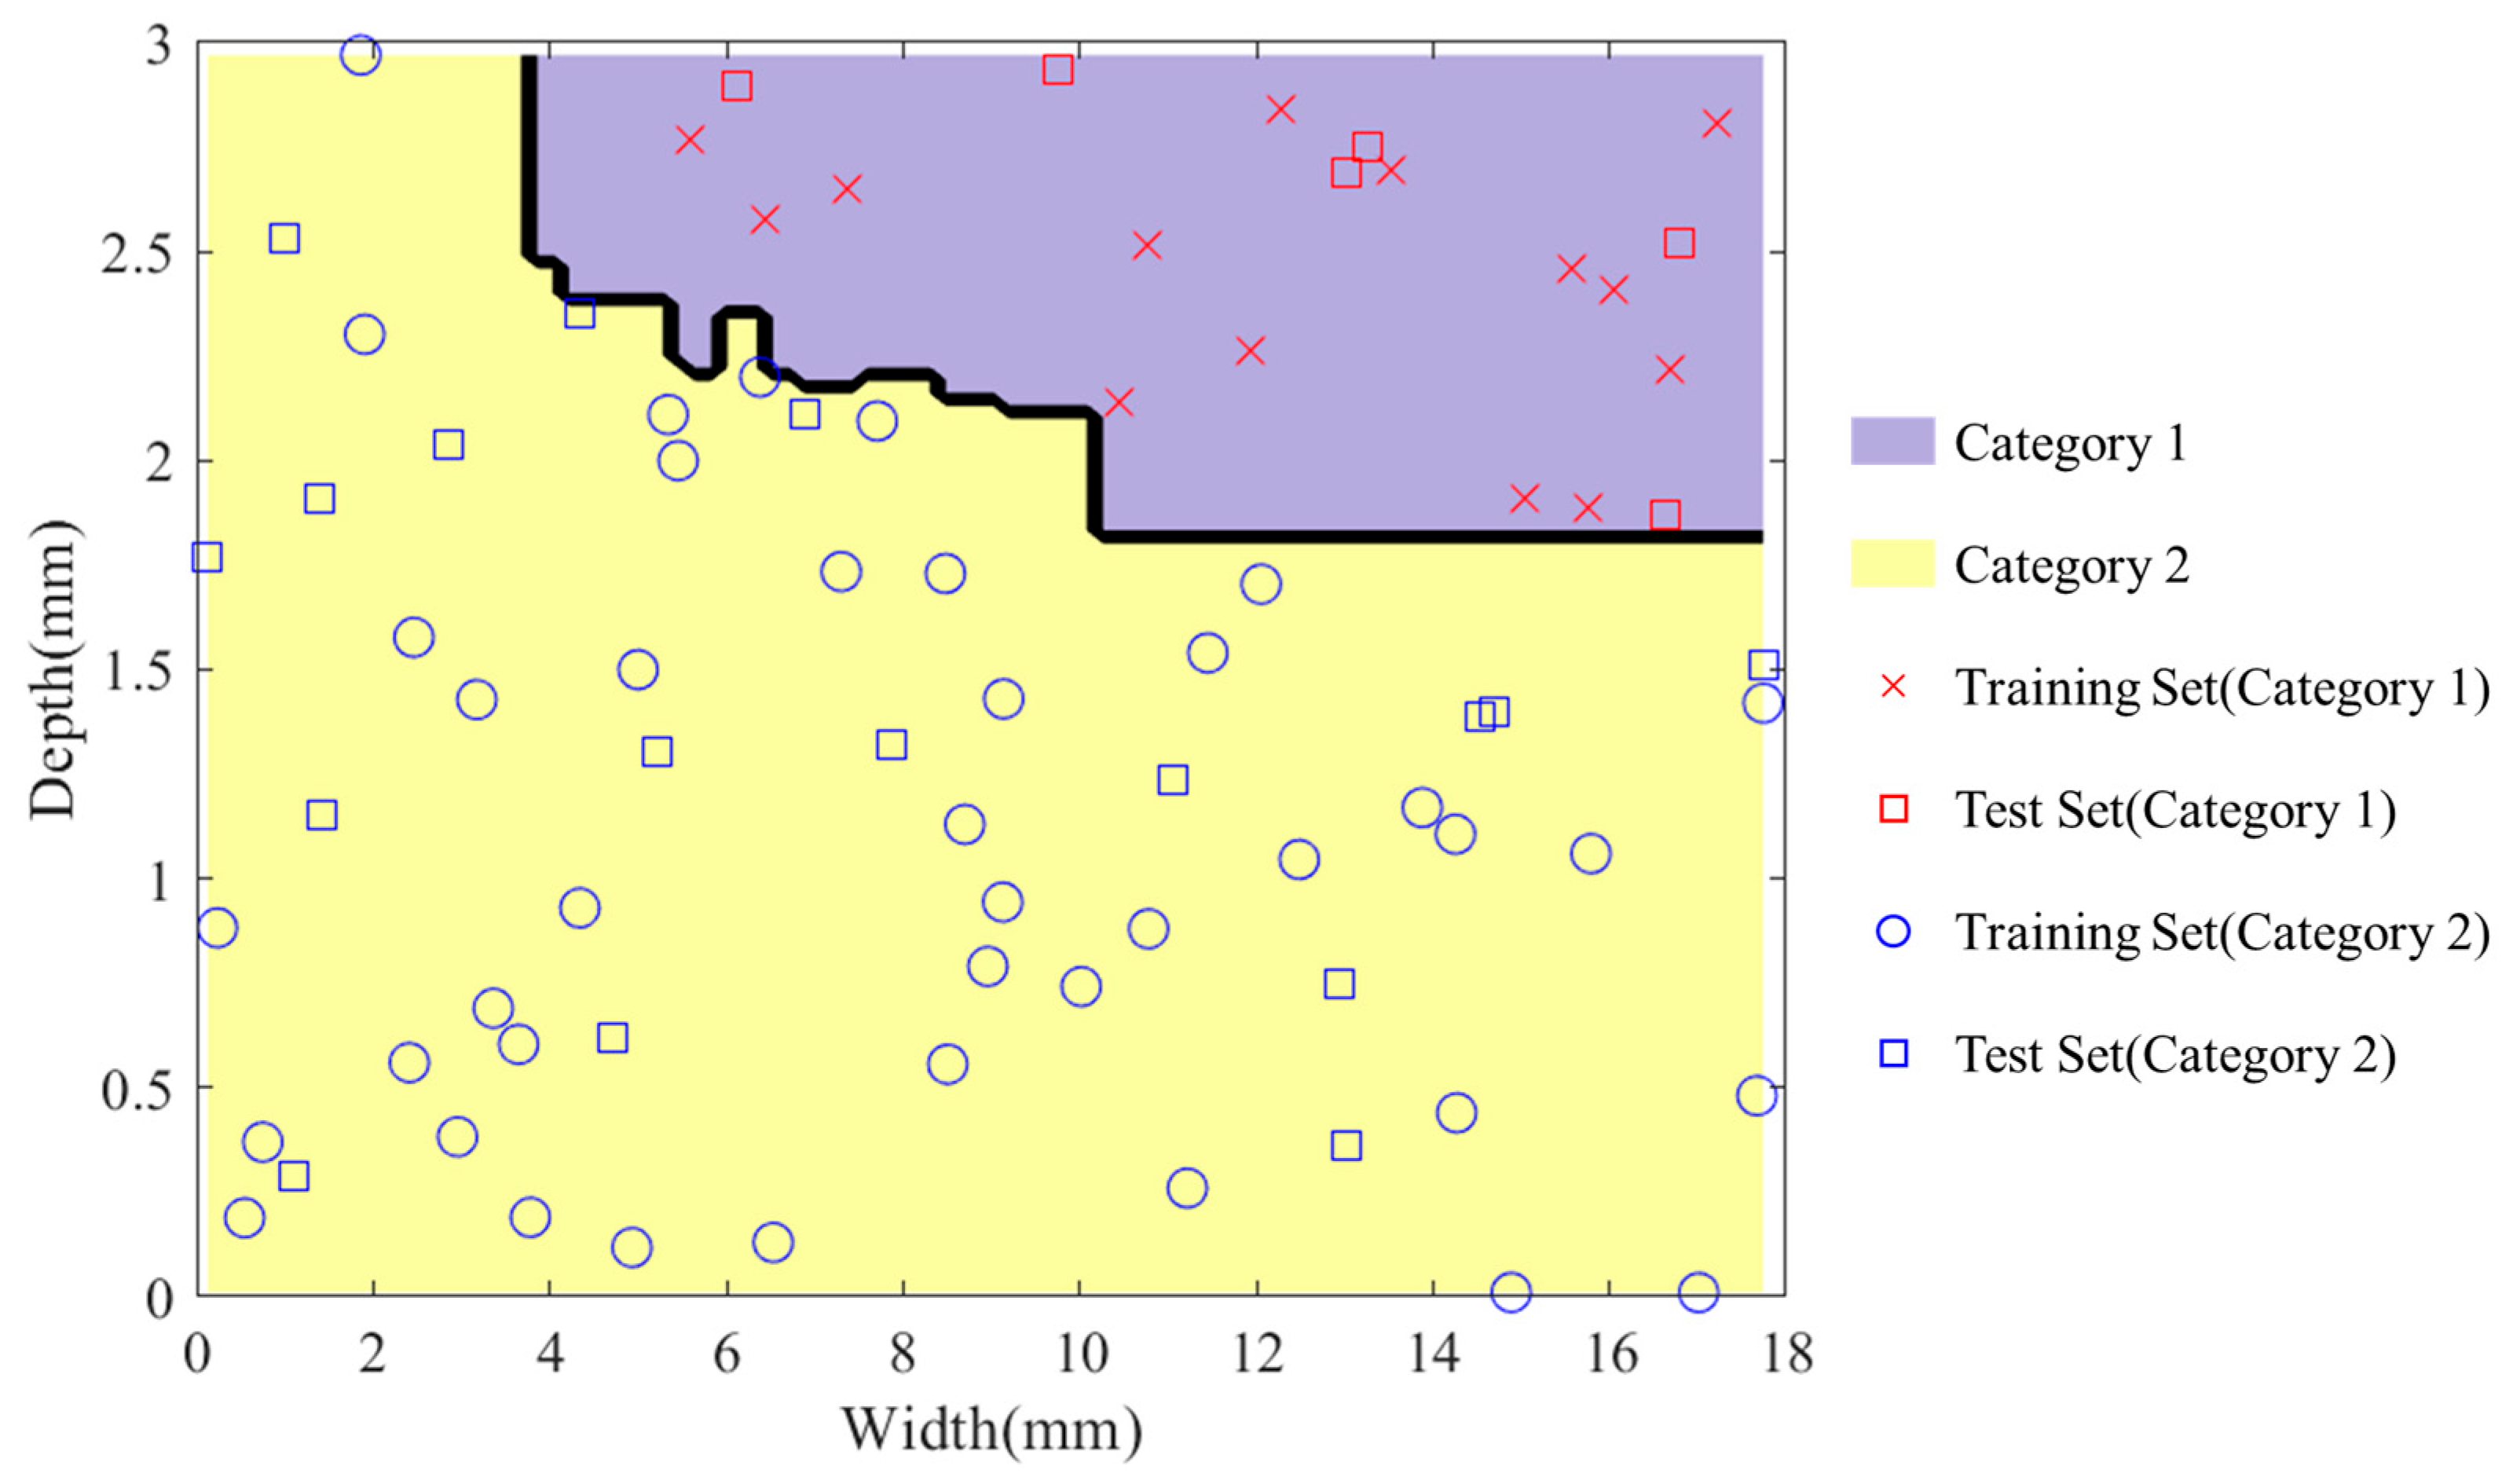
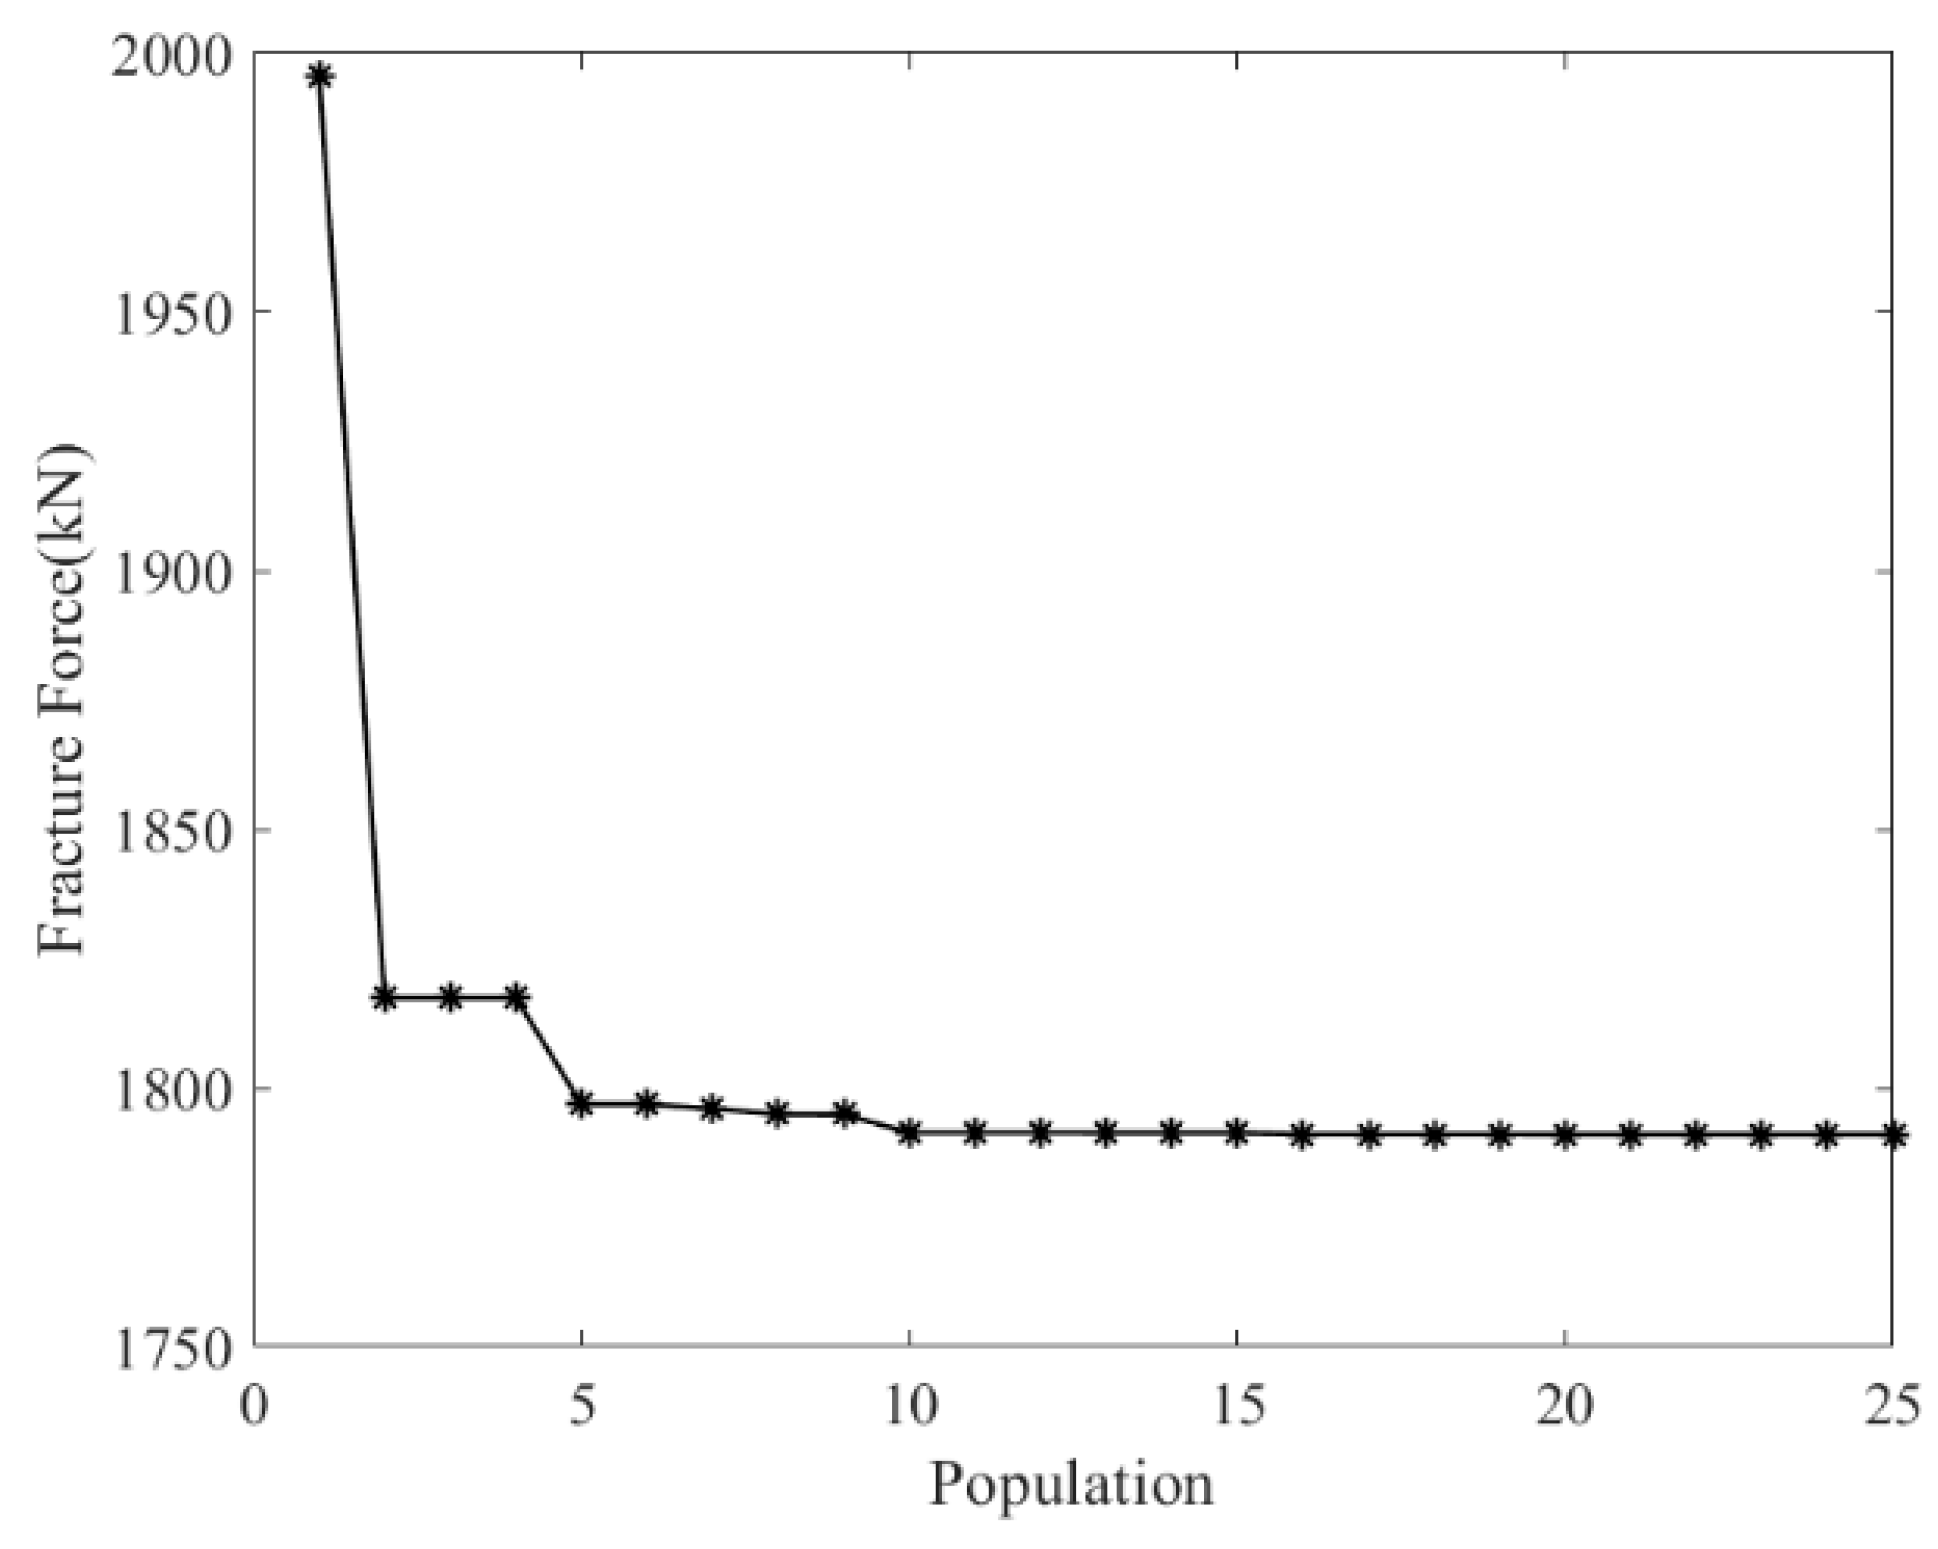
- The experimental design for the cut-out zone structural parameters of the cut-out induced bolts was conducted using the Latin Hypercube method. The Moving Least Squares method was used to fit the fracture force from the simulation results. Additionally, the simulation results were categorized based on the working condition of the expansion tube at the time of bolt fracture, and the decision boundary for the cut-out zone structural parameters was determined using the Random Forest algorithm. Finally, a surrogate model was constructed based on the fitting and classification models, and combined with a genetic algorithm. The following optimal parameters for the cut-out zone of the overload protection bolts were obtained: a width of 17.74 mm and a depth of 1.37 mm. Through structural optimization of the cut-out zone, the cut-out induced bolts’ fracture force increased from 1147.5 kN to 1828.44 kN (a 59.34% improvement), with a fracture time extending from 20.9 ms to 69 ms. The structurally optimized cut-out induced bolts enable the coupler to meet the energy absorption requirements for C-II class vehicles specified in EN 15227.
Author Contributions
Funding
Institutional Review Board Statement
Informed Consent Statement
Data Availability Statement
Conflicts of Interest
Appendix A

| Width (mm) | Depth (mm) | Width (mm) | Depth (mm) | ||
|---|---|---|---|---|---|
| 1 | 5.00 | 1.50 | 40 | 6.88 | 2.11 |
| 2 | 2.41 | 0.56 | 41 | 9.76 | 2.94 |
| 3 | 6.38 | 2.20 | 42 | 12.49 | 1.05 |
| 4 | 3.78 | 0.19 | 43 | 17.67 | 0.48 |
| 5 | 5.34 | 2.11 | 44 | 9.13 | 0.94 |
| 6 | 6.53 | 0.13 | 45 | 3.65 | 0.60 |
| 7 | 10.78 | 0.88 | 46 | 3.17 | 1.43 |
| 8 | 1.40 | 1.91 | 47 | 8.96 | 0.79 |
| 9 | 16.04 | 2.41 | 48 | 1.10 | 0.29 |
| 10 | 17.01 | 0.01 | 49 | 13.01 | 0.36 |
| 11 | 12.28 | 2.84 | 50 | 10.02 | 0.74 |
| 12 | 11.94 | 2.26 | 51 | 8.51 | 0.56 |
| 13 | 7.87 | 1.32 | 52 | 7.71 | 2.09 |
| 14 | 15.79 | 1.06 | 53 | 15.76 | 1.89 |
| 15 | 8.70 | 1.13 | 54 | 10.76 | 2.52 |
| 16 | 3.36 | 0.69 | 55 | 5.45 | 2.00 |
| 17 | 14.69 | 1.40 | 56 | 16.64 | 1.87 |
| 18 | 9.14 | 1.43 | 57 | 4.93 | 0.12 |
| 19 | 7.38 | 2.65 | 58 | 5.23 | 1.30 |
| 20 | 10.44 | 2.14 | 59 | 2.95 | 0.38 |
| 21 | 2.85 | 2.04 | 60 | 13.27 | 2.75 |
| 22 | 4.34 | 0.93 | 61 | 4.35 | 2.35 |
| 23 | 16.78 | 2.52 | 62 | 0.24 | 0.88 |
| 24 | 17.74 | 1.51 | 63 | 1.90 | 2.30 |
| 25 | 12.95 | 0.75 | 64 | 15.56 | 2.46 |
| 26 | 1.86 | 2.97 | 65 | 6.11 | 2.90 |
| 27 | 5.59 | 2.77 | 66 | 16.69 | 2.22 |
| 28 | 8.48 | 1.73 | 67 | 7.30 | 1.73 |
| 29 | 15.03 | 1.91 | 68 | 12.06 | 1.70 |
| 30 | 0.13 | 1.77 | 69 | 1.42 | 1.15 |
| 31 | 0.75 | 0.37 | 70 | 2.46 | 1.58 |
| 32 | 4.71 | 0.62 | 71 | 6.43 | 2.58 |
| 33 | 13.88 | 1.17 | 72 | 11.45 | 1.54 |
| 34 | 14.27 | 0.44 | 73 | 0.55 | 0.19 |
| 35 | 13.01 | 2.69 | 74 | 14.26 | 1.11 |
| 36 | 11.22 | 0.26 | 75 | 14.89 | 0.01 |
| 37 | 11.07 | 1.24 | 76 | 17.23 | 2.81 |
| 38 | 13.53 | 2.69 | 77 | 0.99 | 2.53 |
| 39 | 14.53 | 1.39 | 78 | 17.74 | 1.42 |
| Fracture Time (ms) | Fracture Force (kN) | Fracture Time (ms) | Fracture Force (kN) | ||
|---|---|---|---|---|---|
| 1 | 53.15 | 2044.39 | 40 | 52.95 | 1762.44 |
| 2 | 53.40 | 2068.11 | 41 | 11.95 | 1234.98 |
| 3 | 52.95 | 1731.50 | 42 | 53.25 | 2035.52 |
| 4 | 53.45 | 2072.15 | 43 | 53.30 | 2057.84 |
| 5 | 53.05 | 1879.79 | 44 | 53.25 | 2046.64 |
| 6 | 53.40 | 2070.02 | 45 | 53.35 | 2067.34 |
| 7 | 53.25 | 2043.87 | 46 | 53.20 | 2057.26 |
| 8 | 53.25 | 2071.29 | 47 | 53.25 | 2054.46 |
| 9 | 12.35 | 1370.98 | 48 | 53.45 | 2069.72 |
| 10 | 53.45 | 2081.01 | 49 | 53.35 | 2064.07 |
| 11 | 12.10 | 1285.53 | 50 | 53.25 | 2052.19 |
| 12 | 12.30 | 1327.45 | 51 | 53.30 | 2061.17 |
| 13 | 53.20 | 2032.12 | 52 | 52.95 | 1738.84 |
| 14 | 53.25 | 2013.06 | 53 | 12.30 | 1267.01 |
| 15 | 53.20 | 2042.36 | 54 | 12.20 | 1336.78 |
| 16 | 53.35 | 2068.02 | 55 | 53.10 | 1930.31 |
| 17 | 53.15 | 1896.53 | 56 | 12.35 | 1271.25 |
| 18 | 53.20 | 2003.83 | 57 | 53.45 | 2070.19 |
| 19 | 12.10 | 1307.97 | 58 | 53.20 | 2047.02 |
| 20 | 17.90 | 1182.55 | 59 | 53.40 | 2069.73 |
| 21 | 53.15 | 2044.65 | 60 | 12.25 | 1335.87 |
| 22 | 53.25 | 2060.60 | 61 | 52.95 | 1800.22 |
| 23 | 12.30 | 1345.84 | 62 | 53.45 | 2071.38 |
| 24 | 53.15 | 1803.23 | 63 | 53.15 | 2052.59 |
| 25 | 53.25 | 2052.84 | 64 | 12.35 | 1371.14 |
| 26 | 53.05 | 1902.01 | 65 | 11.75 | 1133.62 |
| 27 | 12.05 | 1296.80 | 66 | 12.30 | 1323.97 |
| 28 | 53.10 | 1918.21 | 67 | 53.15 | 1952.27 |
| 29 | 12.40 | 1276.54 | 68 | 53.10 | 1815.22 |
| 30 | 53.40 | 2071.84 | 69 | 53.35 | 2069.51 |
| 31 | 53.45 | 2070.99 | 70 | 53.25 | 2062.79 |
| 32 | 53.35 | 2066.22 | 71 | 12.20 | 1355.25 |
| 33 | 53.20 | 2000.67 | 72 | 53.15 | 1901.54 |
| 34 | 53.30 | 2056.69 | 73 | 53.45 | 2074.48 |
| 35 | 12.30 | 1357.96 | 74 | 53.20 | 2012.81 |
| 36 | 53.35 | 2070.69 | 75 | 53.50 | 2087.22 |
| 37 | 53.25 | 2023.61 | 76 | 12.10 | 1245.23 |
| 38 | 12.00 | 1246.76 | 77 | 53.05 | 1742.35 |
| 39 | 53.15 | 1905.54 | 78 | 53.10 | 1825.82 |
References
- Gao, G.; Guan, W.; Li, J.; Dong, H.; Zou, X.; Chen, W. Experimental investigation of an active–passive integration energy absorber for railway vehicles. Thin-Walled Struct. 2017, 117, 89–97. [Google Scholar] [CrossRef]
- Yao, S.; Xie, M.; Li, Z.; Zhang, P.; Dong, Y. Optimization of collision energy management for long series EMU based on machine learning. J. Cent. South Univ. (Sci. Technol.) 2024, 3, 1218–1230. [Google Scholar]
- Gao, G.-J.; Zhuo, T.-Y.; Guan, W.-Y. Recent research development of energy-absorption structure and application for railway vehicles. J. Central S. Univ. 2020, 27, 1012–1038. [Google Scholar] [CrossRef]
- Zhu, T.; Xiao, S.; Lei, C.; Wang, X.; Zhang, J.; Yang, B.; Yang, G.; Li, Y. Rail vehicle crashworthiness based on collision energy management: An overview. Int. J. Rail Transp. 2020, 9, 101–131. [Google Scholar] [CrossRef]
- Wang, S.; Peng, Y.; Wang, T.; Chen, X.; Hou, L.; Zhang, H. The origami inspired optimization design to improve the crashworthiness of a multi-cell thin-walled structure for high speed train. Int. J. Mech. Sci. 2019, 159, 345–358. [Google Scholar] [CrossRef]
- Xu, Z.; Ma, W.; Wu, Q.; Luo, S. Coupler rotation behaviour and its effect on heavy haul trains. Veh. Syst. Dyn. 2013, 51, 1818–1838. [Google Scholar] [CrossRef]
- Chen, D. Derailment Risk Due to Coupler Jack-Knifing under Longitudinal Buff Force. Proc. Inst. Mech. Eng. Part F J. Rail Rapid Transit 2010, 224, 483–490. [Google Scholar] [CrossRef]
- Li, C.; Zhang, Y.; Xu, Y. Comparative study on automatic coupler overload protection device of metro vehicle. Urban Mass Transit 2016, 1, 123–126. [Google Scholar] [CrossRef]
- Yao, S.; Zhang, P.; Kong, L.; Jiang, S.; Xu, P. Optimization design of the coupler overload protection component: Numerical simulation and experimental validation. Int. J. Crashworthiness 2022, 28, 306–320. [Google Scholar] [CrossRef]
- Guan, W.; Gao, G.; Yu, Y.; Li, J. Experimental and numerical investigations of the plastic response and fracturing of an aluminium-plated structure with transition circular arcs subjected to impact loading. Thin-Walled Struct. 2018, 132, 642–657. [Google Scholar] [CrossRef]
- Eom, T.-S.; Cho, S.-R.; Lim, J.-J. Behavior of end plate connection for steel angles. Eng. Struct. 2022, 252, 113714. [Google Scholar] [CrossRef]
- Gong, Y. Ultimate tensile deformation and strength capacities of bolted-angle connections. J. Constr. Steel Res. 2014, 100, 50–59. [Google Scholar] [CrossRef]
- Teh, L.H.; Gilbert, B.P. Net Section Tension Capacity of Equal Angle Braces Bolted at Different Legs. J. Struct. Eng. 2014, 140, 06014002. [Google Scholar] [CrossRef]
- Wan, Y.; Lu, W.; Li, H.; Huang, Y.; Lei, Z.; Yang, B. Tensile behavior of the bolt-jointed GFRP after low-velocity impact. Polym. Compos. 2023, 44, 2645–2655. [Google Scholar] [CrossRef]
- Guzas, E.; Behan, K.; Davis, J. 3D Finite Element Modeling of Single Bolt Connections under Static and Dynamic Tension Loading. Shock. Vib. 2015, 2015, 205018. [Google Scholar] [CrossRef]
- Mi, S.; Yang, L.; Xu, K.; Han, Y. Experimental and numerical investigation of novel triangular headed one-sided bolted T-stub connections. Structures 2024, 69, 107491. [Google Scholar] [CrossRef]
- Liang, K.; Wang, Z.; Yin, Z.; Hao, P. Investigation on bearing capacity and fracture behaviour of the bolt in a flange connection considering multiple load cases. Structures 2024, 62, 106252. [Google Scholar] [CrossRef]
- Guo, H.; Xie, Y.; Liu, Y.; Yang, D. Study on mechanical behavior of Q690D high strength steel bearing-type bolted connections. Structures 2020, 23, 588–601. [Google Scholar] [CrossRef]
- Lemma, M.S.; Rebelo, C.; Conde, J.C.; da Silva, L.S. Experimental and numerical characterization of column webs/faces loaded out-of-plane in steel joints. Thin-Walled Struct. 2024, 203, 112141. [Google Scholar] [CrossRef]
- Liu, F.; Lu, X.; Zhao, L.; Zhang, J.; Hu, N.; Xu, J. An interpretation of the load distributions in highly torqued single-lap composite bolted joints with bolt-hole clearances. Compos. Part B Eng. 2018, 138, 194–205. [Google Scholar] [CrossRef]
- Ahmed, N.Z. Experimental and numerical investigation of the bending behavior in nontraditional steel beam-to-beam tip connections. Structures 2024, 62, 106260. [Google Scholar] [CrossRef]
- Zhang, J.-F.; Zhao, J.-J.; Tian, G.-F.; Zhang, P.; Deng, E.-F.; He, J.-M.; Yu, H.-X.; Fan, Y.-F. Tensile behavior of the connection between nut-free high-strength bolt and endplate. J. Constr. Steel Res. 2020, 174, 106301. [Google Scholar] [CrossRef]
- Zhang, T.-M. Research of Strength Character of the Preloaded Bolt under Impact Load. Ship Ocean. Eng. 2012, 2, 166–169. [Google Scholar]
- Fransplass, H.; Langseth, M.; Hopperstad, O. Numerical study of the tensile behaviour of threaded steel fasteners at elevated rates of strain. Int. J. Impact Eng. 2013, 54, 19–30. [Google Scholar] [CrossRef]
- Tartaglia, R.; D’Aniello, M.; Zimbru, M. Experimental and numerical study on the T-Stub behaviour with preloaded bolts under large deformations. Structures 2020, 27, 2137–2155. [Google Scholar] [CrossRef]
- Zha, Y.; Wang, S.; Ma, Q.; Zhang, H.; Hui, X.; Zhou, T. Study on the axial impact of Al-CFRP thin-walled tubes with induced design. Polym. Compos. 2022, 43, 4660–4686. [Google Scholar] [CrossRef]
- Hussein, R.D.; Ruan, D.; Lu, G.; Thomson, R. An energy dissipating mechanism for crushing square aluminium/CFRP tubes. Compos. Struct. 2018, 183, 643–653. [Google Scholar] [CrossRef]
- Hussein, R.D.; Ruan, D.; Lu, G. Cutting and crushing of square aluminium/CFRP tubes. Compos. Struct. 2017, 171, 403–418. [Google Scholar] [CrossRef]
- Yao, S.; Zhang, M. Effect of Preload on Tensile Fracture of Variable Cross-Section Bolts: Experiment and Simulation. Metals 2023, 13, 744. [Google Scholar] [CrossRef]
- Yao, S.; Zhang, P.; Xing, J.; Zhao, H.; Xu, P. Application of a weighted graph representation method to the crashworthiness optimization of subway collision frame structures. Structures 2022, 45, 1095–1109. [Google Scholar] [CrossRef]
- Li, Z. Research on Performance of Rubber Buffer for Urban Rail Vehicles. Master’s Thesis, Southwest Jiaotong University, Chengdu, China, 2016. [Google Scholar] [CrossRef]
- Zhou, J.; Li, L.; Hang, P.; Ding, Y. Effects of heat treatment and thread rolling sequence on fatigue and corrosion resistance of 304/Q235 bimetal composite Bolts. Mater. Today Commun. 2025, 45, 112175. [Google Scholar] [CrossRef]
- Zhang, J.; Yang, T.; Du, Y.; He, R.; Liu, C. Tensile mechanical properties and damage analysis of layered woven GFRP composite bolts. Compos. Part B Eng. 2024, 271, 111155. [Google Scholar] [CrossRef]
- Nuge, T.; Fazeli, M.; Baniasadi, H. Elucidating the enduring transformations in cellulose-based carbon nanofibers through prolonged isothermal treatment. Int. J. Biol. Macromol. 2024, 275, 133480. [Google Scholar] [CrossRef] [PubMed]
- Abidnejad, R.; Baniasadi, H.; Fazeli, M.; Lipponen, S.; Kontturi, E.; Rojas, O.J.; Mattos, B.D. High-fiber content composites produced from mixed textile waste: Balancing cotton and polyester fibers for improved composite performance. Int. J. Biol. Macromol. 2025, 292, 139227. [Google Scholar] [CrossRef] [PubMed]
- EN 15227:2008+A1:2010; Railway Applications—Crashworthiness Requirements for Railway Vehicle Bodies. European Committee for Standardization: Brussels, Belgium, 2020.


| Density (g/cm3) | Young’s Modulus (GPa) | Poisson Ratio | Yield Stress (MPa) |
|---|---|---|---|
| 7.82 | 206.08 | 0.3 | 835.27 |
| Methods | R2 | RAAE |
|---|---|---|
| LSR | 0.8577 | 0.2411 |
| MLSM | 0.9849 | 0.0727 |
| HK | 0.9036 | 0.1235 |
| RBF | 0.9753 | 0.0840 |
| LSR | 0.8577 | 0.2411 |
| Maximum Iterations | Minimum Iterations | Population Size | Mutation Rate | Crossover Rate |
|---|---|---|---|---|
| 50 | 25 | 60 | 0.01 | 0.5 |
| Surrogate Model | Simulation | Experiment | |
|---|---|---|---|
| Fracture Force (kN) | 1894.13 | 1855.59 | 1828.44 |
| Deviation from Experiment | 3.59% | 1.48% | / |
Disclaimer/Publisher’s Note: The statements, opinions and data contained in all publications are solely those of the individual author(s) and contributor(s) and not of MDPI and/or the editor(s). MDPI and/or the editor(s) disclaim responsibility for any injury to people or property resulting from any ideas, methods, instructions or products referred to in the content. |
© 2025 by the authors. Licensee MDPI, Basel, Switzerland. This article is an open access article distributed under the terms and conditions of the Creative Commons Attribution (CC BY) license (https://creativecommons.org/licenses/by/4.0/).
Share and Cite
Yang, L.; Yao, S.; Xu, P.; Zou, F.; Xie, M.; Xing, J. Fracture Threshold Analysis and Parameter Matching of Cut-Out Induced Bolts for Subway Couplers. Appl. Sci. 2025, 15, 5751. https://doi.org/10.3390/app15105751
Yang L, Yao S, Xu P, Zou F, Xie M, Xing J. Fracture Threshold Analysis and Parameter Matching of Cut-Out Induced Bolts for Subway Couplers. Applied Sciences. 2025; 15(10):5751. https://doi.org/10.3390/app15105751
Chicago/Turabian StyleYang, Lei, Shuguang Yao, Ping Xu, Fan Zou, Minhan Xie, and Jie Xing. 2025. "Fracture Threshold Analysis and Parameter Matching of Cut-Out Induced Bolts for Subway Couplers" Applied Sciences 15, no. 10: 5751. https://doi.org/10.3390/app15105751
APA StyleYang, L., Yao, S., Xu, P., Zou, F., Xie, M., & Xing, J. (2025). Fracture Threshold Analysis and Parameter Matching of Cut-Out Induced Bolts for Subway Couplers. Applied Sciences, 15(10), 5751. https://doi.org/10.3390/app15105751