Abstract
A devastating earthquake took place on 8 April 1893, close to the town of Svilajnac, central Serbia. Over the past decade, significant historical data on the effects of this earthquake has been collected from a variety of sources, including books, scientific publications, reports, newspapers, and coeval chronicles. Additionally, this earthquake was recorded 750 km from the epicenter at the seismological station Rocca di Papa in Rome, Italy. Based on critical review and analysis of the historical data, we demonstrate that the epicentral area of this earthquake was 531 km2, and the macroseismic effects were recorded at epicentral distances up to 600 km towards the west (Vienna, Austria) towards the north, up to 500 km (Košice–Michalovce, Slovakia), towards the east up to 460 km (Brašov–Borsec, Romania); and towards the south up to about 300 km (Radoviš, North Macedonia). Finally, we show that the key parameters of the 1893 Svilajnac earthquake are as follows: (1) epicentral intensity, I0 = IX EMS-98, (2) the estimations of the moment magnitude and focal depth based on the observed intensities, MW = 6.8 and h = 13 km, respectively, and (3) the epicenter coordinates, 44.160° N and 21.354° E.
1. Introduction
The Republic of Serbia is situated in the central-western Balkans and is surrounded by the Rhodopes and Balkan Mountains to the south-east, the Carpathian Mountains to the north-east, the Dinaric Alps to the south-west, and the Pannonian Basin to the north-west (see Figure 1—top right). The depth of the Moho is around 25 km below the Pannonian Basin and around 45 km below the Dinarides. The epicenters of the 1900–2024 regional earthquakes with MW ≥ 3.5, which were compiled by USGS [1], are displayed in Figure 1, bottom right. It can be seen that the entire territory of Serbia is seismically active. However, southern parts of Serbia are next to the Mediterranean-Trans-Asian belt, which is characterized by a comparatively high frequency of stronger seismic events, while in north Serbia, which is part of the Pannonian Basin, larger earthquakes are extremely infrequent. In addition to local seismic activity, Serbia is impacted by the Vrancea earthquakes, the epicenter of which is depicted in Figure 1—top right. Figure 1—bottom right, also shows epicenters of the two most catastrophic earthquakes to ever strike former Yugoslavia: the 26 July 1963, M6.0 Skopje earthquake and the 15 April 1979, M6.9 Montenegro earthquake, as well as the three most populous cities in Serbia (Belgrade, Novi Sad, and Niš). Figure 1, on the left, shows central Serbia and the epicenters of earthquakes with MW ≥ 5.0, which were compiled by the Seismological Survey of Serbia for the period between 1456 and 2010 [2]. Epicenters of the most destructive earthquakes in central Serbia in the past 100 years are also shown. Neither USGS [1] nor Seismological Survey of Serbia [2] mention a single event with magnitude MW larger than 6 in Serbia.
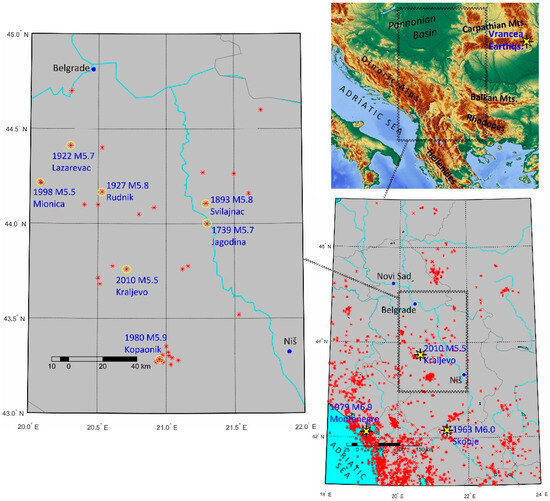
Figure 1.
Earthquakes in Serbia and the region: (bottom right)—epicenters of the regional earthquakes with MW ≥ 3.5, compiled by USGS for the period between 1900 and 2024 [1], including the epicenters of the two most devastating earthquakes in former Yugoslavia, (top right)—a geographic map of the Balkan region and Serbia (shown within the frame), also showing the location of the Vrancea, Romania seismic source zone, (left)—epicenters of the earthquakes in central Serbia with MW ≥ 5.0, compiled by the Seismological Survey of Serbia for the period between 1456 and 2010 [2].
This study focuses on the two strongest earthquakes on the territory of the Republic of Serbia in the past three hundred years that occurred in its central part in the valleys of the Morava and Resava rivers, the first on 4 February 1739, and the second on 8 April 1893 (24 January 1739, and 27 March 1893, respectively, according to Julian calendar, which was in use in Serbia till 1919). According to the earthquake catalogs of the Seismological Survey of Serbia prior to 2013, the magnitudes of these two earthquakes, evaluated based on macroseismic intensities, were 6.0 and 6.5, respectively [3,4]. Approximately the same values were given in the catalog of Shebalin et al. [5], in which the two magnitudes (once again assessed on the basis of macroseismic data) were 6.1 and 6.6, respectively, while in the SHEEC catalog [6], the same value of 6.42 was given for both earthquakes. However, in the latest (2013) catalog of the Seismological Survey of Serbia [2], the magnitude values for the two earthquakes were reduced from 6.0 to MW = 5.7 and from 6.5 to MW = 5.8, respectively, without any references or explanation as to how they obtained these values.
The objective of this paper is to assess the relevance of the recent magnitude values provided by the Seismological Survey of Serbia. Moreover, studying historical earthquakes sheds light on real seismic potential in the valleys of the Morava and Resava rivers. We first analyze in detail the data of the earthquake of 8 April 1893. For this event, in addition to the existing 318 data, we managed to obtain, in the past ten years, another 220 data in the form of written reports on the earthquake effects. These data could be found in published reports, classic works of literature and ancient texts, chronicles, newspaper articles, scientific papers, monographs, and macroseismic maps. For all of the 538 data, the macroseismic intensity was assessed for each particular location using the EMS 98 scale [7]. The intensity values that were estimated for different locations were then shown on the geographic map, together with the isoseismals that were drawn for each intensity degree. Based on the isoseismal areas, we have estimated the magnitude, the hypocentral depth, and the location of the epicenter. By comparing the spatial distribution of the intensity values of IX and VIII degrees with the neotectonic map of Serbia, we have also defined the tectonic blocks and the faults along which the initial movement occurred, as well as the direction of the rupture.
Regarding the 4 February 1739 earthquake, it is necessary to note that it is a less-documented historical event. For this earthquake, we managed to obtain only 8 data—written reports on the effects of the earthquake (in or near the monasteries Dokmir, Rakovac, Ravanica-Vrdnik, and Savina, and in the cities Timisoara and Pečuj). For the same or nearby locations (save for the monastery Savina in Montenegro) there were reports from the 8 April 1893 earthquake as well. We have presented a map showing the estimated intensity values from both earthquakes (1739 and 1893) for the analyzed locations.
2. The 8 April 1893 Earthquake—Available Data
2.1. Overview of the Seismological Data from Various Sources
On 8 April 1893, just before 3:00 PM local time (one among various catalogs reports a different value for the minutes of the occurrence of the event; see Table 1), an earthquake struck near the town of Svilajnac, Serbia. Gaining widespread notice from both the general populace and professionals in the regions that comprised Serbia, Austria–Hungary, Bulgaria, Romania, and segments of the Ottoman Empire at that time, this earthquake drew significant attention owing to its formidable intensity and the consequential impact it had on individuals, structures, and the surrounding environment. Notably, Serbia and Hungary experienced pronounced effects from this seismic event. As a result, the Geological Institute in Serbia and the Earthquake Committee of the Hungarian Geological Society and Central Meteorological Institute carried out systematic data collection from the regions where the earthquake manifested itself with destructive effects on buildings.
In the 1893 issue of the Hungarian Nature Journal, we found a contribution by Ferencz Schafarzik [8], which included information that the Svilajnac earthquake was recorded in the seismological observatory of Rocca di Papa, located in the vicinity of Rome, Italy (unfortunately, this record is no longer available). According to Shafarzik, the suggested origin time is 14 h 43 m 20 s Roman time, that is, at 14 h 53 m 31 s Central European time. Bearing in mind that the Rocca di Papa seismological station is located about 750 km from the location of the epicenter and that at that distance, the Pn waves arrive first, we can estimate the travel time of the Pn wave from the epicenter to the location of Rocca di Papa to be 95.54 s or approximately 1 m 36 s, assuming the Pn wave velocity of about 7.85 km/s [9]. By subtracting the estimated travel time from 14 h 53 m 31 s, we obtain a time of 14 h 51 m 55 s. This time is very similar to the value of 14 h 52 m provided in the preliminary report on the earthquake written by Žujović and Stanojević [10] and, later, in the Registry of the Serbian Royal Academy [11]. Shebalin et al. [5] also reports this value (Table 1).

Table 1.
Seismological data from various sources for the 8 April 1893 earthquake. The table also shows estimations of MS and MW from observed intensities and supposed depths.
2.2. Data Collected by Serbian Authorities and Researchers
The Svilajnac earthquake of 8 April 1893, was the strongest earthquake that has occurred on the territory of Serbia in the past 300 years. Due to its strength and the macroseismic effects it caused on the entire territory of Serbia at the time, the Geological Institute of the Great School (predecessor of the University of Belgrade) held an assembly the next day, 9 April. At this assembly, it was decided: “1. that the Geological Institute of the Great School undertakes to collect and systematize all data on earthquakes; 2. that the Administrator of the Geological Institute writes a program for describing earthquakes, namely: (a) one for all literate Serbs and (b) for the telegraph authorities; 3. that J. M. Žujović and Đ. K. Stanojević goes, on behalf of the Geological Society, to examine the places affected by the earthquake in the valleys of the Morava and Resava rivers; and 4. that S. Urošević, Dr. Sv. A. Radovanović and P. S. Pavlović collect newspaper and private individuals’ data about the earthquake”. In addition, the Ministers of the Interior and the Economy were asked to hand over all official reports concerning the earthquake in Serbia to the Geological Survey for their use and to request a telegraphic report on the earthquake from all telegraph stations in Serbia according to the questionnaire which was prepared by the Administrator of the Geological Institute. The questionnaire contained the following questions: “1. what time of day, at which hour, minute, and, if possible, second did the earthquake occur?; 2. how was it felt, how long did it last, and how did it affect the telegraph station?; 3. did it affect telegraph equipment in any way?; 4. did it have any effect on the magnetic needle, how and for how long?; 5. did it affect the barometer, how and for how long?; 6. what was the weather like during the earthquake?; 7. during that period of time, was any peculiar sound heard apart from the noise of the house and the objects in it?”.
Thanks to the special efforts of the Ministry of the Interior, a significant number of telegraphic reports were received on 10 April 1893, just two days after the earthquake and on the second day of the Easter holidays. In light of the catastrophic effects of the main shock and the high frequency of aftershocks, and in order to engage as many individuals as possible in the task of gathering the data, a questionnaire with more detailed questions regarding the earthquake and its effects and consequences was created and sent to the public through the Serbian Newspaper on 14 April 1983 (Appendix A). Moreover, to obtain not only as many but also as many accurate answers as possible, the same questionnaire was sent to all teachers in Serbia. In this way, the Geological Institute received numerous data, even from the most remote parts of Serbia.
J. M. Žujović, the Administrator of the Geological Institute and professor of the Great School, Đ. M. Stanojević, also a professor of the Great School, and T. Milenković, head of the Ministry of Internal Affairs, began their visit to the most affected areas in the Morava and Resava basins on 10 April. The findings of their investigation were presented at the XX Geological Assembly on April 22 under the title “Preliminary report on the earthquake”, and the text of the lecture was published in the Serbian Newspaper [10] and, later, in the Registry of the Serbian Royal Academy, Book XXXII, pp. 81–86 [11]. S. A. Radovanović, Ph.D., the state geologist, made a thorough inspection of the entire region where the largest number of quakes had occurred—the area close to the Resava River, the areas around the cities of Jagodina and Ćuprija, as well as the area near the Morava river close to the city of Požarevac. The task of the state geologist, Mr. Radovanović, was to gather information on the direction of the main earthquake and its intensity according to the consequences. The findings of his fieldwork were presented on 23 May 1893, at the XXI meeting of the Geological Society. The text of that presentation under the title “Data on the direction and strength of the main earthquake in the Pleistocene region” was published in the Registry of the Serbian Royal Academy, Book XXXII, pp. 86–94 [11]. In addition to these two reports with field data on the main earthquake and its consequences in the valleys of Morava and Resava rivers (in detail at the sites visited and in summary for the entire area), the Geological Institute received, from all across Serbia, reports from telegraph stations, railway stations, private individuals, subordinate organizations reporting to the Ministry of Internal Affairs, reports to the Ministry of Economy, reports from teachers and priests, and newspaper reports.
Finally, the data from the major earthquake and smaller earthquakes were reviewed, processed, and then chronologically systematized by the date and time of occurrence and displayed in alphabetical order of the places from which they were recorded in the Registry of the Serbian Royal Academy, Book XXXII, pp. 6–35, 81–94 [11]. The data that the Geological Institute obtained from what was then known as Old Serbia (Kosovo and Metohija), Macedonia, Bosnia, Croatia, and Slavonia, Hungary, Bulgaria, Austria were all processed in the same way and published in the Registry of the Serbian Royal Academy, Book XXXII, pp. 95–104 [11]. Table 2 shows the distribution of data (reports, direct or indirect) on the main earthquake by country/region.
Table 2.
Number of data by country/region given in the Registry of the Serbian Royal Academy, Book XXXII, pp. 6–35, 81–94 [11].
Finally, for the additional two locations (two monasteries in Serbia), we found reports on the effects of the 1893 event on a webpage on the monasteries and churches belonging to the Serbian Orthodox Church (https://www.manastiri-crkve.com, accessed on 3 September 2023).
2.3. Data Collected by Hungarian Researchers
According to Schafarzik [8], the 8 April, Svilajnac earthquake was felt on the territory of almost all of then-Hungary and had a destructive character in its southern regions. This prompted the Earthquake Committee of the Geological Society of Hungary to begin collecting data on the consequences of the earthquake. As Schafarzik states, in addition to newspaper reports and reports from state institutions and private companies, hundreds of letters from citizens with information about the earthquake arrived at the address of the Geological Society of Hungary. Also, the Geological Society of Hungary received reports on the earthquake effects in Serbia through the vice-consul of the Austrian-Hungarian embassy in Belgrade (Mr. János Szentmiklósy), the director of the railway-mining company Serbia-Timok (Mr. Lajos József Hirsch), and a civil engineer from the Budapest railway company (Mr. Jiráček Jován), who was in Jagodina during and after the earthquake. However, after carefully examining the data/reports on the earthquake’s effects from various locations that are provided by Schafarzik [8], we found that most of them were de facto obtained from Serbian sources and were already mentioned in the Registry of the Serbian Royal Academy, Book XXXII [11], while only a dozen data related to the locations in the then Hungary were new.
The reports on the effects of earthquakes for slightly more than two hundred places from the territory of then Hungary, originally published by the Earthquake Committee of the Geological Society of Hungary in 1893, can be found in the monograph by Réthly [13]. The monograph also mentions some areas and places where the earthquake was felt, but the reports from those areas and places are not given. Country-wise data quantities are presented in Table 3.
Table 3.
Number of data by country provided by Rethly [13].
Finally, by reviewing Bendefy’s paper from 1970 [14], as well as daily press in Budapest (“Pester Loyd”) and Vienna (“Neue Freie Presse” and “Die Presse”) for a period of one month from the day of the main shock of 8 April 1893, we discovered additional reports, which were not mentioned in the monograph by Rethly [13].
2.4. Final Dataset
Table 4 provides the conclusive count of the number of earthquake reports used in this study for mapping macroseismic intensity and estimating earthquake magnitude and hypocenter depth, categorized by location and country. In Appendix B, we provide a list of all locations for which the macroseismic intensity of the 8 April 1893, Svilajnac Earthquake was assessed in this study. The list contains: (1) name of the town/village/monastery, (2) region/country, (3) selected source or sources from which the information about the effects of the earthquake was obtained for a particular site, (4) geographical coordinates, (5) the intensity values estimated in this study according to the EMS 98 scale [7], (6) whether or not ground fissures and liquefaction were noticed, and (7) the intensity values according to a previous study [4]. In Appendix B, we also provide maps of Central Serbia with the locations mentioned in Table A1.
Table 4.
Number of locations-inhabited places by country/region for which there are written reports on the effects of the 8 April 1893 Svilajnac Earthquake.
3. Macroseismic Intensity Maps of the 1893 Main Shock
Although one hundred and thirty years have passed since the Svilajnac earthquake of 8 April 1893, we have not been able to find a single cross-border map in the literature that shows the effects of this earthquake on the territories of today’s Serbia, Hungary, Romania, Bulgaria, North Macedonia, Bosnia and Herzegovina, Croatia, Austria, and Slovakia. In the following, we will first chronologically present and discuss each of the macroseismic intensity maps that we were able to find in the literature. After that, in Section 4, we will present the map we created by analyzing all of the gathered data (Table 4) using the EMS-98 scale.
3.1. 1893 Map by Schafarzik
Schafarzik’s map of the effects of the main shock from 1893 (shown in Figure 2) was formed on the basis of only a partial number of data obtained on the territories of then central and northern Serbia and then southern Hungary. In Figure 2, according to Schafarzik [8], the solid line is the border of the area of greatest destruction, and the broken line is the border of the area where the earthquake caused damage to buildings. The shape of the first zone is distinctly elliptical, with the center above the city of Jagodina (and slightly west of the village of Veliki Popović). The major axis of this ellipse runs in the direction NNW-SSE (following the course of the river Velika Morava), from Svilajnac in the north to Jovac in the south, with a length of about 45 km, while the minor axis has a length of about ½ that of the longer axis, in the Bagrdan–Medveđa direction. The shape of the second zone is also close to an ellipse, which is deformed towards the west and has a longer axis extending in the NE-SW direction (Kornia–Kraljevo). In reference to the center of the inner ellipse, the center of the larger ellipse is eccentrically shifted (~50 km) to the NE. The shape of the second zone indicates that the energy of the earthquake was directed mostly towards the north, slightly less towards the east and west, and the least towards the south.
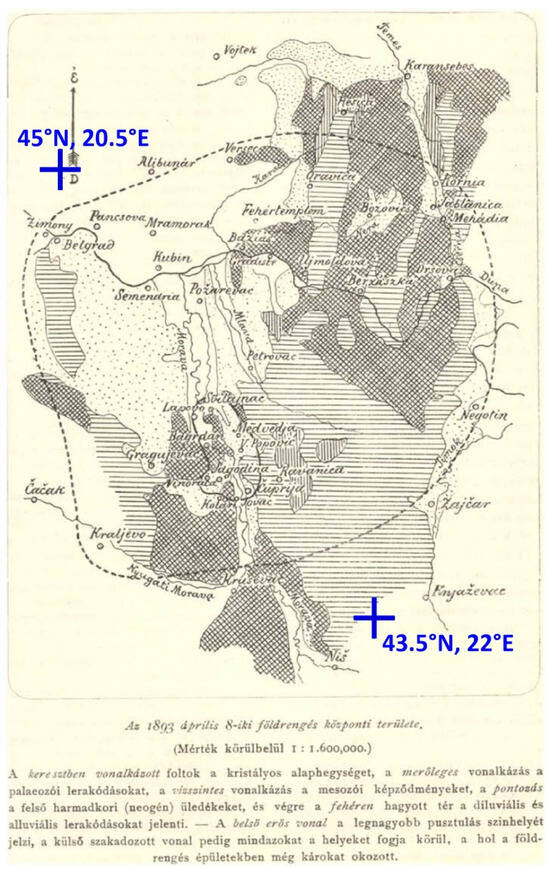
Figure 2.
The 1893 intensity map (adapted from Schafarzik’s 1893 paper [8]. In the following translation of the Hungarian text below the map: “The central area of the earthquake of 8 April 1893. (Scale of about 1:1,600,000.) The areas with cross-lines represent the crystalline base unit, the ones with perpendicular lines the paleozoic formations, the ones with horizontal lines represent the mesozoic formations, the dotted areas represent the upper Tertiary (neogene) sediments, and the white areas represent diluvial and alluvial deposits. Furthermore, the inner line indicates the area of greatest devastation, while the outer broken line encloses all the locations where the earthquake caused damage to buildings”. Adapted from Ref. [8].
3.2. 1952 Map by Rethly
Figure 3 shows the map of the effects of the main shock of 8 April 1893, compiled by Rethly [13]. The map shows an area from about 43° N to about 51° N latitude and from about 14° E to about 26° E longitude, which covers almost the entire territory of the then Austria–Hungary, part of the territory of the then Serbia (the central part and the northern part up to the then border with Austria–Hungary on the Sava and Danube rivers), the then territory of the northeastern part of Bulgaria, and the then territory of the southeastern part of Romania. According to the translation of the Hungarian text beneath the map in Figure 3 [13], the area where the earthquake produced destructive and damaging effects is depicted with cross lines and covers an area of nearly 11,000 km2. The area bounded by the dotted line indicates the territory where the ground shaking was accompanied by underground noises and is estimated to be around 23,000 km2. Finally, the thick solid line delineates an area of about 190,000 km2, inside which the earthquake was still noticeable.
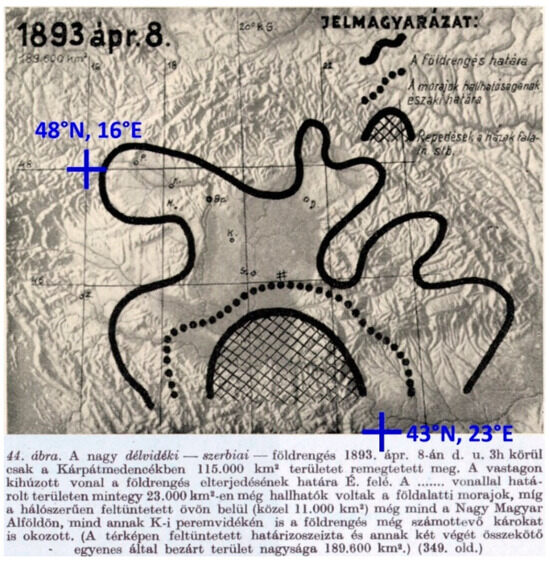
Figure 3.
The intensity map was adapted from Rethly’s 1952 monograph [13]. In the following translation of the Hungarian text below the map: “On 8 April 1893, at about 3 o’clock pm, in the Carpathian basin, the Great Southern–Serbia—Earthquake shook an area of 115,000 km2. The (outer) thick line is the boundary of the earthquake propagation to the north. In the area bounded by the dotted line, underground murmurs could still be heard on about 23,000 km2, while within the mesh-like zone (nearly 11,000 km2), the earthquake caused considerable damage both in the Great Hungarian Plain and its eastern periphery. (The area enclosed by the boundary line shown on the map and the line that could be created by connecting its two ends is 189,600 km2)”. Adapted from Ref. [13].
3.3. 1970 Map by Bendefy
The map based on Bendefy’s study is shown in Figure 4 [14]. As the author states, he derived the map by compiling Schafarzik’s and Rethly’s maps of the effects of the main shock of 8 April 1893. In Bendefy’s map, unlike the previous two maps shown in Figure 2 and Figure 3, the effects of the earthquake are expressed with macroseismic intensities but without any indication according to which macroseismic scale the intensity was evaluated. The author located the epicenter of the earthquake in Jagodina and rated the effects in the epicentral area with intensity I = VIII (“catastrophic”). Other intensities marked on the map are I = VII (“very strong earthquake”), I = VI (“heavily shaken area”), and I = V (“the limit of acoustic underground tones”). The thick solid line represents the limit of earthquake observations that can still be recorded accurately. From the shape of the isoseismals, we suggest that the energy of the earthquake was directed mostly towards the north and northwest, slightly less towards the northeast, significantly less towards the south, and the least towards the east and west.
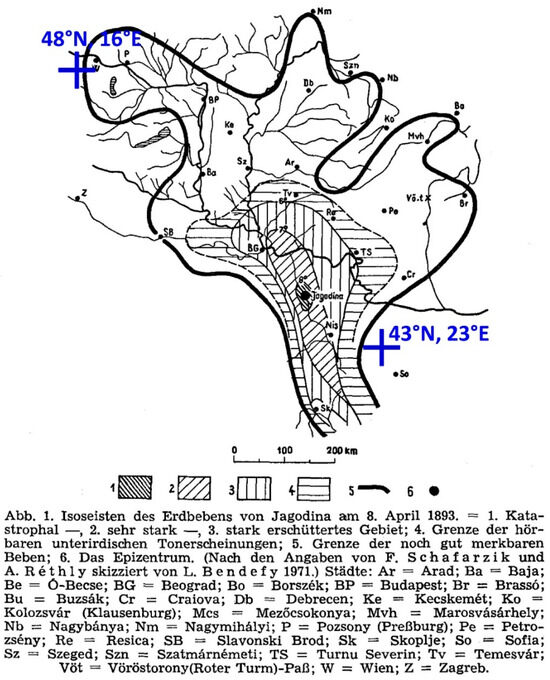
Figure 4.
The intensity map was adapted from Bendefy’s 1970 paper [14]. In the following translation of the German text below the map: “Isoseismals of the 8 April 1893 Jagodina earthquake. The numbers refer to the following description of earthquake effects: 1. Catastrophic; 2. Very strong; 3. Heavily shaken area; 4. Border of audible underground noises; 5. Border of the still noticeable shaking; 6. The epicenter”. Abbreviations for the cities in the area follow. Adapted from Ref. [14].
3.4. 1967 Map by Vukašinović
Figure 5 shows the isoseismal map of the main earthquake of 8 April, 1983, which was compiled by Vukašinović [4]. Vukašinović used the MCS (Mercalli-Cancani-Sieberg) scale to determine the macroseismic intensity based on the data provided in the Registry of the Serbian Royal Academy [11]. The map was created for only a portion of what was then central Serbia, based on about 200 of the 247 data points in then Serbia and only 3 of the 71 data points from the then neighboring countries—for the cities Pančevo, Vršac i Bela Crkva (for the last one, in the picture it is mistakenly written “Beli Manastir”). The range of rated intensities goes from I = IX to I = IV degrees. In contrast to Bendefy’s map (Figure 4), in which the earthquake epicenter is in the city of Jagodina (which is not even shown in Vukašinović’s map) with the epicentral intensity of I = VIII, Vukašinović places the epicenter northeast of Svilajnac in the I = IX zone. We have georeferenced and overlapped Vukašinović’s map with the digital map of Serbia to read the intensity values for the same locations for which we assessed intensity in this study (see Table A1 in Appendix B) and to estimate the (approximate) location of the earthquake epicenter according to Vukašinović [4]. From the georeferenced map, we have determined that the epicenter of the earthquake is near the village of Viteževo (coordinates 44.27830° N, 21.25451° E). These coordinates are close to the ones given in the 1982 seismological catalog of the Seismological Survey of Serbia [3] (see Table 1). We made an unsuccessful attempt to acquire the original data utilized by Vukašinović for the creation of his map from the Seismological Survey of Serbia. From the georeferenced map, we were only able to accurately define the locations for 115 out of the approximately 200 sites that can be seen in Vukašinović’s map (depicted by dots in Figure 5). In the next Section, we show how for some locations Vukašinović misassigned the intensity value to a different village with the same name. However, for all locations that fall into IX, VIII, and VII isoseismals in the Vukašinović’s map, we managed to define locations, and all these values are given in Table A1 together with the values for some locations (mostly the towns and cities shown in Figure 5) for which Vukašinović assigned intensities VI, V, and IV.
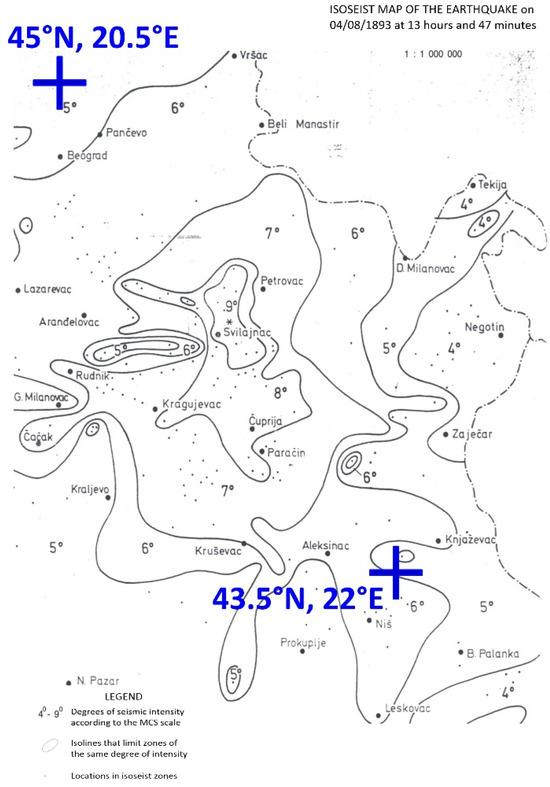
Figure 5.
The intensity map was adapted from Vukašinović’s 1967 monograph [4]—the Isoseismal map of the earthquake that occurred on 8 April 1893, at 1:47 p.m. (GMT). Adapted from Ref. [4].
Because Schafarzik [8], Réthly [13], and Bendefy [14] did not use familiar intensity scales to depict the effects of the 1893 earthquake, in Table A1, we are able to show only the 115 Vukašinović’s intensity values. Thus, these 115 intensity data are the only ones we have from previous studies.
4. Intensity Map Derived in This Study
For a thorough evaluation of intensity at a specific location, it is imperative that earthquake reports accurately depict the impact on living beings, objects, structures, and the natural environment. However, it is rare to find such well-written reports that cover every category of data about the effects of an earthquake. This is particularly true for reports on historical earthquakes, as they often come from a time when neither the knowledge nor training of regular people was at the needed level. As a result, most of the reporters of historical earthquakes mention only some of the data that are necessary and important for a reliable assessment of the earthquake intensity.
In Appendix C, we show a few examples of reports from the 8 April 1893, Svilajnac Earthquake for several locations in Serbia. By using these examples, we will demonstrate the significance of beginning each research study with original data rather than reusing the data interpreted by earlier researchers and thus introducing their possible mistakes into the current study.
Already with the first example for Aleksandrovac (a village 15 km south of the Serbian city of Požarevac), given in Appendix C under number 1, we can see from the first two reports what a bad and a good report mean for the same place. Based on the first report, the things we know are that “the earthquake occurred at 2:42 p.m.; it was felt from the eastern side and lasted approximately 40–45 s”. There is no information about the effects on people, objects, and the very building where the telegraph station was located. Neither information is given as to how the earthquake itself was felt: weak, moderate, strong, very strong, fierce, etc., except that it lasted about 40–45 s. While the second report is commendable, there is a minor issue with the data. Based on the given description that “many houses made of hard material cracked”, we cannot find out the type and extent of the cracks. The intensity could be I = VII (EMS-98: cracks in many walls) or I = VIII (EMS-98: large and extensive cracks in most walls). Therefore, we may estimate the intensity value as I = VII–VIII. At this juncture, we should mention that intermediate intensity values are pure artifacts that have been introduced to suggest a resolution that is not actually achievable, as pointed out recently by Panza [15]. In this Section and Section 7, as well as in Table A1 in Appendix B, we use intermediate intensity values for all locations for which the available information was not conclusive enough for us to reliably assess only one discrete value. However, in Section 6, we will use only discrete intensity values for our calculations and estimation of the 1893 earthquake’s seismological parameters.
The third report for Aleksandrovac, found in the Serbian newspaper “Odjek” from 13 April 1893 [11], contains information that “an unprecedented strong earthquake occurred at 2:40 PM in the west direction; lasted 40 s”. Similar effects of the main shock occurred in places around Aleksandrovac, for which we estimated intensities I = VII–VIII and I = VIII (for example, Žabari (VIII), Malo Crniće (VIII), Velika Plana (VII–VIII), Veliko Selo (VII–VIII)). In Vukašinović’s 1967 map, the estimated value of intensity was I = VI, but we found that it was attributed to the wrong location of another village with the same name (Aleksandrovac), which is located almost 100 km to the south, near the city of Kruševac.
The next example refers to the village of Vlaška (number 2 in Appendix C). This village is located between Mladenovac and Sopot (about 64 km NNW from the epicenter). Yet again, Vukašinović [4] erred by incorrectly assuming the location of the village of Vlaška. Namely, Vukašinović [4] assumed that the village of Vlaška is the one with the same name, only located east of Jagodina (about 19 km SE from the epicenter). Two pieces of information from the report helped us to determine which of the two villages is the right one. The first one is about the reporter, priest Petar Popović, who was the parish priest in the village of Vlaška near Mladenovac at the time of the earthquake. The second one, explicitly written in the report, is that the Vlaška church building was a wooden log cabin, in contrast to Vlaška near Jagodina, where there was no church at all. From the report, we can also learn that the brick houses were damaged: “My house, as well as that of many neighbors, was heavily cracked, and in many places, the chimneys fell” (EMS-98: chimneys fracture at the roof line, I = VIII), and that “church itself swayed in that direction”. Based on the quoted report, we adopted the value of intensity I = VIII. Vukašinović likewise assigns the intensity I = VIII, but to the wrong Vlaška village, while he evaluates the effects in the right Vlaška with I = VI, based on an unknown report. Another important piece of information in this report is that, unlike the brick houses that cracked and the chimneys fell from them, the wooden church did not suffer any damage.
The third example is given for Batočina (number 3 in Appendix C). Although it does not give a level for the strength of the earthquake, it very well describes the damage to the buildings: “Nearly all chimneys fell”; “Masonry cracked in almost all directions, bricks were falling out of the masonry in some places”; “Church unable to serve anymore”; “The school is closed the entire month of April, because the repairs are extensive”. Hence, for this location, we estimated the intensity with an interval value of I = VIII–IX degrees. Also, in the report for 8 April and the following report for 9 April, it is explicitly stated that “the direction is always from NW to SE” and that “the cracks from the first tremor were only widened by subsequent earthquakes”.
The fourth example refers to Lapovo (number 4 in Appendix C) and it shows that reports given for aftershocks can help us in a good assessment of the intensity of the main shock. Thus, apart from the information that “there was a strong earthquake” (I = V according to EMS-98), there is no other data on the basis of which we could estimate the approximate value of the intensity of the main shock. However, in the report from the railway station dated 13 April (the fifth day after the main shock), it is stated that “there was no damage” and that “the old cracks (from the main shock) are getting wider”. We can conclude that cracks did appear on the station building during the main shock, which leads us to rate the intensity in Lapovo as I = VII–VIII. Since the nearby locations were rated I = VIII and I = VIII–IX, we finally rated the intensity in Lapovo with I = VIII.
The same was the case with the location of Velika Plana, which is about 17 km north of Lapovo (see example number 5 in Appendix C). In the first report from the railway station in Velika Plana, after the main shock, there is no mention at all that the station building was damaged. We learn about its damage only from the report dated 22 April 1893, which says that “the station building is increasingly damaged”. Since the type and extent of the damage were not specified, we rated the intensity with I = VII–VIII.
The next-to-last example we give here refers to the village of Četereže (see example 6 in Appendix C), which is mentioned in the report for the nearby village of Brzohode. This report states, “at the church in Četereže, murky water flowed from the fountain for 2–3 s”. It is very difficult to determine the intensity with this information only. Bearing in mind that Četereže is located between the towns of Žabari in the west and Brzohode and Petrovac in the east, and as we have in the report for Žabari the information that “In Žabari the church is badly cracked and damaged, especially the vault and the north side under the tower” and in the report for Petrovac that “the vaults of the church were severely cracked”, it seemed logical that something similar happened with the church in Četereže. Finally, in the book “Church of the Municipality of Žabari” by Lazić et al. [16], p. 16, we found the following information: “somewhat later, as a result of the devastating earthquake that apparently occurred at the end of the 19th century, the original semi-round stone vault over the nave of the temple collapsed, while only a part of the semi-calotte above the altar apse remained”. This information helped us to estimate the intensity value for Četereže, as well as for the surrounding places, to be I = VIII.
The final example we provide is for the city of Jagodina (see example 7 in Appendix C) and may be rated as outstanding since it includes all the information required for a reliable assessment of the intensity value. In Appendix C, we present only several characteristic reports for Jagodina, while there are many more reports and descriptions of earthquake effects in Jagodina that can be found in Ref. [8], [11] (pp. 16, 17, 38, 85, 88), and other sources. Based on the compilation of data from all available reports, we rated the intensity value as I = IX. Before proceeding to analyze the 1893 earthquake’s effects in Jagodina, it is very important to understand that in 19th-century Serbia most private houses in rural areas were built as wooden log cabins (typically in mountainous regions) and wooden frames with infills. The infill was either made of thatch covered by mud mortar (the so-called “bondruk” houses) or of unburnt clay (the so-called “ćerpič”). Sometimes, the walls were built with woven brushwood with a clay infill (the so-called “čatmara” houses). In that historical period, only state-owned buildings and just a few private houses (belonging to the richest families) were made of brick.
The reports for Jagodina are crucial for the reevaluation of the intensities and magnitude of the 8 April 1893 earthquake. The fourth report states that “most of the brick buildings were badly damaged, and the building of the telegraph station almost entirely collapsed”. The fifth report states that “all state buildings and more important and beautiful houses are completely unusable. The schools and the church are all ruined”. The sixth report further states that “all the buildings made of hard material were significantly damaged”.
The last report on the effects of the 1893 earthquake in Jagodina was found in the paper by Schafarzik [8], and it was taken from the diary of construction engineer Mr. Jovan Jiráček, who lived and worked in Jagodina at the time of the earthquake. Mr. Jiráček mentions that “in particular, one-story houses with solid masonry were the most damaged”. This is very useful information, as it confirms that the behavior of solid brick buildings (mostly state-owned) was different than most of the private houses (of “bondruk” type). For example, the fourth report mentions that (a private, “bondruk”) “house was swaying”, while it was only the chimney that collapsed, and the “roof was disturbed”.
The reason for the better behavior and less damage to a wooden structure (log cabins and “bondruk” houses) than a solid masonry one (stone, brick, etc.) during the same earthquake is that the former has a lower mass (resulting in significantly lower inertial forces) and greater ductility compared to the latter. Radovanović and Petronijević [17] analyzed various building types in Serbia and came to similar conclusions as well. Surprisingly, good behavior of log and “bondruk” houses was also observed after the MW = 5.5 3 November 2010, Kraljevo earthquake, when a hundred-year-old “bondruk” building was left intact right next to a seriously damaged modern masonry building [18].
Based on the descriptions of the structural behavior and damages to buildings in Jagodina, it is obvious that the “bondruk” houses cannot be treated on the same level as the masonry ones. They are rather wooden structures and, therefore, cannot be classified as vulnerability class B but as vulnerability class D (or minimum C), according to the EMS-98 intensity scale [7]. The former director of the Seismological Survey of Serbia, Jelenko Mihajlović, came to similar conclusions at the beginning of the 20th century and mentioned this while describing his Modified Mercalli scale in the newspaper “Politika” from 18 May 1927, no. 6845, year XXIV, Belgrade.
Our reevaluated macroseismic intensities of 8 April 1893, Svilajnac earthquake are illustrated in Figure 6. The map was created on the basis of the currently available 538 data for various locations in 9 different countries (Serbia, Hungary, Romania, Bulgaria, North Macedonia, Bosnia and Herzegovina, Croatia, Austria, and Slovakia). The inset in Figure 6 shows a physical map in which a bounding square indicates the territory from which the reports on the manifested effects of the 8 April 1893, Svilajnac earthquake were observed. Our estimate of the location of the epicenter is also shown.

Figure 6.
Reevaluated macroseismic map of 8 April 1893 earthquake—this study.
The locations depicted in Figure 6 were given integer intensities (e.g., I = IX, VIII, VII, etc.) when we were confident that we had sufficient descriptive data to reach a reliable intensity assessment. When the data were such that we could not decide on one or the other intensity degree, we marked the intensity with an interval value (e.g., I = VIII–IX, VII–VIII, VI–VII, etc.). Finally, when there were reports with insufficient information to assign any intensity, or when it was data taken from the literature without an accompanying report on the effects of the earthquake, we also entered them into the map and marked them with an empty black circle, indicating an undefined intensity degree at those locations. In this way, the map shows all the locations where there were reports that the earthquake was felt.
Based on the estimated intensity values, we defined the isoseismal lines to separate the areas with different intensities. Figure 6 shows isoseismals for the intensity degrees IX to V. By a simple visual comparison of the macroseismic map with the relief map, our preliminary conclusion is that the shape of the isoseismals is defined by geological formations, namely by the spatial arrangement of the deep geological sediments that are present in the Pannonian plain and the rocks of the mountain regions (Dinaric Alps, Hellenides, Rhodopes, Balkan Mountains, and Carpathian Mountains). The latter (spatial distribution of mountains and plains, i.e., deep geological rocks and sediments) was, in our opinion, most probably the reason why the maximum effects of the earthquake were directed towards the northwest, north, and northeast, less towards the west and east, and least towards the south. The effects of the regional geological formations on the spatial distribution of different earthquake intensity degrees have recently been observed also for the strongest earthquakes in Vrancea (Romania) [19].
5. Assessment of the Fault Line, Dislocation Direction, and the Epicenter
Based on a large number of local reports on the direction of swaying of objects and walls [11], our preliminary conclusion is that the rupture propagation direction was SE-NW or SSE-NNW. Furthermore, in the reports from the epicentral and wider area where the earthquake buildings collapsed and were damaged, it is emphasized that the walls positioned in the SE-NW and SSE-NNW directions were dominantly damaged by oblique and cross cracks, while the walls perpendicular to them showed predominantly horizontal cracks and vertical cracks, as well as deflection or collapse in the SE-NW and SSE-NNW direction. Local reports also state that chimneys from houses and objects in houses fell predominantly in the SE-NW and SSE-NNW directions.
In the report of Žujović and Stanojević [10], which was written after visiting the most severely affected area in the basins of Morava and Resava rivers, it is stated that “the center of the earthquake is not one point, but a larger, mostly elliptical space between Morava and Resava. The big axis of that elliptical space runs in the direction NW to SE, almost parallel to the course of the Resava River north of Svilajnac, and its position lies closer to the Resava River. In length, that axis extends from Svilajnac to across the village of Beljajka (from NW to SE). The small axis, which intersects the large axis near the village of Medveđa, is approximately one-third the length of the large axis”.
The macroseismic map with the isolines of intensity degrees IX and VIII is shown in Figure 7 on the left. All locations where ground fissures and liquefaction were noticed are also depicted with a yellow symbol. We attempted to assess macroseismic intensity values using the ESI-2007 scale (Environmental Seismic Intensity Scale) [20,21] in addition to the EMS 98 scale. The ESI-2007 scale is based on coseismic environmental effects, both primary and secondary. Primary effects include tectonic uplift/subsidence and surface faulting. Secondary effects include liquefactions, landslides, rockfalls, displaced boulders, hydrological anomalies, ground cracks, etc. In Table A2 (Appendix D), we present an overview of the most important types of secondary coseismic environmental effects that have been observed at the sites that belong to the IX and VIII isoseismals (see Figure 7). We intend to provide a more thorough examination of the coseismic environmental effects of the 1893 earthquake in our future research. Here, we will just note that our preliminary estimates of the ESI-2007 scale [20,21] intensities match our estimates of EMS-98 intensities quite well for the first three isoseismals (IX, VIII, and VII).

Figure 7.
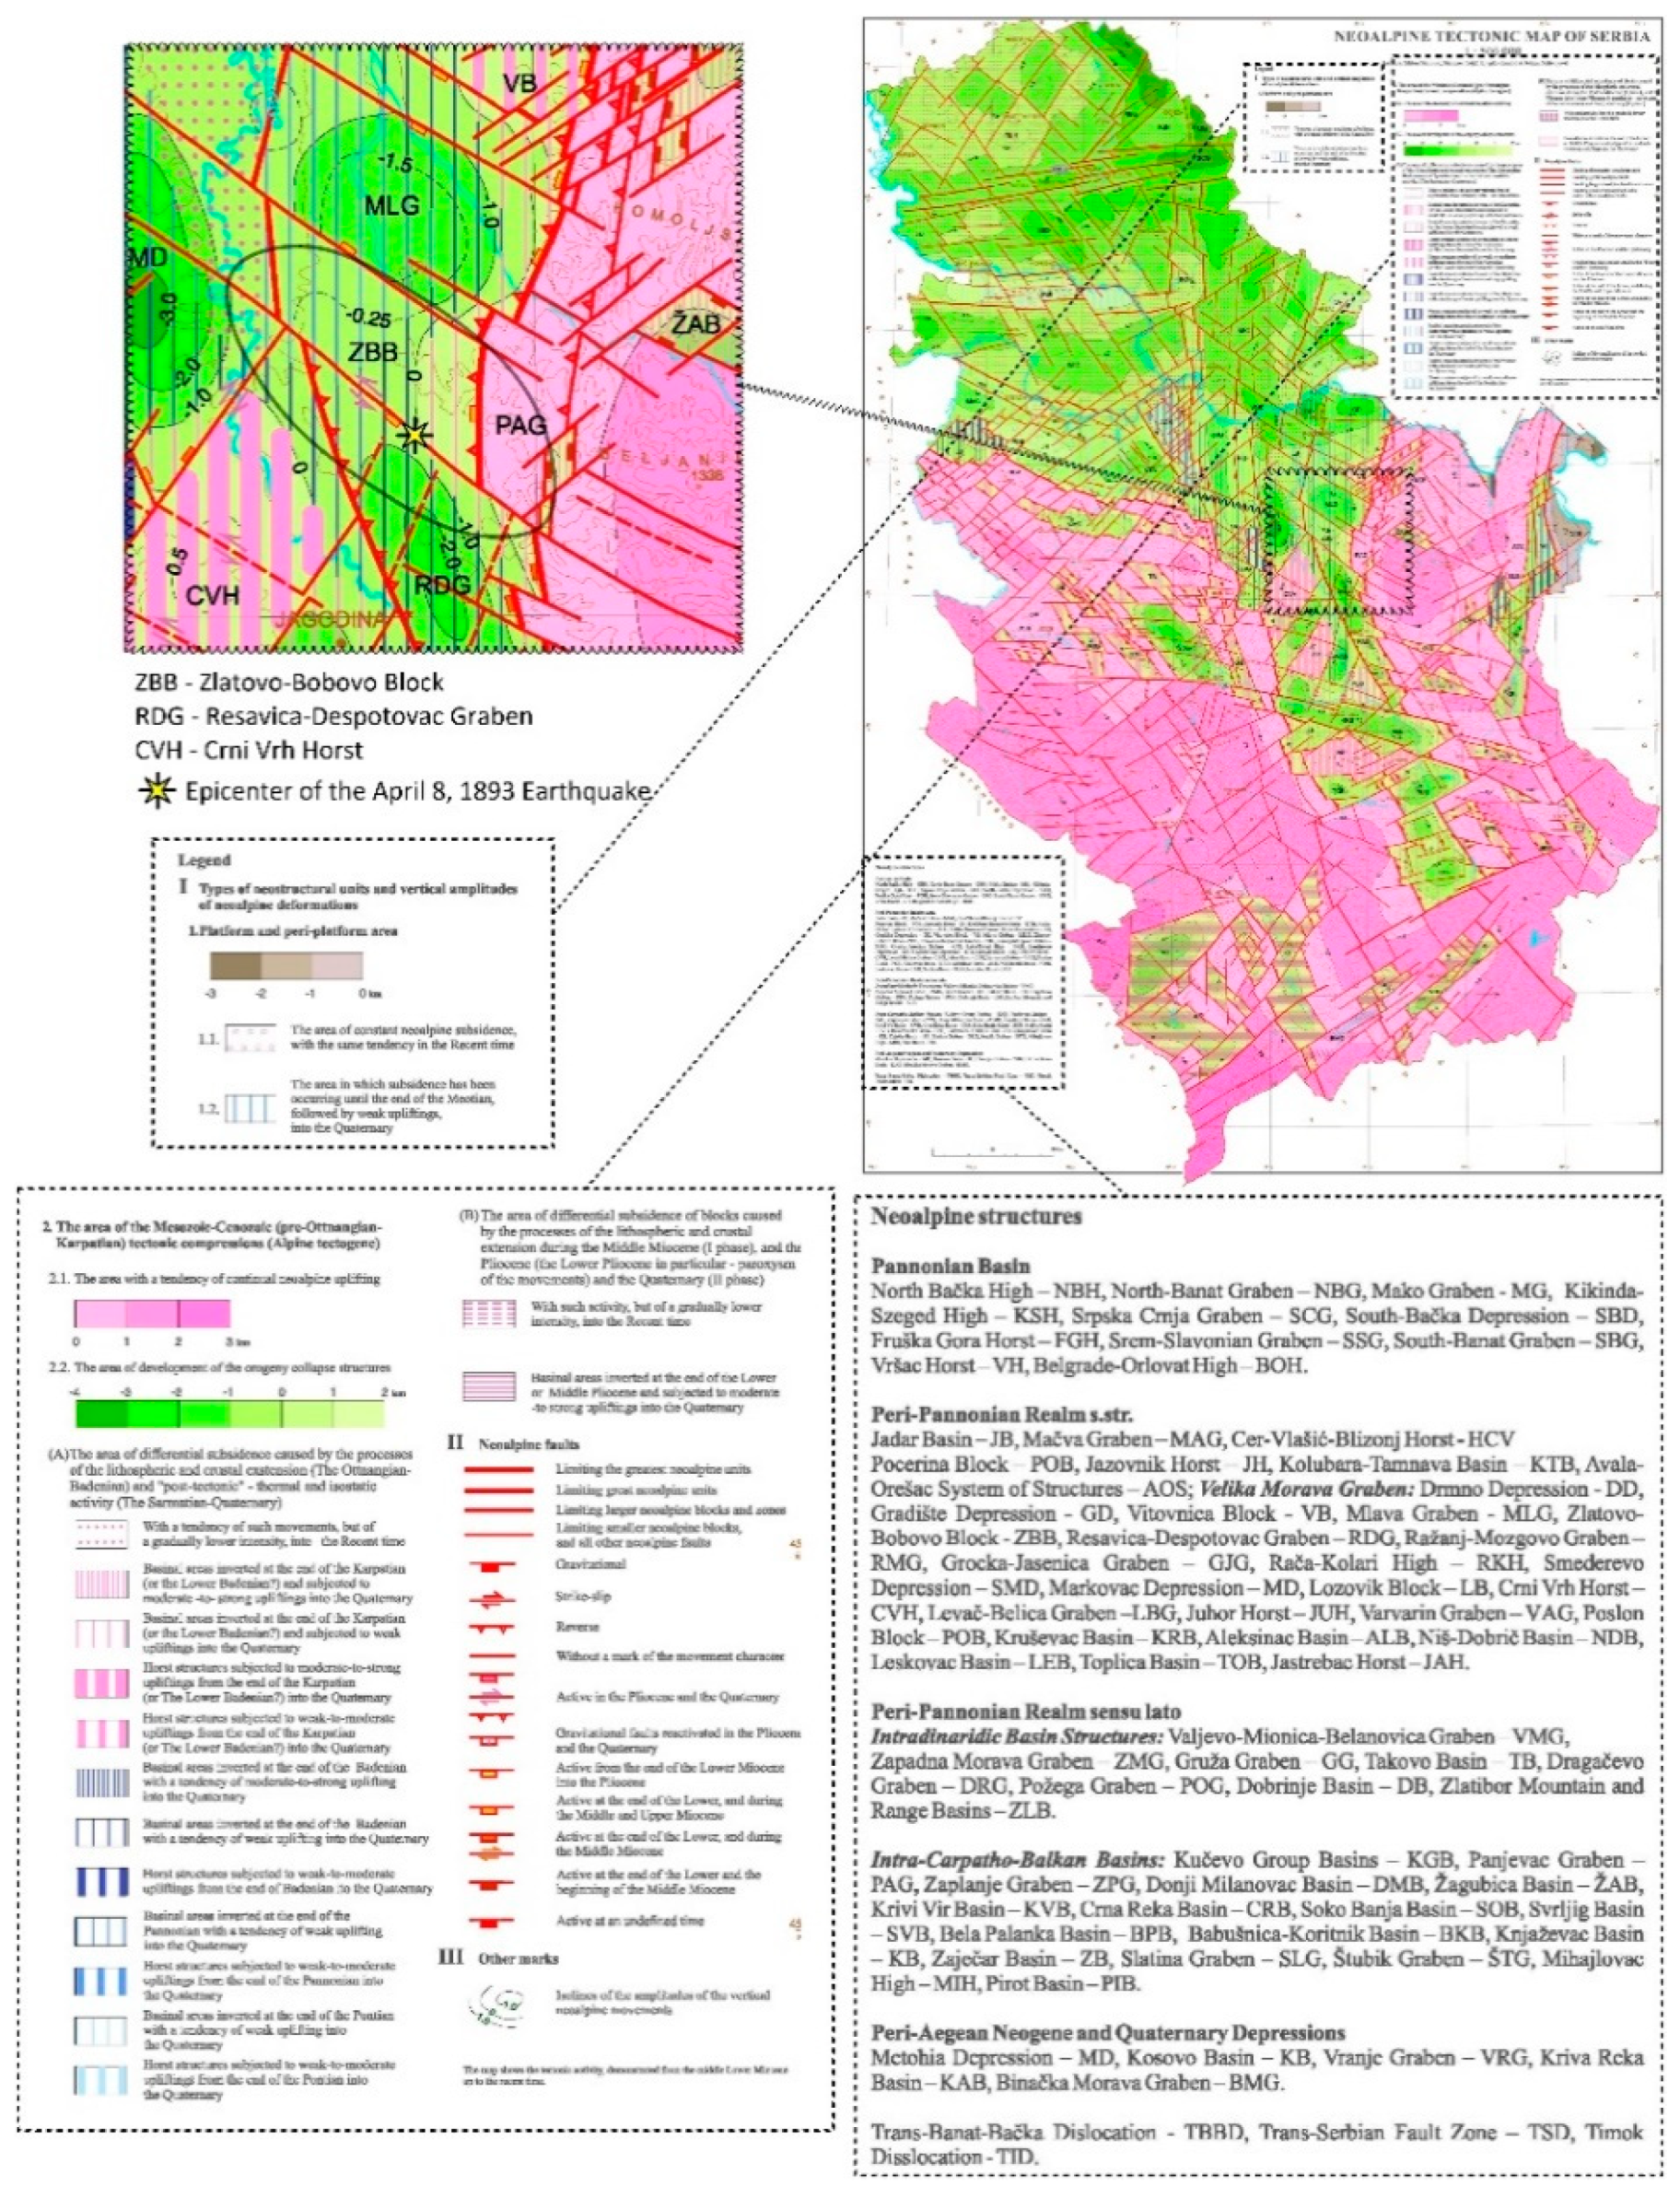
Macroseismic map of the 8 April 1893 Svilajnac earthquake and the isolines of degrees IX and VIII (left); the neotectonic map of the wider epicentral area (right, adapted from Ref. [22], see Appendix E) with the plotted isoline of degree IX (bounding the epicentral area) and the epicenter location (for the color code and more details please refer to Figure A2 in Appendix E and to [22]).
The neotectonic map of the wider epicentral area, the pleistoseist area (the area inside the isoline of degree IX), and our estimate for the location of the epicenter are shown on the right. The tectonic structure of the epicentral area is very complex and the possibility for the initiation of the earthquake can be attributed to at least two fault lines. The first one lies between the Zlatovo–Bobova Block (ZBB) and Resava–Despotovac Graben (RDG), and the other is between RDG and Crni Vrh Horst (CVH). In order to determine on which of the two fault lines the initial movement occurred (and in which direction), we superimposed our intensity map over the neotectonic map of Serbia—see Figure 7 (right side). Details about the geology and the seismotectonic features of the area under investigation can be found in [22,23], thus we will not go into too much depth here. We will just shortly note that many faults have been activated during the Quaternary in the bordering zone of the uplifted morphostructures of the Dinarides and the Carpathians and the Pannonian Basin, in the area of flexural transition from a thick crust towards a thinned one, i.e., from a rigid towards a weakened lithosphere [23]. Marović et al. [23] found that three factors were necessary for a model of Quaternary tectonic activity in the Serbian part of the Pannonian Basin and its southern margin: (1) compressive stress, which was generated in the border zone of the Adriatic plate and Dinaridic orogene; (2) crust thickness and lithosphere-wide rheological features; and (3) extension in the Aegean domain. In central Serbia, while reverse and sometimes normal faulting is also evident, strike-slip faulting predominates [22,23].
We can see in Figure 7 that the locations with maximum intensities I = IX and VIII are concentrated around two fault lines: the first, strike-slip, at the intersection of ZBB and RDG and the second, reverse, at the intersection of RDG and CVH. From north to south, the most severe consequences of the earthquake occurred in the villages of Subotica, Medveđa, and Veliki Popović. We positioned the epicenter about 15 km SE of Svilajnac on the first fault line. This is supported by the fact that the strongest foreshock on 13 March 1893, was felt most powerfully in Medveđa, close to the first of the two analyzed faults (the ZBB-RDG line). Hence, our estimates for the epicenter coordinates are 44.160° (44°09′36″) N and 21.354° (21°21′14″) E.
In Figure 7 (right side), we see that the major axis of the ellipse formed by the IX-degree isoline almost coincides with the fault line between ZBB and RDG, which suggests the conclusion that the earthquake occurred as a horizontal movement along the ZBB-RDG fault.
From the shape of the I = IX isoseismal, which has a symmetric elliptical shape, we cannot estimate the direction of the fault movement. However, isoseismals of degrees VIII and VII, which are elliptical in shape but with the SE-NW direction of the larger axis (see also Figure 6), indicate that the movement of the fault was in that direction. The eccentric position of the estimated epicenter in relation to the I = VIII and VII isolines indicates that the seismic energy was mostly directed north, northwest, and northeast due to the SE to NW movement of either ZBB or RDG tectonic blocks.
Finally, our preliminary conclusion is that the shape of the I = IX isoseismal is defined by the fact that the initial movement was along the ZBB-RDG fault and from SE to NW. Of course, we cannot be absolutely sure about this and plan to use alternative ways in our future studies to get to the geometry of the causative fault and to the main seismological parameters of the earthquake [24,25]. As the Kingdom of Serbia was relatively uniformly populated throughout its territory at the time of the earthquake, our preliminary conclusion is that the shapes of the I = VIII and VII isoseismals can be attributed to the effects of topography and deep geological site surroundings, as well as to the movement along the RDG-CVH fault, rather than to the presence or absence of inhabited centers.
6. Evaluation of Seismological Parameters from the Re-Evaluated Isoseismal Map
In the previous Section, we first estimated intensity values and showed them on a map, and then defined isoseismals of individual degrees of intensity Ii (see Figure 6). In this Section, we will use the areas Ai circumscribed by the isoseismal lines Ii to calculate the magnitude of the 8 April 1893 earthquake, using the following three macroseismic field equations:
- (1)
- the equation from UNESCO [12], developed for former Yugoslavia, Romania, Albania, Central, and Western Bulgaria, and Southwestern Turkey, “normal” foci—10 km < h < Ha (Ha—depth of the upper boundary of the asthenosphere channel, Ha = 50–100 km)
- (2)
- the equation proposed by Schebalin et al. [5], developed for Europe south of 47° N, also with the intensity degrees in MSK-64 scale:
- (3)
- the equation we developed specifically for this study, derived from a database of recent earthquakes in Serbia for which there were instrumentally determined epicenter locations, focal depths, earthquake magnitudes (MW), and the intensity values estimated according to the EMS-98 scale:
As for the hypocentral depth, h, we will use the equation suggested for Serbia by Sikošek et al. [3]:
where A2 and A3 (in km2/1000) are the areas circumscribed by the second and the third isoseismal lines (in our case, these are the isoseismal lines for intensities VIII and VII, respectively).
By using Equations (1)–(7), the magnitude of the analyzed earthquake is obtained as the median value for all analyzed isoseismal lines. The macroseismic magnitudes calculated by Equations (1) and (2) were then converted to MW using Scordilis’ [27] equations. The MS magnitudes calculated by Equations (3) and (4) were converted to MW using Markušić et al.’s [28] equations.
Table 5 shows the final estimates of both magnitude MW and hypocentral depth h (calculated using Equation (8)) for five different sets of the equivalent radii of isoseismal areas. The first two sets are those we found in the available literature ([12] and [5], respectively), while the last three represent our lowest (the most conservative), medium, and highest estimates. For the estimation of the isoseismals, we used only discrete intensity values. As for the interval intensity values shown in Figure 6 and Figure 7 and in Table A1, we defined our lowest isoseismal estimate (the fourth column in Table 5) using only lower interval values, our medium isoseismal estimate (the fifth column in Table 5) using the values we determined to be more likely (based on the intensity values assigned to nearby locations), and our highest isoseismal estimate (the last column in Table 5) using only higher interval values.
Table 5.
Magnitude of the 8 April 1893 earthquake, calculated by using five different estimates of isoseismal areas and three different empirical intensity-magnitude relations (Equations (1)–(7)). The hypocentral depth, h, is estimated by using equation of Sikošek et al. [3] (Equation (8)).
At this juncture, it is interesting to note that the area comprising locations with reported ground fractures and liquefaction (see Figure 7) is similar to our highest estimate of I = VIII isoseismal area, which is 4164 km2 and also extends 45 km to the north (Malo Crniće), 40 km to the south (Donje Vidovo), 25 km to the east (Petrovac na Mlavi), and 30 km to the west (Velika Plana) from the epicenter.
Furthermore, by comparing the neotectonic map and the spatial distribution of the largest estimated intensities (Figure 7, right side), the rupture length of the 1893 main shock can be estimated as approximately 36 km. Wells and Coppersmith’s [29] equation for strike-slip faults gives a magnitude range of MW = 6.62–7.18 when one standard deviation is taken into account and the mean magnitude estimate of MW = 6.9 for the surface rupture length of 36 km. This supports our conclusion that the value MW = 6.8, which we obtained for our medium estimates of isoseismal areas, is realistic for the 8 April 1893 event.
7. The 4 February 1739 Jagodina Earthquake
Once we have determined the key seismological features of the 8 April 1893 earthquake, we shall look into whether this was an isolated incidence or if there were other earthquakes in the past that could have been caused by the movement of the same tectonic blocks. In this Section, we will analyze the earthquake of 4 February 1739, which had approximately the same epicenter as the 8 April 1893 earthquake. Table 6 shows the seismological data, arranged chronologically, as given for this event in three different catalogs ([5], [6], and [2]).
Table 6.
Seismological data from various sources for the 4 February 1739 earthquake. The table also shows estimations of MS and MW from observed intensities and supposed depths.
The reasons for the non-existence, loss, or destruction of possible written sources about the effects of the earthquake of 4 February 1739, should be sought in the following facts. First, the earthquake occurred during the Austro-Turkish War of 1737–1739, when many cities, villages, churches, and monasteries in today’s Serbia were destroyed and looted. Second, simultaneous to the conflict, there was a plague epidemic, from which the people suffered greatly, as well as a great famine, which added to the people’s daily struggle for survival. As a result, in a practically empty and devastated land, few people thought about the earthquake and described its effects.
The only information we have managed to find so far about the 1739 earthquake effects in what was then Serbia is for the Dokmir monastery (Appendix F, example number 1). The Dokmir monastery is located about 15 km northeast of the town of Valjevo. We found this information in the book “Travels in Serbia” from 1902 [30]. In 1826, the author of the book, Mr. Joakim Vujić, visited churches and monasteries in Serbia. On page 65 of his book, Vujić mentions that “the church was heavily damaged in an earthquake on January 4, 1739”. The text does not say what kind of damage the temple of the Holy Virgin suffered, but it gives information about the money for the repair and the duration of the repair, which was 39 days (“The priest gave 344 forints for the reconstruction. It started on Bright Monday and ended on Ascension Day”). Please note that in the Eastern Orthodox Church, Bright Monday is the name of the first Monday after Easter, while Ascension Day is celebrated exactly 40 days after Easter. The only dispute in the text is the date and month in which the earthquake occurred. In our opinion, number 2 was omitted by mistake before number 4 since the earthquake occurred on 24 January according to the old calendar, or 4 February, according to the new calendar. However, as we will see from the records from the Serbian monastery of Ravanica (Vrdnik), which at that time was located on the territory of Austria, the date of the earthquake was definitely 24 January 1739, according to the old (Julian) calendar.
Considering that the Ravanica (Vrdnik) monastery, which is at a greater distance (about 165 km) from the epicenter of the earthquake than the Dokmir monastery (about 115 km), reportedly suffered damage from the 1739 earthquake, we can assume that the damage to the Dokmir monastery was at least of the same level. That is why we can take I = VI–VII as a minimum intensity range for the Dokmir monastery, the same as the one we estimated for the Ravanica (Vrdnik) monastery. With the same range of I = VI–VII, we assessed the effects of the 1893 earthquake in nearby Valjevo, which was located about 117 km from the epicenter of the 8 April 1893 earthquake, and during which the church in Valjevo was damaged.
The following two reports about the 1739 earthquake (Appendix F, under serial number 2) are for the Ravanica (Vrdnik) monastery, which is located on the Fruška Gora Mountain. We found these records in the book: “Old Serbian Records and Inscriptions” from 1903 [31]. The first contains the information that: “everything in the temple shook, and it seemed to us that everything was collapsing from the many shaking; the earth shook three times, and we all ran outside for fear of a lot of destruction”. The second report confirms the date and time of the event, as well as that there were several aftershocks and that during the mainshock: “all the people fell with their faces to the ground for fear of God”. Based on these two reports, we assigned the interval value I = VI–VII for this location.
For the same monastery, there is information regarding the harmful effects of the 8 April 1893 earthquake, which we found on its website: “Renovations of the church and the lodge were recorded in 1885, as well as in 1898, after being devastated in the earthquake (1893)”. We can infer from this short text that the church was damaged in the earthquake of 8 April 1893, but there is not enough data to assign a particular value of intensity. We believe we can assign a possible interval value of I = VI–VII for this location.
In the report from the Paragovo Forest (Appendix F, also under serial number 2), which is also located on the Fruška Gora mountain, we can learn that the earthquake was felt by a monk who happened to be in the forest in the vicinity of the village of Paragovo, about 5.5 km NE of the monastery (Rakovac) where he lived. From this information alone, we cannot rate the intensity value. Here, we should note that the reporter was in a forest during the earthquake and that for Ravanica (Vrdnik) monastery, which is only about 10 km southwest of Paragovo, we assessed the effects of the earthquake with I = VI–VII.
The third report (Appendix F, example number 3) we managed to find is for the Savina monastery, located near the city of Herceg Novi in today’s Montenegro: “the earth shook in the month of January on the 24th day at noon or in the afternoon”. From this short text, we can estimate the intensity at the location of the Savina monastery with I = IV–V. It should be noted that this monastery is located 288 km SW from the epicenter of the 1739 earthquake. Unfortunately, we have not found any records from this monastery or nearby villages or cities reporting the 1893 earthquake to compare the effects of the 1739 and 1893 earthquakes.
Four reports from Timișoara, Romania, are given in Appendix F under serial number 4. The first, the third, and the fourth contain only the information that there was a strong earthquake in Timisoara. However, in the second one, we find that the earthquake was: “violent enough that the clock bell on the Jesuit tower struck the hammer rising above it, and distinct chimes were heard. The tremors lasted so long that the “English salute” (a church song) could be prayed almost twice”. The reports for the same city (Timișoara) after the 1893 earthquake were described in more detail and also included information about the “cracks on the walls of the railway guardhouse”. We finally rated the 1739 earthquake intensity in Timișoara with I = VI and the 1893 event with an interval value of I = VI–VII.
The last example is given for Pécs, Hungary (Appendix F, records numbered 5). In this report, we find that “the two huge tremors either broke or at least damaged the walls and chimneys of the convent and farm buildings.” Therefore, we used an interval value of I = VI–VII to estimate the intensity. We do not have a report from Pécs for the 1893 earthquake, but we do have reports from the nearby cities of Mohács, Pécsvárad, Nádasd, and Rácpetréről, which we rated as I = VII.
In summary, a comparison of the rated intensities for the 1739 and 1893 earthquakes is as follows. The intensity range for the Ravanica (Vrdnik) monastery from both earthquakes is I = VI–VII, as well as for the Dokmir monastery (for which we use a report in the nearby Valjevo to make a comparison). For Pécs in Hungary, we estimated the intensity of the 1739 earthquake as I = VI–VII. For Pécs there are no data for the 1893 event, however for nearby Pécsvárad, Nádasd, and Rácpetréről the intensity of the 1893 earthquake was rated as I = VII. Paragovo Forest, 10 km from the Ravanica (Vrdnik) monastery, has no comparisons with the Savina Monastery in Montenegro. For Timișoara, Romania, the effects of the 1739 earthquake are estimated with I = VI, while the intensity of the 1893 earthquake was estimated within the interval value of I = VI–VII.
In Figure 8, we show a map with the estimated intensity values for the locations for which we found reports on the effects of the earthquake of 4 February 1739. We also show the isoseismals and the epicenter location from Figure 6, assessed for the earthquake of 8 April 1893.
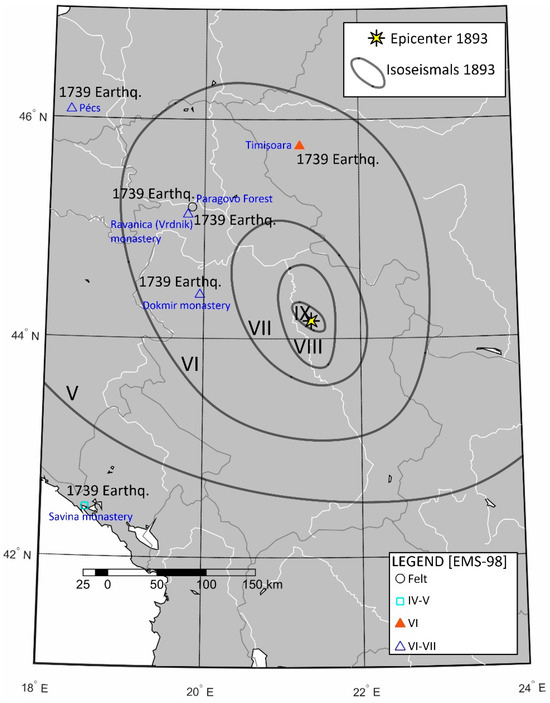
Figure 8.
Map with the estimated intensity values for the locations for which we managed to find reports on the effects of the earthquake of 4 February 1739. The isoseismals and the epicenter location assessed in this study for the 8 April 1893 earthquake (see Figure 6) are also shown.
As shown in Figure 8, for all locations, the assessed intensities for the 1739 earthquake agree with the corresponding isoseismals calculated based on the data from the 8 April 1893 earthquake. We may conclude that the consequences of both earthquakes were quite similar and that the earthquake of 4 February 1739, most likely had the same size, focal depth, and epicenter location as the earthquake of 8 April 1893.
8. Conclusions
For a reliable assessment of seismic hazards in a given area, it is crucial to have a thorough understanding and accurate quantification of historical earthquakes. However, all that is usually known about earthquakes that occurred prior to the instrumental period is contained in qualitative descriptions of their effects on people, objects, buildings, or nature. These effects are then quantified using various intensity scales. Consequently, it is essential to accurately evaluate the macroseismic intensities of significant historical earthquakes since it is from these (intensities) that the seismological parameters required for the analysis and computation of the seismic hazard for the place of interest, country, or region are determined.
The two strongest earthquakes in Serbia in the past three hundred years occurred in the valleys of the Morava and Resava rivers, the first on 4 February 1739, and the second on 8 April 1893. According to various earthquake catalogs prior to 2013, the 1893 event had a magnitude of 6.5 or 6.6. However, in the latest (2013) earthquake catalog of the Seismological Survey of Serbia [2], this earthquake was assigned a magnitude of MW = 5.8. However, there is no explanation provided for this choice. In the past ten years, after going through numerous published reports, classic literature and ancient texts, chronicles, newspaper articles, scientific papers, monographs, and macroseismic maps, we managed to compile a database of 538 written reports on the effects of the great 8 April 1893, Svilajnac earthquake. After a careful review and analysis of the compiled database, we came to the conclusion that the pleistoseist area of this earthquake was 531 km2, corresponding to I = IX° EMS-98. The next isoseismal area (I = VIII° EMS-98) closely corresponds to the area encompassing locations with recorded ground fractures and liquefaction, which is roughly 4000 km2 and which extends 45 km from the epicenter to the north (Malo Crniće), 40 km to the south (Donje Vidovo), 25 km to the east (Petrovac na Mlavi), and 30 km to the west (Velika Plana). As for the boundaries of the total area where the 1893 earthquake was felt, the data show that it was felt on almost the entire territory of former Yugoslavia (there is no data only from Montenegro and Slovenia), whose total area was ~250,000 km2. It also affected the territory of all of modern-day Hungary, with an area of ~93,000 km2, and all of Transylvania and Wallachia (parts of today’s Romania with a total area of ~238,000 km2). In Wallachia, Rethly [13] mentions the cities of Turnu Severin, Calafat, Craiova, Bechet, and Corbia; the earthquake was probably also felt in Bucharest because it was felt in Brašov, which is 100 km north of Bucharest. The earthquake was probably also felt in other cities in Wallachia because it was felt even as far as Ruse on the Danube in Bulgaria. It was most likely felt on the half the territory of Bulgaria, whose total area is 100,000 km2, in parts of Slovakia, whose total area is 49,000 km2, and parts of Austria, whose total area is 84,000 km2. This all adds up to at least 700,000 km2, which is consistent with our estimations of its intensity. Our lower and upper bounds for the areas where the earthquake was at least felt are 625,000 and 837,000 km2, respectively.
The obtained results of the analysis of the 1893 earthquake are as follows: (1) epicentral intensity, I0 = IX EMS, (2) estimations of the moment magnitude and focal depth based on the observed intensities, MW = 6.8 and h = 13 km, respectively, and (3) the epicenter coordinates, 44.160° (44°09′36″) N and 21.354° (21°21′14″) E (about 15 km SE of Svilajnac, between Subotica and Medveđa villages).
By comparing the reports from the 1893 and 1739 earthquakes for same or nearby locations, we have shown that the effects of both earthquakes at those locations were very similar. Our conclusion is that the earthquake of 4 February 1739, had approximately the same magnitude value, focal depth, and the location of the epicenter as the earthquake of 8 April 1893. This points to a preliminary estimation that the Svilajnac earthquakes with magnitudes greater than 6.5 (the lowest estimate in Table 5) have a recurrence interval of approximately 150 years. This indicates that an earthquake of a magnitude greater than 6.5 could occur in the Morava-Resava valley around 2040.
Author Contributions
Conceptualization, M.I.M.; methodology, M.I.M. and B.Đ.B.; formal analysis, M.I.M. and B.Đ.B.; investigation, M.I.M. and B.Đ.B.; data curation, M.I.M.; writing—original draft preparation, M.I.M.; writing—review and editing, M.I.M. and B.Đ.B.; visualization, B.Đ.B. All authors have read and agreed to the published version of the manuscript.
Funding
This research received no external funding.
Data Availability Statement
The original contributions presented in the study are included in the article, further inquiries can be directed to the authors.
Conflicts of Interest
The authors declare no conflicts of interest.
Appendix A. Questionnaire for Data Collection, Published on 14 April 1893
In order to engage as many people as possible in the task of gathering the earthquake-related data, the following questionnaire was created and sent out immediately through the Serbian Newspaper, Vol. 69, Page 319, 14 April 1893.
“Sir, (1)
For the study of the earthquakes that shook the Serbian land yesterday and today, as well as those that could yet happen, it would be very useful if you could and would answer some or all of these questions:
- What is the name of the place (municipality and county) where you felt the earthquake or learned about it?
- On what day, at what hour, and if you can tell, at what minute and second did the earthquake happen? Do you also know how big the difference was then between the clock of the telegraph, railway, and generally regulated clock and the one that recorded the time of the earthquake?
- Where were you when you felt the earthquake: in the field or at home, in the barn near the ground, or on which floor or in the basement? What were you doing at the time, how did you feel it, and did you experience any injury?
- What type of soil did the shaking occur in—rock, sand, clay, or marsh?
- How many earthquakes were there, at what intervals, and how long did each one last?
- Was the earthquake felt as a thrust from below to above, or from the side, or as a turning point, or as a tremor? If there were several earthquakes, were they all of equal size and of the same type, or were they different in strength, duration, and manner? Was the quake equally strong all over the rural or municipal area or not?
- From which side did the quake come, and where did it go?
- Was it only the shaking of the house and the household items, or was there also some natural sound and rumbling, and what did it resemble; was it heard before and after the real earthquake, and does the whole earthquake resemble any other phenomenon?
- What happened as a result of the earthquake, and was there any major damage; did the houses collapse and how much; did any partial collapse occur; which walls cracked and in which direction; in which direction did the cracks in the ground open; how long, wide and deep are the cracks in the ground; and did anything emerge from them?
- Did any household items move or fall, and if so, in which direction? For example, did any lamps, pictures, or icons sway? Did the bells automatically ring?
- Did the water in the springs and wells remain unchanged? Did the water in the ponds move during the earthquake, and how?
- Was there any effect of the earthquake on the animals, the air, and the weather?
- What did you learn from your countrymen about the earthquake in your area? Do you know someone who would be happy to answer these questions about earthquakes?
- What have you heard from older people about earthquakes in your area?
Please address your answer to the Geological Institute of the Great School in Belgrade, which is assigned to collect all the data about these earthquakes and will be very grateful if you answer even just a few questions. I am also asking you not to try too hard to answer all the questions, but to write only about what you know and what serious people have told you.
On Easter 1893, in Belgrade,
J. M. Žujović, Professor and Administrator of the Geological Institute of the Great School”.
(1) We ask all Serbian newspapers to print this advertisement, and all literate Serbs to respond to it.
NOTE: In addition, all editorial offices of Serbian newspapers were asked to send to the Geological Institute those issues, in which there would be any reports about the earthquake; but the Geological Institute did not receive as much and the kind of support from this side as it had hoped.
Appendix B. Data on All Locations for Which the Macroseismic Intensity Was Assessed
Table A1.
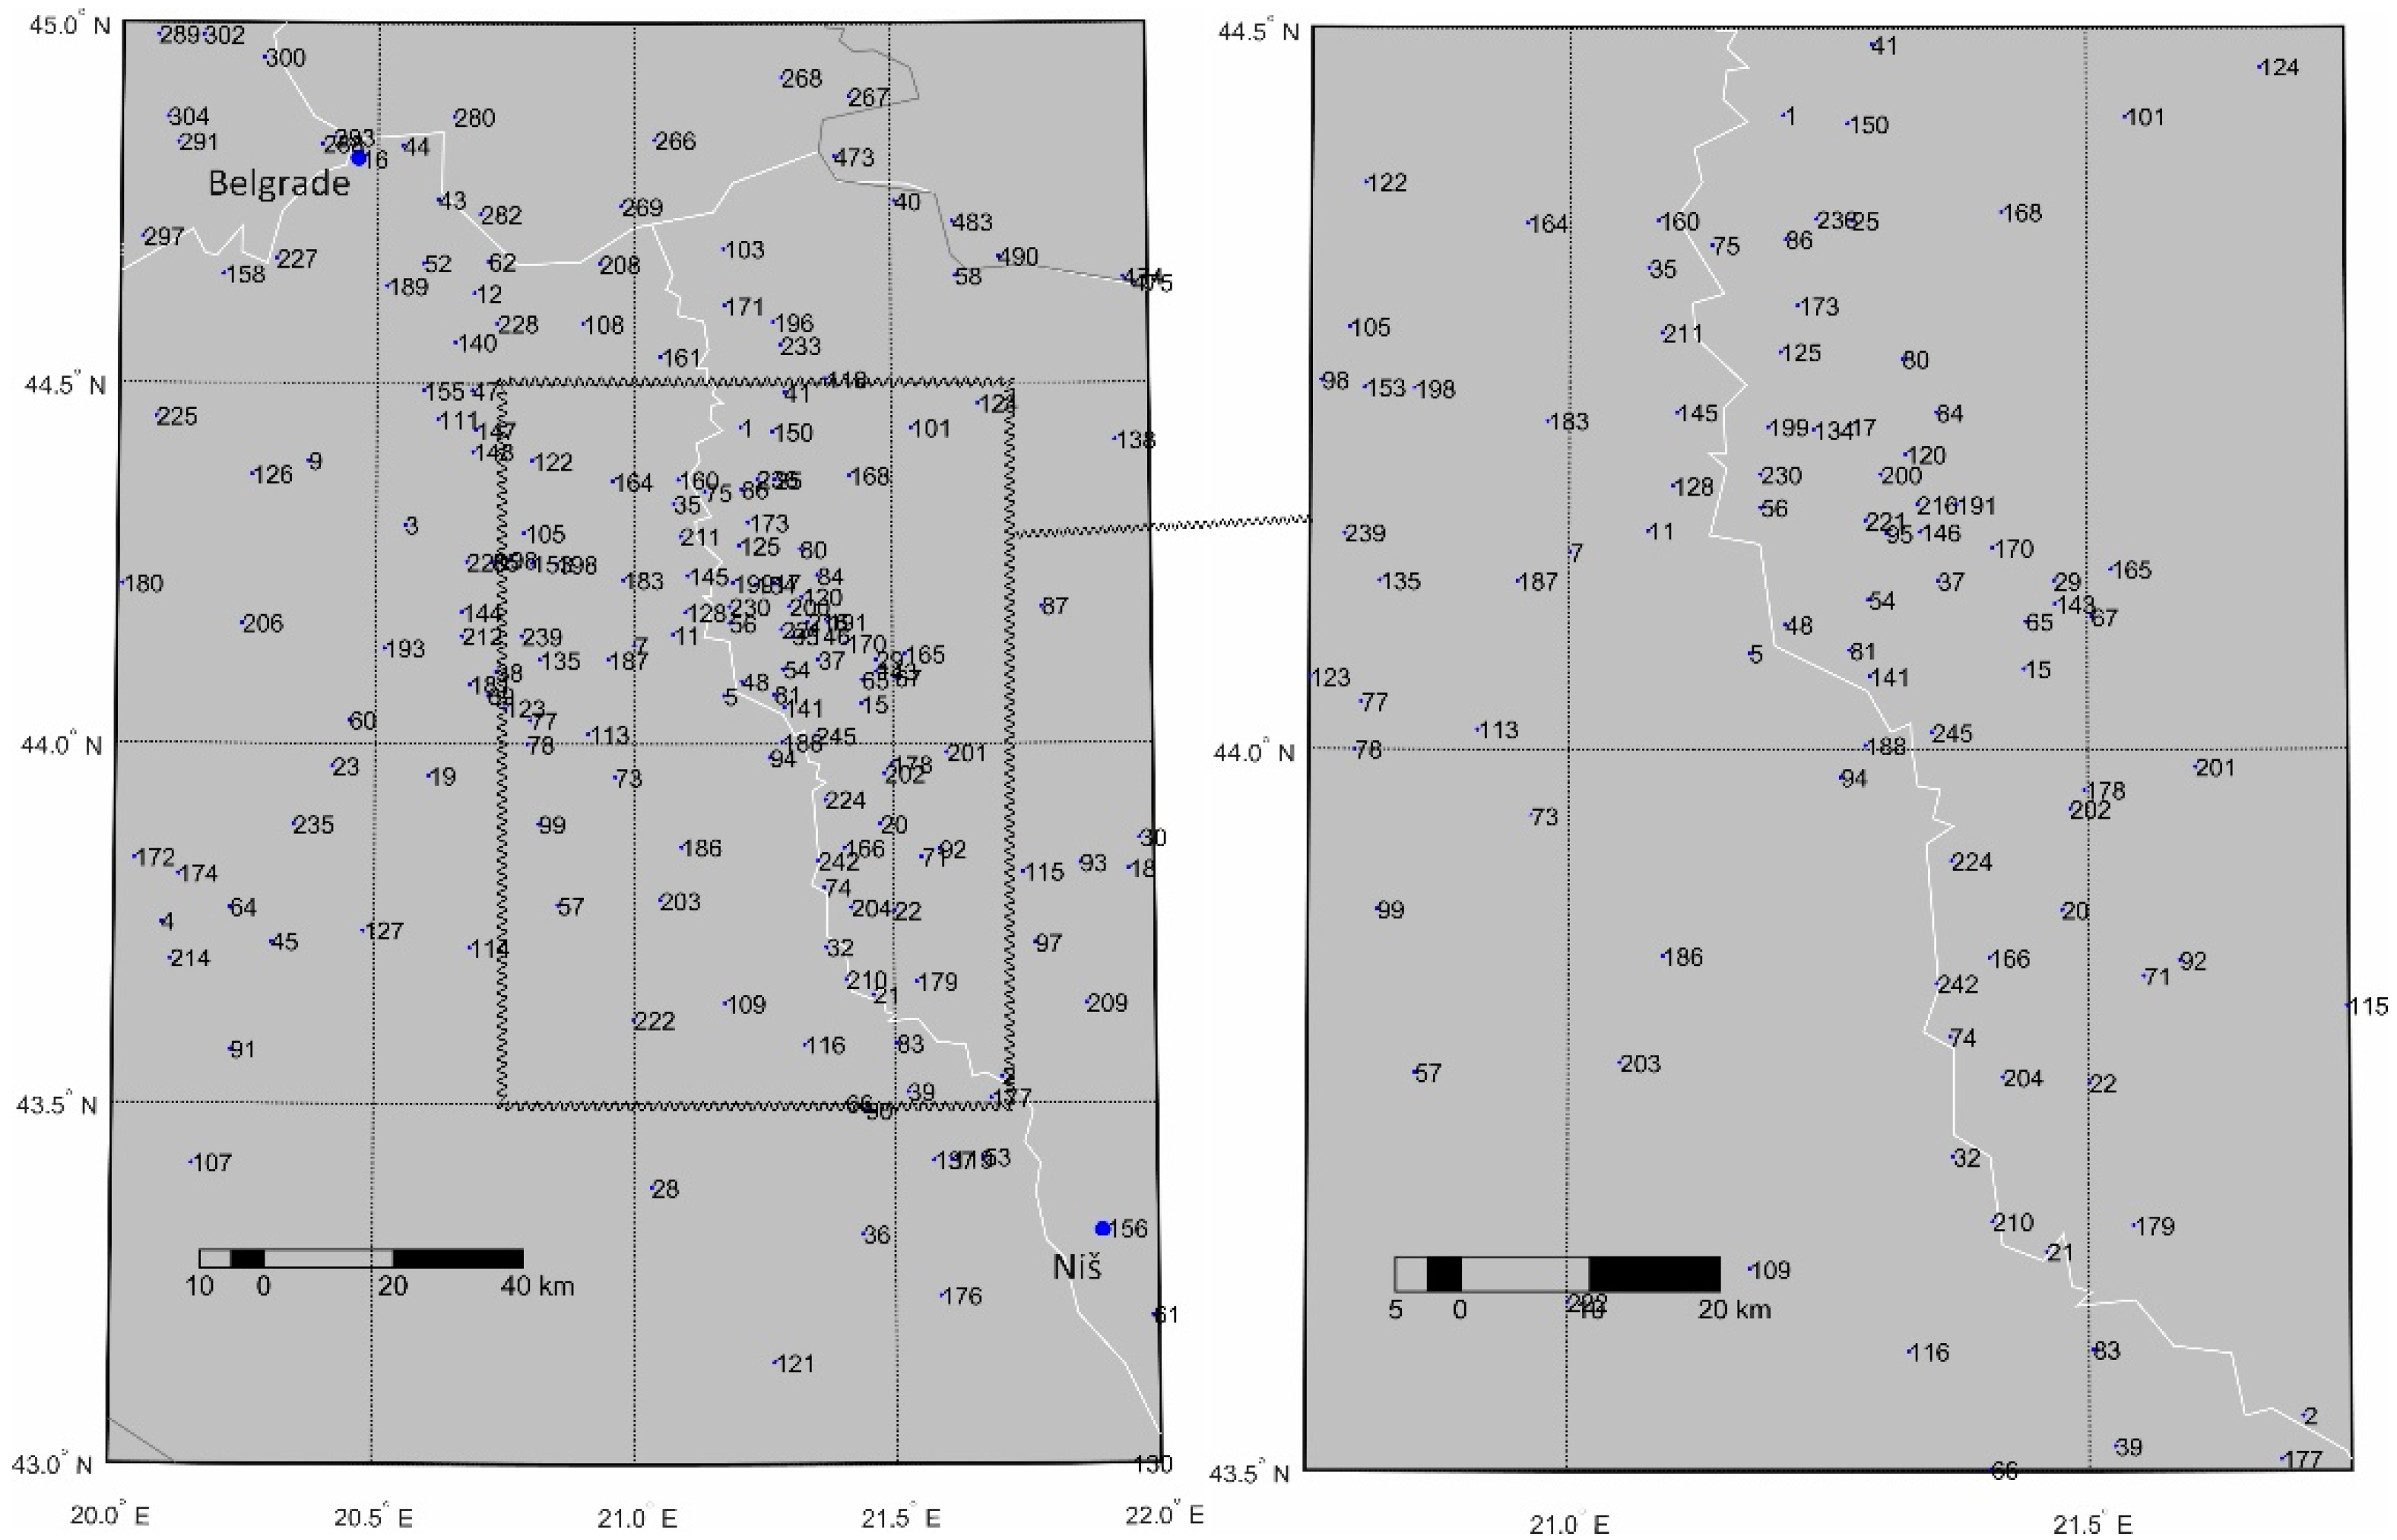
List of all locations for which the macroseismic intensity of the 8 April 1893 Svilajnac Earthquake was assessed in this study. The list contains the following information: (1) name of the town/village/monastery, (2) region/country, (3) selected source or sources (SRA1896 [11], RET1952 [13]; BEN1970 [14]; NFP1893 [Newspaper “Neue Freie Presse”—a Viennese newspaper that existed between 1864 and 1939]; DPR1893 [Newspaper “Die Presse”—a Viennese newspaper that exists since 1848]; PLD1893 [Newspaper “Pester Loyd”—a German-language daily newspaper from Budapest, Hungary that existed between 1854 and 1945 (the publication resumed in 1994)]; SOC2024 [a webpage of the Serbian Orthodox Church on its churches and monasteries—https://www.manastiri-crkve.com (accessed on 3 September 2023)]) from which the information about the effects of the earthquake was obtained for a particular site, (4) geographical coordinates, (5) the intensity values estimated in this study according to the EMS 98 scale [7], (6) whether or not ground fissures and liquefaction (GF&L) were noticed (marked with “X”), and (7) the intensity values according to Vukašinović [4].

Appendix C. Examples of Reports from the 8 April 1893 Svilajnac Earthquake
Appendix D. Secondary Coseismic Effects for the Sites Inside IX and VIII Isoseismals
Table A2.
bserved types of secondary coseismic effects [20,21] (marked with “X”) for the sites that fall into this study’s estimates of the IX and VIII isoseismals (see Figure 7).
Appendix E. Neotectonic Map of the Wider Epicentral Area

Figure A2.
Neotectonic map of the wider epicentral area. Adapted with permission from Ref. [22]. Copyright 2007 Serbian Geological Society.
Appendix F. Comparison of Reports Describing the Effects of the 8 April 1893 and 4 February 1739 Earthquakes for the Same or Very Close Locations
References
- USGS. Earthquake Catalogue for all Earthquakes with Mw ≥ 3.5 in the Period between 1900 and April 2024 for the Geographic Region between 41° N and 47° N, and 18° E and 24° E; United States Geological Survey: Reston, VA, USA, 2024.
- RSZS. Catalogue of Earthquakes Mw ≥ 3.5 of the Republic of Serbia; Seismological Survey of Serbia (RSZS): Belgrade, Serbia, 2013.
- Sikošek, B.; Vukašinović, M.; Nedeljković, S.; Krstanović, M.; Tešić, V.; Mamula, L.; Knežević, V.; Banjac, N. Detailed Seismic Regionalization of the Territory of the Inter-Municipal Community of Kraljevo (in Serbian: Detaljna Seizmička Regionalizacija Teritorije Međuopštinske Regionalne Zajednice Kraljevo); Seismological Survey of Serbia: Belgrade, Serbia, 1982.
- Vukašinović, M. Seismological Zonation of the Territory of Svilajnac and Its Surroundings (in Serbian: Seizmička Rejonizacija Teritorije Svilajnca sa Okolinom); Seismological Survey of Serbia: Belgrade, Serbia, 1967.
- Shebalin, N.V.; Leydecker, G.; Mokrushina, N.G.; Tatevossian, R.E.; Erteleva, O.O.; Vassiliev, V.Y. Earthquake Catalogue for Central and Southeastern Europe 342 BC—1990 AD; Final Report to Contract ETNU—CT 93—0087; BGR: Hannover, Germany, 1998. [Google Scholar]
- Stucchi, M.; Rovida, A.; Gomez Capera, A.A.; Alexandre, P.; Camelbeeck, T.; Demircioglu, M.B.; Gasperini, P.; Kouskouna, V.; Musson, R.M.W.; Radulian, M.; et al. The SHARE European Earthquake Catalogue (SHEEC) 1000–1899. J. Seismol. 2013, 17, 523–544. [Google Scholar] [CrossRef]
- ESC. European Macroseismic Scale 1998 (EMS-98); Grünthal, G., Ed.; European Seismological Commission, sub commission on Engineering Seismology, Working Group Macroseismic Scales; Conseil de l’Europe, Cahiers du Centre Européen de Géodynamique et de Séismologie: Luxembourg, 1998; Volume 15. [Google Scholar]
- Schafarzik, F. About the April 8th earthquake (in Hungarian: Az április 8-iki földrengésről). Természettudományi Közlöny 1893, 25, 257–265. [Google Scholar]
- Zátopek, A. The Skopje earthquake of 26 July 1963 and the seismicity of Macedonia. In Proceedings of the International Seminar on Earthquake Engineering, Skopje, Yugoslavia, 29 September–2 October 1964; pp. 77–80. [Google Scholar]
- Žujović, M.J.; Stanojević, M.Đ. Preliminary Report on the Earthquake (in Serbian: Prethodni izveštaj o zemljotresu); Srpske Novine (Serbian Newspaper): Belgrade, Serbia, 1893; pp. 416–417. [Google Scholar]
- SRA. Registry of the Serbian Royal Academy, XXXII: I Earthquakes in Serbia in 1893, II Earthquakes in Serbia in 1894, III Earthquakes in Serbia in 1895; State Printing Office of the Kingdom of Serbia: Belgrade, Serbia, 1896.
- UNESCO. Catalogue of Earthquakes, Part I, 1901–1970, Part II, prior to 1901; UNESCO: Paris, France, 1974. [Google Scholar]
- Réthly, A. Earthquakes of the Carpathian basins: 455–1918 (in Hungarian: A kárpátmedencék földrengései: 455–1918); Academic Publishing House (Akadémiai Kiadó): Budapest, Hungary, 1952. [Google Scholar]
- Bendefy, L. Information on the knowledge of the deep structure of the Pannonian Basin (in German: Angaben zur Kenntnis der Tiefenstruktur des Pannonischen Beckens). Mitteilungen Geol. Ges. Wien 1970, 63, 1–21. [Google Scholar]
- Panza, G.F. A proposito di Intensità macrosismica e Magnitudo. Rendiconti Accademia Nazionale delle Scienze detta dei XL Memorie e Rendiconti di Chimica, Fisica. Mat. Sci. Nat. 2020, 138, 225–228. [Google Scholar]
- Lazić, M.; Borozan, I.; Borić, T.; Ibrajter, B.; Mitrović, K.; Simić, V.; Kostić, S. Church of the Municipality of Žabari; Municipality of Žabari: Žabari, Serbia, 2004. [Google Scholar]
- Radovanović, S.; Petronijević, M. Building types and vulnerability to ground shaking in Serbia (in Serbian: Povredljivost objekata na dejstvo zemljotresa na području Republike Srbije). In Proceedings of the International Conference on Earthquake Engineering, Banja Luka, Bosnia and Herzegovina, 26–28 October 2009; pp. 181–192. [Google Scholar]
- Manić, M.; Bulajić, B. Why damage estimation on civil engineering structures in Kraljevo region has not been completed even a year after the November 3, 2010 earthquake? Izgradnja 2012, 66, 269–308, (In Serbian with English abstract). [Google Scholar]
- Kronrod, T.; Radulian, M.; Panza, G.; Popa, M.; Paskaleva, I.; Radovanovich, S.; Gribovszki, K.; Sandu, I.; Pekevski, L. Integrated transnational macroseismic data set for the strongest earthquakes of Vrancea (Romania). Tectonophysics 2013, 590, 1–23. [Google Scholar] [CrossRef]
- Serva, L.; Vittori, E.; Comerci, V.; Esposito, E.; Guerrieri, L.; Michetti, A.M.; Mohammadioun, B.; Mohammadioun, G.C.; Porfido, S.; Tatevossian, R.E. Earthquake Hazard and the Environmental Seismic Intensity (ESI) Scale. Pure Appl. Geophys. 2016, 173, 1479–1515. [Google Scholar] [CrossRef]
- Michetti, A.M.; Esposito, E.; Guerrieri, L.; Porfido, S.; Serva, L.; Tatevossian, R.; Vittori, E.; Audemard, F.; Azuma, T.; Clague, J.; et al. Intensity scale ESI 2007; Agenzia per la protezione dell’ambiente e per i servizi tecnici, Dipartimento difesa del suolo, Servizio Geologico d’Italia: Firenze, Italy, 2007.
- Marović, M.; Toljić, M.; Rundić, L.; Milivojević, J. Neoalpine Tectonics of Serbia; Serbian Geological Society: Belgrade, Serbia, 2007.
- Marović, M.; Djoković, I.; Pešić, L.; Radovanović, S.; Toljić, M.; Gerzina, N. Neotectonics and seismicity of the southern margin of the Pannonian basin in Serbia. EGU Stephan Mueller Spec. Publ. Ser. 2002, 3, 277–295. [Google Scholar] [CrossRef]
- Gasperini, P.; Bernardini, F.; Valensise, G.; Boschi, E. Defining seismogenic sources from historical earthquake felt reports. Bull. Seismol. Soc. Am. 1999, 89, 94–110. [Google Scholar] [CrossRef]
- Gasperini, P.; Vannucci, G.; Tripone, D.; Boschi, E. The Location and Sizing of Historical Earthquakes Using the Attenuation of Macroseismic Intensity with Distance. Bull. Seismol. Soc. Am. 2010, 100, 2035–2066. [Google Scholar] [CrossRef]
- Kárník, V.; Kondorskaya, N.V.; Riznitchenko, J.V.; Savarensky, E.F.; Soloviev, S.L.; Shebalin, N.V.; Vanek, J.; Zátopek, A. Standardization of the earthquake magnitude scale. Stud. Geophys. Geod. 1962, 6, 41–48. [Google Scholar] [CrossRef]
- Scordilis, E.M. Empirical Global Relations Converting MS and mb to Moment Magnitude. J. Seismol. 2006, 10, 225–236. [Google Scholar] [CrossRef]
- Markušić, S.; Gülerce, Z.; Kuka, N.; Duni, L.; Ivančić, I.; Radovanović, S.; Glavatović, B.; Milutinović, Z.; Akkar, S.; Kovačević, S.; et al. An updated and unified earthquake catalogue for the Western Balkan Region. Bull. Earthq. Eng. 2016, 14, 321–343. [Google Scholar] [CrossRef]
- Wells, D.L.; Coppersmith, K.J. New empirical relationships among magnitude, rupture length, rupture width, rupture area, and surface displacement. Bull. Seismol. Soc. Am. 1994, 84, 974–1002. [Google Scholar] [CrossRef]
- Vujić, J. Travels in Serbia, Second Book; State Printing Office of the Kingdom of Serbia: Belgrade, Serbia, 1902.
- Stojanović, L. Old Serbian Records and Inscriptions, Book 2; State Printing Office of the Kingdom of Serbia: Belgrade, Serbia, 1903.
- Preyer, J.N. Monograph of the Royal-Free Town of Timișoara, with Three Plans (In German: Monographie der Königlichen Freistadt Temesvár, mit drei Plänen); Rösch & Comp.: Timișoara, Romania, 1853. [Google Scholar]
- Lénárt, B. Southern Hungary, or the Separate History of the So-Called Bánság, Second Volume (in Hungarian: Dél-Magyarország, Vagy Az Úgynevezett Bánság Külön Történelme, Második Kötet); Gustáv Emich: Budapest, Hungary, 1867. [Google Scholar]
- Schwicker, J.H. History of the Banat of Temeswar: Historical Pictures and Sketches (In German: Geschichte der Temeser Banats: Historische Bilder und Skizzen); Fr. P. Bettelheim, Gross Becskerek: Zrenjanin, Serbia, 1864. [Google Scholar]
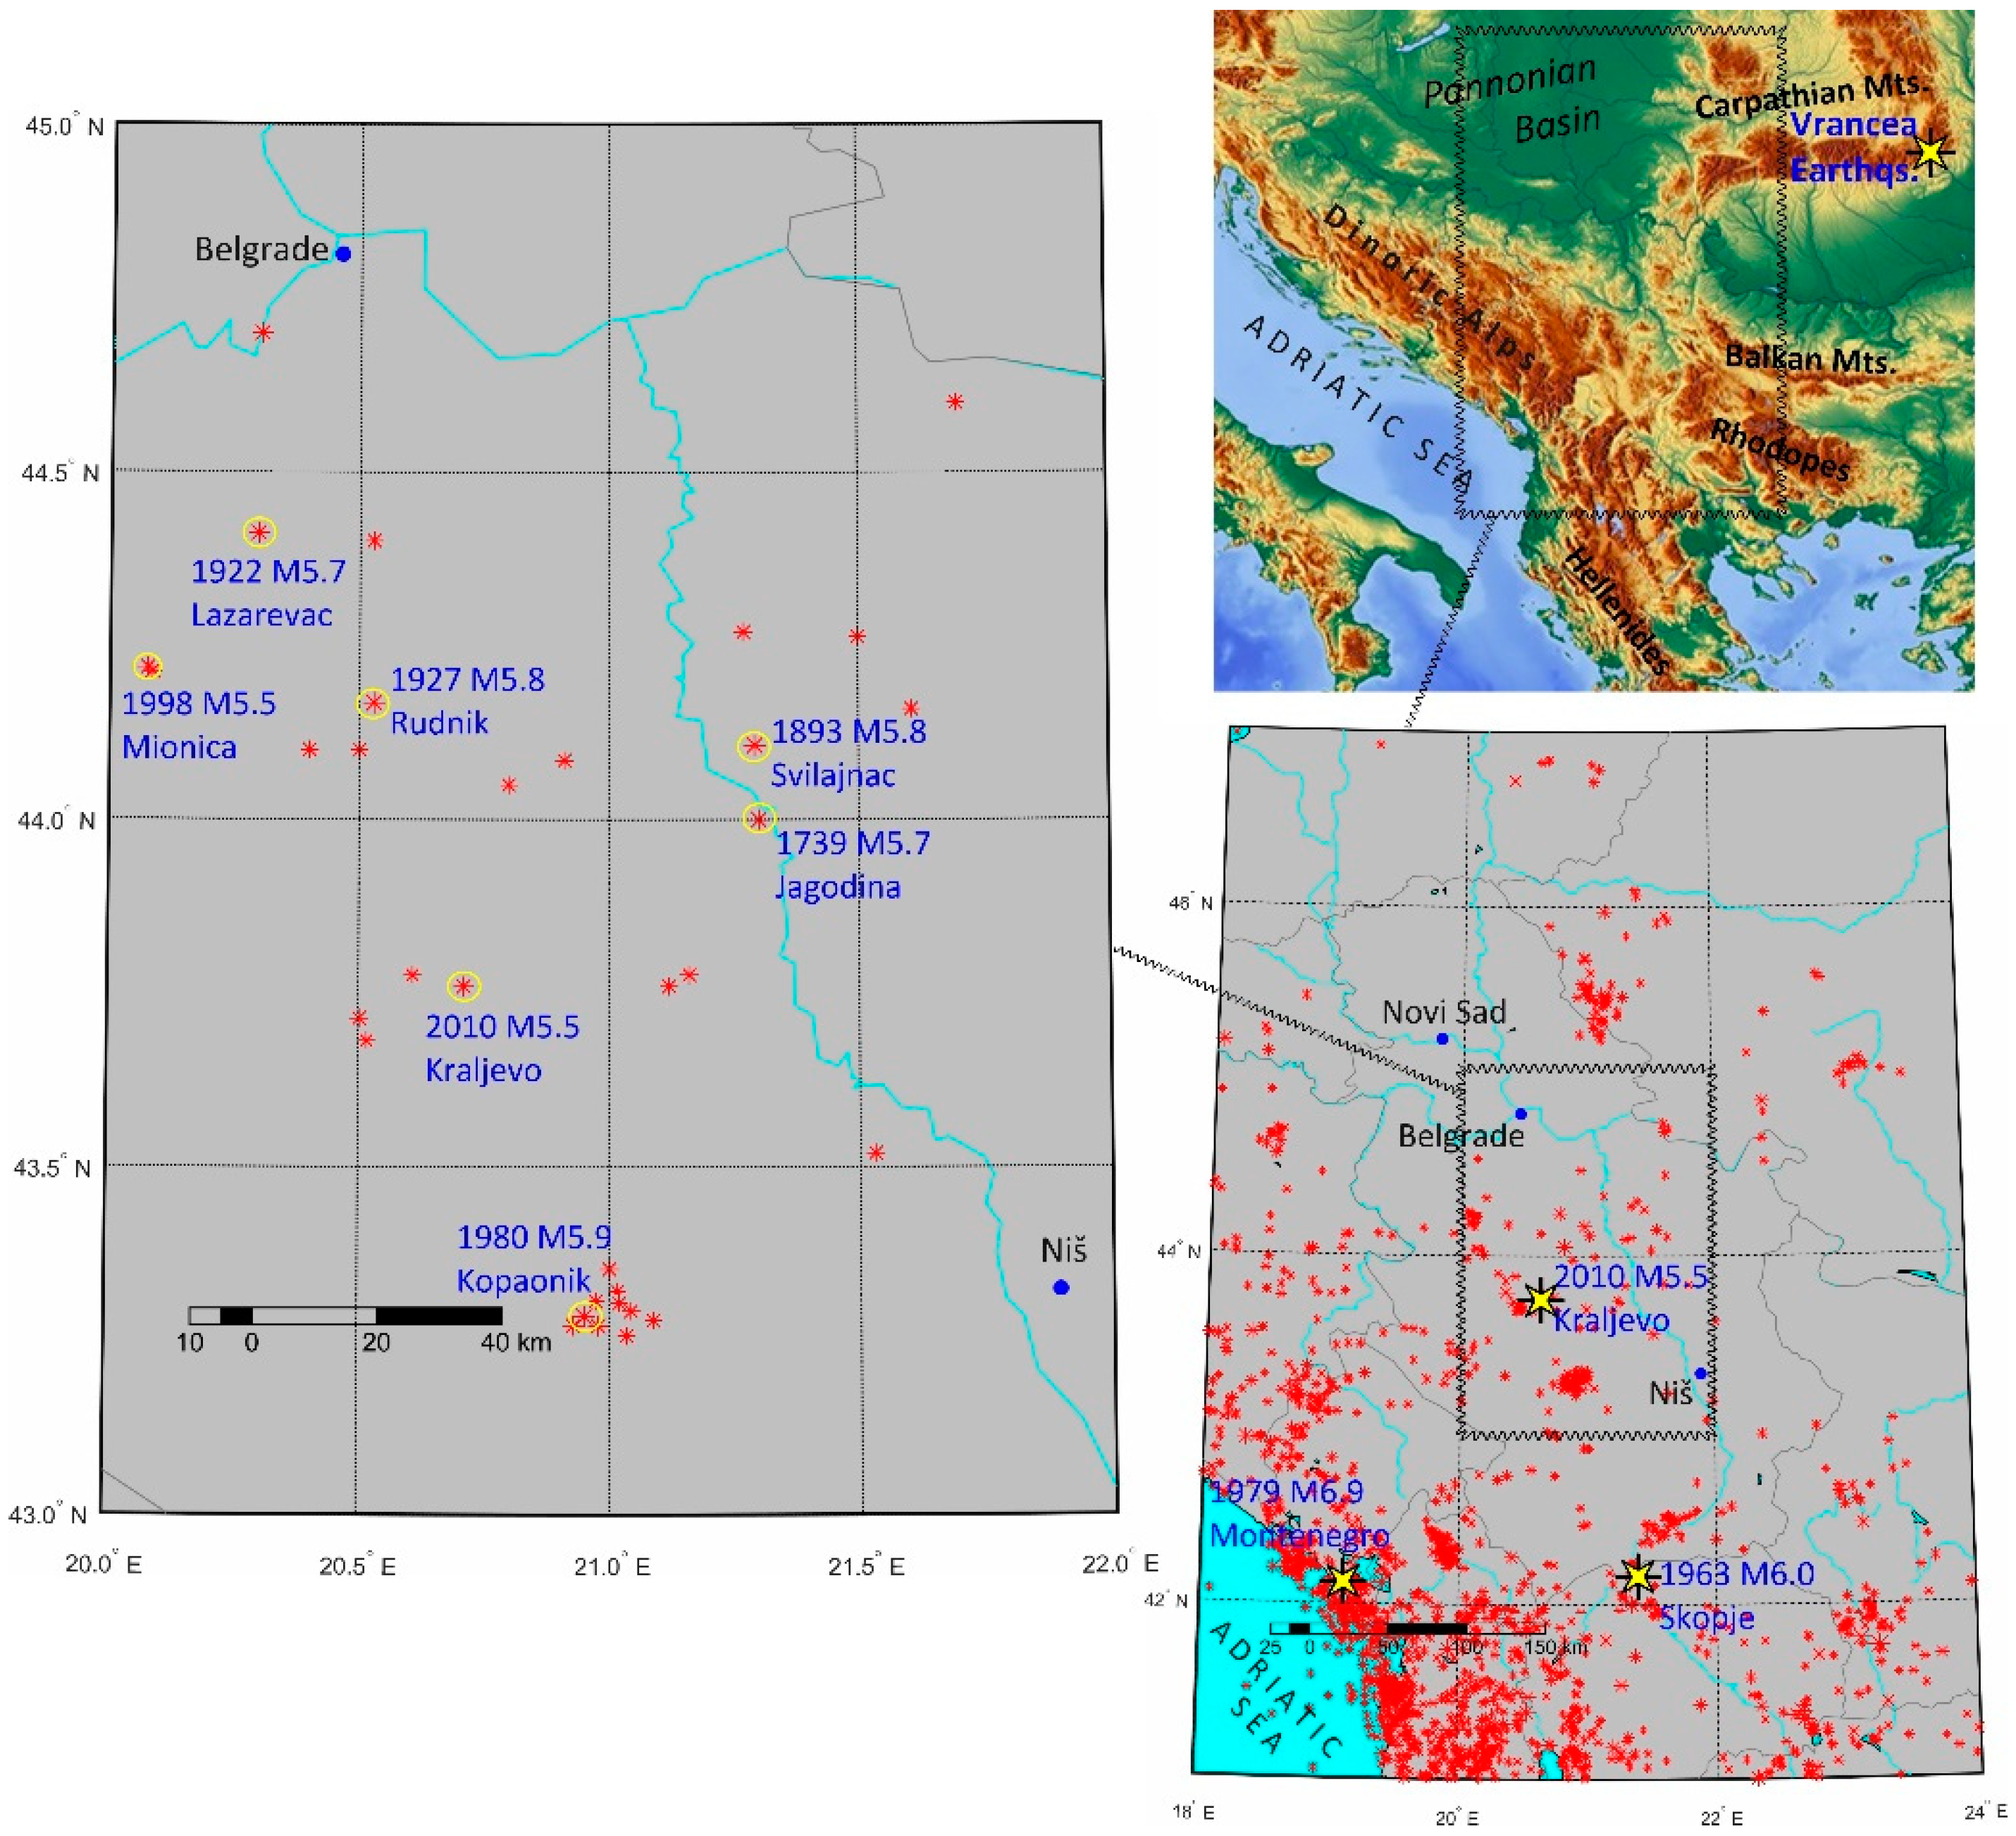
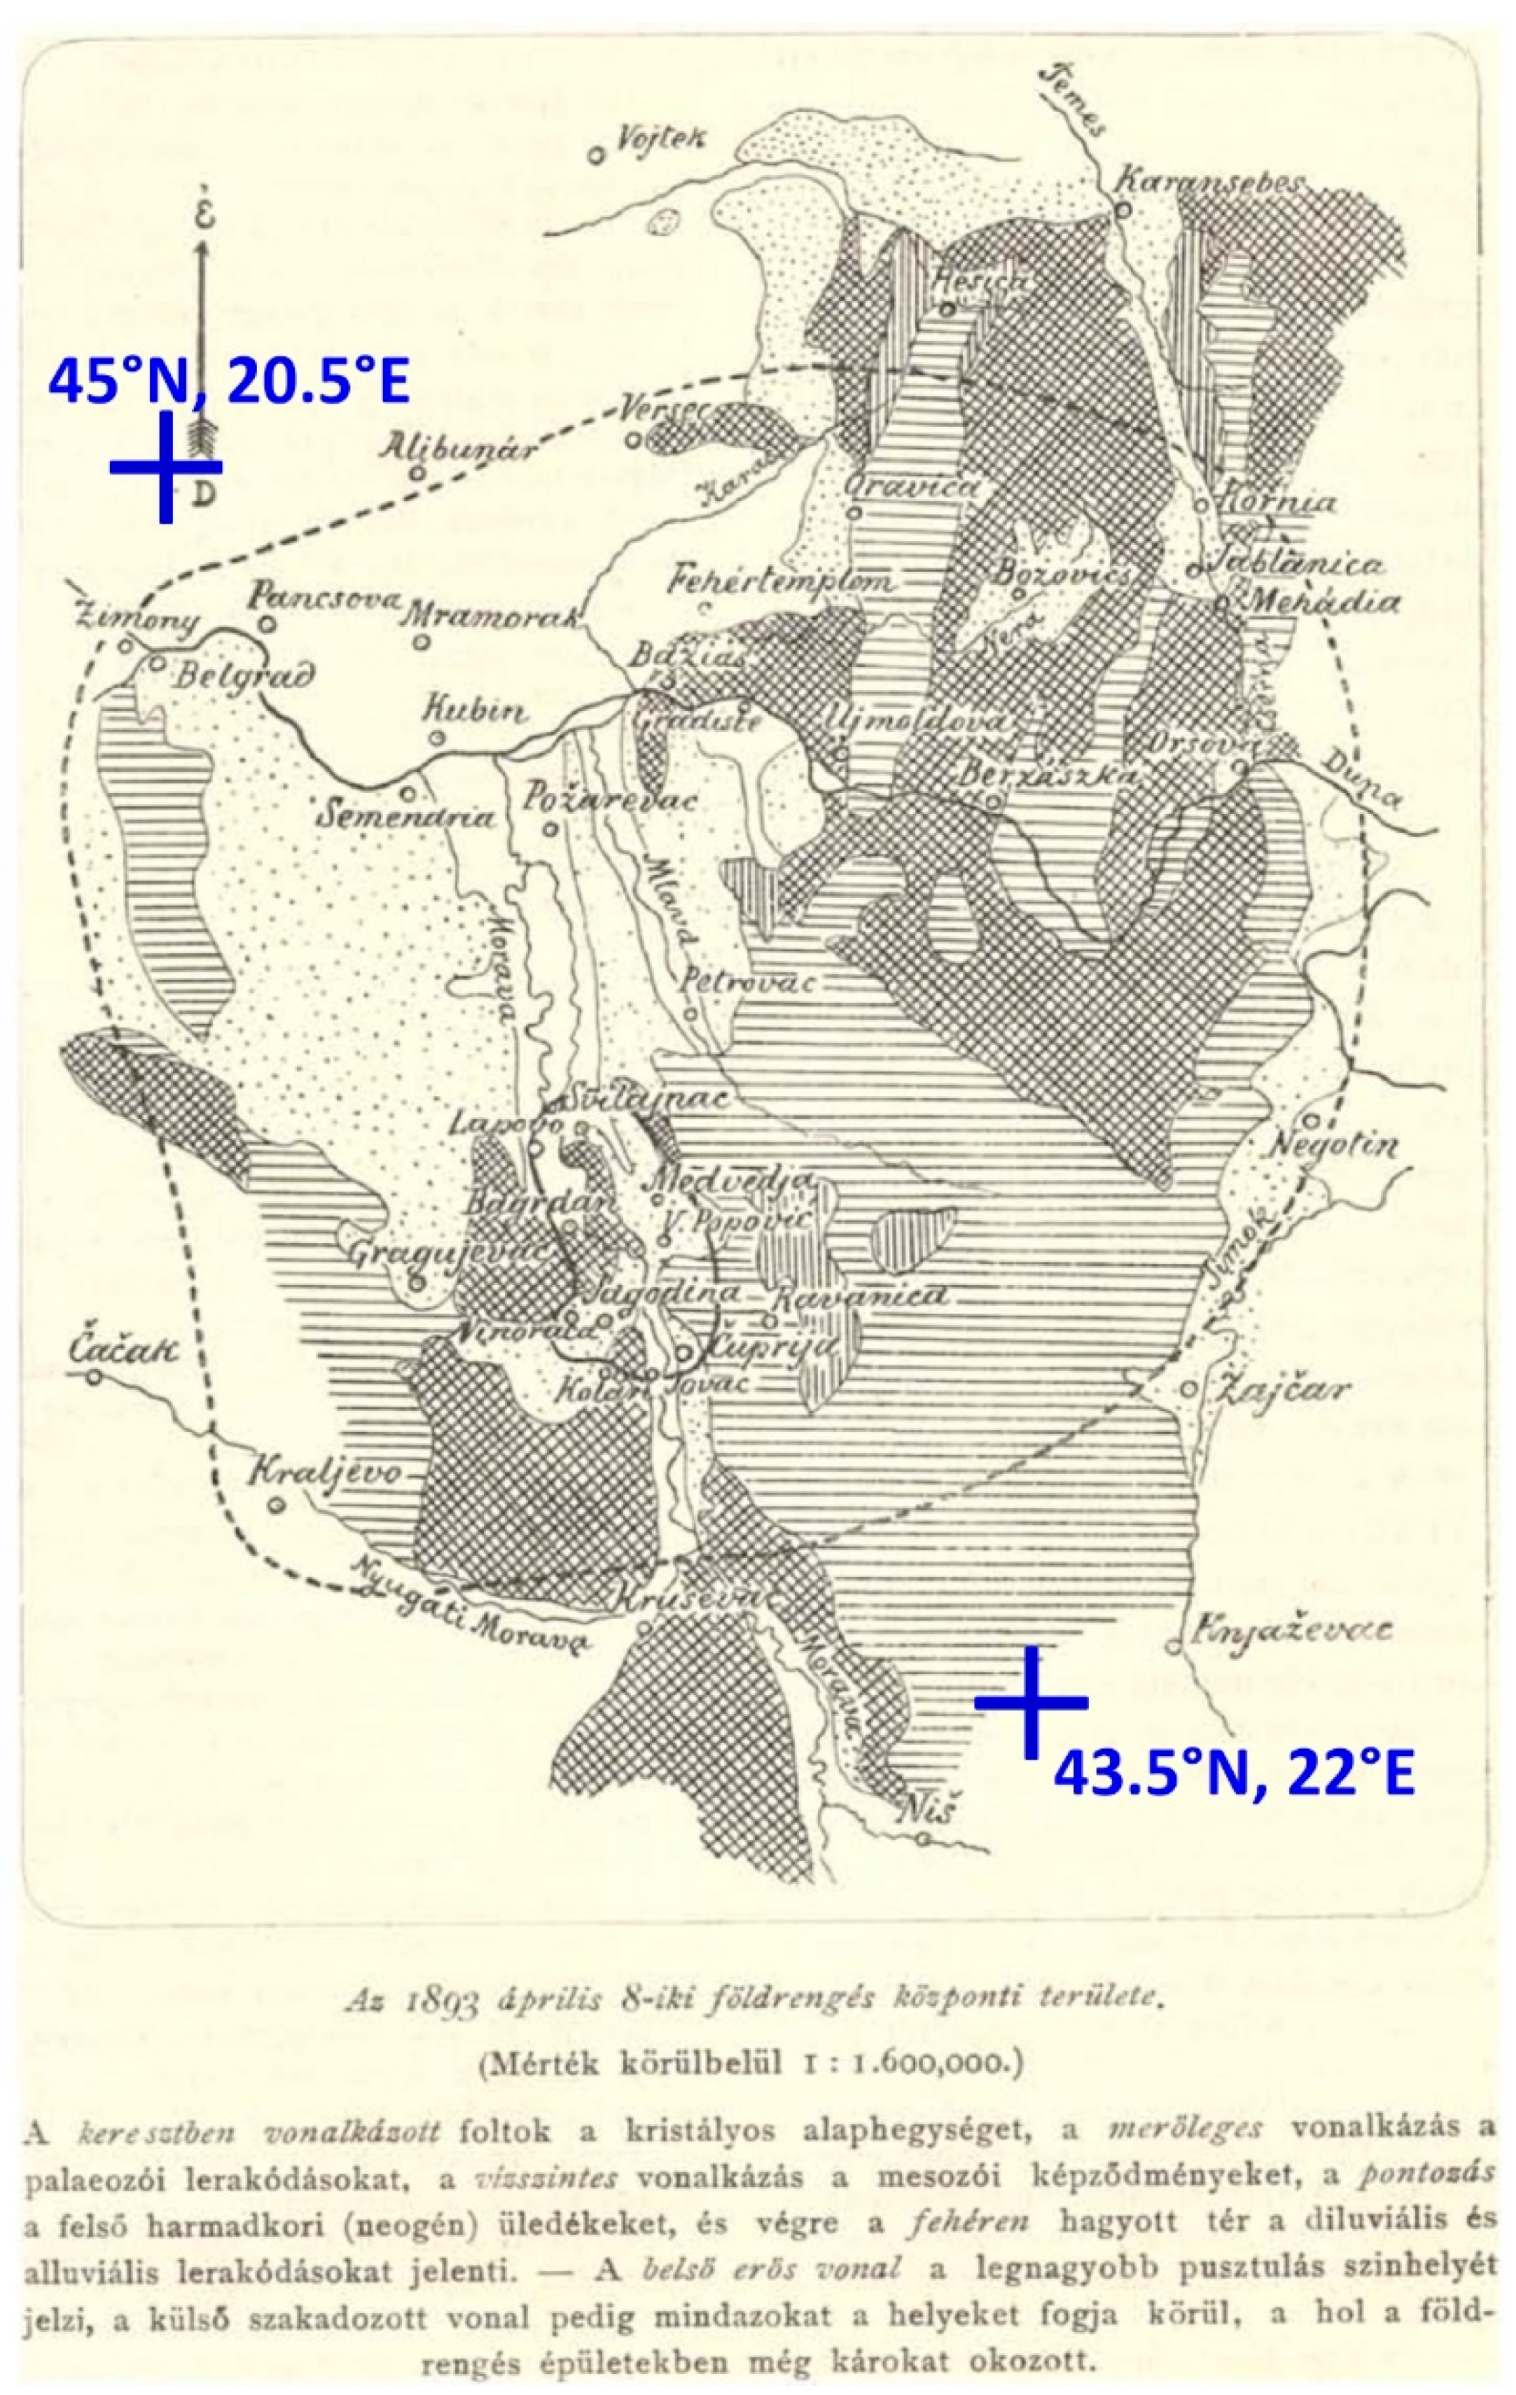

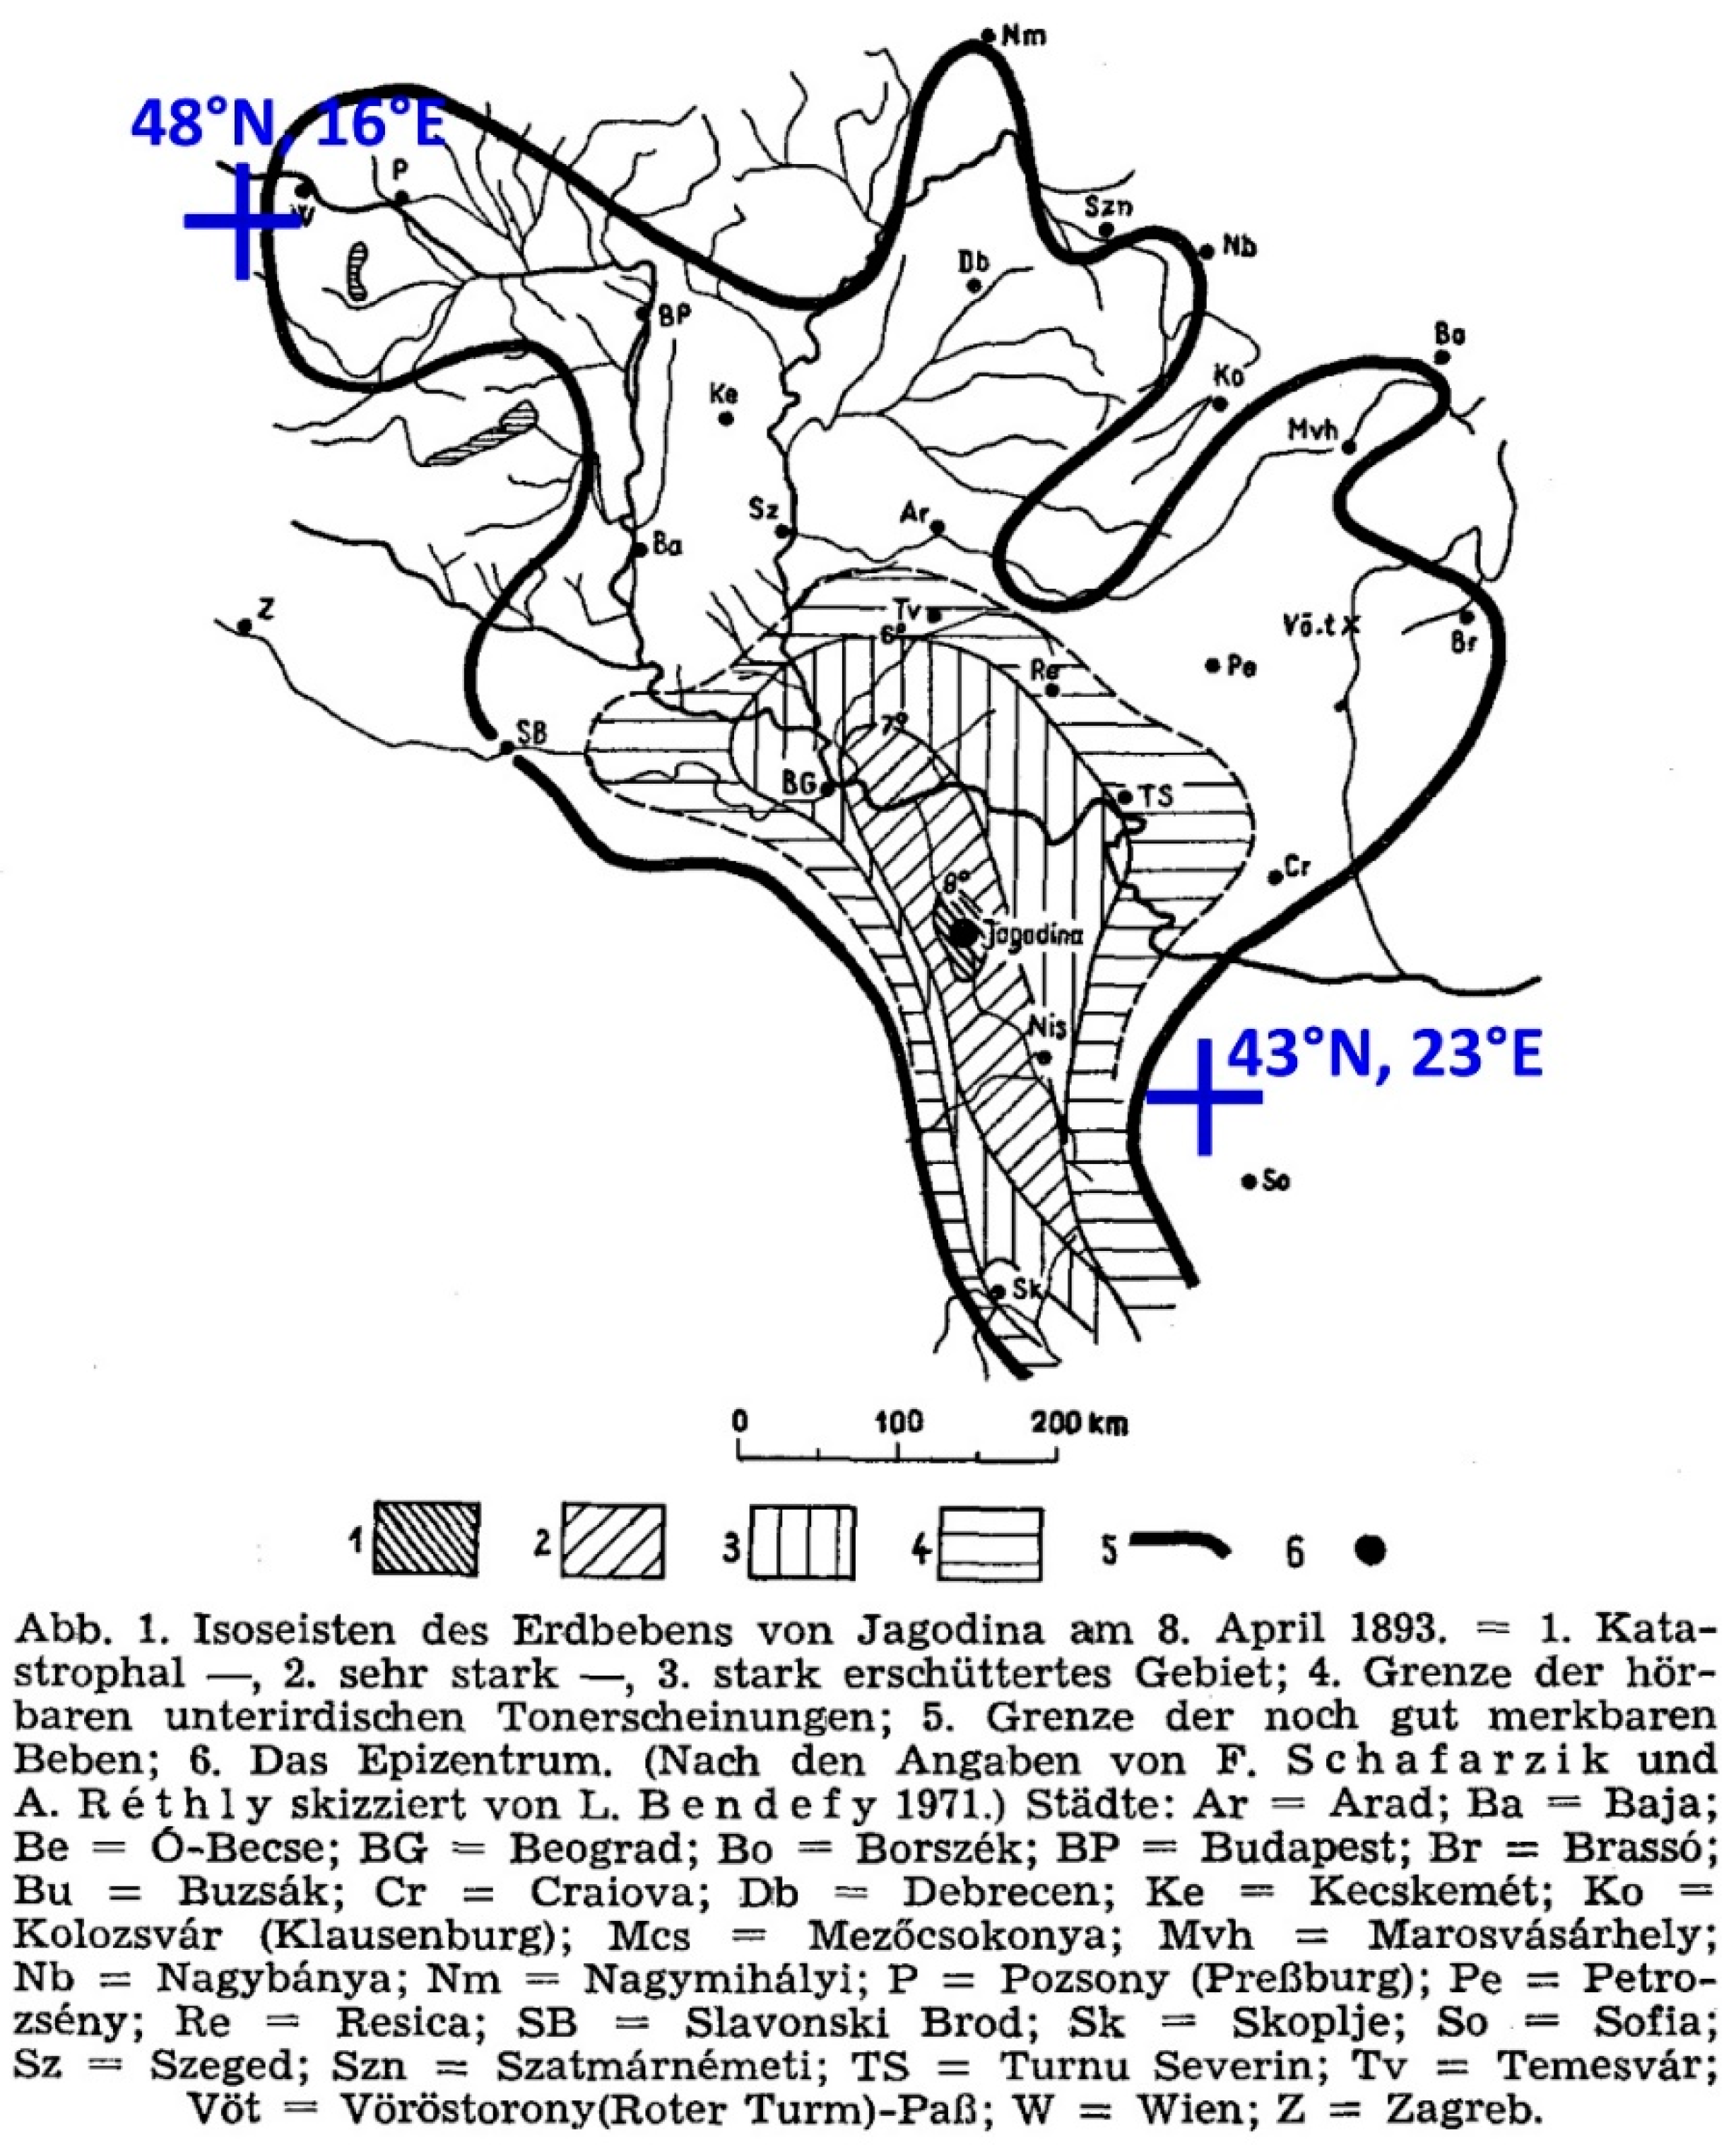
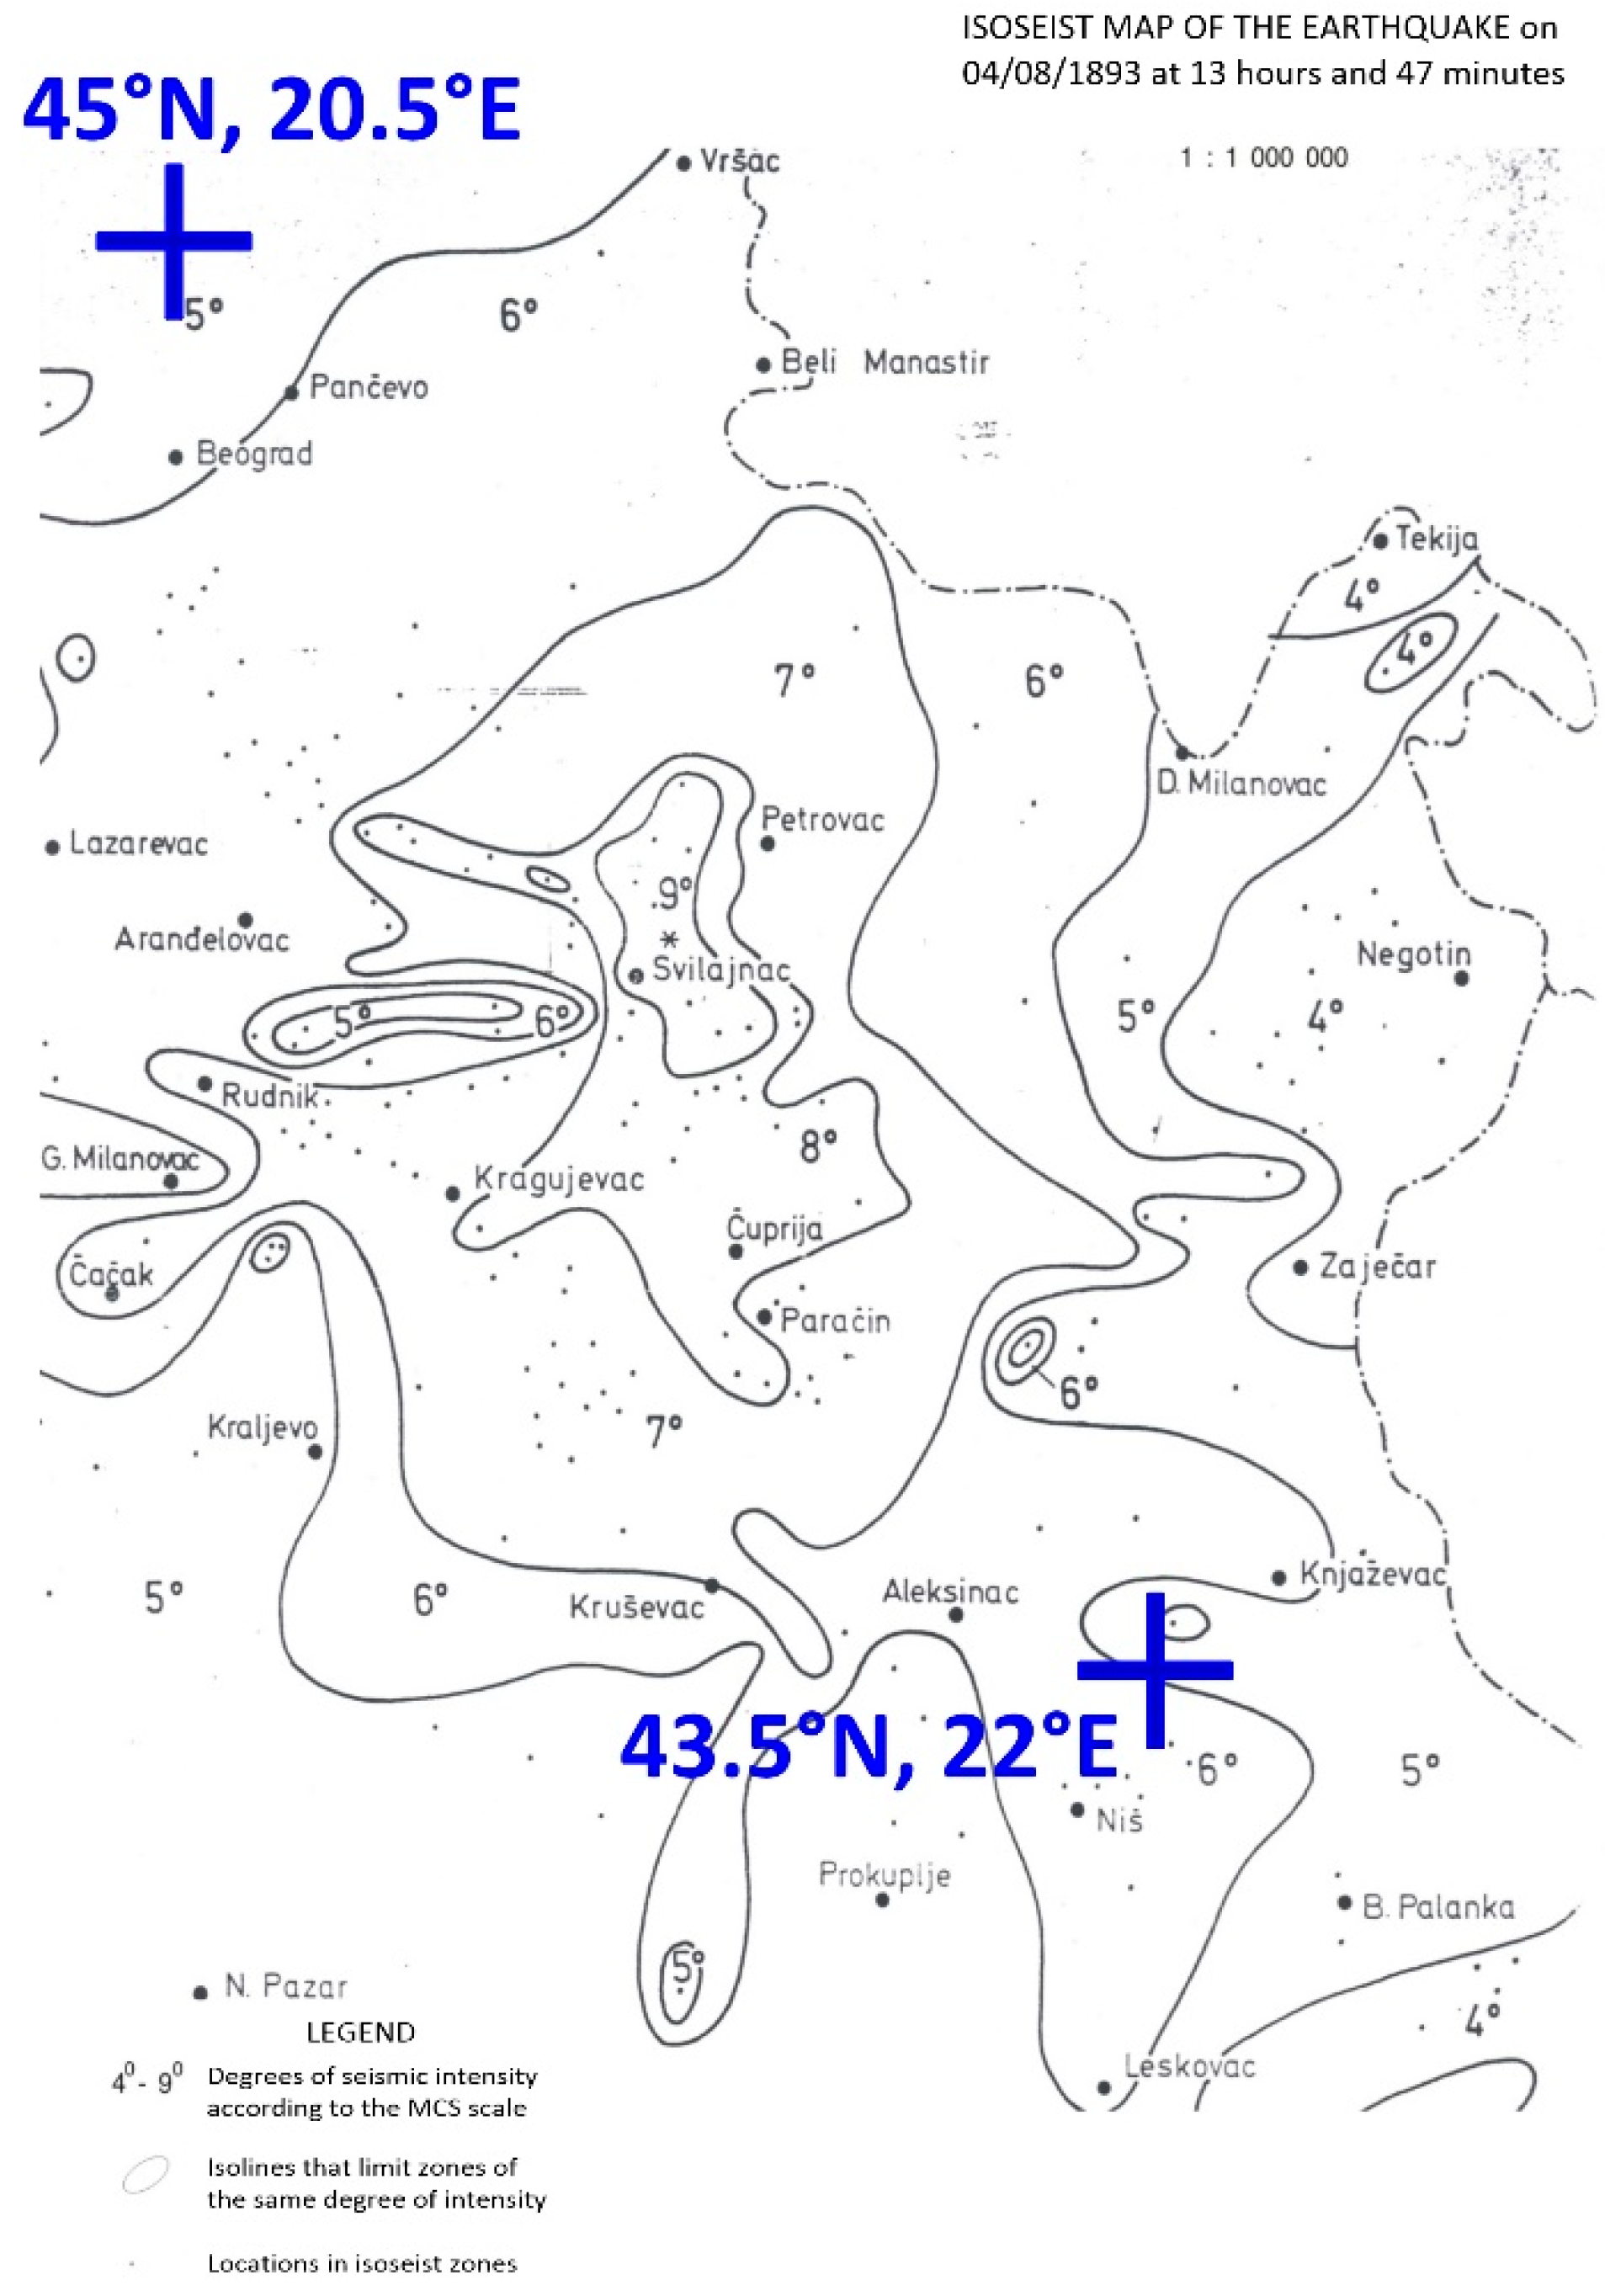
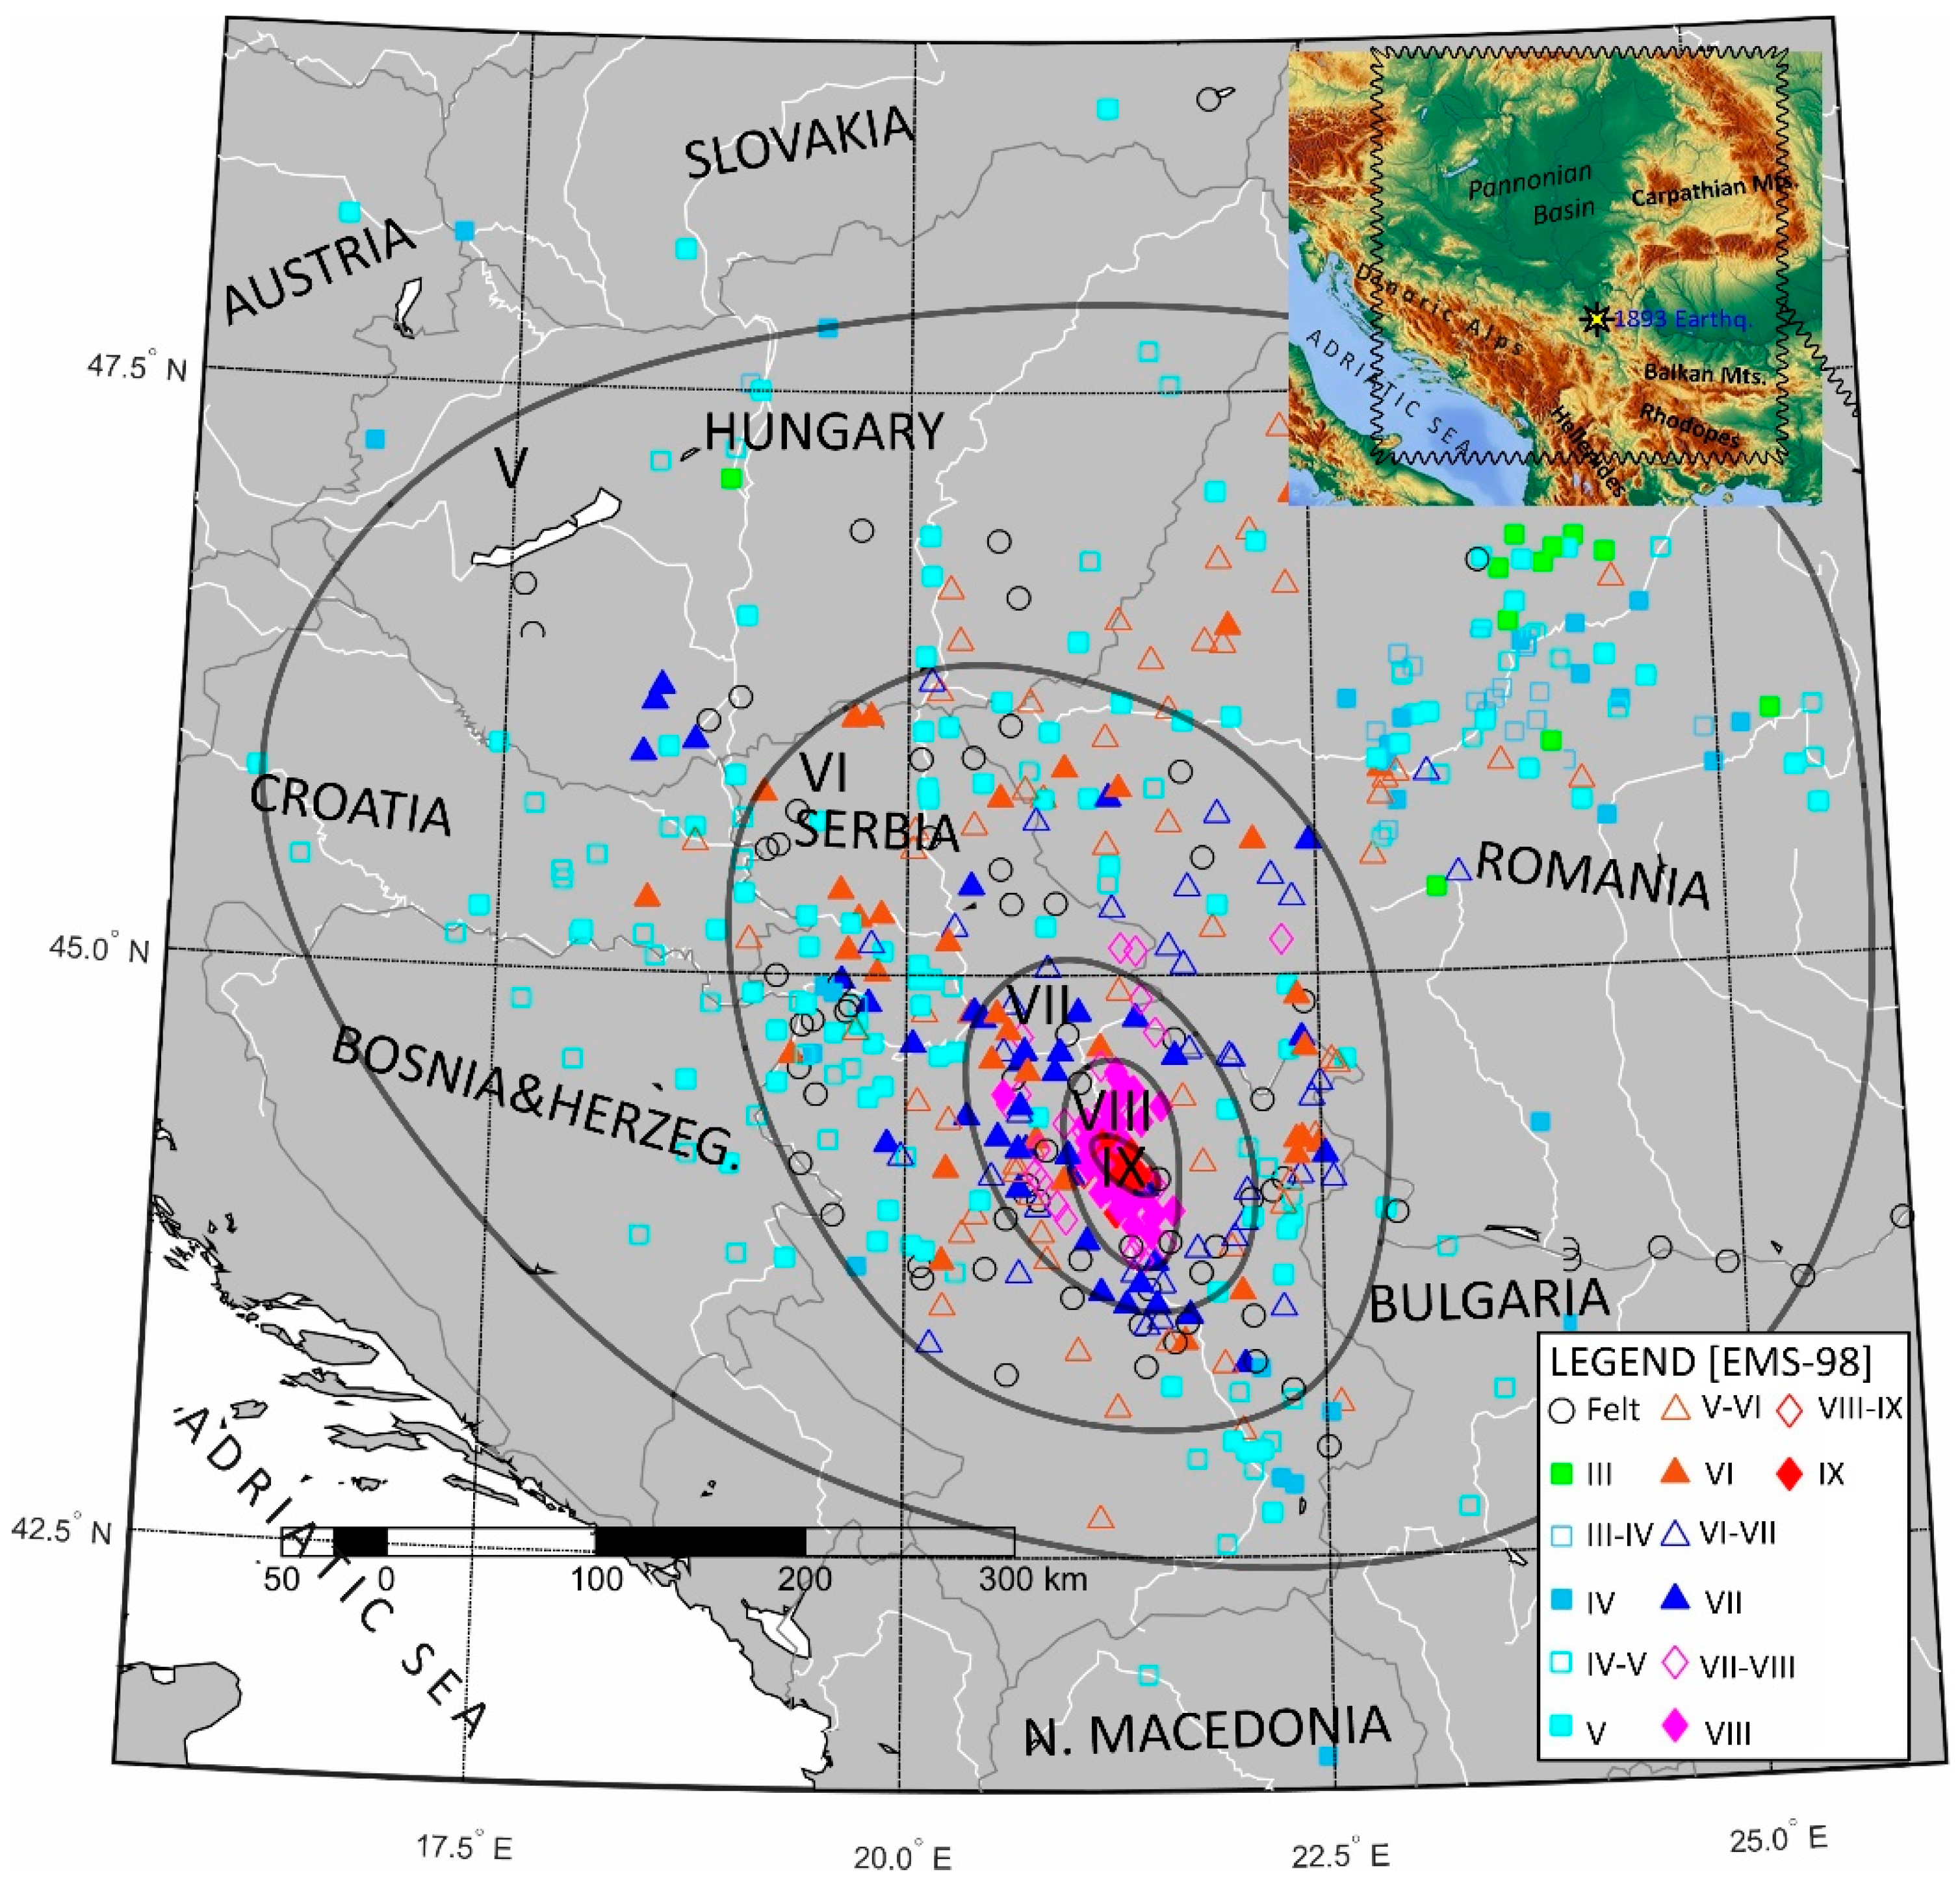
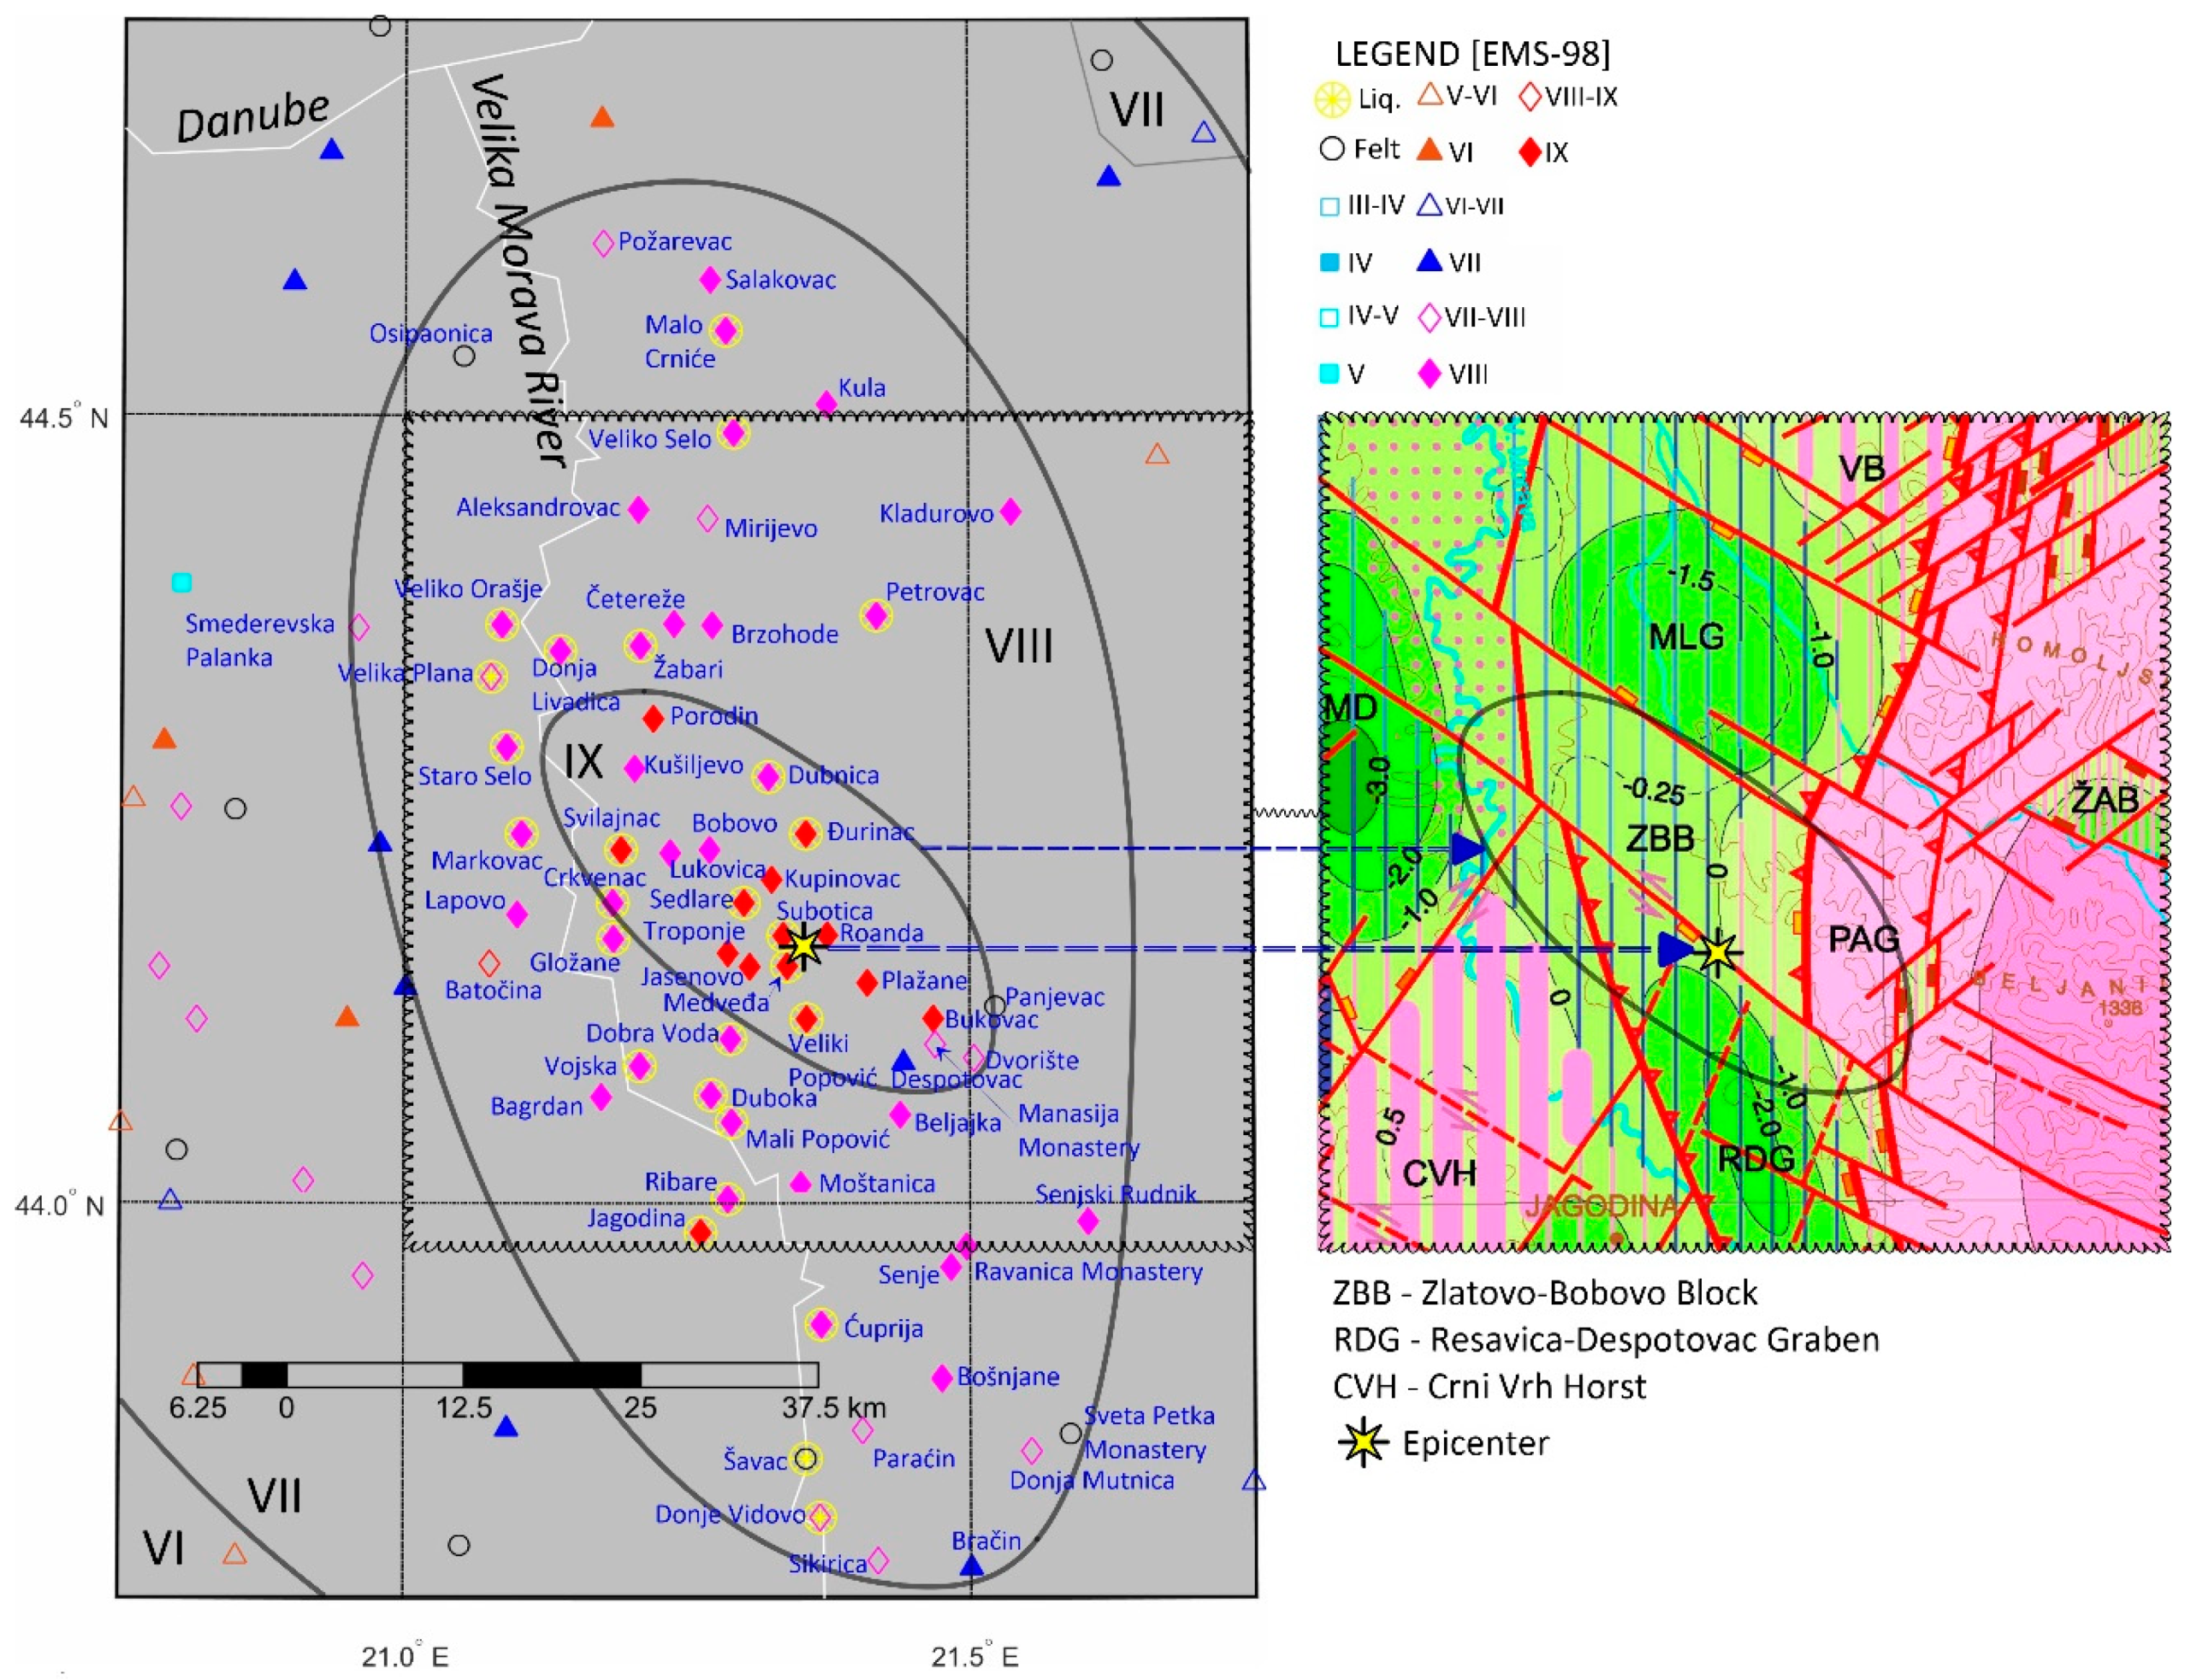
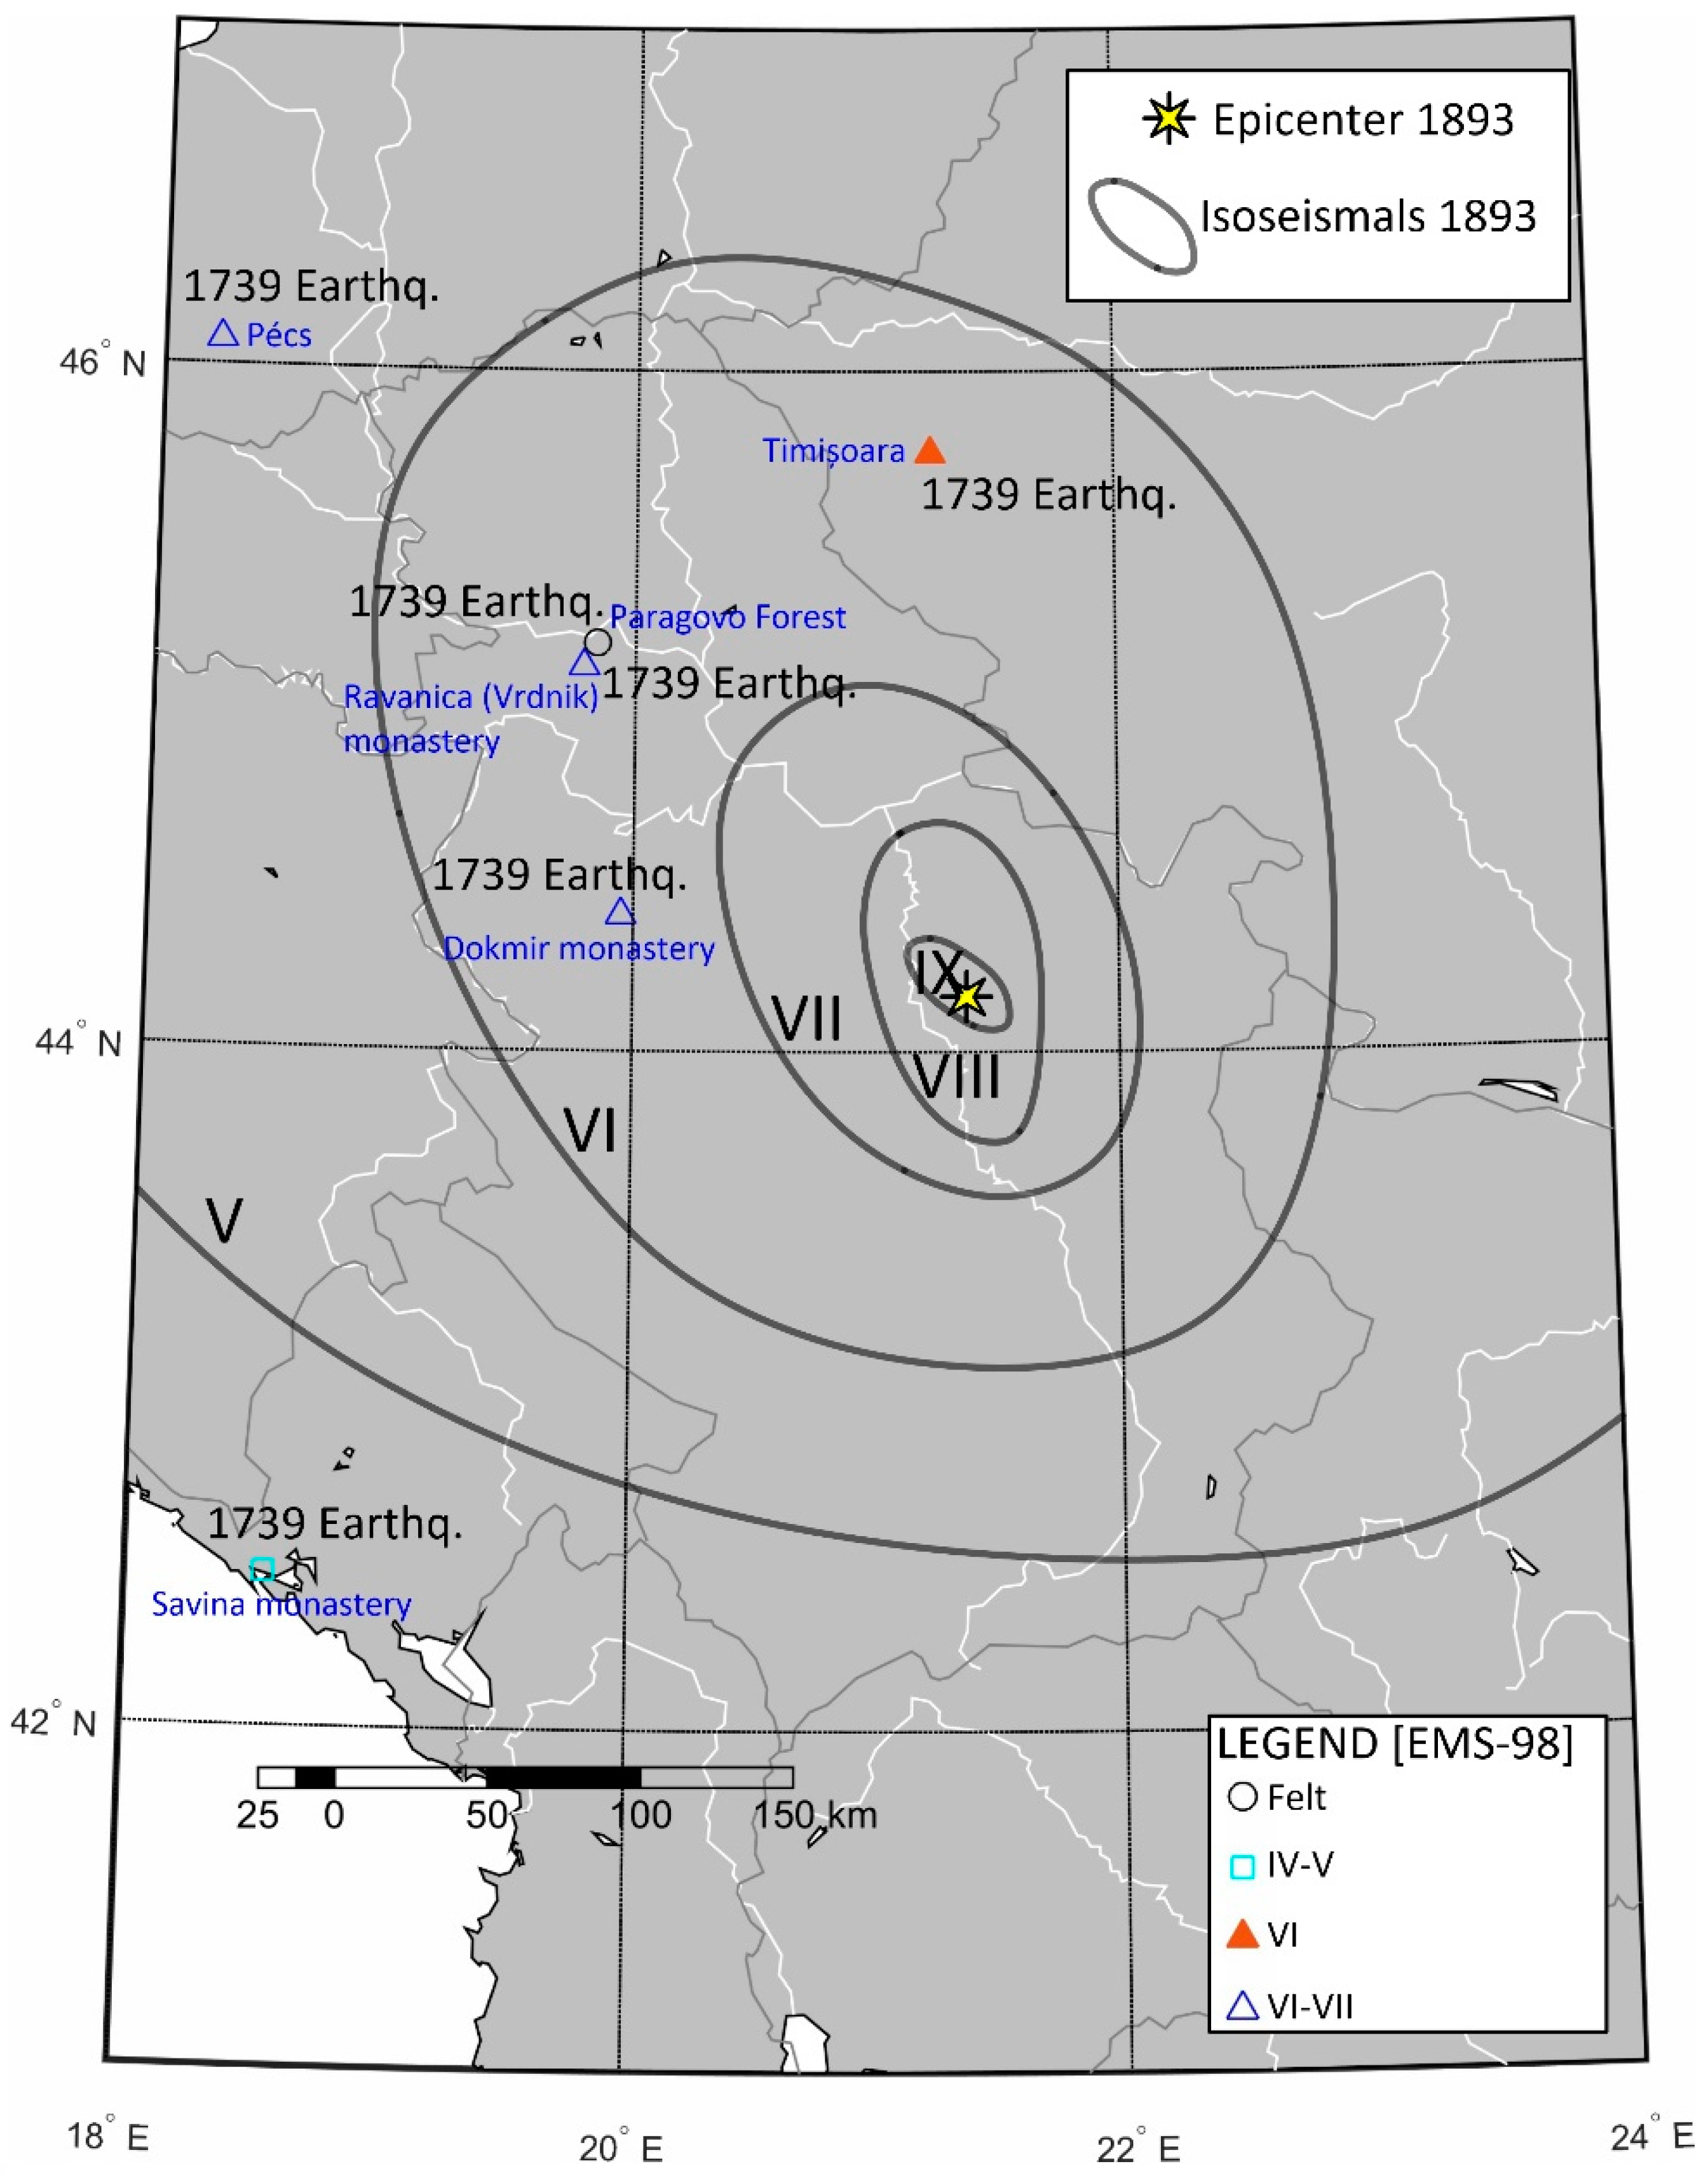
Disclaimer/Publisher’s Note: The statements, opinions and data contained in all publications are solely those of the individual author(s) and contributor(s) and not of MDPI and/or the editor(s). MDPI and/or the editor(s) disclaim responsibility for any injury to people or property resulting from any ideas, methods, instructions or products referred to in the content. |
© 2024 by the authors. Licensee MDPI, Basel, Switzerland. This article is an open access article distributed under the terms and conditions of the Creative Commons Attribution (CC BY) license (https://creativecommons.org/licenses/by/4.0/).