Abstract
We present an innovative cooperative driving strategy known as Dynamic Resequencing and Platooning (DRP) designed to ensure the safe and efficient traversal of Connected and Automated Vehicles (CAVs) through signal-free intersections. By employing a Resequencing and Platooning Algorithm (RPA) grounded in state transition networks and CAV platooning, the optimal crossing sequence for CAVs is ascertained within a finite time. Through the utilization of a decentralized energy-optimal control framework, optimal trajectories are devised for CAVs, thereby facilitating optimal coordination among them. Simulation results underscore the substantial performance benefits of the DRP strategy compared to traffic light, First-In-First-Out (FIFO), and Local Dynamic Resequencing (LDR) strategies, with notable reductions observed in both travel delay and fuel consumption.
1. Introduction
Urban intersections often suffer from severe congestion, yet they play a crucial role in allocating conflicting streams of traffic. Traditional intersection management relies on static signal traffic lights coordinated through timers [1]. However, this strategy, which is solely based on predefined time cycles, overlooks variations in actual vehicle density and travel velocities on the road, potentially leading to ineffective responses to diverse traffic demands [2]. With the rapid advancement of electric and autonomous vehicles, Connected and Automated Vehicles (CAVs) hold promise for revolutionary changes in traffic networks, substantially enhancing network performance [3,4]. By harnessing Vehicle-to-Vehicle (V2V) and Vehicle-to-Infrastructure (V2I) communication, CAVs can access real-time travel data from adjacent vehicles and interact with infrastructure, thus enabling the possibility of signal-free intersections [5,6]. Effectively and securely coordinating CAVs through signal-free intersections necessitates the formulation of diverse cooperative driving strategies. These strategies typically optimize one or more objectives by orchestrating the crossing sequence and travel trajectories of all CAVs, thereby addressing the Crossing Sequence Problem (CSP) and the Trajectory Optimization Problem (TOP) for CAVs.
Certain studies have deemed the First-In-First-Out (FIFO) strategy as a feasible approach to cooperative driving. Under this paradigm, the resolution of the CSP directly hinges upon the sequence of entry of each CAV into the intersection zone [7,8]. Relative to the conventional traffic light strategy, the FIFO strategy exhibits noteworthy reductions in travel delay, thereby emerging as a robust mechanism for mitigating traffic congestion. Researchers have developed a decentralized energy-optimal control framework to precisely compute the controllable arrival times and optimal control inputs for each CAV, thereby offering a solution to the TOP [9]. Augmenting this framework with safety distance constraints and considerations for passenger comfort can augment the robustness of strategies [10]. Nonetheless, contemporary research underscores a principal constraint of the FIFO strategy, particularly its incapacity to dynamically reconfigure the sequencing of CAVs’ crossings [11]. This limitation is acutely evident in scenarios of heightened traffic demands, curtailing further enhancements in intersection capacity and impeding the maximal utilization of CAV capabilities in addressing traffic congestion. Consequently, in the pursuit of more sophisticated cooperative driving strategies, prioritizing investigations into the CSP is imperative.
The resequencing strategy aims to optimize the crossing sequence of CAVs. This approach employs a Resequencing Algorithm (RA) to address the CSP, generating multiple feasible crossing sequences for each CAV and selecting the optimal sequence. Throughout this process, maintaining the relative crossing sequence among CAVs is crucial while accommodating the insertion of newly entering CAVs [12]. However, this strategy is constrained to adjusting the crossing sequence of the most recently entered CAV, resulting in suboptimal sorting outcomes. To enhance the effectiveness of sorting results, the Dynamic Resequencing (DR) strategy proposes a comprehensive and independent re-evaluation of the crossing sequences of all CAVs each time a new CAV enters the intersection zone [13]. Although this approach may enhance sorting accuracy, it also significantly prolongs the runtime of the RA. In response to this challenge, the Local Dynamic Resequencing (LDR) strategy has been introduced, effectively reducing the number of CAVs requiring crossing sequence adjustments and thus shortening the runtime of the RA [14]. However, it is important to note that these strategies are predominantly event-triggered, leading to frequent updates of the optimal crossing sequence derived from the RA. This frequent updating elevates the risk of the RA becoming trapped in local optima [15], thereby complicating the search for a globally optimal solution. Our study observes that when transitioning the DR strategy to a time-triggered approach, the involvement of CAVs in crossing sequence adjustments is confined within a finite range. At this juncture, the CSP bears a striking resemblance to the Car Reordering Problem (CRP) encountered in automotive paint shops. Both seek to minimize the cost associated with a specific sequence dependency within a finite retrieval sequence [16]. Drawing upon the methodology of the CRP, we establish a centralized CSP model and introduce state transition networks to centrally enhance the RA, effectively mitigating the challenge of local optima. Expanding on this, we integrate the enhanced RA with the Platoon Forming Algorithm (PFA) to formulate the Resequencing Platoon Algorithm (RPA). This innovative approach allows CAVs to pre-organize batches, enabling the formation of CAV platoons capable of collectively navigating intersections [17]. During the calculation of the optimal crossing sequence for CAVs, the RPA extensively leverages historical computation results, thereby minimizing unnecessary crossing sequence updates and further evading local optima traps.
Addressing the TOP, we persist in employing a decentralized energy-optimal control framework, refining the recursive algorithm for controllable arrival times to accommodate the requirements of CAV platoons. This innovative strategy is designated as the Dynamic Resequencing and Platooning (DRP) strategy, presenting fresh perspectives and methodologies for alleviating traffic congestion.
This paper is organized as follows. Section 2 delves into the design of signal-free intersections and outlines the framework of the DRP strategy. It establishes both a centralized CSP model and a decentralized TOP model. Section 3 introduces an enhanced RA that capitalizes on state transition networks. This algorithm is amalgamated with the PFA to devise the RPA, aimed at achieving the global optimal solution for the centralized CSP within a finite time. In Section 4, an improved recursive algorithm is proposed for determining controllable arrival times tailored to CAV platoons. This algorithm imposes temporal constraints to address the energy-optimal control problem [18] while solving the TOP. Section 5 presents a series of experiments comparing the performance and fairness of CAVs at both traditional intersections and signal-free intersections under various strategies: the traffic light strategy, FIFO strategy, LDR strategy, and DRP strategy. Subsequent to this, a detailed analysis and discussion of each strategy’s performance ensue. Finally, in Section 6, the paper culminates with a comprehensive summary, offering research conclusions and outlining avenues for future exploration and development.
2. Framework of DRP Strategy and Problem Formulation
This section will delineate the configuration of signal-free intersections, introduce the specific framework of the DRP strategy, and establish mathematical models for centralized CSP and decentralized TOP. These efforts lay the foundation for the subsequent sections.
Figure 1 illustrates a symmetrical cross intersection comprising two dual lanes, each with a width of . This intersection operates without signal control and features a coordination unit at its center, capable of interacting with adjacent CAVs, allowing only CAVs to pass through. In accordance with existing research perspectives [19,20], the intersection area is divided into three subareas. The central square region, with a side length of , designated as the Merging Zone (MZ), serves as the primary area for CAV merging and is thus prone to collisions. Surrounding the MZ is the Control Zone (CZ), with a distance of from its entrance to the MZ entrance, where the coordination unit transmits control information to CAVs within this area. The outermost zone is the Organizing Zone (OZ), with a distance of from its entrance to the CZ entrance, primarily serving as a buffer zone for organizing the crossing sequence and travel trajectories of CAVs. In this study, we assume that all CAVs are configured as Series Hybrid Electric Vehicles (HEVs) with identical physical properties and enter the intersection area with the same initial velocity .
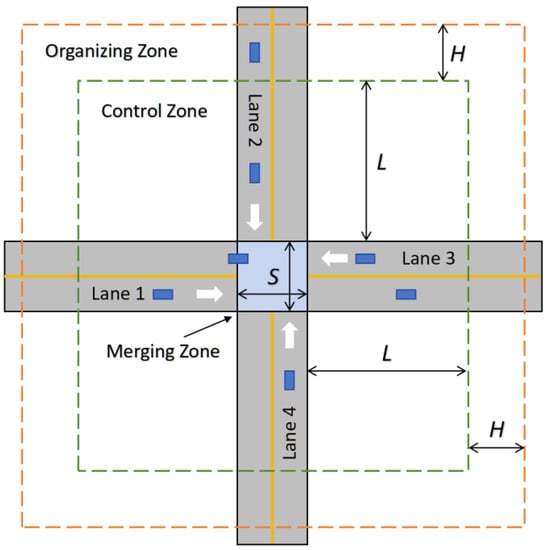
Figure 1.
Signal-free intersection with CAVs.
2.1. Framework of DRP Strategy
Figure 2 illustrates the framework of the DRP strategy, which comprises three stages based on the positioning of CAVs within the area.
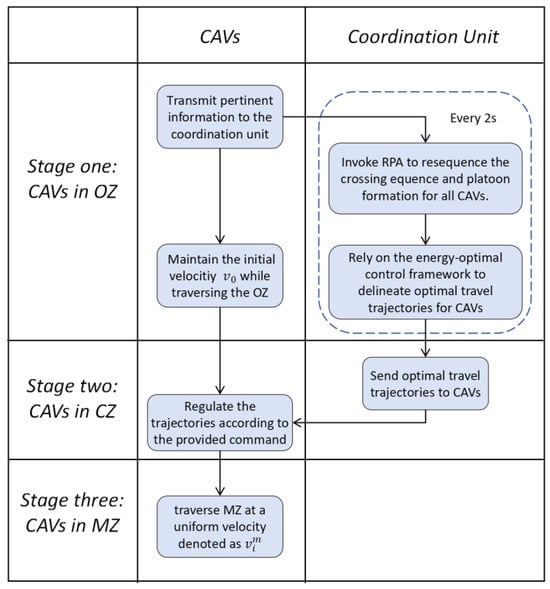
Figure 2.
Framework of DRP strategy.
- Stage One: Upon CAV entering the OZ, it transmits pertinent information, including the current time , to the coordination unit. Every 2 s, the coordination unit invokes the RPA based on state transition networks and CAV platooning to resolve the centralized CSP, orchestrating the crossing sequence and platoon formation for all CAVs in the OZ. Subsequently, employing the decentralized energy-optimal control framework to tackle the TOP problem, optimal travel trajectories are charted for the CAVs in the OZ. CAV maintains its initial velocity while traversing the OZ.
- Stage Two: Upon ingress into the CZ, CAV receives the optimal travel trajectory and platoon formation prescribed by the coordination unit and autonomously adheres to the commanded velocity. Once established, the trajectory remains unchanged unless there exists a collision risk.
- Stage Three: Upon entering the MZ, CAV travels at a consistent velocity to ensure stability and safety throughout the journey.
2.2. Centralized CAVs Crossing Sequencing Problem Formulation
We designate the segments within the OZ as organizing segments and regard them as conveyors, with the MZ at the center of the intersection viewed as a processing point. At this point, leveraging the methodology of the CRP problem, a centralized CSP can be established.
Figure 3 depicts how a signal-free intersection can be transformed into a storage system consisting of a set of organizing segments and a group of CAVs. Let denote the identification of organizing segments, represent the identification of CAVs, and denote the total number of CAVs on the four organizing segments. For organizing segment , denotes the number of CAVs on it, and the identification of the -th CAV on organizing segment is denoted as . It is important to note that there is no strict precedence between the sequences of CAVs entering the MZ from different organizing segments. However, considering that overtaking increases travel delay [21], each organizing segment operates internally following the FIFO principle. Therefore, if there is more than one CAV on organizing segment , the -th CAV on the segment should enter the MZ before the -th CAV on the same organizing segment. When two consecutive CAVs, and , entering the MZ pose a potential collision risk, a collision avoidance cost is incurred, measured in seconds, with the specific calculation method detailed in reference [22]. On the other hand, when CAV and CAV do not pose a collision risk, no collision avoidance cost is incurred. Based on this assumption, we further propose that, for any three distinct CAVs , , and , the sum of their collision avoidance costs satisfies the inequality . Therefore, the key to the CSP lies in adjusting the sequence of CAVs entering the MZ to minimize the total collision avoidance cost.
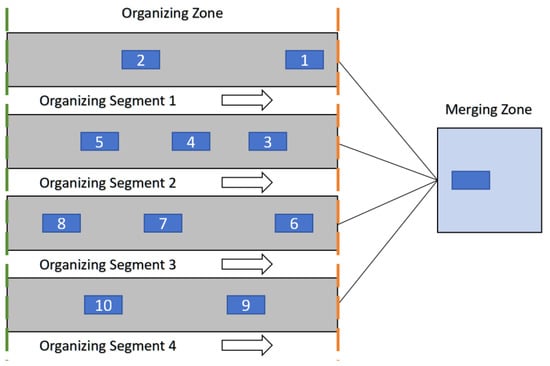
Figure 3.
Configuration of CAVs storage system.
In the subsequent step, we define a directed network wherein each node corresponds to a CAV on the organizing segments, thereby constituting the node set . We delineate as the assortment of nodes corresponding to the nearest CAVs on each organizing segment to the MZ, and as the collection of nodes associated with the farthest CAVs on each organizing segment from the MZ. Specifically, and symbolize the nodes aligned with the closest and farthest CAVs from the MZ on organizing segment , respectively. Subsequently, we establish a collection of directed arcs, denoted as . An arc exists within if CAV can promptly succeed CAV into the MZ, for instance, when CAV and CAV are proximate or situated on distinct organizing segments. The cost attributed to arc equals the collision avoidance cost between CAV and CAV . Additionally, we introduce a virtual node and two arrays of virtual arcs, namely and . symbolizes the arcs originating from to each node within , whereas represents the arcs from each node within to . The expenses associated with these virtual arcs are established at 0. In recapitulation, the CSP quandary can be articulated as the quest for the minimum-cost pathway within the directed network , depicted in Figure 4, where , . Employing these symbols and definitions, the CSP is amenable to representation as an integer programming paradigm:
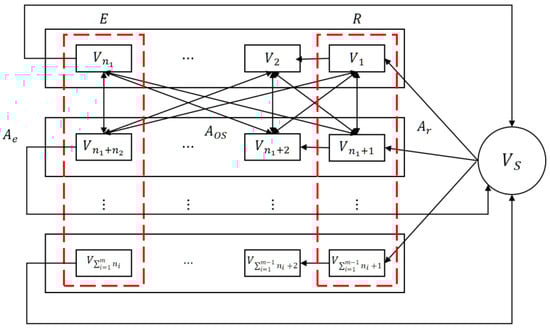
Figure 4.
Network representation of centralized CSP.
The decision variable is a binary variable indicating whether the arc is selected. It is set to 1 if CAV follows CAV into the MZ; otherwise, it is set to 0 for all other arcs . The positional variables represent the position of the node corresponding to CAV in the path. Constraints (2) and (3) ensure the uniqueness of the paths for entering and leaving any node , thereby avoiding path duplication and intersection. Constraint (4) ensures the absence of subpaths within the path. Constraint (5) stipulates that the position of the virtual node must be 1. Constraint (6) ensures that the positions of nodes corresponding to CAVs in the path range from 2 to . Finally, constraint (7) ultimately mandates the precedence relationship among nodes corresponding to CAVs situated on the identical organizing segment.
2.3. CAVs Trajectory Optimization Problem Formulation
Upon establishing the sequence of all CAVs entering the MZ, additional computation of the arrival times of CAVs at the MZ, symbolized as , becomes imperative to furnish essential temporal constraints for tackling the TOP. By taking into account the arrival time of the preceding CAV in the sequence at the MZ, along with the collision avoidance costs between CAVs and , recursively determining the arrival time of CAV at the MZ emerges as a straightforward and efficient approach [8].
Following this, to derive the precise trajectories of the CAVs, it is essential to establish the corresponding models. To accomplish this, we postulate that the movement of each CAV is subject to second-order dynamics:
Here, , , and correspond to the position (the distance traveled upon entering the CZ), velocity, and acceleration (control input) of CAV . To ensure that the velocity and control input of CAV remain within acceptable ranges, constraint (11) is imposed:
These constraints are effective within the interval , where and denote the instants when the CAV enters the CZ and exits the MZ, respectively. In accordance with the assumptions outlined in Section 2.1, all CAVs traverse the OZ at a consistent velocity and maintain a uniform velocity upon entering the MZ. Given the arrival time of any CAV in the OZ, the time when CAV enters the CZ can be ascertained by incorporating the respective travel time to . Similarly, the departure time when CAV exits the MZ can be directly computed by adding the travel time to , as illustrated in the ensuing equation:
A primary focus of research in TOP is the reduction in energy consumption [9]. For HEVs, scholarly investigations have proposed leveraging Pontryagin’s minimum principle for analysis and resolution, effectively converting electrical energy into prospective fuel consumption equivalents [23]. As indicated by the study cited in [24], the energy consumption rate of CAV is contingent upon its control input , exhibiting a monotonic increase with the augmentation of . By amalgamating the aforementioned studies, TOP can be reformulated into the subsequent energy-optimal control problem for each CAV [9]:
Here, represents the energy consumption rate functional, and, when , the goal of problem (13) is to minimize transient engine operation [11,12]. Since internal combustion engines achieve their maximum efficiency at steady-state operating points [24], pursuing this objective directly leads to advantages in terms of fuel consumption and emissions [19]. Problem (13) is subject to multiple constraints, encompassing vehicle dynamics (10) and velocity and control input (11). In our investigation, , , and are defined to denote the position (the distance traveled upon entering the CZ), velocity, and acceleration (control input) of CAV , respectively. Additionally, and signify the times at which CAV enters CZ and exits MZ, respectively. The distance from the entrance of CZ to the entrance of MZ is , and CAVs traverse OZ and enter CZ at a constant velocity . Therefore, problem (13) is also subject to initial and final state constraints (14). Through the application of Hamiltonian functions [19], we can obtain the optimal control input function for CAV , thereby devising a trajectory that minimizes energy consumption while adhering to the specified arrival time at the MZ as .
3. Resequencing and Platooning Algorithm for Solving CSP
In order to tackle the centralized CSP as described by the integer programming model (1), this section introduces an enhanced RA founded on state transition networks. Through the amalgamation of the refined RA with a PFA, an RPA is established, aiming to achieve the global optimal solution of the centralized CSP within a finite time. Figure 5 delineates the comprehensive procedure of the RPA.
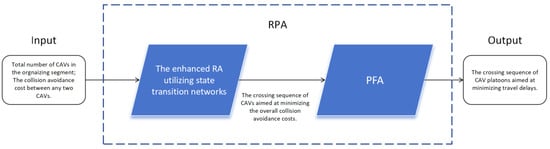
Figure 5.
The procedure of RPA.
3.1. Resequencing Algorithm based on State Transition Network
To enhance the performance of the RA, we have introduced state transition networks [16]. For the research object composed of four organizing segments, a state vector has been defined to represent the current state . Each element in denotes the number of CAVs sorted on organizing segment , while identifies the segment where the sorted CAV is located when transitioning from the previous state to the current state . Taking the state vector representing the state as an example, suppose that, in this state, a CAV on organizing segment 3 has been sorted. Then, the correspondence between the state vector of the new state and is , , , , . This state transition process incurs a transition cost , which equals the collision avoidance cost between the CAV currently being sorted and the last sorted CAV, identified as and .
To enhance the intuitive understanding of the state transition network, we categorize the states into different stages based on the total number of sorted CAVs. Since the value of increases by 1 with each transition, it ensures that the transition can only occur from stage to stage , thereby guaranteeing a finite path length in the state transition network. Finally, we define the initial state as , which is connected to the states in stage 1 through corresponding transitions. Similarly, we introduce the final state as , connecting the states in stage . Figure 6 illustrates an example of a state transition network in the intersection area with two organizing segments, each containing two CAVs.
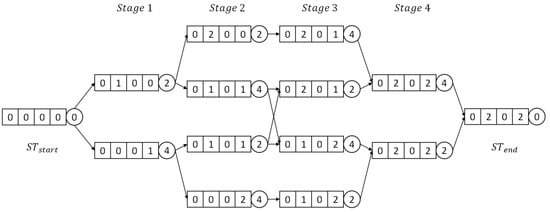
Figure 6.
State transition network of CSP.
The path from the initial state to the final state in the state transition network represents a feasible sorting arrangement for CAVs. This arrangement involves a systematic sorting process of CAVs on 4 organizing segments, facilitated through a series of state transitions. Throughout the state transition process, each transition is associated with a specific transition cost. Consequently, the global optimal solution of the CSP corresponds to the path from to that results in the minimum total transition cost.
In Algorithm 1, represents the minimum transition cost in the state transition network, and denotes the shortest path containing states, where represents the total number of CAVs on four organizing segments. The sorting vector comprises two elements: records the identification of the CAV entering MZ in the -th sorted order, and is used to denote the identification of the segment in which the CAV is located. The obtained set represents a crossing sequence of CAVs, achieving the minimization of the total collision avoidance cost, thereby constituting the global optimal solution of the CSP. Additionally, also contains information about the organizing segments where each CAV is situated, which is crucial for subsequent platoon forming algorithms.
| Algorithm 1 Resequencing Algorithm based on State Transition Network |
| 1. Input: The count of CAVs on each organizing segment , denoted as , the collision avoidance cost between any two CAVs and , and the organizing segment counter initialized to zero. 2. For in range (1, 4) do If then . End if End for 3. Constructing a state transition network using and , each state possesses a state vector . The transition cost from state to state is equivalent to the collision avoidance cost between the CAV identified as and the CAV identified as . 4. Group each state according to into the stage . 5. Foreach stage in do Foreach state in stage do . add . End End 6. . ). 7. Foreach state in do generate the , depends on the position of in . , , add to . End 8. Output: . |
3.2. Platoon Forming Algorithm
In the framework of the DRP strategy, the crossing sequence of CAVs within the OZ undergoes reassessment every 2 s to ensure the timely sorting of newly entering CAVs. However, this mechanism may introduce challenges in certain scenarios. Figure 7 depicts a scenario where CAV 1, potentially colliding with CAV 2, exits the OZ. Subsequently, the updated crossing sequence may allow CAV 2 to enter the MZ before CAV 3, which shares the same organizing segment as CAV 1. These unnecessary updates could result in additional collision avoidance costs, leading to increased travel delays and impacting the overall efficiency of traffic flow.
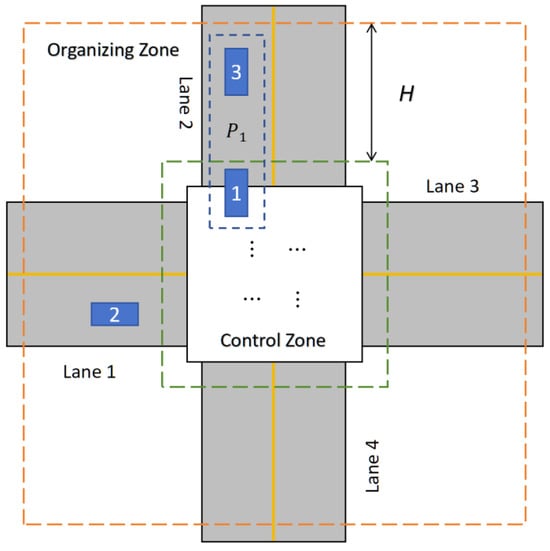
Figure 7.
Scenario where unnecessary updates may occur.
To mitigate this challenge, we have developed a PFA. This algorithm’s essence lies in facilitating CAVs entering the MZ one after another within a single organizing segment to organize and sustain an orderly platoon. With this approach, even after the leading vehicle exits the OZ, the succeeding vehicles within the platoon can proceed into the MZ in a predetermined sequence, effectively minimizing the need for unnecessary updates to the crossing sequence. This strategic measure averts superfluous collision avoidance costs, resulting in a significant reduction in travel delays experienced by CAVs.
Specifically, if the organizing segment identifier in is the same as the organizing segment identifier in , then CAV will join the platoon where CAV is located, forming the platoon vector . A platoon can accommodate multiple CAVs. If the organizing segment identifier in is different from the organizing segment identifier in , then CAV will be unable to join platoon and will instead form a new platoon .
In Algorithm 2, is the number of platoon vectors, and . The obtained set constitutes a crossing sequence of CAV platoons, achieving minimization of travel delays for CAVs. When the lead vehicle in platoon exits the OZ, all CAVs in platoon are removed from and no longer participate in the PFA.
| Algorithm 2 Platoon Forming Algorithm |
| 1. Input: . 2. Generate the initial platoon , where the initial platoon vector , and the initial platoon label . 3. For in range (2, ) do If the identifier in is the same as the identifier in then add to platoon vector . Else add to platoon vector . add platoon vector to . , generate platoon , add to platoon vector . End if End for 4. . 5. Output: , . |
4. Decentralized Energy-Optimal Control Framework for Solving TOP
In this section, we persist in employing the decentralized energy-optimal control framework [9] and enhance the current recursive algorithm for the MZ arrival time to accommodate the requirement for CAV platoons. This endeavor is geared toward establishing the requisite temporal constraints for the energy-optimal control problem (13) transformed from the TOP. Following this, through the application of Hamiltonian functions [19] to address (13), we derive the optimal control input within the interval , thus effectively tackling the TOP.
4.1. Arrival Time Recursion Algorithm for CAV Platoons
Since CAV and CAV inevitably enter the MZ consecutively, is always determined recursively through and [8]. Therefore, obtaining is crucial for deducing the arrival time of subsequent CAVs at the MZ. For the CAV that enters the MZ first, it is evident that the optimal solution to problem (13) is because CAV does not need to evade any other CAVs. To address the new demand for CAV platoons, we have made corresponding improvements to the algorithm. Since the CAVs in platoon travel on the same lane, once the arrival time of the lead vehicle CAV in is determined, the entry times of the other CAVs in can be easily obtained by shifting them on the time scale . Similarly, for adjacent platoon and , only the collision avoidance cost between the lead vehicle of and the trailing vehicle of needs to be considered. Ultimately, through the Algorithm 3, we can obtain the controllable arrival times at the MZ for all CAVs.
| Algorithm 3 Arrival Time Recursion Algorithm for CAV Platoons |
| 1. Input: , the number of CAVs within each platoon vector , denoted as , along with the collision avoidance cost between any two CAV and . 2. For in range (1, ) do If then . arrival time of the lead vehicle in at the MZ . arrival time of the lead vehicle in at the CZ . Else . End if End for 3. arrival time of the trailing vehicle in at the MZ . 4. For in range (2, ) do For in range(, ) do If then + . arrival time of the lead vehicle in at the MZ . arrival time of the lead vehicle in at the CZ . Else . End if End for arrival time of the trailing vehicle in at the MZ . End for 5. Output: The arrival time of all CAVs at the MZ. |
4.2. Solution for Energy-Optimal Control Problem
The integration of the energy-optimal control problem (13) with the vehicle dynamic constraint (10) and the velocity and control input constraint (11) facilitates the derivation of Hamiltonian functions for each CAV [19]:
where (t) and denote the costates, and , , , and are the Lagrange multipliers. The Hamiltonian functions are divided into seven cases depending on whether different control inputs and velocities satisfy the boundary conditions (i.e., whether they attain , , , ). More specifically, the seven cases are as follows [9]:
- Control and State Constraints not Active, , , , .
- Control Constraints Active, .
- Control and State Constraints Active, , .
- Control Constraints Active,
- Control and State Constraints Active, , .
- State Constraints Active, .
- State Constraints Active, .
Based on the statistical data presented in reference [9], the case in which neither control constraints nor state constraints are active exerts a significant influence on the driving process of the CAVs, rendering them pivotal for investigating the control input functions. In such a case, , and the Hamiltonian functions are transformed into the following [9]:
The costates transform into the following [9]:
The extremum condition is as follows [9]:
By Equation (17), it can be readily inferred that and , where and are integral constants. Thus, the optimal control input is as follows [9]:
According to the second-order vehicle dynamics (10) relationship, we can derive the following [9]:
In our strategy, CAV will maintain a constant speed while traversing MZ after entering. Therefore, the boundary conditions of the costates are: . Then, the three equations derived from substituting the provided initial and final state constraints (14) into (20) and (21) are: , , , where is the distance from the entrance of the CZ to the entrance of the MZ. The simultaneous representation of these four equations in matrix form is as follows [9]:
Solving (22) will provide the values of , , , and .
5. Results and Discussion
The research utilized the Python language and the Traci toolkit to conduct simulation experiments on intersection traffic scenarios, interfacing with the traffic simulator SUMO, creating models for both a conventional signalized intersection and signal-free intersection. In the conventional signalized intersection model, the duration of the green light was set to 62 s, while the yellow light lasted for 3 s. For the simulation of the signal-free intersection, the FIFO strategy, LDR strategy, and our newly devised DRP strategy were employed. Moreover, the study employed the 2010 Toyota Prius CAV model, which encompasses an Internal Combustion Engine (ICE), two electric Motors/Generators (MG1 and MG2), a Planetary Gear Train (PGT), and a battery [25]. To emulate real traffic conditions, vehicle arrivals were assumed to follow a Poisson process, with four different arrival rates established to simulate various traffic demands. By comparing the driving performance and fairness of CAVs under different strategies, the merits and drawbacks of each strategy were scrutinized. To mitigate the influence of stochastic factors, each scenario underwent simulation for a duration of 15 min.
Performance metric 1, denoted as the travel delay of CAV , reflects the performance of the strategy in terms of traffic efficiency. It is defined as follows:
The term denotes the minimum time required for CAV to reach the MZ while traveling at and within the CZ.
Performance metric 2, referred to as fuel consumption of CAV , elucidates the strategy’s efficacy concerning energy efficiency. It is derived by computing the definite integral of the fuel consumption rate function over the interval . It is pertinent to acknowledge that the fuel consumption of HEVs encompasses not solely the fuel consumption of the internal combustion engine but also the commensurate fuel consumption of the electric motors:
The fuel consumption rate is contingent upon the velocity and power of the vehicle, and is defined as follows [25]:
The equivalent fuel consumption rate of the 2010 Toyota Prius in EV mode, denoted as , represents a key parameter. Here, signifies the instantaneous power of CAV , while denotes the maximum power achievable in EV mode, and stands for the maximum velocity attainable in EV mode. When is negative or falls below with power lower than , the HEV transitions to EV mode. We adopted the parameters summarized from the experiments conducted by researchers, as documented in reference [25], where the specific values for and of the 2010 Toyota Prius are 32 km/h and 10 kW, respectively, with set at 0.006. Additionally, the coefficients , , , and were determined to be 0.006, 0.003998, 0.077092, and −9.155 × 10⁻⁵. Researchers have elucidated the relationship between , , and in reference [26]:
We designated the mass of the Toyota Prius as kg, the gravitational acceleration as 9.8066 m/s2, and the road slope as 0. The parameters for rolling resistance, denoted as , , and , are assigned values of 1.75, 0.0328, and 4.575, respectively, and are subject to variation based on factors such as road surface type, road conditions, and vehicle tire type. The air mass density, represented as , is 1.2256 kg/m3, while the frontal projection area of the Prius, identified as , measures 2.3316 m2. Additionally, the aerodynamic drag coefficient is determined to be 0.28 [26].
As a result of the resequencing strategy modifying the sequence of CAVs entering the MZ, the trip duration of CAVs is prolonged. Recognizing the potential for this alteration to raise fairness concerns among drivers, we will also assess the fairness of each strategy. The fairness metric, symbolized as , is delineated as follows:
symbolizes the aggregate count of CAVs during 15 min, while signifies the mean trip duration of all CAVs. A heightened value suggests diminished fairness.
5.1. Comparison of Driving Performance
In this experimental setup, we standardized the length of the OZ at 80 m and the CZ at 170 m, maintaining uniform arrival rates across all four lane entrances. To evaluate the efficacy of the four strategies across varying traffic demands, we systematically escalated the arrival rate from 160 veh/h/lane to 800 veh/h/lane, leveraging the arrival rate values outlined in reference [11]. In our scenario of high traffic demand, where the arrival rate exceeds that of reference [11], it provides a better indication of the performance of cooperative driving strategies, particularly under extreme circumstances. When contrasting with the traffic light strategy, we categorize the FIFO, LDR, and DRP strategies collectively as cooperative driving strategies. Following a 15 min simulation period, we meticulously collected and organized data on the average travel delay and fuel consumption for all CAVs across the four strategies. These findings are detailed in Table 1 and visually depicted in Figure 8.

Table 1.
Data on the average travel delay and average fuel consumption of different driving strategies under different arrival rates.
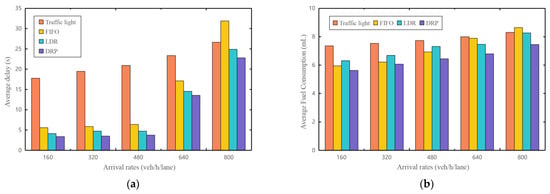
Figure 8.
Average travel delay (a) and average fuel consumption (b) of different driving strategies under different arrival rates.
Analysis of the data presented in Table 1 reveals that cooperative driving strategies, when compared to traditional traffic light strategy, can notably diminish average travel delay by up to 82.1% under lower traffic demands, ranging from 160 veh/h/lane to 480 veh/h/lane, thus significantly augmenting traffic efficiency. The conventional traffic light strategy, rooted in fixed time cycles aimed at coordinating conflicting traffic flows, frequently impose unnecessary waiting times on CAVs, even under low-density traffic scenarios, thereby culminating in intersection delays. Furthermore, the average travel delay metrics for the DRP strategy are inferior to those of the LDR and FIFO strategies, thereby substantiating the superior efficacy of the DRP strategy in enhancing traffic efficiency. Moreover, cooperative driving strategies evince a superior energy economy performance relative to the conventional traffic light strategy, resulting in potential savings of approximately 19.84% in average fuel consumption. Nonetheless, it is imperative to note that this efficiency gain is marginally lower compared to the fuel consumption reductions observed when cooperative driving strategies are applied to fuel vehicles, amounting to approximately 46.6%. This discrepancy primarily arises from the continuous operation of fuel vehicle engines during traffic signal stops, leading to additional fuel consumption. In contrast, HEV vehicles incorporate an EV mode where the engine shuts off during traffic signal stops. Thus, despite reducing CAVs’ waiting times, fuel consumption reductions are not significant. Figure 9 delineates the acceleration and fuel consumption rate curve of a CAV encountering a red light [27,28,29,30]. Detailed scrutiny reveals that CAVs facing red lights necessitate braking to a complete stop and subsequent acceleration to the desired velocity upon the green light’s appearance, thereby engendering frequent acceleration and deceleration cycles that elevate fuel consumption. Consequently, the emphasis of cooperative driving strategies on coordinating CAVs to curtail unnecessary acceleration and deceleration elucidates the superior energy economy performance of the DRP strategy compared to the LDR and FIFO strategies. The latter two evince weaker capabilities in coordinating conflicting CAVs, necessitating more frequent modulation of CAVs’ velocity changes, thereby amplifying fuel consumption. Finally, we assess the efficiency of the crossing sequence by examining the frequency of emergency braking per minute. Under conditions of lower traffic demands, this metric tends toward zero across all cooperative driving strategies except for the LDR strategy. Analysis indicates that the frequent revision of the crossing sequence by the LDR strategy is the primary driver of this trend. Conversely, the DRP strategy addresses this issue by centralizing enhancements to the CSP and integrating platooning algorithms.
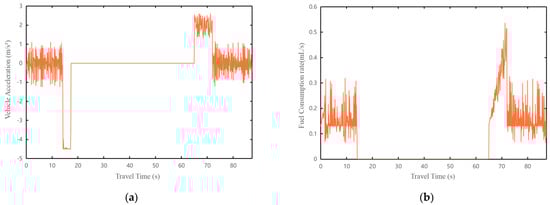
Figure 9.
Acceleration (a) and fuel consumption rate (b) for a CAV encountering red lights.
In conditions of moderate traffic demands (640 veh/h/lane), cooperative driving strategies demonstrate a 41.89% decrease in average travel delay compared to the traffic light strategy, indicating a slightly reduced improvement compared to lower traffic demands. This reduction primarily arises from the escalating expense of collision avoidance as the number of CAVs within the intersection area increases. To circumvent collision incidents, CAVs progressively delay their arrival time at the MZ, thereby incurring additional average travel delay. In this context, the average travel delay data for the DRP strategy are lower than those of the LDR and FIFO strategies, signifying the superior performance of the DRP strategy in mitigating collision avoidance costs. Moreover, cooperative driving strategies show a diminished potential for savings in average fuel consumption compared to the traffic light strategy, declining to 15.16%. This phenomenon is ascribed to the necessity for more frequent modulation of CAV velocity changes to avoid collisions, resulting in increased fuel consumption. Moreover, the incidence of emergency braking incidents rises for cooperative driving strategies. Analysis indicates that as the quantity of CAVs within the intersection area increases, the complexity of computing the optimal crossing sequence also escalates. Nonetheless, the DRP strategy consistently registers the lowest number of incidents, underscoring that the crossing sequence derived from this strategy outperforms those of the other two strategies.
In scenarios characterized by higher traffic demands (800 veh/h/lane), the performance of the FIFO strategy significantly deteriorates, with a 19.55% increase in average travel delay and a 4.06% increase in average fuel consumption. This outcome underscores the capacity constraint of the FIFO strategy, representing a bottleneck to further enhancing traffic efficiency and optimizing energy economy. Conversely, the DRP and LDR strategies persist in reducing average travel delay and lowering average fuel consumption. Particularly notable is the more pronounced effect of the DRP strategy in reducing travel delay and fuel consumption, thereby validating its superiority over the LDR strategy in improving traffic efficiency and optimizing energy economy. Additionally, the order of emergency braking incidents for cooperative driving strategies is similar to that observed under moderate traffic demand, leading to the same conclusion: the crossing sequence obtained from the DRP strategy outperforms those of the other two strategies.
5.2. Comparison of Fairness
During the experimentation outlined in Section 5.1, aside from collating data pertaining to the average travel delay and average fuel consumption of CAVs, we also amassed fairness metrics for the four strategies. These metrics have been delineated in Table 2 and graphically depicted in Figure 10.
Table 2.
Data on the fairness indicator of different driving strategies under different arrival rates.
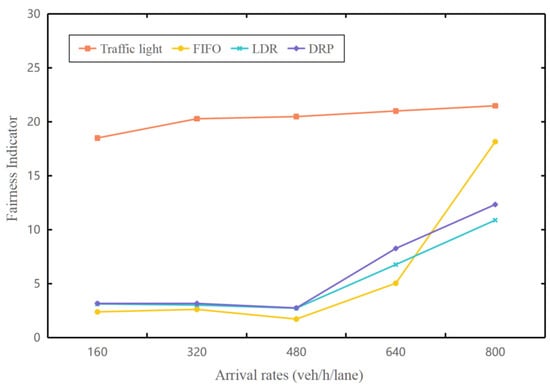
Figure 10.
The fairness indicator of different driving strategies under different arrival rates.
In line with the findings from the analysis of driving performance, under scenarios of moderate to low traffic demands, cooperative driving strategies also demonstrate significant enhancements in fairness compared to the traffic light strategy. However, unlike in the evaluation of driving performance, both the DRP and LDR strategies marginally trail behind the FIFO strategy in terms of fairness. This discrepancy primarily stems from the inclination of resequencing strategies to prioritize non-conflicting CAVs with lower collision avoidance costs for intersection passage. While conflicts among CAVs on the same or opposing lanes remain minor, congestion tends to dissipate more readily but may exacerbate in other lanes. Furthermore, the DRP strategy, through the incorporation of platooning algorithms, exhibits a greater propensity to prioritize CAV passage on the same or opposing lanes. In the assessment of cooperative driving strategies, its fairness performance ranks third. However, it is important to note that across five different traffic demands, the fairness indicator of the DRP strategy trails the top-ranked strategy by only 0.72 s, 0.49 s, 1.03 s, 3.23 s, and 1.35 s, respectively. In Table 1, under the same five traffic demands, the DRP strategy surpasses these strategies by reducing the time by 2.17 s, 2.32 s, 2.61 s, 3.53 s, and 2.14 s, respectively. This suggests that, when considering both overall driving performance and fairness, the DRP strategy maintains an advantage over other strategies.
It is noteworthy that, under higher traffic demands, the fairness performance of the LDR and DRP strategies surpasses that of the FIFO strategy. To delve deeper into this phenomenon, we conducted a detailed analysis and visualized the comparison of trip durations for 90 CAVs under the FIFO, LDR, and DRP strategies when the arrival rate is 800 veh/h/lane in Figure 11. From the graph, it is evident that, under the FIFO strategy, the trip duration for CAVs after ID 61 exceeds 70 s, with some even reaching up to 100 s. This accumulation occurs due to the substantial buildup of CAVs within the intersection, highlighting the inefficacy of the FIFO strategy in coordinating CAVs’ departure from the intersection, resulting in severe traffic congestion. In contrast, the trip durations of CAVs under the LDR and DRP strategies remain within 60 s. This indicates that enhancing the traffic coordination capability of strategies to mitigate traffic congestion may not necessarily conflict with improving fairness, particularly under high traffic demands.
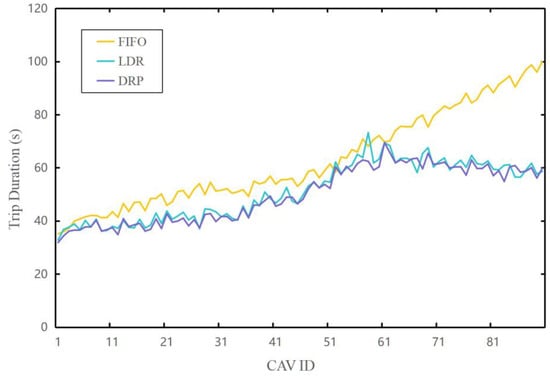
Figure 11.
The trip duration of CAVs under different driving strategies at arrival rates of 800 veh/h/lane.
6. Conclusions
This research established a centralized model for the CSP and TOP concerning CAVs. An advanced RA approach grounded on state transition networks was proposed and fused with a PFA to formulate the RPA. The objective was to achieve the global optimal solution of the centralized CSP within a finite time. Additionally, an enhanced controllable arrival time recursive algorithm tailored for CAV platoons was developed to impose time constraints on the energy-optimal control problem, effectively tackling the TOP. Subsequently, these novel algorithms were integrated to introduce an innovative strategy—the DRP strategy. To validate the efficacy of this strategy, we conducted integrated simulations of symmetrical intersections across diverse traffic demands using Python 3.10.7, Traci 1.19.0, and SUMO 1.19.0. The performance and fairness of CAVs under diverse driving strategies were evaluated. Findings indicated that the DRP strategy outperformed others significantly in terms of driving performance, exhibiting reduced travel delay and fuel consumption. However, concerning fairness, the DRP strategy showed a marginally inferior performance. This was ascribed to the influence of frequent adjustments in CAV passing sequences on fairness. Nonetheless, experiments also suggest that, in situations of heightened traffic demand, strategies endowed with augmented traffic coordination capabilities can alleviate traffic congestion while concurrently upholding fairness from an alternative standpoint. Furthermore, it was noted that cooperative driving strategies were more proficient in enhancing energy efficiency compared to the traffic light strategy. This was chiefly attributed to the mitigation of intense acceleration and deceleration during start–stop scenarios. This observation offers valuable insights for further enhancing the energy efficiency of CAVs.
The primary limitation of this study lies in its focus on the analysis of single-lane, one-way symmetric intersection scenarios. However, the conclusions drawn have the potential to be extended to multi-lane intersections and scenarios involving turning maneuvers by CAVs. Additionally, earlier discussions have revealed that there is still room for improvement in terms of fairness with regard to the DRP strategy. Subsequent research endeavors could explore strategies for striking a balance between driving performance and fairness within the DRP strategy and devise mathematical frameworks to quantitatively assess the equilibrium between these factors. Such endeavors would serve to augment drivers’ contentment with traffic control systems and intersection layouts, thus fostering progress in the realm of intelligent transportation systems.
Author Contributions
Conceptualization, J.G.; methodology, J.G. and J.T.; software, J.G.; validation, J.G.; formal analysis, J.G. and J.T.; investigation, J.G.; resources, J.G. and L.G.; data curation, J.G.; writing—original draft preparation, J.G. and J.T.; writing—review and editing, J.G., J.T., L.G., and Y.Z.; visualization, J.G. and Y.Z.; supervision, J.T. and L.G.; project administration, J.T.; funding acquisition, Y.Z. All authors have read and agreed to the published version of the manuscript.
Funding
This research received partial support from the Natural Science Foundation of Shanghai (Grant No. 17ZR1411900) and the Industry-University-Research Innovation Funds for Chinese Universities (Grant No. 2021ZYB01003).
Data Availability Statement
Data are contained within the article.
Conflicts of Interest
The authors declare no conflicts of interest.
References
- De Schutter, B.; De Moor, B. Optimal Traffic Light Control for a Single Intersection. Eur. J. Control 1998, 4, 260–276. [Google Scholar] [CrossRef]
- Shirke, C.; Sabar, N.; Chung, E.; Bhaskar, A. Metaheuristic Approach for Designing Robust Traffic Signal Timings to Effectively Serve Varying Traffic Demand. J. Intell. Transp. Syst. 2022, 26, 343–355. [Google Scholar] [CrossRef]
- Guo, Q.; Li, L.; (Jeff) Ban, X. Urban Traffic Signal Control with Connected and Automated Vehicles: A Survey. Transp. Res. Part C Emerg. Technol. 2019, 101, 313–334. [Google Scholar] [CrossRef]
- Ahmed, H.U.; Huang, Y.; Lu, P.; Bridgelall, R. Technology Developments and Impacts of Connected and Autonomous Vehicles: An Overview. Smart Cities 2022, 5, 382–404. [Google Scholar] [CrossRef]
- Rahman, M.H.; Abdel-Aty, M.; Wu, Y. A Multi-Vehicle Communication System to Assess the Safety and Mobility of Connected and Automated Vehicles. Transp. Res. Part C Emerg. Technol. 2021, 124, 102887. [Google Scholar] [CrossRef]
- Deng, Z.; Shi, Y.; Han, Q.; Lv, L.; Shen, W. A Conflict Duration Graph-Based Coordination Method for Connected and Automated Vehicles at Signal-Free Intersections. Appl. Sci. 2020, 10, 6223. [Google Scholar] [CrossRef]
- Zhang, K.; Fortelle, A. Analysis and modeled design of one state-driven autonomous passing-through algorithm for driverless vehicles at intersections. In Proceedings of the 16th IEEE International Conference on Computational Science and Engineering, Sydney, Australia, 3–5 December 2013; pp. 751–757. [Google Scholar]
- Zhang, Y.J.; Malikopoulos, A.A.; Cassandras, C.G. Optimal Control and Coordination of Connected and Automated Vehicles at Urban Traffic Intersections. In Proceedings of the 2016 American Control Conference (ACC), Boston, MA, USA, 6–8 July 2016; pp. 6227–6232. [Google Scholar]
- Malikopoulos, A.A.; Cassandras, C.G.; Zhang, Y.J. A Decentralized Energy-Optimal Control Framework for Connected Automated Vehicles at Signal-Free Intersections. Automatica 2018, 93, 244–256. [Google Scholar] [CrossRef]
- Makridis, M.; Mattas, K.; Ciuffo, B. Response Time and Time Headway of an Adaptive Cruise Control. An Empirical Characterization and Potential Impacts on Road Capacity. IEEE Trans. Intell. Transp. Syst. 2020, 21, 1677–1686. [Google Scholar] [CrossRef]
- Xu, H.; Cassandras, C.G.; Li, L.; Zhang, Y. Comparison of Cooperative Driving Strategies for CAVs at Signal-Free Intersections. IEEE Trans. Intell. Transp. Syst. 2022, 23, 7614–7627. [Google Scholar] [CrossRef]
- Zhang, Y.; Cassandras, C.G. A Decentralized Optimal Control Framework for Connected Automated Vehicles at Urban Intersections with Dynamic Resequencing. In Proceedings of the 2018 IEEE Conference on Decision and Control (CDC), Miami, FL, USA, 17–19 December 2018; pp. 217–222. [Google Scholar]
- Chalaki, B.; Malikopoulos, A.A. A Priority-Aware Replanning and Resequencing Framework for Coordination of Connected and Automated Vehicles. IEEE Control Syst. Lett. 2022, 6, 1772–1777. [Google Scholar] [CrossRef]
- Gong, D.; Zhao, Y.; Li, Y.; Gong, J.; Zhao, H.; Ding, L. Multilane Signal-Free Intersection Cooperation Scheme for Connected and Automated Vehicles with Local Dynamic Resequencing Strategy. J. Transp. Eng. A Syst. 2023, 149, 04023085. [Google Scholar] [CrossRef]
- Kuendee, P.; Janjarassuk, U. A Comparative Study of Mixed-Integer Linear Programming and Genetic Algorithms for Solving Binary Problems. In Proceedings of the 2018 5th International Conference on Industrial Engineering and Applications (ICIEA), Singapore, 26–28 April 2018; pp. 284–288. [Google Scholar]
- Hong, S.; Han, J.; Choi, J.Y.; Lee, K. Accelerated Dynamic Programming Algorithms for a Car Resequencing Problem in Automotive Paint Shops. Appl. Math. Model. 2018, 64, 285–297. [Google Scholar] [CrossRef]
- Timmerman, R.W.; Boon, M.A.A. Platoon Forming Algorithms for Intelligent Street Intersections. Transportmetr. A Transp. Sci. 2021, 17, 278–307. [Google Scholar] [CrossRef]
- Xu, K.; Cassandras, C.G.; Xiao, W. Decentralized Time and Energy-Optimal Control of Connected and Automated Vehicles in a Roundabout. In Proceedings of the 2021 IEEE International Intelligent Transportation Systems Conference (ITSC), Indianapolis, IN, USA, 19–22 September 2021; pp. 681–686. [Google Scholar]
- Jiang, S.; Pan, T.; Zhong, R.; Chen, C.; Li, X.; Wang, S. Coordination of Mixed Platoons and Eco-Driving Strategy for a Signal-Free Intersection. IEEE Trans. Intell. Transp. Syst. 2023, 24, 6597–6613. [Google Scholar] [CrossRef]
- Zhou, A.; Peeta, S.; Yang, M.; Wang, J. Cooperative Signal-Free Intersection Control Using Virtual Platooning and Traffic Flow Regulation. Transp. Res. Part C Emerg. Technol. 2022, 138, 103610. [Google Scholar] [CrossRef]
- Asaithambi, G.; Shravani, G. Overtaking Behaviour of Vehicles on Undivided Roads in Non-Lane Based Mixed Traffic Conditions. J. Traffic Transp. Eng. 2017, 4, 252–261. [Google Scholar] [CrossRef]
- Harper, C.D.; Hendrickson, C.T.; Samaras, C. Cost and Benefit Estimates of Partially-Automated Vehicle Collision Avoidance Technologies. Accid. Anal. Prev. 2016, 95, 104–115. [Google Scholar] [CrossRef]
- Malikopoulos, A.A. Stochastic Optimal Control for Series Hybrid Electric Vehicles. In Proceedings of the 2013 American Control Conference, Washington, DC, USA, 17–19 June 2013; pp. 1189–1194. [Google Scholar]
- Rios-Torres, J.; Malikopoulos, A.A. Automated and Cooperative Vehicle Merging at Highway On-Ramps. IEEE Trans. Intell. Transp. Syst. 2017, 18, 780–789. [Google Scholar] [CrossRef]
- Ahn, K.; Rakha, H. A Simple Hybrid Electric Vehicle Fuel Consumption Model for Transportation Applications. In Applied Electromechanical Devices and Machines for Electric Mobility Solutions; El-Shahat, A., Ruba, M., Eds.; IntechOpen: London, UK, 2020; pp. 113–128. ISBN 978-1-78985-727-6. [Google Scholar]
- Fiori, C.; Ahn, K.; Rakha, H.A. Power-Based Electric Vehicle Energy Consumption Model: Model Development and Validation. Appl. Energy 2016, 168, 257–268. [Google Scholar] [CrossRef]
- Zhang, Y.; Yu, L.; Fang, Z.; Xiong, N.N.; Zhang, L.; Tian, H. An End-to-End Deep Learning Model for Robust Smooth Filtering Identification. Future Gener. Comput. Syst. 2022, 127, 263–275. [Google Scholar] [CrossRef]
- Zhang, Y.; Liu, T.; Cattani, C.; Cui, Q.; Liu, S. Diffusion-Based Image Inpainting Forensics via Weighted Least Squares Filtering Enhancement. Multimed. Tools Appl. 2021, 80, 30725–30739. [Google Scholar] [CrossRef]
- Zhang, Y.; Li, S.; Wang, S.; Shi, Y.Q. Revealing the Traces of Median Filtering Using High-Order Local Ternary Patterns. IEEE Signal Process. Lett. 2014, 21, 275–279. [Google Scholar] [CrossRef]
- Zhang, Y.; Song, W.; Wu, F.; Han, H.; Zhang, L. Revealing the Traces of Nonaligned Double JPEG Compression in Digital Images. Optik 2020, 204, 164196. [Google Scholar] [CrossRef]
Disclaimer/Publisher’s Note: The statements, opinions and data contained in all publications are solely those of the individual author(s) and contributor(s) and not of MDPI and/or the editor(s). MDPI and/or the editor(s) disclaim responsibility for any injury to people or property resulting from any ideas, methods, instructions or products referred to in the content. |
© 2024 by the authors. Licensee MDPI, Basel, Switzerland. This article is an open access article distributed under the terms and conditions of the Creative Commons Attribution (CC BY) license (https://creativecommons.org/licenses/by/4.0/).