Review

Hub Airport End-Around Taxiway Construction Planning Development: A Review

by
Xiaoxi Jiang
1,2,* and
Peiwen Hao
1
1
School of Highway, Chang′an University, Xi′an 710064, China
2
China Airport Planning & Design Institute Co., Ltd., Beijing 101312, China
*
Author to whom correspondence should be addressed.
Appl. Sci. 2024, 14(8), 3500; https://doi.org/10.3390/app14083500
Submission received: 22 February 2024 / Revised: 7 April 2024 / Accepted: 17 April 2024 / Published: 21 April 2024
(This article belongs to the Special Issue Advances in Civil Infrastructures Engineering)

Abstract

:
Hub airports typically have multiple parallel runways, requiring aircraft to transfer between them. This increases the risk of runway incursions. End-around taxiways (EATs) mitigate such risk by enabling bypassing without runway crossings. This review summarizes 15 EAT layouts worldwide and presents two classification methods: by configuration (N-type, M-type, Large N-type) and by operational relationship with runways (back-around, runway end-around, start-around). The key benefits of EATs were manifold, including the reduction of runway incursions, controller workload, and delays while improving communication safety, capacity, and efficiency. However, drawbacks such as increased land use, construction costs, and potentially longer taxi times and distances should be considered. Therefore, the optimization of the EAT layout is essential. In pursuit of optimal design, considerations should encompass limiting obstacle surfaces, flight procedures, navigation/lighting facilities, jet blast, and visual obstructions from end-around aircraft to departing aircraft. Notably, challenges arise in reducing distances between EATs and thresholds/ends. The given solutions include displacing thresholds, creating “sunken” lowered elevation EATs, and utilizing terrain shielding instead of metallic visual screens. A case study was introduced to demonstrate the successful improvement of the EAT via sunken EATs and terrain shielding at Guiyang Airport. The conclusion encourages further optimization of EAT layouts that balance safety and efficiency.

1. Introduction

Layouts of hub airports have evolved from the initial cross runways to multiple sets of parallel runways. It generally includes one or more groups of runways with a distance of less than 760 m, allowing for segregated parallel operations or independent parallel departures. Aircraft are usually assigned to use the inboard runways to take off and the outboard runways to land. Consequently, aircraft need to transfer between different runways during their operations. Initially, transfers mostly relied on runway crossings. However, runway crossings not only elevate the risk of runway incursions [1,2] but also undermine airport capacity [3]. To address these challenges, several major international hubs such as Dallas, Atlanta, Detroit, Miami, and Frankfurt adopted the construction of end-around taxiways (EATs) in Europe and America during the early 20th century. More recently, hubs like Istanbul Airport, Singapore Changi, and others in Asia have also incorporated these taxiways into their infrastructure.
In China, according to the airport master plans approved by the Civil Aviation Administration of China in recent years, several airports, including Xi’an Xianyang International Airport (XIY), Jinan Yaoqiang International Airport (TNA), Guangzhou Baiyun International Airport (CAN), Beijing Daxing International Airport (PKX), Hangzhou Xiaoshan International Airport (HGH), Shanghai Pudong International Airport (PVG), and many others, are planning to construct multiple sets of parallel runways and EATs.
Previous studies have suggested that the implementation of EATs could enhance airport safety by eliminating runway crossings [4].
EATs have two primary impacts on airport efficiency. While they theoretically enhance runway capacity by reducing runway occupancy times, actual capacity gains depend on operational factors like arrival and departure intervals [5]. Studies on airports like DFW, ATL, and DTW show significant variations in actual taxi times with EATs compared to conventional taxiing [6,7]. Excessively long travel distances inflate taxi times, while substantial land use and construction costs add concerns. Consequently, after initial projects, major US and European hubs paused EAT development in the late 1900s, with some master plans deferring proposals [8].
However, recent brisk aviation growth in certain markets like China renews the impetus for EAT construction. The increase in runway incursions from runway crossings has prompted airport planners to reconsider EATs [9,10,11]. The Federal Aviation Administration (FAA) awarded grants of more than $1.0 billion for more safety projects under the Airport Improvement Program. These projects include new plans to construct new taxiways to enhance safety on the airfield [12].
This study aims to inspire airport operators and researchers to explore innovative planning and construction methods for EATs in the future.
  • The primary objective of this study is to comprehensively summarize the construction and operational status of end-around taxiways across the globe. We categorize existing end-around taxiway layouts, summarize the benefits of those in operation, and highlight their contributions to enhancing airport safety and runway operational efficiency. Furthermore, we delve into the recognized limitations of end-around taxiways, including increased land utilization, construction costs, and potential decrements in taxiing efficiency, drawing insights from the operational experiences of airports equipped with such taxiways.
  • Moreover, the study aims to propose refined design methodologies for end-around taxiways. We outline the key design considerations and factors for end-around taxiway designs in diverse operational modes, with a particular focus on minimizing the lengths of end-around taxiways (EATs). Our goal is to devise an end-around taxiway design that offers the shortest possible detour distance, supported by relevant case studies as illustrative examples.

2. Research Methodology and Literature Review

2.1. Research Methodology

The search strategy and the implementation of the review followed the flow diagram (Figure 1).
The authors initially surveyed academic literature on Google Scholar, using the keywords “end-around taxiway” and “bypass taxiway”. It was found that English-language research on this topic was limited, with only a handful of studies focusing on specific airports like DFW, ATL, DTW, and Istanbul Airport. This limitation was attributed to the fact that end-around taxiways are typically found at hub airports with multiple runways, and there are only a few such airports globally. To compensate for this, the authors broadened their search on Google using the same keywords and found additional information from guiding documents, such as those from the FAA and ICAO, regarding the construction of end-around taxiways. A survey was also conducted using the Chinese CNKI Scholar search to explore the situation of end-around taxiway construction in China.
Expert interviews were conducted, and comprehensive information about the 15 existing end-around taxiways worldwide was collected. The layouts of these 15 end-around taxiways varied significantly, resulting in differences in taxiing lengths.
Based on these resources, the authors carried out the following analysis steps:
Firstly, we summarized the operational status, advantages, disadvantages, and limitations of existing end-around taxiways based on the available literature. However, these studies focused on already constructed end-around taxiways. It was proposed that the drawbacks of increased taxiing time and distance caused by end-around taxiways can be mitigated through proper design.
We then classified end-around taxiways using two methods. One was based on the spatial relationship with end-around taxiways, terminals, and runways, categorizing them as N-type, M-type, and large N-type. The other method classified them based on operational flow patterns into three modes: BAT, REAT, and SAT.
Thirdly, reducing the distance between end-around taxiways and runways was identified as a key factor in minimizing taxiing length. The design constraints and considerations for BAT, REAT, and SAT modes were summarized based on FAA and ICAO regulations and relevant studies. For each mode, methods and optimization steps to design the shortest end-around taxiway were proposed. Visual obstructions, a concern for the REAT mode, were also incorporated.
Finally, the end-around taxiway design case at KWE airport was analyzed, applying and validating the proposed methods and principles.

2.2. Contribution of EAT-Reducing Runway Incursions and Enhancing Safety Margins

The EAT was initially introduced to reduce runway crossings. The number of runway crossings is directly related to the number of runway operations [13,14]. When the runway capacity is not yet saturated, landing aircraft can cross using the takeoff aircraft interval [15,16,17,18]. With the increase in peak period operations, more runway crossings become inevitable [19,20,21,22,23]. Although the takeoff interval on the inner runway theoretically meets the crossing time, the inherent safety risks associated with crossing itself require the air traffic control, crossing pilots, and waiting pilots to concentrate at the same time to ensure a successful crossing [19,20,21]. The interactions between aircraft and equipment, controllers, and ground vehicles are complicated, which may lead to high levels of concentration and fatigue for pilots and controllers [24,25,26,27,28,29,30]. Verbal communication commands can also pose risks to communication safety, making human error unavoidable [26,27,28,29,31,32].
In recent years, runway incursions caused by aircraft crossing the runway have occurred frequently. From January to April 2023, 550 runway incursions occurred at US airports [33]. Among them, in January, a B373 was taking off from New York Kennedy Airport while another B777 was crossing the runway. The controller stopped the takeoff in time to avoid accidents [33]. Similar incidents were reported in China as well. At Shanghai Hongqiao Airport (SHA) in October 2016, a tower controller’s negligence led to a near collision between a departing aircraft and an arriving aircraft that was crossing the runway. Later that year, at Shanghai Pudong Airport (PVG), the captain of an arriving flight crossed the runway without authorization from the controller, and just as another flight was preparing to take off, the tower immediately canceled the takeoff [34]. In November 2018, at PVG, a departing flight was on the takeoff runway, and the crew observed an aircraft intruding at the end of the runway and immediately aborted the takeoff [35].
EATs alleviate these issues by allowing pilots to bypass runways without instructions, reducing the workload for both controllers and pilots [36]. This indirectly decreases the possibility of runway incursions caused by human factors [27,28,29]. Evaluation at Dallas–Fort Worth International Airport (DFW) by Dr. Stephen Mattingly and his team showed that EATs reduced runway incursions caused by pilot deviation by 40% at around 50% usage rate [4,37].
Traditionally, EATs were believed to be primarily used during peak hours, while aircraft relied on crossing runways during non-peak hours. However, research shows that this is not necessarily the case.
Researchers conducted six months of data collection using ASDE-X data at Hartsfield–Jackson Atlanta International Airport (ATL). During a typical day in a peak month, EAT was used for most of the day from 9:00 to 23:00, indicating its effectiveness beyond just peak hours. EAT was utilized sufficiently throughout most of the day, and controllers chose to use it when they realized that crossing runways required more attention and decreased efficiency. Therefore, except for the high usage rate during peak hours at 11:00, 16:00, and 20:00, the usage of EAT was relatively balanced between 8:00 and 24:00 [38].
This study illustrates implementing EATs is not only a solution for peak-hour congestion but also an effective choice throughout the day. Controllers’ awareness of their benefits contributed to their widespread utilization, reducing the workload on pilots and controllers and improving communication safety.
Furthermore, a study was conducted on the average usage rates of EATs at DFW, ATL, and Detroit Metropolitan Airport (DTW). The usage of EATs at DFW increased from 35% in 2009 to 55% in 2012 and continued to rise steadily afterward, as shown in Table 1. The all-day usage of EATs at ATL and DTW was also above 50% [34,39,40,41,42].
These findings highlight the increasing importance of EATs in modern airport operations. As the number of flights grows, the workload for pilots and controllers also increases [43], emphasizing the need for efficient alternatives to traditional runway crossing techniques.
Overall, these studies demonstrate the significant benefits of implementing EATs in modern airport operations. By reducing the workload for pilots and controllers, improving efficiency, and enhancing communication safety, EATs have become an essential tool for ensuring safe and effective airport operations.

2.3. Contribution of EAT-Increasing Runway Capacity, Reducing Delay

EATs are essential in providing a clear path from the runway to the apron. They allow arriving aircraft to cross the runway without having to wait for departing aircraft, enabling a continuous flow of departing aircraft and eliminating the need for runway crossings [9,44]. Therefore, EAT routing fundamentally reduces the possibility of runway incursions caused by taxiing. By implementing effective EAT routing, airports can ensure efficient and safe aircraft operations while minimizing potential safety hazards.
The runway capacity at hub airports is extremely valuable, especially during peak hours when it tends to be saturated [45,46]. Reducing the runway occupancy time for crossing can further increase the capacity to a certain extent [47,48]. The controversial issue in constructing EATs based on the assumption of parallel runways with short or medium distances assumes that takeoff intervals meet the crossing demand and no additional departure intervals are required. Therefore, there is no need for a detour, as direct crossing is feasible; the controversial issue is: “Is the construction of the end-around taxiway still necessary”?
Under certain runway infrastructure conditions, the wake turbulence separation often determines the number of aircraft takeoffs and landings per unit time on the airport runway. Since the wake turbulence separation standards directly affect the operational requirements of the runway, it has become one of the most direct key factors for increasing runway system capacity [49]. Therefore, whether the construction of EATs contributes to the growth of runway capacity depends on the takeoff interval.
However, the FAA and ICAO set the approach and landing intervals for countries based on instrument or visual flight and the air traffic control level of the local area. This paper does not conduct in-depth discussions of it, and it only theoretically calculates the crossover times based on the current wake turbulence separation standards at SHA in China.
The following example uses SHA to illustrate the timing for landing aircraft to cross the inner takeoff runway: once the departing aircraft has taken off, the air traffic controller issues the crossing command. In cases where there are sufficient crossing paths and no queuing of crossing aircraft, the total time from crossing to leaving the runway impact area is denoted by T. If T is less than the difference between the separation time t1 of departing aircraft and the time t2 taken for takeoff, then the crossing time requirement is met [50].
T ≤ t1 − t2
T: runway occupancy time for crossing; the time it takes for the crossing aircraft to receive the air traffic control instruction and complete the crossing from start to finish.
t1: wake turbulence separation; the separation time between departing aircraft to prevent wake turbulence. A separation time of 2 min is used for this calculation [51].
t2: takeoff roll time. According to actual measurements and statistics on runways of the same type, the average time required for aircraft of various types to take off from takeoff roll to liftoff is 50 s.
T = L/V + tr
L: crossing distance; the calculation takes the distance between two runway holding positions at Hongqiao Airport and uses 190 m as the value.
V: crossing taxiing speed is taken as 10 knots. Crossing speed is limited in short distances and is not too fast. Taking 10 knots as the crossing speed is conservative but close to reality.
tr: startup time, which is the sum of the reaction time of the controller and pilot and the time for the aircraft to start, is estimated to be 30 s based on experience.
Taking SHA as an example, the crossing probability is calculated. With a calculated T value of 67 s and a time difference between t1 and t2 of only 70 s, this meets the condition for a potential crossing event.
Figure 2 shows the SHA airport layout; 2–3 aircraft can cross the inner runway simultaneously. As runway capacity approaches saturation, a queue of aircraft often accumulates during takeoff peak periods. Once the preceding aircraft takes off and the runway is clear, the next aircraft in line must promptly enter the runway entrance while others wait for their turn to cross the runway. The limited time window available for crossing calls for close cooperation between air traffic controllers, ground pilots, and airborne pilots. Any delay or disruption in any link may jeopardize the runway capacity for takeoff, thereby increasing the risk of runway incursions [10,11].
To mitigate this risk, a new taxiway construction project was launched, and the North-South EAT started operating in 2021. Compared with February 2019, the flight departure punctuality rate has increased by approximately 15% [52]. Currently, around 70% of total aircraft crossing the runway use the EAT, resulting in an increase in hourly capacity during peak hours by two flights [53].
DFW faced capacity saturation issues earlier than other airports, which led to in-depth studies on the use of EATs. After implementing EATs, DFW compared the change in runway capacity before and after construction using ASDE-X and ADS-B data. The results showed a significant improvement in the hourly takeoff capacity during peak hours by approximately 25% and a decrease in takeoff delays by around 37.8% [41,42].
Before construction, many airports used simulation software to compare the efficiency of EATs. However, it is important to note that different simulation results may not be comparable on the same scale before the implementation strategy of EAT has been determined. Nevertheless, these simulations can demonstrate certain effects of EAT construction.
Using a fast-time model, researchers simulated the impact of EAT implementation at Istanbul’s new airport, which included plans for six runways with two EATs currently constructed. Comparing the delay conditions with and without EATs, the length of the takeoff queue was significantly reduced during peak hours by using EATs. In three periods, the length of the takeoff queue decreased from 7/20/30 aircraft to 6/9/12 aircraft. Arrival delays decreased by 34%, and takeoff delays decreased by 68% [5].
Similar simulation results were also observed at Pudong Airport. Researchers used Flexsim software to simulate the usage of EATs during peak hours with 23 incoming flights and an EAT utilization rate of 21.7%. The simulation showed a 3.7% reduction in average taxi time for incoming aircraft during peak hours [21].
This closely spaced parallel runway group has a capacity of 47.59 aircraft per hour under the “inside takeoff outside landing” (runway 16R/34L for takeoff and 16L/34R for landing) mode. After using the EAT, the capacity increased to 51.11 aircraft per hour, with an increase rate of 7.40% [54].
This suggests that when runway capacity reaches saturation, relying solely on spacing between taking-off aircraft may not be sufficient to meet the needs of runway crossings, resulting in additional runway occupancy time [55]. The construction of EATs can significantly increase runway capacity and reduce delay times.
Therefore, it is recommended that airport master plans include plans for EAT land use for hub airports. However, during the early stages of airport development, the benefits of EATs on runway capacity and efficiency may not be significant, while they are more likely to provide benefits in reducing runway incursions. They can be built at a later stage when capacity growth necessitates them.

2.4. Drawbacks or Open Challenges—Possible Increase in Detour Distance and Fuel Consumption/Emissions without Conclusive Results

This paper compares the taxiway length, EAT distance from runway end, and taxiing time under different taxiway layouts at ATL, DTW, and DFW. The taxiing time is based on Nicoletta Fala, Payuna Uday, Tiffany T. Le, and Karen Marais [6,56], and the calculation of taxi time involves measuring the time it takes for an aircraft to taxi from the moment it leaves the runway after landing until it reaches the edge of the apron.Table 2 shows the taxiing time via traditional crossing and via EATs.
The length of the traditional crossing route is not compared, as the traditional crossing taxi route is generally determined by the distance between runways and the distance from the terminal to the runway. Therefore, it is not meaningful to compare different airports. Figure 3 shows an example calculation of EAT length for DTW (Detroit).
The analysis selected and compared the lengths of the most frequently used taxi routes, which also represent the primary usage patterns. Different taxiing usage modes should be considered in the initial design, including whether an aircraft, after landing, can taxi in front of another aircraft about to take off (REAT mode, Section 4.3).
The taxiing speed is piloted by the aircraft operator, and without air traffic control interventions on the EAT, it enables faster movement compared to traditional runway crossings. Our analysis of major hub airports DFW, DTW, and ATL using ASDE-X data has consistently shown EAT taxiing speeds approximately 30% faster, increasing from 10–12 knots to 16–20 knots [38,57].
Therefore, when evaluating taxi times, judging solely on routing distance is insufficient, and the variance in speeds must be weighed, as higher velocity on the EAT offsets additional mileage. Moreover, delays for runway crossings must be factored in, whereas the EAT allows uninterrupted taxiing.
Using the 2006 Houston George Bush Intercontinental Airport (IAH) master plan as a case study, Michael T. McNerney and David Heinold et al. [38,57,58] used the SIMMOD software to simulate the impact of the presence or absence of EAT on taxi-in and taxi-out times. Based on the simulated time impact, the Emissions and Dispersion Modeling System (EDMS) was used to analyze the effects of EAT on different pollutants such as CO, hydrocarbons, and CO2 [58,59]. It was found that EAT had the most significant contribution to reduced CO emissions [59]. However, based on the estimated taxiing distance and speed, the fuel consumption of using EAT was still higher than that of traditional taxiing [60].
In conclusion, the increase in taxiing distance caused by EAT is inevitable, but its fuel consumption and emissions are related to taxiing speed, turning, acceleration, and deceleration. Therefore, definitive conclusions regarding EAT’s fuel and environmental impact remain uncertain. This also brings challenges to the construction of EAT. However, it is worth noting that the difference in taxiing distance using EAT is significant, and therefore, optimizing the layout of EAT may further reduce taxiing distance and benefit fuel consumption and taxiing time.

3. End-Around Taxiways (EATs) around the World

3.1. End-Around Taxiway (EAT) Layouts

There were formerly more end-around taxiways in Europe and the United States, which were mostly constructed in the early 20th century. Frankfurt Airport, Amsterdam, and Atlanta Airport are typical representatives of EATs. However, with advancements in communication and navigation technologies, many airports started adopting alternative measures, such as runway status lights and end liaison channels, to perform bypass functions to reduce the occurrence of runway incursions. The construction of EATs has come to a standstill in these countries.
As the aviation business continued to grow, the utilization of more parallel runways has led to increasingly frequent movements between runways. Without EATs, conflict hotspots persist within parallel or intersecting runway systems. Lighting, navigation, and other facilities can only provide limited reductions.
In recent years, Asian countries have entered a new stage of development and expansion; many Asian countries have constructed EATs and included even more in their airport master plans.
Figure 4 shows the 15 EAT airports that are currently in use worldwide. As shown in Figure 5, the layouts of the EATs in these airports vary from one another. Similar runway configurations have led to the development of similar EATs, such as DFW and SHA, which can be used as a reference for airport planners. The layout mainly refers to the “shape” of the EATs and the distance from EATs to the runway threshold or end. Different layouts result in different traffic lengths and traffic times.
As shown in Figure 6, the length of EAT is closely correlated with the distance from the EAT to the runway threshold or end, which refers to the distance between the end or threshold and the portion of EAT that is perpendicular to the extended runway centerline. This distance has a significant impact on the total length of the taxiway.
The distance depends largely on the design, aircraft type, and obstacle clearance criteria. The taxi time and taxi efficiency are closely related to this distance. Therefore, it is an important factor to consider in the design process. As shown in Figure 5, the minimum runway end distance from EATs can be less than 400 m, which is generally used for taxiing behind the runway flow. The EAT at MIA has the shortest runway end distance of only 350 m.
The distance from the runway end varies, but the trend between this distance and the EAT length is consistent. In EAT design, this distance is dictated primarily by aircraft size and limitations on surfaces and usage patterns, making it a core consideration in EAT layouts.

3.2. More Land Occupation and Higher Construction Costs

Figure 7 illustrates the land occupations of EATs in eight airports, primarily referring to the area beyond the physical ends of runways. The global variations in EAT land occupation are primarily due to differences in planning schemes, which are influenced by factors like height disparities between taxiways and runways, as well as the types of aircraft used. Notably, the land occupation resulting from the inward shift of runway entrances due to EAT construction has been overlooked. In comparison to runway crossings, EATs significantly increase land requirements. Newly constructed airports can allocate adequate land for EATs through comprehensive planning, but operational airports often face a scarcity of space for significant lateral expansion, posing both a drawback and a challenge for EATs. In addition to land usage, the construction costs of EATs are considerable. Besides land acquisition and pavement expenses, aircraft taxiing on EATs must adhere to obstacle clearance standards. In practice, this often necessitates reducing the EAT’s elevation, which increases earthwork and drainage complexities. Some airports have installed stormwater lift stations to divert rainfall from the area between the EAT and the runway [61]. In areas with high groundwater, dewatering systems may be crucial, significantly inflating project budgets.

3.3. End-Around Taxiway Classification

(1) By comparing the layouts of EATs, EATs can be classified into three types: N-type, M-type, and Large N-type, as shown in Table 3.
Both Type N and Type M are typically used for parallel runways with a medium to close distance between them. Aircraft are usually assigned to use the inboard runways for takeoff and the outboard runways for landing [62]. In some airports, during morning peak periods, both runways may be used for takeoff. In this case, the EAT is utilized to dispatch takeoff aircraft without crossing the active runway. M-type is used for the two or more terminal buildings arranged separately on both sides of the parallel runways and an additional branch on the taxiway between the two runways. Takeoff and landing aircraft can come from either terminal area.
The EATs of PEK, SIN, and AMS are referred to as Large N-type in this paper, which is used for the flows between the distant runways (with a distance of more than 760 m). Typically, a main terminal area lies between these runways, and Air Traffic Control (ATC) assigns landing aircraft to the runway nearest to their target gate. However, due to factors like compatibility between runway and aircraft types or the need to maximize runway utilization, aircraft may sometimes land on a runway further from their intended terminal and gate. In such scenarios, utilizing EAT to reach the gate without crossing another runway improves both runways’ efficiency, which is especially crucial for busy airports. Nevertheless, this taxiing method greatly increases both distance and time compared to traditional methods. Therefore, optimizing the taxiway layout through careful design is vital to minimizing taxiing distance and time.
(2) Another classification considers the interaction between aircraft operating on EATs and aircraft taking off or landing on the runway that they may go around. Based on this, EATs can be grouped into three types: Back-Around Taxiways (BATs), Runway End-Around Taxiways (REATs), and Start-Around Taxiways (SATs). This approach is preferred in practical planning and design, as it offers clearer operational guidelines for the taxiway system.
(a) BATs (Back-Around Taxiways) are positioned behind the runway’s takeoff point, ensuring that departing aircraft do not have a visual line of sight with the taxiing plane. The only factor that aircraft on the taxiway need to consider is the potential impact of the jet blast from the departing aircraft. Many airports permit aircraft to cross takeoff runways using entrance taxiways as BATs once departing aircraft have safely taken off or reached a safe distance. This approach necessitates precise spacing between departing flights, leading to additional waiting time. Figure 8 shows the example of typical BAT operation.
A BAT can effectively improve operational efficiency with generally lower construction restrictions and costs.
BATs located behind the takeoff point of the runway eliminate departure interval restrictions for taxiing aircraft. However, landing aircraft must turn around in the opposite direction to follow the BAT, increasing taxi distance, time, and fuel consumption. Airports such as PKX, MIA, and AMS have implemented BATs, achieving notable safety benefits. At airports with a single EAT, such as ATL, the EAT can also be used as a BAT when the runway direction changes. This allows taxiing aircraft to pass safely behind departing ones, albeit at a longer taxi distance and time. Nevertheless, as other EAT configurations offer further detour distance reduction, BAT implementations are becoming less frequent in large airport designs.
(b) REAT (Runway End-Around Taxiway) mode is located in front of the departing runway end and safety zone, also known as “far-end of departing runway around taxiway”. It takes into account factors such as the climb surface and ILS lighting system [6]. REAT is a well-established and safe mode that is currently in use at airports like ATL, DFW, and DTW. Figure 9 shows the example of typical REAT operation.
REAT is the most commonly utilized type, often referred to as an EAT in the academic literature. It is worth noting that taxiways have other uses besides REATs (as previously mentioned). To avoid confusion, this article will refer to this type of maneuver as REAT.
(c) SAT mode: Start-Around Taxiway, also known as “near-end of landing runway around taxiway”, refers to taxiing around before the runway entrance, allowing normal aircraft landings. Figure 10 shows the example of typical SAT operation. Compared with REAT and BAT, the construction of SAT needs to consider more factors such as approach surface, lighting, and navigation. SAT can fulfill the functions of both REAT and BAT, making it a versatile and obstacle-free taxiway option. In the case of a dual parallel runway configuration, the function of the two runways is relatively fixed, with the inner runway only used for takeoff. However, in the case of a dual-terminal area, such as the M-shaped taxiway mode, the future terminal area may involve conversion, a runway previously used for takeoff will be used for landing, or the function of parallel runways is undecided, which requires the ATC to determine the division of labor for takeoff and landing based on meteorology and streamlining [63,64,65,66]. In this case, EAT needs to consider the impact on the approaching aircraft, as well as the approach surface and related ILS and lighting systems.
Initially, considering the effect of SAT on the approaching aircraft, the FAA did not recommend the SAT, but notably, the 2023 draft AC 150/5300-13B—Airport Design provides design guidance for EATs under the approach surface [67].
In practice, the SAT operating mode has been successfully implemented in both PEK and KWE. Its adaptability in runway and flow conversions allows it to be seamlessly integrated as an EAT. Regardless of runway usage or flow selection, SAT can be employed without hesitation. Truly a multi-functional taxiway, SAT simultaneously fulfills the roles of EAT, BAT, and SAT, essentially operating as an unrestricted EAT. ATC can direct pilots to the most convenient route, ensuring swift arrival at the target terminal without delay or additional instructions [36,68,69]. SAT’s implementation has reduced ATC stress and instructions, gaining popularity among controllers and achieving high utilization rates.

4. The Construction Principles and Key Points of End-Around Taxiway Layout

4.1. ICAO and FAA Recommendations for EAT Planning

ICAO has published Standards and Recommended Practices (SARPs) for civil aviation, which are available in 19 annexes. Annex 14 Aerodromes Volume I Aerodrome Design and Operations [70] covers the design requirements for airports, but it does not provide specific guidance on the design of taxiway fillets. The annex only provides a basic definition of taxiway fillets and offers simple design guidance, but it does not cover specific details, so its guidance is limited:
(a)
Sufficient space is required between the landing threshold and the taxiway centerline where it crosses under the approach path to enable the critical taxiing aircraft to pass under the approach without penetrating any approach surface.
(b)
The jet blast impact of aircraft taking off should be considered in consultation with aircraft manufacturers; the extent of take-off thrust should be evaluated when determining the location of a perimeter taxiway.
(c)
The requirement for a runway end safety area, as well as possible interference with landing systems and other navigation aids, should also be taken into account. For example, in the case of an ILS, the perimeter taxiway should be located behind the localizer antenna, not between the localizer antenna and the runway, due to the potential for severe ILS disturbance, noting that this is harder to achieve as the distance between the localizer and the runway increases.
(d)
Human factors and issues should also be taken into account. Appropriate measures should be put in place to assist pilots in distinguishing between aircraft that are crossing the runway and those that are safely on a perimeter taxiway.
FAA AC No 150/5300-13B is a section in the airport design chapter that describes the design requirements for the EAT and the visual obstruction screens used to help pilots distinguish between aircraft on the EAT and those crossing the runway. This is related to earlier studies in the United States on EATs at airports such as ATL, DFW, and DTW.
The Federal Aviation Administration (FAA) in the United States has recommended the following guidelines for the design of end-around taxiway layouts [67]:
(1)
Locate the EAT centerline a minimum of 1500 feet (457 m) from the departure end of the runway.
(2)
The minimum length of that portion of the EAT crossing the extended runway centerline at the minimum distance of 1500 feet (457 m) is equal to the width of the departure surface of the Departure End of Runway (DER).
(3)
Increase the minimum distances as necessary to prevent aircraft tails from penetrating the 40:1 departure surface and any surface identified in FAA Order 8260.3.
a.
Initiate an airspace study for each site to verify that the tail height of the critical design group aircraft operating on the EAT does not penetrate these surfaces.
b.
The airspace study will also confirm compliance with Part 121, §121.189, Airplanes: Turbine Engine Powered: Takeoff Limitations, which requires the net takeoff flight path to clear all obstacles either by a height of at least 35 feet (10.5 m) vertically or by at least 200 feet (61 m) horizontally within the airport boundaries.
c.
In addition to the critical aircraft tail height, the elevation of the stop ends of the runway relative to the elevation of points along the EAT is a factor in determining conformance with clearance criteria.
(4)
Locate the EAT outside of ILS critical areas.
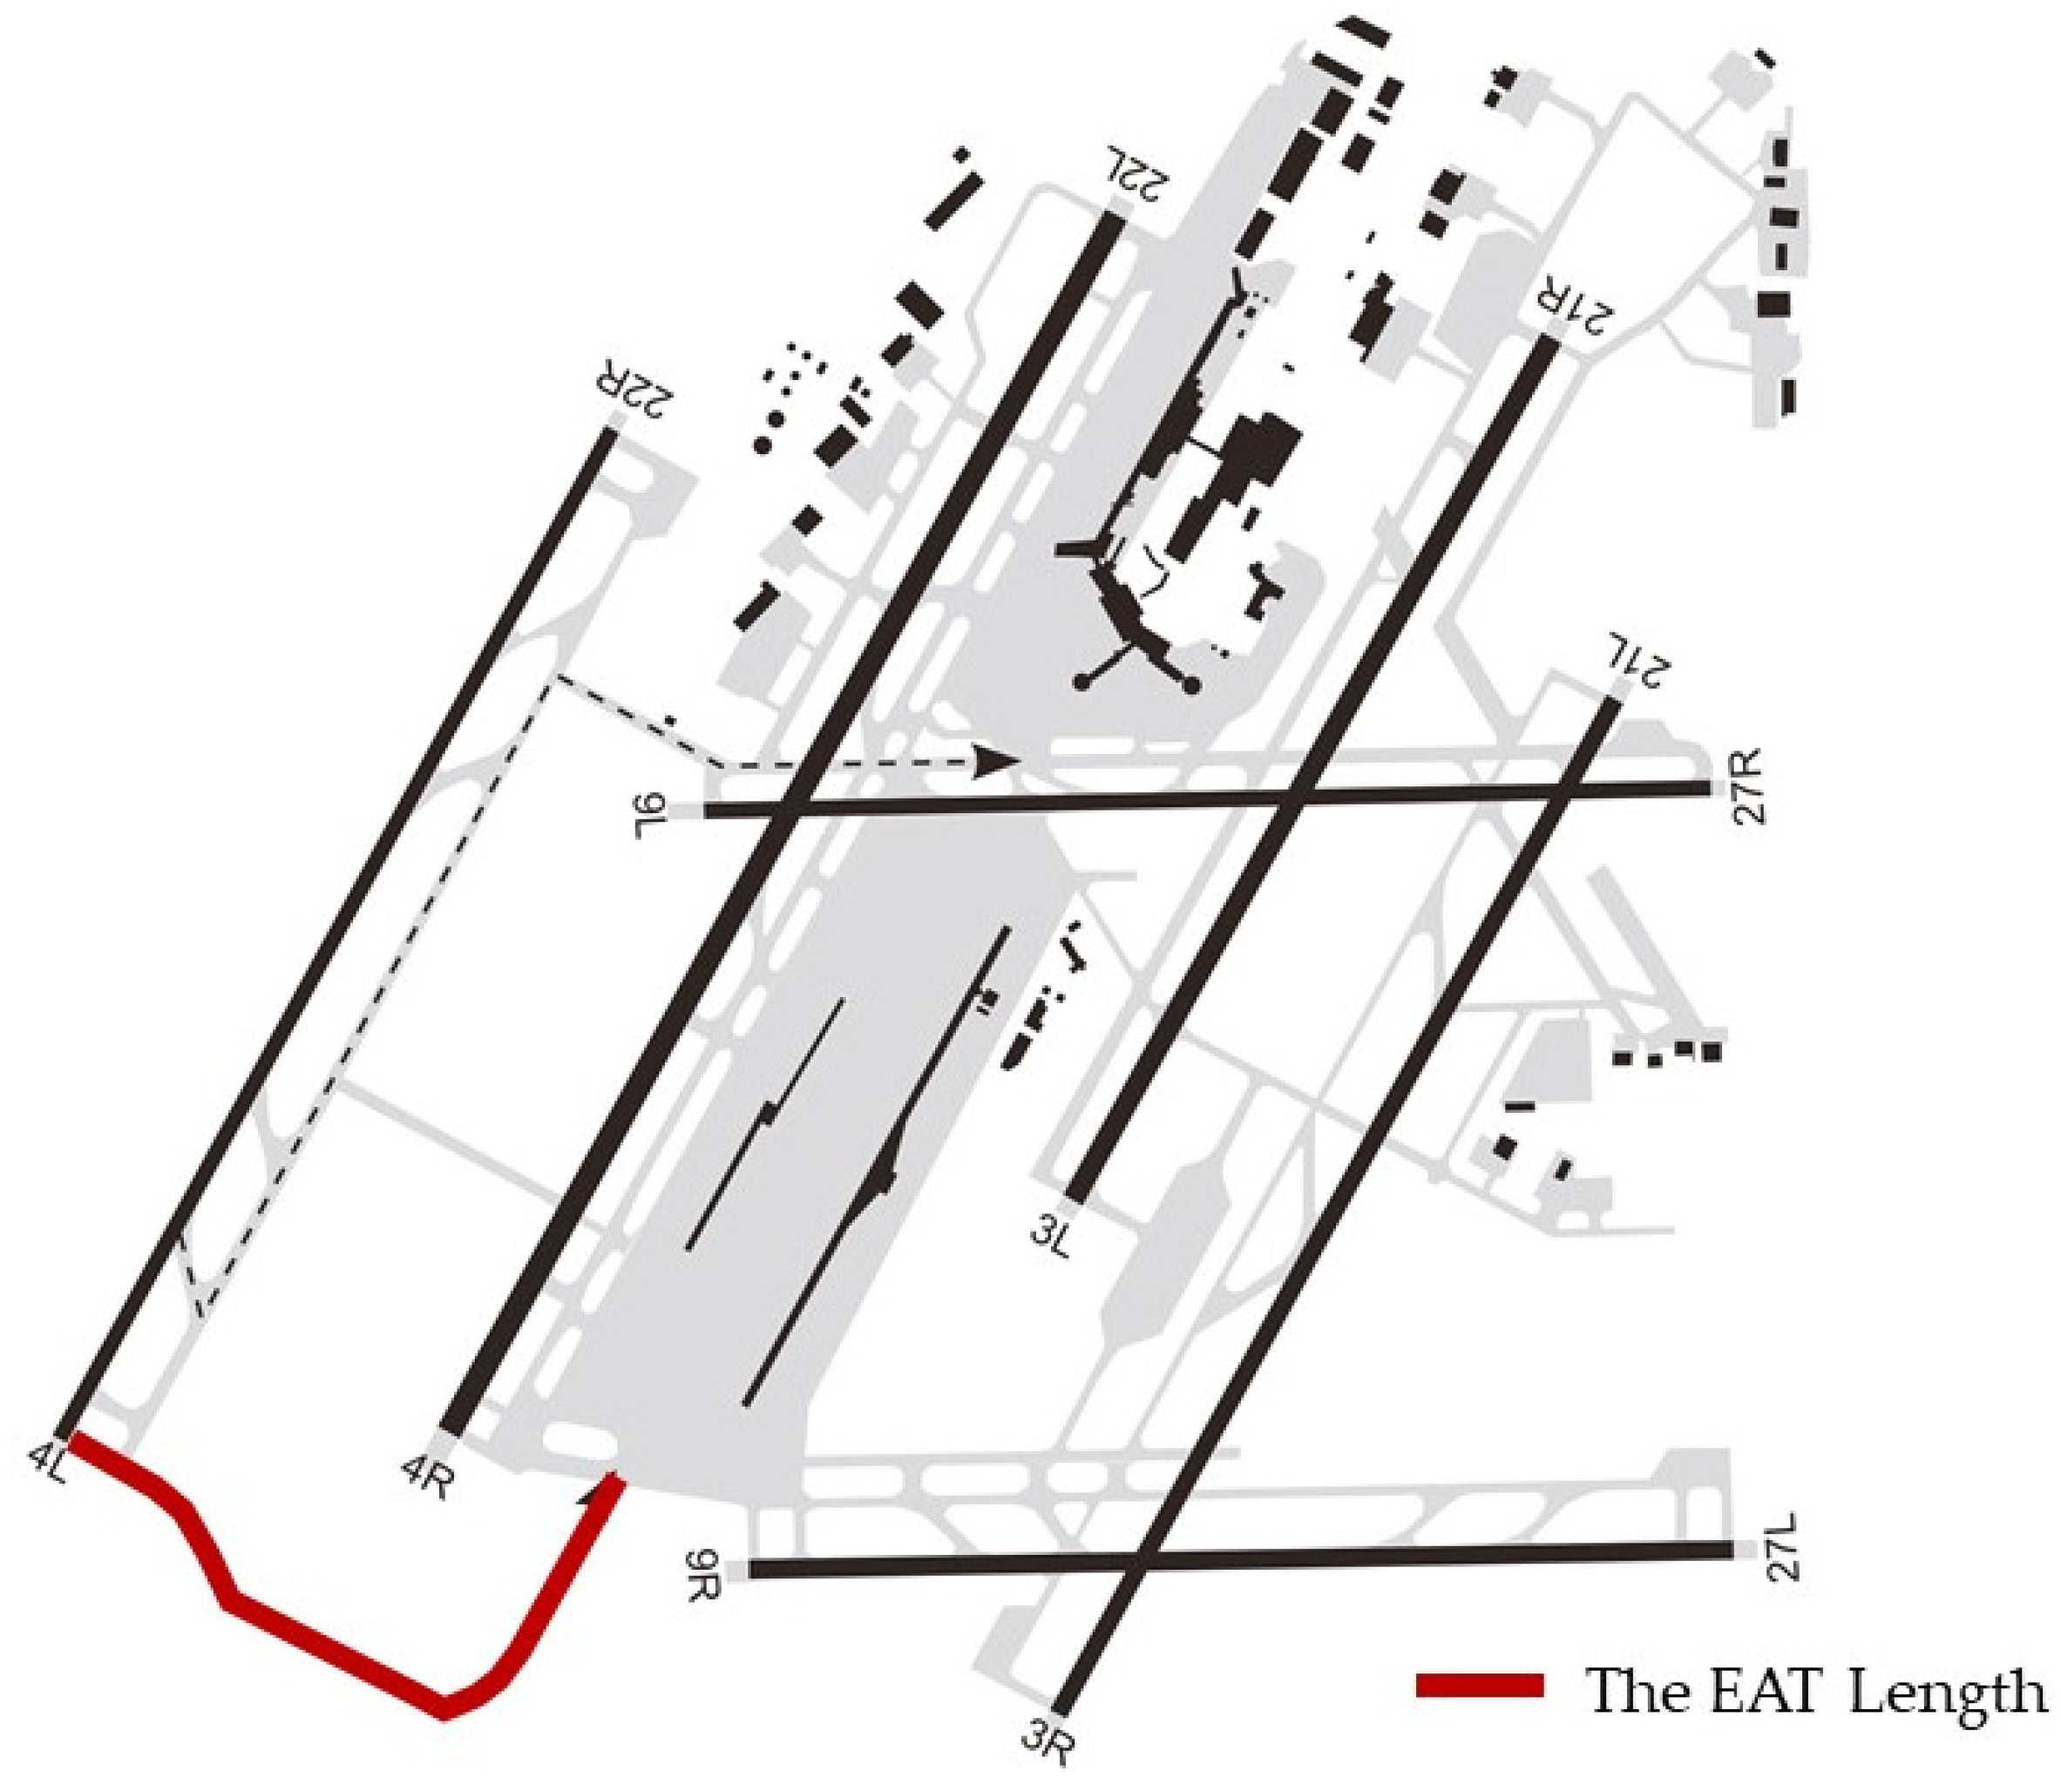
A typical EAT is shown in Figure 11 [67]. The distance between the centerline of the taxiway and the Departure End of Runway (DER) is the determining factor in its design. This is influenced by many factors, including the aircraft type for the taxiway and runway, approach surfaces, takeoff climb surfaces, missed approach surfaces, use strategy for the taxiway, and communication and navigation facilities [71]. If there is a certain height difference between the runway end and the taxiway, the terrain conditions can be fully utilized to shorten the distance between the runway end and the centerline of the taxiway.
Note 1: This example illustrates the approach surface, which controls the location of the side taxiway segments of the EAT, while the departure surface controls the location of the transverse taxiway section of the EAT.
Note 2: This example assumes all centerline elevations to be the same elevation as the runway end centerline.
Note 3: This distance varies depending upon the ground elevation of the transverse EAT transverse section relative to the applicable runway surface elevation (Departure End of Runway or threshold elevation).
Note 4: The point where the tail height equals the approach surface height is 1730 ft from the runway threshold, assuming no change in terrain elevation.
Note 5: The distance between the taxiway centerline and the outer edge of the approach surface edge is a minimum of one-half of the taxiway safety area (e.g., 59 ft).
The FAA’s AC150 advisory circular delineates comprehensive specifications for EAT layouts, specifying the minimum distance of taxiways from runway ends and setting certain dimensions for taxiways based on the tail height of different aircraft models (Table 4). In addition, the regulations have studied methods for determining the position and height of visual obstructions and proposed the use of on-site survey methods to measure the height and width of such obstructions.
Most of the EATs in the United States are designed based on a takeoff climb surface of 1:40, without considering the one-engine-inoperative surface in management regulations [16,17,36,68]. However, most ICAO member states in Asia use takeoff climb surfaces of 1:50 or 1:62.5 to ensure unrestricted passage of aircraft taking off in front of the taxiway [72,73].

4.2. Principles and Steps of Taxiway Design Optimization

It is recommended to carry out the planning and design work of taxiways according to the following steps and principles.
(1)
Land supply situation
The construction of EATs requires additional land use, and new airports need to reserve space for the construction of these taxiways in master plans. However, expansion efforts lacking original allowances for EATs have constrained land resources [
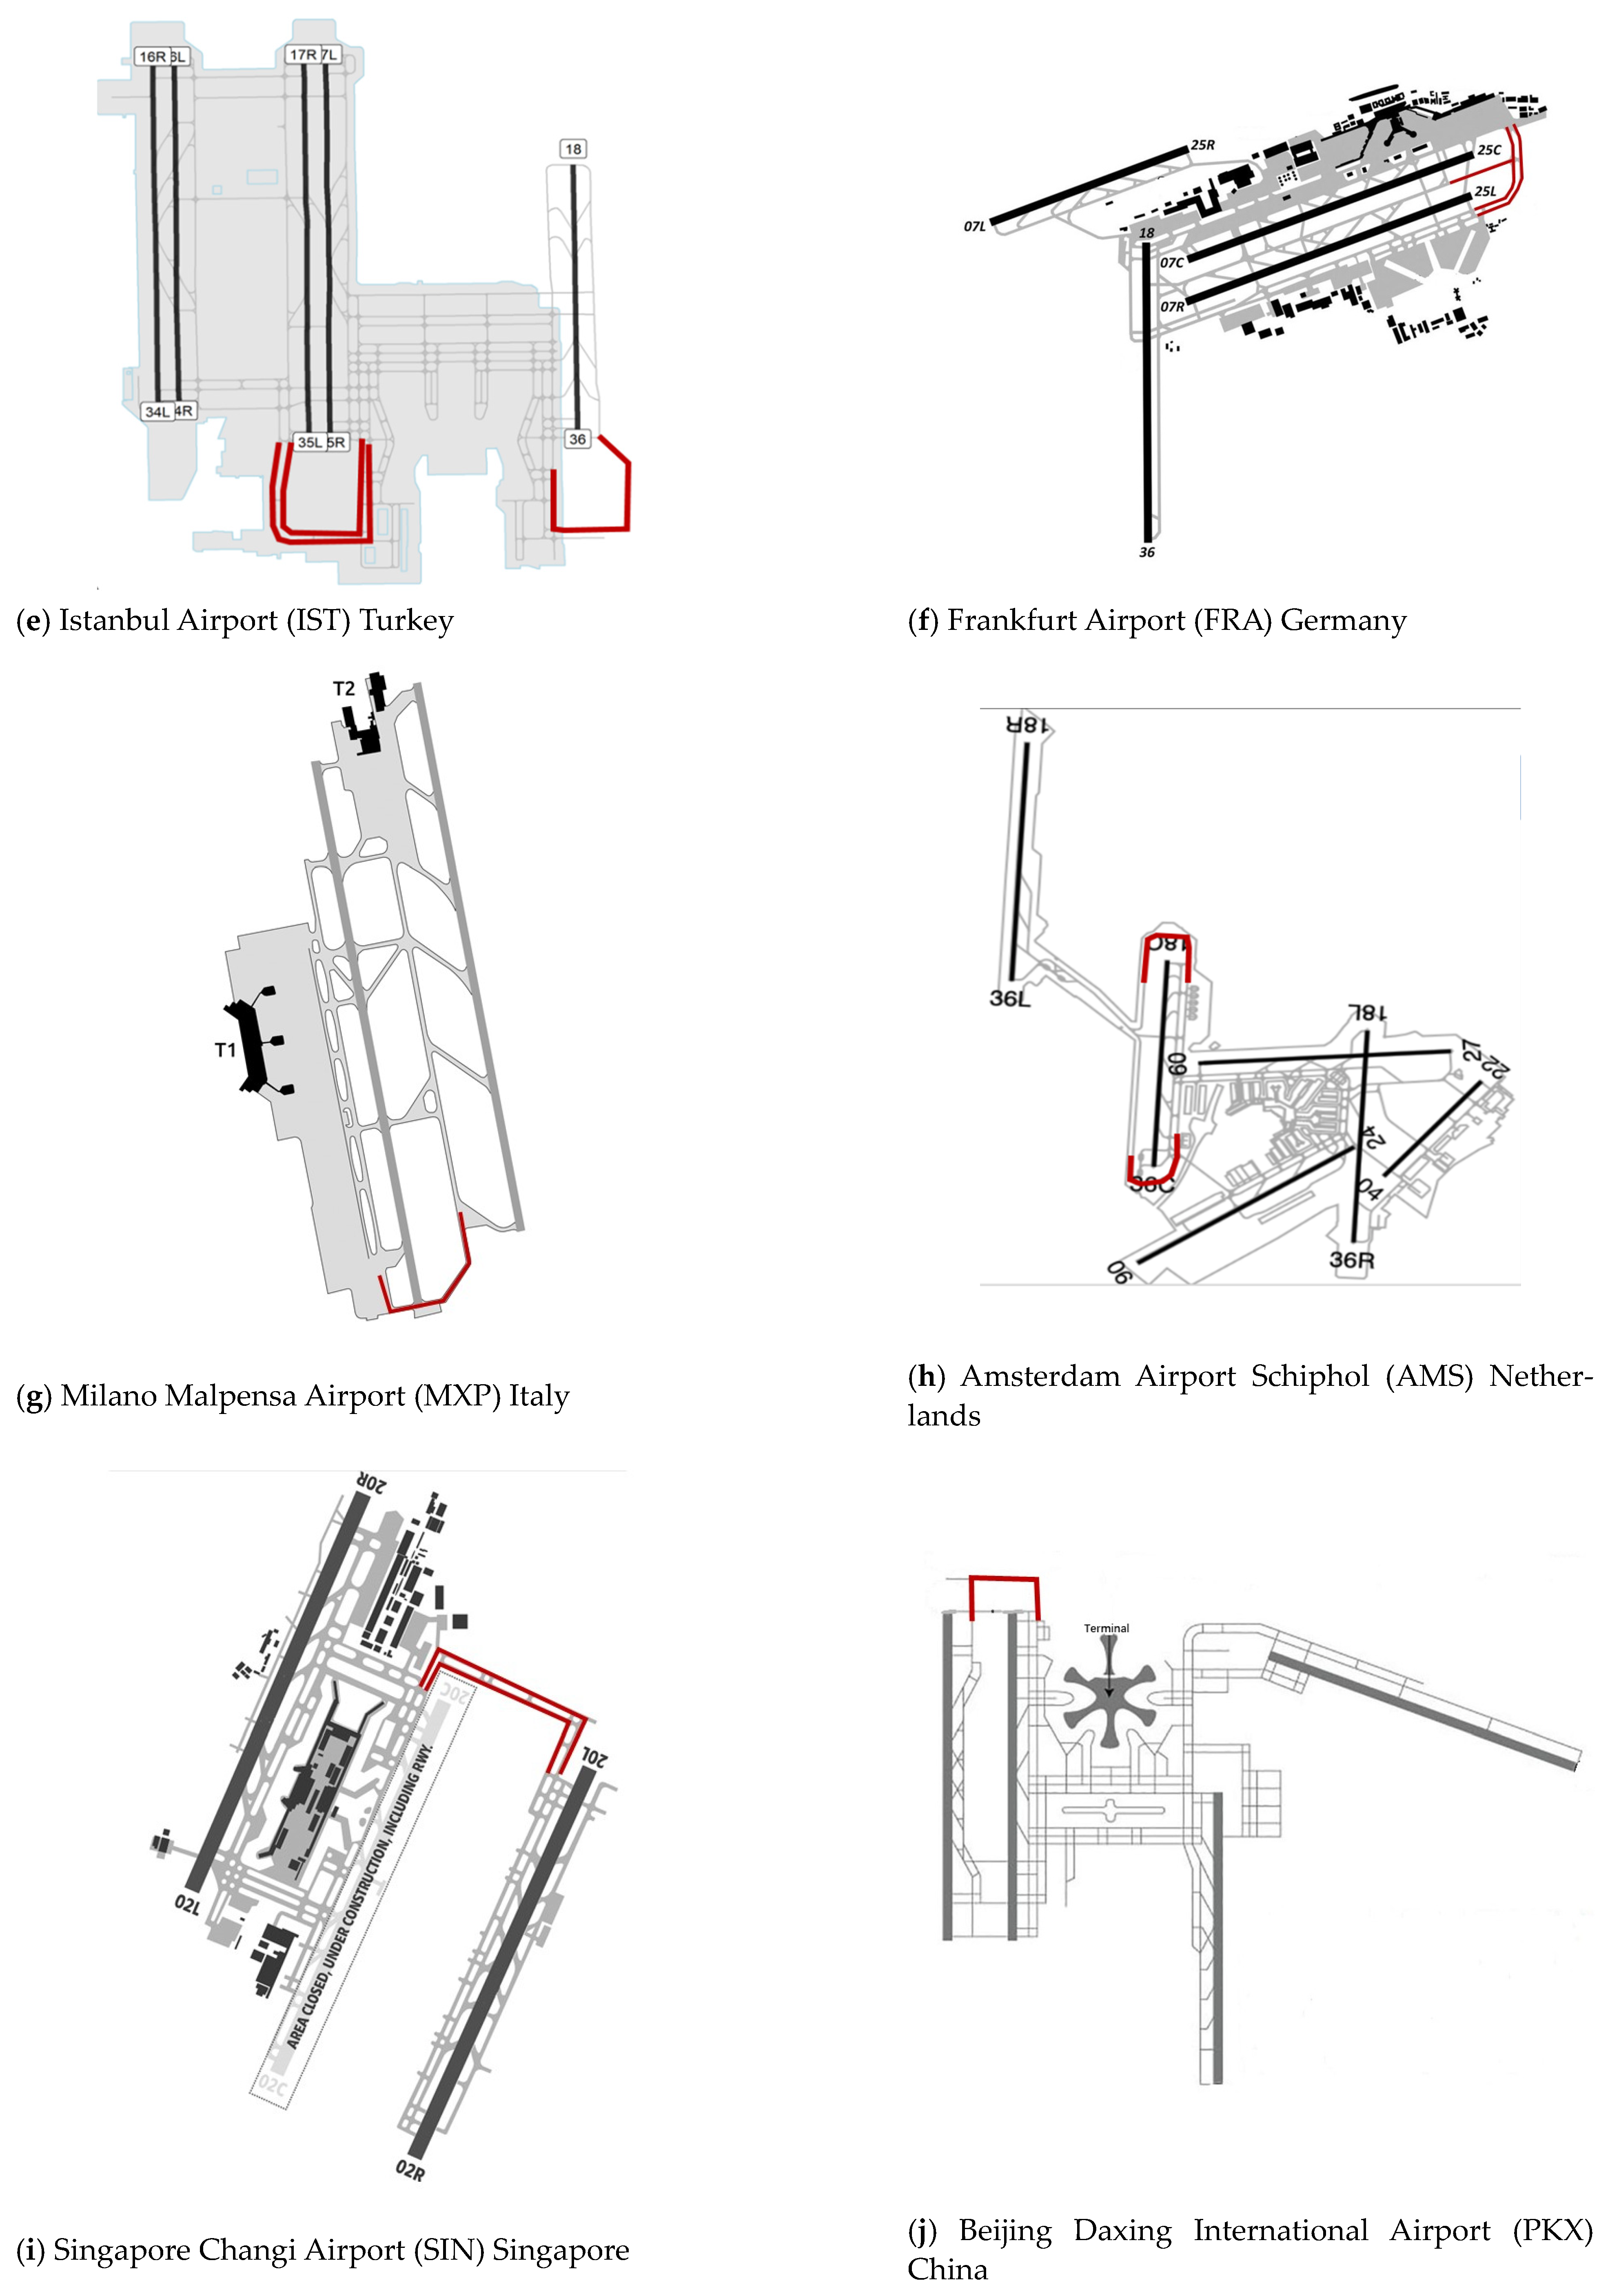
69]. Therefore, only BAT (Back-Around Taxiway) can be planned within the limited space. In some cases, aircraft may even adopt short-runway takeoff procedures, using short connecting taxiways as BATs. This practice has been implemented for many years at several airports in the United States. In the master plan of Asian airports, EATs have been included, and land has been reserved in recent years. This undoubtedly promotes the implementation of EATs in the future.
(2)
Developing multiple EAT design options based on different aircraft types and operational characteristics.
The choice of aircraft types (tail height) is the primary determinant in the selection of EAT layout. In the designing of hub airports, accurate predictions of air traffic volume and the proportion of aircraft types are crucial factors for taxiway planning. Taking DFW as an example, when designing the EAT, D-class aircraft, such as B767 and B757, were selected as the main design types to meet the operational requirements of mainstream aircraft. However, with the gradual retirement of D-class aircraft worldwide, short-haul flights are predominantly served by C-class aircraft like B737, A320, and C919, accounting for more than 80% of operations at domestic hub airports. Long-haul flights are mainly operated by popular E-class wide-body aircraft, such as B747 and A330, while F-class aircraft have a minimal presence and are not suitable for consideration [73,74].
In 2023, the wide-body aircraft proportion at PEK and SHA is estimated to be around 30%. These airports serve as major international hubs and handle a significant number of intercontinental or long-haul flights. Most domestic hub airports have a widebody aircraft proportion of less than 20%. According to the Airbus Global Market Forecast 2023–2042, the demand for widebody aircraft is projected to be 8220, accounting for 20% of the market, while single-aisle aircraft are forecasted to make up 80% with 32,630 units. Except for a few international hubs, the widebody aircraft proportion at most airports ranges from 10% to 20% [74].
Airport managers often prefer an EAT that can accommodate all types of aircraft. However, the tail height of widebody aircraft can cause excessive taxiing distances, resulting in increased taxiing time and fuel consumption. Therefore, it is recommended to carefully select the appropriate aircraft type based on the forecast. Additionally, it is advisable to compare different EAT layouts for various aircraft types (such as C or E), considering factors such as the total length of taxi routes, taxiing time, and overall fuel consumption throughout the entire life cycle of the design.
The relative positioning of taxiways, runways, and terminals, as well as the layout of EATs (such as N-shaped or M-shaped configurations), should be determined based on the overall airport master plan.
(3)
Comparative analysis of multiple solutions in terms of technical and economic aspects over the entire life cycle.
The construction of EAT requires a significant amount of land and incurs substantial engineering costs. The height difference between the runway and the EAT can reduce the taxiing distance but results in a large volume of earthwork. Therefore, it is necessary to compare different EAT layouts with varying elevations and different aircraft types and flows based on indicators such as taxiing time, fuel consumption, and engineering costs over the entire life cycle.

4.3. Limiting Requirements in End-Around Taxiway Design

In this section, we outline the fundamental considerations for EAT planning and design, drawing on real-world construction expertise and EAT categorization. Recognizing the intricate nature of EAT design with its array of requirements, this article puts forth a succinct synthesis of salient points, intending to provide planners and designers worldwide with an indispensable reference.
The N-type, M-type, and large N-type classification of EATs relates to runway and terminal layout, which is beyond this paper’s scope. Therefore, this article focuses on summarizing the key design considerations for SAT, REAT, and BAT classifications.
Table 5 demonstrates the Limiting Requirements of BAT, REAT, and SAT end-around taxiways. Flight procedures encompass the horizontal paths and vertical profiles of all stages of aircraft approach and departure. It is a crucial factor to consider in the design of EATs. Flight procedure design takes into account airport topography, airspace, navigation facilities, and relevant regulations. Presently, there are two main internationally recognized flight procedure design specifications: ICAO DOC8168 [75] and the FAA Order 8260.3 F (TERPS) or Order 8260.58 C. As mentioned earlier, the FAA has already provided a comprehensive summary of EAT limiting factors under TERPS. This study is based on the research conducted using the 6th Edition of DOC8168 [75], focusing specifically on the EAT design for SAT, REAT, and BAT modes within Category I, II, and III precision approaches in flight zones with aerodrome reference code number 3 or 4 [70].
Please note that the planning of EAT is complex. This article only focuses on the impact of taxiways on the runway that aircraft may go around. However, it is important to note that if the distance between parallel runways is close (approximately 300 m), the EAT can also affect both runways. Due to the limited scope of this article, this aspect will not be discussed in further detail, but it is crucial for planners to take this factor into account.

4.3.1. BAT (Back-Around Taxiway)

The aircraft operating on the EAT taxis behind the departing aircraft, so there are no obstacle limitation surfaces involved in takeoff or landing. The BAT primarily considers the impact of jet blasts from departing aircraft. However, the taxiway itself (excluding the operating aircraft) should not penetrate the ILS surface of the airport.
Figure 12 illustrates the impact range of a jet blast during takeoff for a typical aircraft. It is generally considered that a jet blast wind speed of 56 km/h is tolerable for people, vehicles, or other movable devices [76,77,78,79]. The B747-8 has the longest 56 km/h jet blast range [67], starting at approximately 533 m. Only a few aircraft, like the B747-8 and B777-200, require distances greater than 450 m.
However, it should be taken into consideration that after the aircraft enters the runway, the takeoff starting point is typically situated about 70–80 m away from the runway threshold [73,80,81]. The aircraft requires a certain distance to prepare for takeoff and reach full power. Therefore, a length of 350–385 m is considered sufficient to meet the blast limit. For instance, PKX has a BAT of 375 m from the runway threshold, which satisfies this requirement.
For the BAT mode, if the runway is equipped with an ILS (Instrument Landing System), the distance of 350–385 m is generally considered outside the critical zone but cannot completely prevent entry into certain sensitive areas. But, when an aircraft is operating on the BAT, the runway is in a takeoff state and the LOC (Localizer) and GP (Glide slope) signals are not active.
The BAT is typically positioned within the protected area of the approach lighting system. It is recommended to refrain from installing lights on the surface of the BAT. However, lights on the shoulder of the BAT are allowed. These shoulder lights should be embedded to prevent protrusions and potential obstruction on the taxiway. It should be noted that the elevation of these lights aligns with the terrain, which may not comply with the required slope ratio of 1:66 for ascent or 1:40 for descent. Consequently, meticulous coordination between terrain design and the elevation of the light fixtures is imperative to ensure compliance with the applicable specifications.

4.3.2. REAT, Runway End-Around Taxiway Mode

The aircraft operating on the Runway End-Around Taxiway taxis in front of the departing aircraft. Therefore, careful consideration of the influence of aircraft operating on the REAT on the departing aircraft is essential.
  • Appendix 14 Obstacle Limitation Surfaces
The Precision Approach Path Obstacle Limitation Surfaces and the Basic Instrument Landing System (ILS) surfaces specified in Annex 14—Aerodromes of the International Civil Aviation Organization (ICAO) [70] are consistent. They primarily include the Conical Surface, Inner Horizontal Surface, Approach Surface, Inner Approach Surface, Transitional Surface, Inner Transitional Surface, Balked Landing Surface, and Takeoff Climb Surface. EATs should be located outside the Basic ILS surfaces [67].
REAT is primarily used in front of the departing aircraft. The take-off climb surface serves as the primary limitation surface for restricting factors. In the direction of the runway extension centerline, the dominant limiting factors include a limitation surface that begins 60 m from the runway end with a gradient of 2%. The vertical restrictions consist of a lateral separation rate of 12.5% and a starting width range of 180 m [72,73].
Furthermore, the operation of REAT must not interfere with the operation of an adjacent runway. The approach for addressing this issue is similar to the SAT mode and will not be discussed in detail in this article.
2.
Flight Procedures and Aircraft Performance Restriction
In the International Civil Aviation Organization (ICAO) DOC 8168 [75] regulations, the primary factors that affect EAT are the procedures near the vicinity of the runway end, including approach procedures, departure procedures, the basic ILS surface, and the Obstacle Assessment Surface (OAS). Additionally, considerations are given to the Visual Segment Surface (VSS) and the Aerodrome Obstruction Chart-ICAO Type A (Operating Limitation) [82,83].
The operation of REAT does not require consideration of approach-related procedures. It only needs to consider the restrictions of Obstacle Identification Surface (OIS) and the Aerodrome Obstruction Chart-ICAO Type A (Operating Limitation) in the departure procedure.
(1) Obstacle Identification Surface (OIS): The purpose of the OIS is to determine whether there is a potential collision risk between obstacles within the protected area and departing aircraft. The OIS begins at the Departure End of Runway (DER), starting at a height of 5 m and gradually sloping upward at a gradient of 2.5%. It has an initial width of 300 m and expands towards both sides of the runway at a rate of 15%. Obstacles must maintain a lower height than the OIS [84,85].
If obstacles within the protected area do not penetrate the OIS, it does not affect instrument departure aircraft. The aircraft can climb following the published procedure gradient of 3.3% (2.5% + 0.8%) [82]. However, when obstacles penetrate the OIS plane, a flight path must be specified in the departure procedure or the departure climb gradient must be modified to ensure enough vertical clearance for the aircraft to safely fly over the obstacles. If this condition cannot be met, the aircraft should reduce its load. Obstacles below 60 m can be visually avoided.
The REAT design should strive to ensure that aircraft operating on it remain below the OIS. However, certain modified airports may encounter challenges in meeting this criterion due to terrain limitations. In such situations, the requirements for taxiway operations can be fulfilled by making adjustments to the Procedure Design Gradient (PDG), reducing the payload of specific aircraft models, or employing visual obstacle avoidance techniques.
(2) Aerodrome Obstruction Chart-ICAO Type A (Operating Limitation): The purpose of the Type A surface is to guarantee that aircraft can successfully clear obstacles within the designated takeoff path in the event of an engine failure. If this requirement cannot be met, the takeoff weight should be reduced by decreasing the effective payload. The Type A surface originates from the published endpoint of the takeoff area and has a climb gradient of 1.2% [82]. It initially has a width of 180 m and gradually expands at a rate of 25% on both sides until reaching a fixed width of 1800 m [86].
In practice, the design of taxiways does not take into account the constraints of the Type A surface. This is mainly due to its stringent requirements, which result in longer distances between the EATs and the runway. Aircraft operating on taxiways act as moving obstacles and can provide emergency avoidance in the case of an engine failure, which is a significant difference compared to fixed obstacles.
As shown in Figure 13, the limitations set by Appendix 14 surfaces, the Obstacle Identification Surface (OIS), and the Type A surface were computed incrementally along the runway extension line and in the vertical runway direction. The calculations were based on the assumption that the runway elevation is equal to the taxiway elevation. It is clear that the requirements of the Type A surface are excessively strict. As a result, the practical scenarios do not take the Type A surface requirements into consideration.
Step 1: Calculate the length requirements in the direction of the runway centerline extension.
As shown in Table 6, the primary constraint for the REAT along the extended centerline of the runway is the takeoff climb surface, which is aligned with the approach and inner approach surfaces. This constraint starts 60 m beyond the runway end and mandates a climb gradient of 2%.
Step 2: Determine the position of the REAT along the extended centerline direction of the runway, taking into account the 2% climb gradient constraint determined in the previous step. Based on this position, calculate the restricted widths of the takeoff climb surface, OIS, and Type A surface in the vertical direction of the runway. Make a comparison between these widths.
The width layout of REAT should consider the impact of the OIS to ensure that the aircraft’s tail remains below the OIS. If necessary, measures such as load reduction or avoidance should be taken in case of penetration. However, it is important to note that the limitations of the takeoff climb surface should never be exceeded. Table 7 shows the comparison results.
3.
Other Requirements
The REAT is calculated based on the takeoff climb surface and is positioned beyond 660 m from the runway end. If the runway is equipped with an ILS guidance system, this position is already located outside the critical and sensitive areas of the Localizer (LOC) and Glide Path (GP). However, if adjustments are made, such as lowering the REAT height, there is a possibility that the REAT system might enter into these sensitive areas. Nevertheless, during REAT operation, when aircraft are taking off, the LOC and GP signals are not active. Therefore, similar to the BAT model, it is sufficient to assess the potential impact of this situation.
If the REAT is located beyond 960 m, there is no need to extensively consider its impact on the approach lighting system. However, if the REAT is located within the protected area, similar to the BAT system, the lights should be installed on the shoulder instead of the pavement. The elevation of these lights may align with the terrain, which may not meet the required slope ratio of 1:66 for ascent or 1:40 for descent. Therefore, meticulous coordination between terrain design and light elevation is necessary to ensure compliance with the relevant specifications.
The REAT mode also needs to consider visual screens. Metal visual screens and terrain shielding are commonly used in practice. The impact of metal visual screens on the ILS signal should be taken into account. Regardless of the chosen method, the height of the visual screen must satisfy both the requirement to shield the aircraft engines when taxiing on the REAT and to ensure unobstructed observation of approach lights by the pilot. These interdependent requirements make the elevation of this area complex and often a critical factor in determining the feasibility of REAT planning.

4.3.3. SAT, Start-Around Taxiway Mode, Unrestricted EAT

SAT (Start-Around Taxiway) is constructed before the runway entrance, enabling aircraft on SAT to taxi undisturbed without disrupting approaching aircraft. The SAT integrates the capabilities of both EAT and BAT, functioning as an unrestricted end-around taxiway with full functionality.
  • Appendix 14 Obstacle Limitation Surfaces
The SAT as an unrestricted EAT requires consideration of numerous constraint surfaces; constraint surfaces previously analyzed for REAT will not be revisited here. Only constraints imposed by SAT end-around taxiing aircraft on approaching aircraft are examined: the conical clearance surface, inner horizontal surface, approach surface, inner approach surface, transitional surface, inner transitional surface, and balked landing surface.
It should be noted that for REAT, taxiing occurs prior to aircraft takeoff; thus, the datum point is the runway end. For SAT, taxiing is under the arriving aircraft, so the datum point is the runway threshold [87].
For most runways, the takeoff end and opposite direction threshold coincide. However, due to the demanding obstacle limitation surface requirements for end-around taxiways, many airports displace the threshold or runway end depending on the taxiway type (SAT or REAT).
Inner transitional surface: due to their steep gradients and location primarily lateral to the runway, the inner transitional and transitional surfaces do not constrain end-around taxiways.
Approach surface: for aerodromes with runway codes 3 or 4, the approach surface starts 60 m from the threshold, with an initial width of 280 m, divergence of 15%, and first segment length of 3000 m (the end-around taxiway range) at a 2% slope [70].
The inner approach surface begins at the same starting point as the approach surface, with a width of 120 m, length of 900 m, and gradient of 2%. The spatial extent of the inner approach surface is less than that of the full approach surface [70].
Balked landing surface: For code 3 and 4 runways, the balked landing surface commences 1800 m from the threshold at a 3.33% gradient. Its precipitous slope obviates constraints on end-around taxiways [70].
Along the extended runway centerline, the primary limitations include the 2% climb gradient surface (approach and inner approach surfaces) originating 60 m beyond the runway threshold. Vertically, the restrictions are a 15% divergence and 280 m initial width for the approach surface [70].
2.
Flight Procedures and Aircraft Performance Restriction
The SAT involves the complete arrival and departure procedures. The departure constraints, such as the OIS and Type A surfaces, are identical to the EAT mode and will not be reiterated. The arrival constraints of VSS, OAS, and CRM procedures will be discussed.
(1)
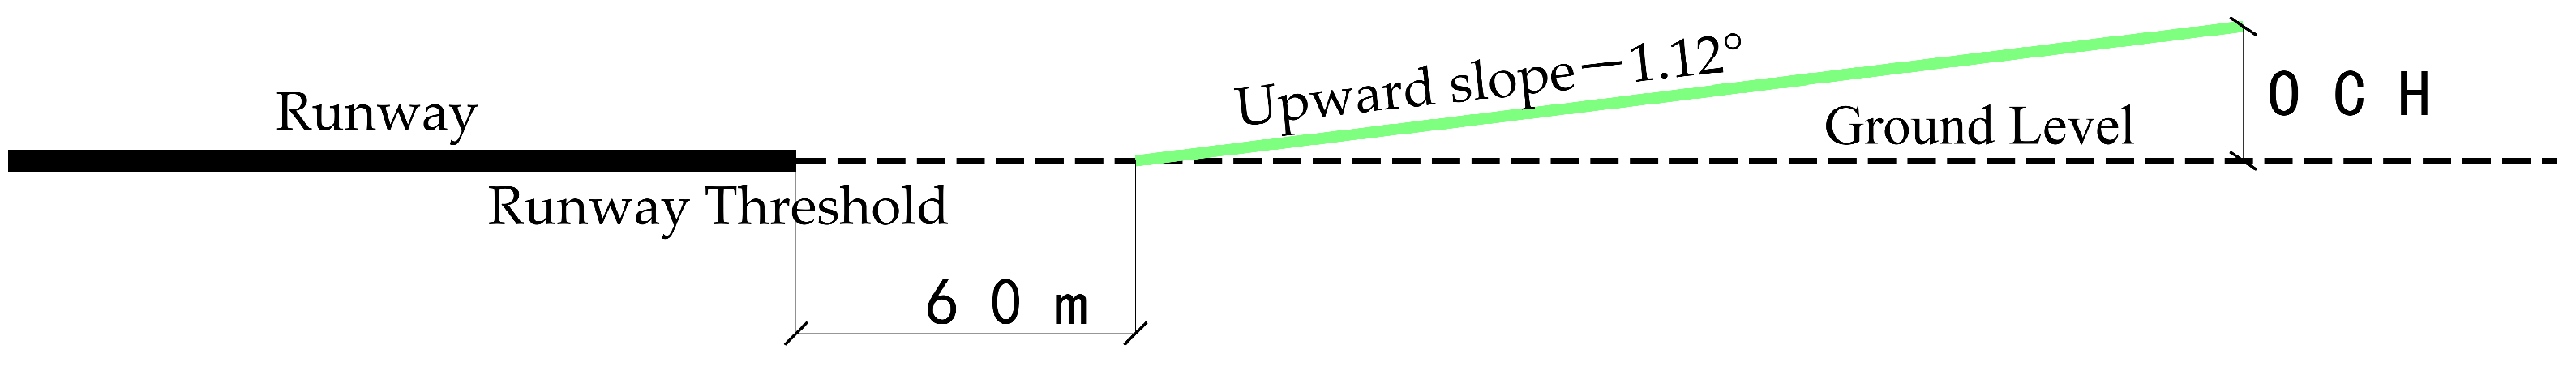
The Visual Segment Surface (VSS)
The Visual Segment Surface originates 60 m from the runway threshold, with an initial width of 300 m, 15% divergence on both sides, and a length extending to the point where the VSS surface reaches the Obstacle Clearance Height (OCH) altitude. Vertically, the initial elevation of the VSS equals the runway elevation, with an upward slope equal to the glide path angle minus 1.12 degrees, generally 3 degrees. Figure 14 demonstrates the vertical direction of the VSS.
(2)
The Obstacle Assessment Surface (OAS)/Collision Risk Model (CRM)
The Obstacle Assessment Surface (OAS) proposed in ICAO Doc 8168 “Procedures for Air Navigation Services—Aircraft Operations” states that if the OAS is penetrated, the OCA/H must be raised, thus increasing the Aerodrome operating minima. The Collision Risk Model ensures that the collision risk between aircraft on precision approach and surrounding obstacles is below 1 × 10⁻⁷ [75].
Since the OAS is above the basic ILS, the ILS is evaluated first. If obstacles penetrate ILS, OAS is applied. OAS comprises simplified surfaces derived from CRM’s calculated 1 × 10⁻⁷ collision probability. CRM serves as an alternative when obstacle density below OAS is excessive [88].
Therefore, for EATs meeting basic ILS requirements, the OAS/CRM serves only as a checkpoint surface. In cases where the end-around taxiing aircraft penetrates the ILS surface, the OAS surface needs re-evaluation, and methods like adjusting flight procedures should be applied to eliminate obstacle impact without compromising flight safety.
In summary, the Annex 14 limiting surfaces and the VSS are calculated separately in the extended runway centerline direction and perpendicular to the runway [70]. The calculations are based on the assumption that the runway elevation is equal to the taxiway elevation.
Step 1: Calculate the length requirements in the direction of the runway centerline extension, as shown in Table 8.
Along the extended runway centerline, the primary limitations of the SAT include the 2% climb gradient surface (approach and inner approach surfaces) originating 60 m beyond the runway threshold.
Step 2: Based on step 1, calculate the restricted widths of the approach surface, VSS, in the vertical direction of the runway. Table 9 makes a comparison between these widths.
Vertically to the runway, besides the approach surface, the relationship between end-around taxiing aircraft and the VSS surface must be considered. If unavoidable VSS penetration occurs, methods like adjusting flight procedures should be implemented.
3.
Other Requirements
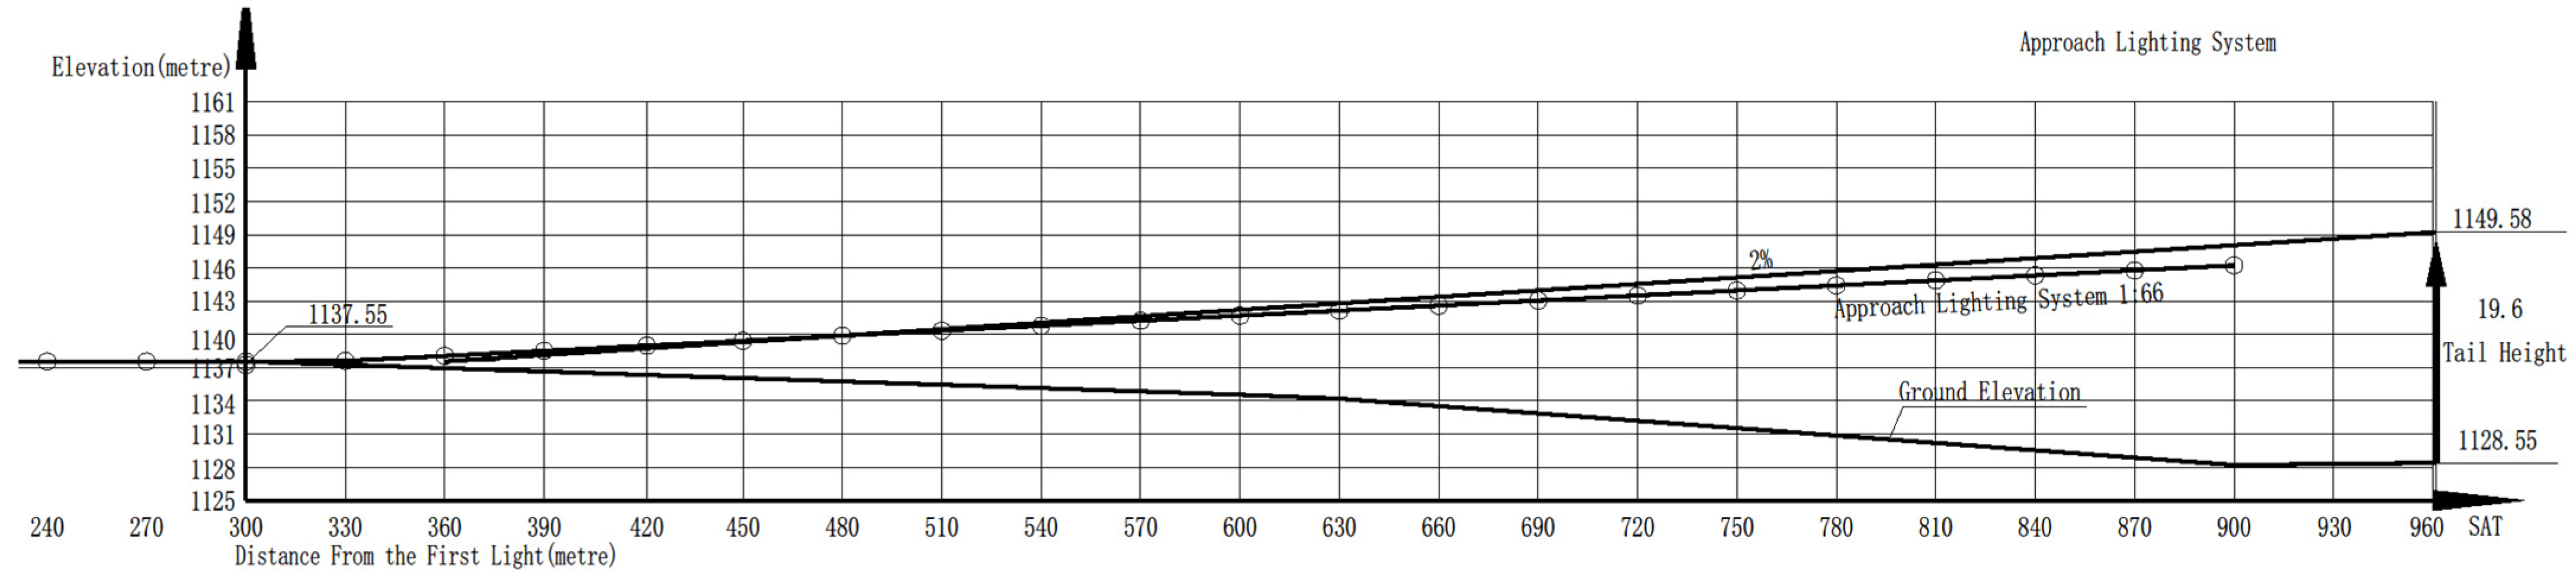
Unlike REAT, SAT operations need to account for the approach lighting system. Neither the end-around taxiway nor the aircraft should obstruct the approach lights. The taxiway has to be placed beyond the 960 m protection area from the threshold. However, this leads to excessive taxiing distance and land use. Generally, displacing the threshold inward shifts the approach lights and reduces the taxiing distance. The threshold is displaced no more than 300 m to minimize impact on pilot landing operations.
Airports like SHA and KWE have implemented threshold displacement. For KWE, the displaced threshold enables the unrestricted SAT to avoid impacting the approach lighting system. Thresholds at airports like SHA and DFW have more considerations, such as visual obstructions, which are detailed in Section 4.
SAT is termed an unrestricted EAT because it fulfills the REAT, BAT, and SAT modes, operating as a truly unconstrained bypass. Air traffic controllers can select the most proximate, optimal, and appropriate route per real-time runway flow to swiftly guide aircraft to the apron, potentially with no instructions required.
The unrestricted EAT has limited international implementations. Following project completion and commissioning in 2022, KWE’s application has received strong support from air traffic control. More airports are starting to evaluate the unrestricted end-around taxiway model.

4.4. Visual Impediment

Visual impediments are inherent to REAT operations. As the taxiing aircraft crosses in front of the departing aircraft, visual separators between the runway end and REAT are required to obscure aircraft on the REAT from the pilots’ view. This prevents confusion with any incursion aircraft at the runway end, allowing pilots to clearly distinguish between normal bypass taxiing and potential runway incursions.
FAA pioneered research into visual screens, constructing the first one with metallic materials. In 2007, through a field trial at the ATL end-around taxiway case [89], the FAA evaluated visual screen materials, structures, patterns, colors, and lighting methods via pilot questionnaires. Guidance on siting and implementing visual screens was finally provided in AC150 [67] and its attachments, based on this evaluation; 
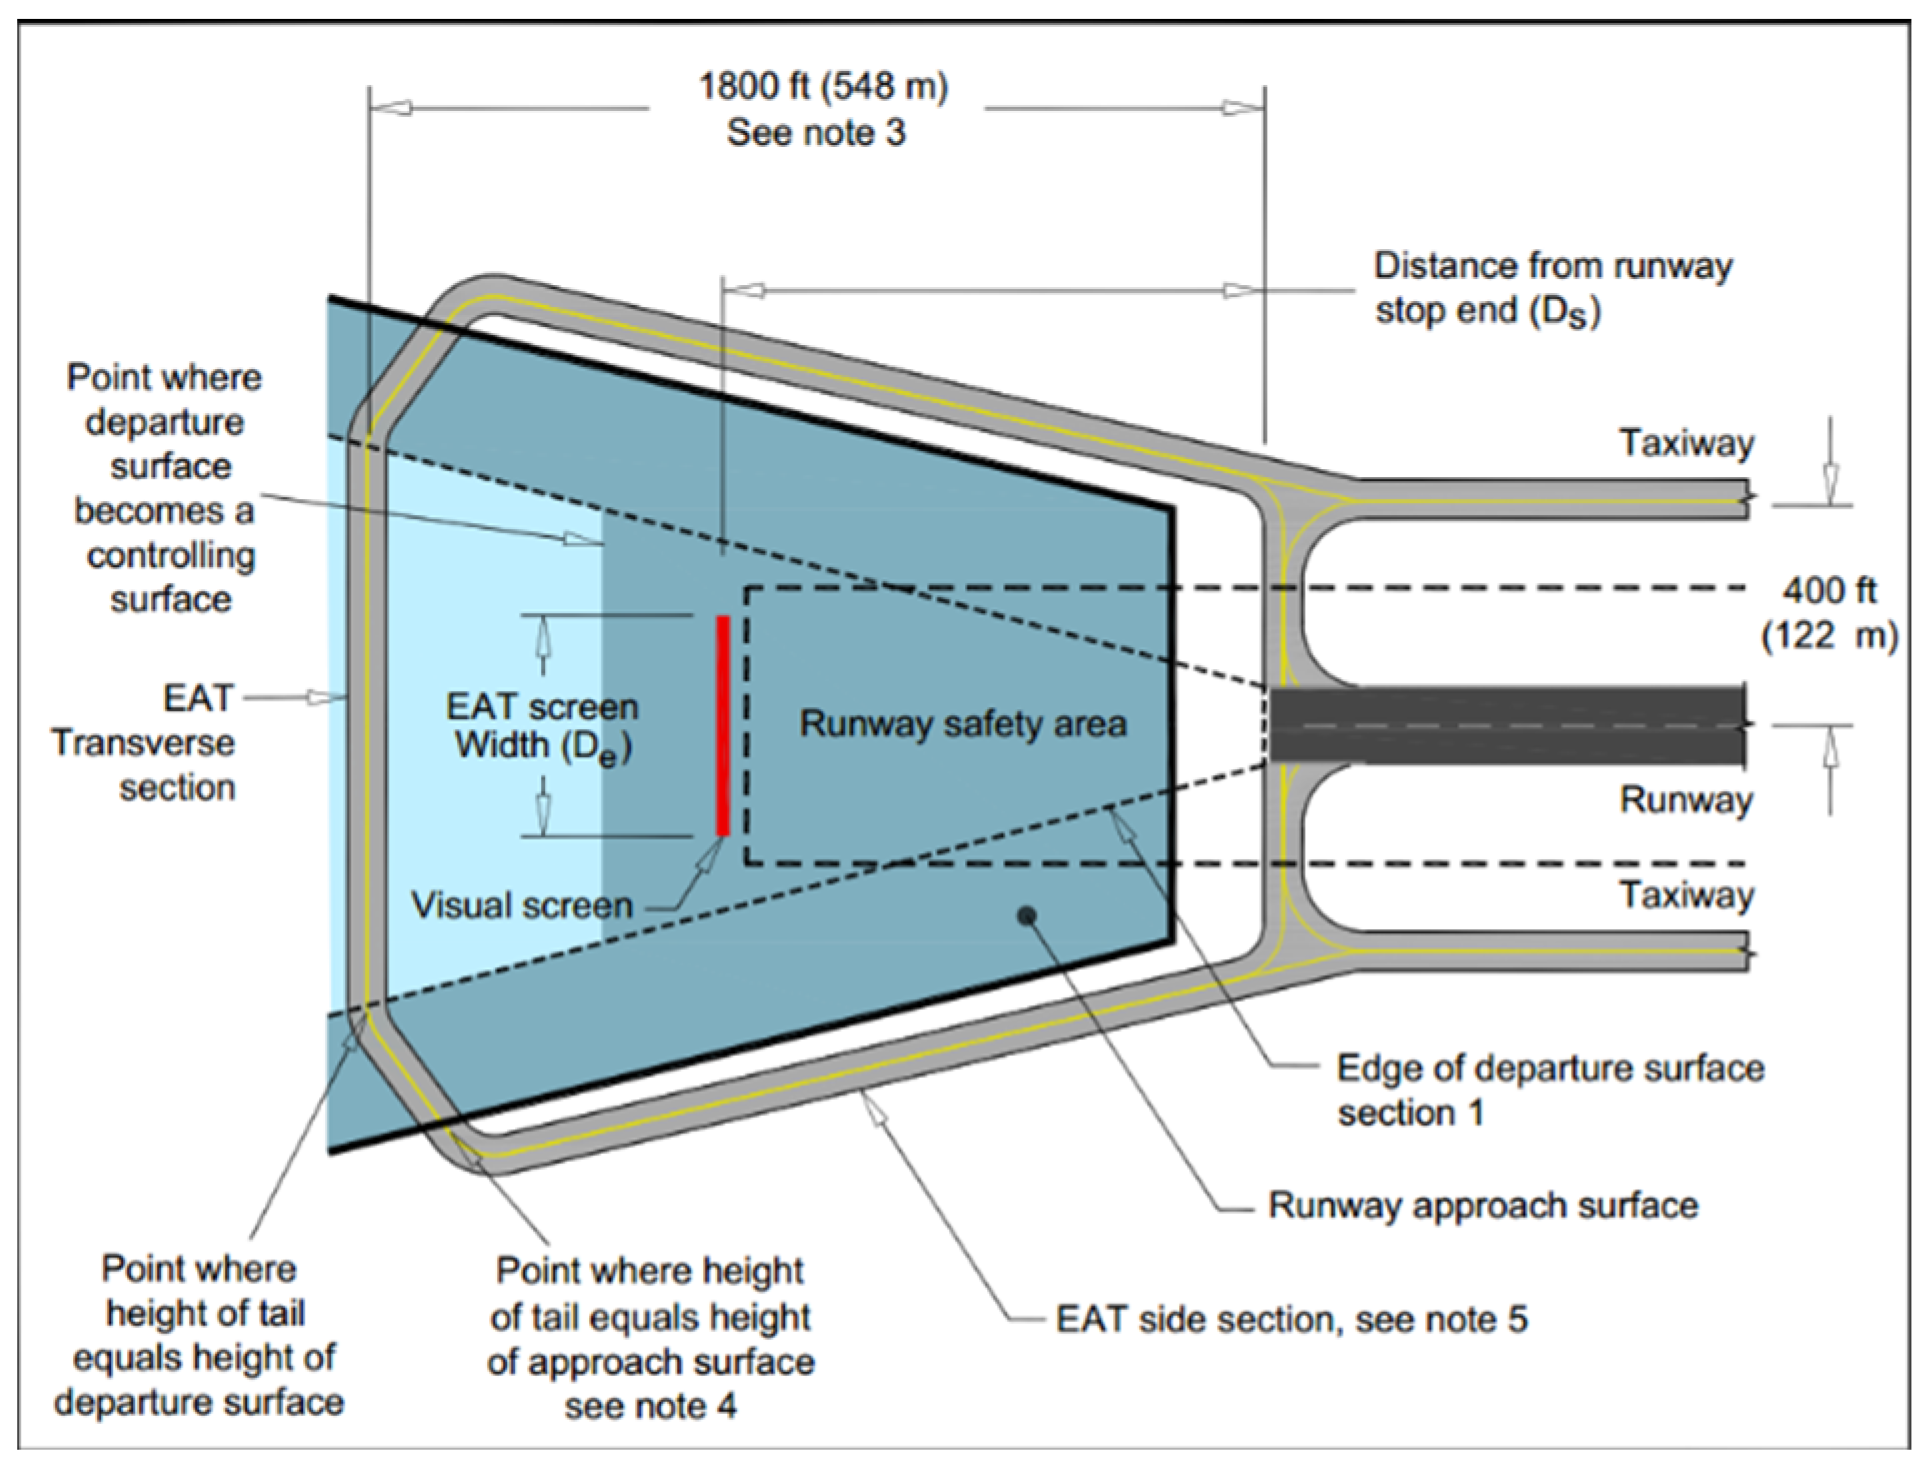
Figure 15 demonstrates end-around taxiway screen sizing and location [67], Figure 15 shows the End-around taxiway screen sizing and location guidance in AC150.
The world’s first visual screen was born at DFW. In 2021, DFW also installed visual screens in front of the north REAT.
(1) Horizontal Geometry: Base the design of the screen width on a departing aircraft’s view from a location at the V1 point through the farthest point on the runway hold line at the departure end of the runway.
A = arcta   D h D v
( tan A ( D v + D d ) ) = 0.5 D e
where: D v = 0.4   ×   r u n w a y   l e n g t h
D d = Distance from the departure end of the runway to the screen
D h = Distance from the runway centerline to the hold line
D e = Width of the EAT Visual screen
(2) Vertical Geometry: Design the height of the screen so that the top of the screen masks that portion of an aircraft that extends up to the top of an engine nacelle of the ADG taxiing on the EAT, as viewed from the cockpit of the same ADG at the V1 point on the departure runway.
H S = E L E V v 1 + H E Y E E L E V E A T H N A C E L L E D E A T + 0.4 × L R W Y × D E A T D d + H N A C E L L E + E L E V E A T E L E V G A S
where:
ELEVV1 = MSL elevation of the runway centerline at the V1 point, 60%of the length of the runway from the takeoff threshold
HEYE = Height of the pilot’s eye above the runway
HNACELLE = Height of the engine nacelle above the taxiway
ELEVEAT = MSL elevation of the centerline of the EAT
DEAT = Distance from the departure end of the runway to the screen
LRWY = Length of the runway
ELEVGAS = MSL elevation of the ground at screen
AC150/5300-13B also provides basic specifications for the material and composition of visual screens.
However, siting metallic visual screens is extremely challenging for two primary reasons:
Firstly, the screens are situated between the runway end and REAT; thus, the metal’s unique properties may impact critical and sensitive areas for ILS and approach lighting systems [43,90,91]. These areas should be avoided, if possible, but even after successful avoidance, subsequent relevant testing cannot be precluded, as large metallic surfaces can potentially induce signal effects that are difficult to predict.
Secondly, while visually blocking pilots’ sightlines, the screens must not obstruct signals for approach lights and navigation antennas. Concurrently, the screens cannot penetrate any obstacle limitation surfaces either. Therefore, after location selection, meticulous calculations are required to determine permissible width and height.
Although the FAA provided some recommendations, the actual implementation of metallic visual screens is complex and sometimes nearly infeasible to replicate. Nonetheless, the FAA’s fundamental research on aspects like materials and colors remains constructive.
With the development of communication and information technologies, the density of cables, fiber optics, and other infrastructure inside aerodrome maneuvering areas has increased. Some new communication and navigation facilities, such as GBAS (Ground Based Augmentation System) antenna arrays, are also increasing. Metallic visual screens may have unknown effects on the aforementioned equipment. For example, metallic screens can create false targets for surface surveillance radars. At the same time, the limitations of sensitive or critical areas for multiple devices also pose challenges for siting metallic visual screens [90,92]. As a result, the global use of metallic visual screens is not widespread. So far, only DFW, DTW, and SHA have utilized metallic visual screens. Table 10 compares the basic information of visual screens in three airports.
Metallic visual screens have been installed on both the north and south end-around taxiways at SHA and were put into use in 2022. The southern screen is located on the ground surface south of the runway, while part of the northern screen is erected above the regulatory pond.
Before the metallic visual screens were put into operation at SHA, relevant authorities conducted simulations and field tests to analyze their impact on ILS signals and surface movement radar signals. The panels were finally installed and tilted 12° (±1°) to minimize or eliminate false radar targets caused by surface reflections [34].
Analyses were also conducted on the impact of visual screens at different locations on the ILS system. According to the simulation result, the visual screen mainly affects the glide path antenna signal, and the distance between the screen and glide path antenna should be greater than 800 m [92]. Before installation, the possible influence of a screen on the signal of the glide path should be analyzed.

5. Sunken End-Around Taxiway and Terrain Shielding

The construction of EAT must meet the tail height requirements of applicable aircraft. According to ICAO Annex 14 and flight procedures, the distance between the EAT and runway end needs to exceed 600 m for Category C aircraft and 1000 m for Category E aircraft, whether for SAT or REAT. The SAT and operating aircraft should not obstruct lights, typically over 960 m away. However, an excessively distant EAT reduces taxiing efficiency. Therefore, reducing the distance between the end-around taxiway and the runway threshold presents challenges and is a key focus in end-around taxiway design. In practice, the primary method is to greatly increase the elevation difference between the end-around taxiway and runway threshold, making the end-around taxiway elevation significantly lower than the runway threshold elevation and making it serve as a sunken end-around taxiway.
Following the 2% obstruction clearance limit, the end-around taxiway can be displaced 50 m inward for every 1 m reduction in elevation. For REATs, since there is no need to consider the shielding of lights by aircraft operating on the end-around taxiway, coordination of terrain, approach lighting slope, and other means can enable successful inward movement of the end-around taxiway. For SATs, the runway entrance and approach lights must shift inward to prevent operating aircraft from blocking lights and allow end-around taxiway inward displacement.
The addition of metallic visual screens makes the inward displacement of end-around taxiways more complex and difficult. Their height cannot obstruct approach lights, and they themselves cannot impact the sensitive and critical areas of the ILS. In recent years, with more research in this area, end-around taxiway design schemes in China have adopted sunken end-around taxiways and terrain shielding.
Terrain shielding utilizes terrain elevation changes between the runway threshold and the end-around taxiway. The aim is for pilots to only see upper aircraft parts of aircraft engines on the end-around taxiway when taking off from the runway V1 point. Terrain shielding does not need to consider the impact of metals on signals. It only accounts for requirements of the runway end safety area, ILS facilities’ critical and sensitive areas, and approach lighting height changes.
The introduction of terrain shielding simplifies the originally complex metallic visual screens that require multifaceted evaluation. This promotes the application of end-around taxiways at major hub airports. Together with sunken end-around taxiways, it reduces taxiing distance. In recent years, the end-around taxiway designs for airports like IST, Xi’an Xianyang International Airport, Jinan Yaoqiang International Airport, and Guiyang Longdongbao International Airport (KWE) in China have considered this method [61,93].
Take KWE as an example. Guiyang Airport has just undergone a large-scale expansion, building a new parallel runway based on the existing one. The original runway was extended by 300 m, with a Sunken SAT end-around taxiway set outside the runway end. The sunken SAT has innate advantages at KWE. The original airport site was on a high terrace, and the new runway and end-around taxiway section required large amounts of earthwork to fill the natural gullies and ravines. Taking advantage of the natural terrain differences while moving the runway entrance inwards by 300 m, the 300 m runway extension sloped upward northward to meet lighting regulations. Figure 16 demonstrates the elevation of the approach lighting, while Figure 17 demonstrates the elevation of the runway end and the end-around taxiway. The SAT was successfully displaced inwards to 661.5 m from the runway end. It can accommodate unrestricted use by Category E and lower aircraft.
Additionally, as a fully functional end-around taxiway, it can facilitate REAT operations. By elevating the runway while depressing the end-around taxiway, the runway threshold successfully shields the view of pilots at the V1 point without needing metallic visual screens.

6. Conclusions

End-around taxiways exist primarily for the purpose of minimizing runway crossings. In the early stages of construction, the absence of relevant rules led to significant variations in their configuration, layout, and taxiing length, subsequently leading to varying operational efficiency. Additionally, with growing congestion on the runway, EATs can reduce the runway occupation time, making it meaningful for enhancing runway capacity. Furthermore, the safety benefits brought by EATs are undeniable.
It is concluded that:
  • The key to improving end-around taxiway efficiency is reducing their physical length, mainly determined by the distance from the end-around taxiways to the runway end or threshold. With careful planning, the distance between EATs and runway ends can be optimized, leading to shorter taxiing distances, reduced land usage and investment, and the achievement of both safety and efficiency objectives.
  • In designing the end-around taxiway, it is crucial to initially establish the operation mode, taking into account the airport’s land use and the specific runway configuration, whether it pertains to BAT, REAT, or SAT.
  • The minimum distance from BAT to the end of the runway or the runway threshold is 350–385 m. The design of REAT is mainly determined by the 2% climb surface, visual obstacles, and the requirements for approach lighting settings. SAT is a fully functional end-around taxiway with the most flexible usage, but it requires the farthest distance from the end or threshold. The factors involved in SAT design are the most intricate.
  • By appropriately utilizing the original terrain differences and adopting methods such as sunken EATs and relocated runway entrances, the taxiing distance can be reduced while ensuring both safety and efficiency.
  • It is advisable for hub airports to allocate space for the construction of EATs during the planning of their master plan.
This study was limited to reviewing the existing advancements in end-around taxiway research. Due to the constrained scope, a comparative technical and economic analysis of different end-around taxiway operation modes, including BAT, REAT, and SAT, was not undertaken. However, determining the suitable end-around taxiway type and utilization strategy is an essential component of end-around taxiway design.

Author Contributions

Conceptualization, X.J.; formal analysis, X.J. and P.H.; resources, X.J.; data curation, X.J.; writing—original draft preparation, X.J.; writing—review and editing, X.J.; visualization, X.J.; supervision, X.J.; project administration, X.J.; funding acquisition, P.H. All authors have read and agreed to the published version of the manuscript.

Funding

This research received no external funding.

Acknowledgments

The authors would like to thank Yang Yang and Guo Xiaogang, as they provided great assistance in the airport informaton collection process and Language help.

Conflicts of Interest

Author Xiaoxi Jiang was employed by the company China Airport Planning & Design Institute Co., Ltd. The remaining authors declare that the research was conducted in the absence of any commercial or financial relationships that could be construed as a potential conflict of interest.

References

  1. International Civil Aviation Organization. Safety Management Manual (SMM)Doc 9859 AN/474; International Civil Aviation Organization: Montreal, QC, Canada, 2013. [Google Scholar]
  2. International Civil Aviation Organization. Manual on the Prevention of Runway Incursions Doc 9870AN/463; International Civil Aviation Organization: Montreal, QC, Canada, 2007. [Google Scholar]
  3. Satyamurti, S.; Mattingly, S.P. Implementing a Perimeter Taxiway at Dallas/Fort Worth International Airport: Evaluation of Operating Policy Impacts. In Aviation: A World of Growth; American Society of Civil Engineers: Reston, VA, USA, 2007; pp. 23–36. [Google Scholar]
  4. Mattingly, S. Safety Impact Assessment of the End-Around Taxiway at the Dallas/Fort Worth International Airport Using ASDE-X Data. In Proceedings of the 53rd Annual Transportation Research Forum, Tampa, FL, USA, 15–17 March 2012. [Google Scholar]
  5. Aydoğan, E.; Çetek, C. Runway Capacity Enhancement Analysis of End-Around Taxiway at Istanbul New Airport. Düzce Üniversitesi Bilim Teknol. Derg. 2019, 7, 424–433. [Google Scholar] [CrossRef]
  6. Fala, N.; Le, T.T.; Marais, K.; Uday, P. Surface Performance of End-Around Taxiways. Air Traffic Control Q. 2014, 22, 327–351. [Google Scholar] [CrossRef]
  7. Engelland, S.; Morgan Ruszkowski, L. Analysis of DFW perimeter taxiway operations. In Proceedings of the 10th AIAA Aviation Technology, Integration, and Operations (ATIO) Conference, Fort Worth, TX, USA, 13–15 September 2010; p. 9150. [Google Scholar]
  8. Ricondo & Associates, Inc. Hartsfield-Jackson Atlanta International Airport Master Plan Inventory; Ricondo & Associates, Inc.: North Chicago, IL, USA, 2012; pp. 2–12. [Google Scholar]
  9. Yantao, L. Discussion on the end-around taxiway operation mode of Hongqiao Airport. Shang Hai Airport 2013, 8, 19–26. (In Chinese) [Google Scholar]
  10. Wei, W.; Long, L. Study on Operation Strategy of End—Around Taxiway and Its Application. J. Highw. Transp. Res. Dev. 2016, 33, 119–122. (In Chinese) [Google Scholar]
  11. Chao, Z. Analysis and Suggestions on Problems Related to End-around Taxiways. J. Civ. Aviat. 2018, 2, 20–25. (In Chinese) [Google Scholar]
  12. Timothy, L.R. Addressing Close Calls to Improve Aviation Safety. Available online: https://www.transportation.gov/addressing-close-calls-improve-aviation-safety (accessed on 7 April 2024).
  13. Johnson, M.E.; Zhao, X.; Faulkner, B.; Young, J.P. Statistical Models of Runway Incursions Based on Runway Intersections and Taxiways. J. Aviat. Technol. Eng. 2016, 5, 3. [Google Scholar] [CrossRef]
  14. Wilke, S.; Majumdar, A.; Ochieng, W.Y. Modelling runway incursion severity. Accid. Anal. Prev. 2015, 79, 88–99. [Google Scholar] [CrossRef]
  15. Federal Aviation Administration. Review of FAA’s Call to Action Plan for Runway Safety AV; Federal Aviation Administration: Washington, DC, USA, 2010.
  16. AC 91-73B; Parts 91 and 135 Single Pilot, Flight School Procedures During Taxi Operations. Federal Aviation Administration: Washington, DC, USA, 2012.
  17. AC 00-46F; Aviation Safety Reporting Program. Federal Aviation Administration: Washington, DC, USA, 2021.
  18. AC 91-79B; Aircraft Landing Performance and Runway Excursion Mitigation. Federal Aviation Administration: Washington, DC, USA, 2023.
  19. Li, N.; Zhang, X. Operation Efficiency Analysis of Narrow Distance Parallel Double Runways. J. Civ. Aviat. 2023, 7, 65–68. (In Chinese) [Google Scholar]
  20. Liu, H.; Hu, L.; Zhang, Z. Aircraft Taxiing Strategy of Run-taxi System with End-around Taxiway. Sci. Technol. Eng. 2023, 23, 7129–7135. (In Chinese) [Google Scholar]
  21. Zhou, M. Operation benefit analysis of airport winding system based on different operation modes. China Sci. Technol. Inf. 2023, 20, 52–54. (In Chinese) [Google Scholar]
  22. Wang, Z.; Li, Q.; Zhai, W. Research on Aircraft performance Analysis Process Based on Different End-around Taxiways Operations modes. J. Civ. Aviat. 2023, 7, 51–54. (In Chinese) [Google Scholar]
  23. Lei, C.-d.; Li, J.; Ye, B.-j.; Qu, X.-y. Simulation Research on Arriving Aircraft “Slide-Around” Decision Based on AnyLogic. Aeronaut. Comput. Tech. 2023, 53, 59–64. (In Chinese) [Google Scholar]
  24. Dunlay, W.J.; Xu, H.M. End-Around Taxiways—A Win-Win-Win: Enhanced Safety, Reduced Aircraft Delays and Emissions. In Proceedings of the International Conference on Transportation and Development 2018, Pittsburgh, PA, USA, 15–18 July 2018; pp. 99–109. [Google Scholar]
  25. Knecht, W.R. The “killing zone” revisited: Serial nonlinearities predict general aviation accident rates from pilot total flight hours. Accid. Anal. Prev. 2013, 60, 50–56. [Google Scholar] [CrossRef] [PubMed]
  26. Wilke, S.; Majumdar, A. Critical factors underlying airport surface accidents and incidents: A holistic taxonomy. J. Airpt. Manag. 2012, 6, 170–190. [Google Scholar]
  27. Baugh, B.S. Predicting General Aviation Accidents Using Machine Learning Algorithms. Ph.D. Thesis, Embry-Riddle Aeronautical University, Daytona Beach, FL, USA, 2020. [Google Scholar]
  28. Mathew, J.K.; Major, W.L.; Hubbard, S.M.; Bullock, D.M. Statistical modelling of runway incursion occurences in the United States. J. Air Transp. Manag. 2017, 65, 54–62. [Google Scholar] [CrossRef]
  29. Omrani, F.; Etemadfard, H.; Shad, R. Assessment of aviation accident datasets in severity prediction through machine learning. J. Air Transp. Manag. 2024, 115, 102531. [Google Scholar] [CrossRef]
  30. Dong, T.; Yang, Q.; Ebadi, N.; Luo, X.R.; Rad, P.; Chen, C.-H. Identifying Incident Causal Factors to Improve Aviation Transportation Safety: Proposing a Deep Learning Approach. J. Adv. Transp. 2021, 2021, 5540046. [Google Scholar] [CrossRef]
  31. Wilke, S.; Majumdar, A.; Ochieng, W.Y. Airport surface operations: A holistic framework for operations modeling and risk management. Saf. Sci. 2014, 63, 18–33. [Google Scholar] [CrossRef]
  32. Wilke, S.; Majumdar, A.; Ochieng, W.Y. The impact of airport characteristics on airport surface accidents and incidents. J. Saf. Res. 2015, 53, 63–75. [Google Scholar] [CrossRef] [PubMed]
  33. Federal Aviation Administration. FAA Invests over $100M to Reduce Runway Incursions at Airports; Federal Aviation Administration: Washington, DC, USA, 2023.
  34. The Second Research Institute of CAAC. Assessment Report on the Impact of Visual Obstructions on the Localizer Antenna and Airport Surveillance Radar Signals for the West Runway of Hongqiao Airport; The Second Research Institute of CAAC: Chengdu, China, 2019. [Google Scholar]
  35. CAAC East China Regional Administration. A Suspected Runway Intrusion by a JAL Plane at Pudong Airport Has Caused a Delta Airlines Plane to Interrupt Takeoff; CAAC East China Regional Administration: Beijing, China, 2018.
  36. 150-5210-25A; Performance Specification for Airport Vehicle Runway Incursion Warning Systems (RIWS). Federal Aviation Administration: Washington, DC, USA, 2019.
  37. Uday, P. Mitigating Environmental Impacts Using Aircraft Operations: A Systematic Overview and a Focus on End-Around Taxiways. Master’s Thesis, Purdue University, West Lafayette, IN, USA, 2011. [Google Scholar]
  38. Le, T.T.; Marais, K. Optimization of end-around taxiway for efficient operations and environmental benefits. In Proceedings of the 2013 Aviation Technology, Integration, and Operations Conference, Los Angeles, CA, USA, 12–14 August 2013; p. 4313. [Google Scholar]
  39. Feng, Y.; Johnson, M.E. Simulation Analysis of End-Around Taxiway Operations under Four Different Runway and Taxiway Choices. J. Transp. Res. Board 2021. [Google Scholar] [CrossRef]
  40. Le, T.T. Investigating Surface Performance Trade-Offs of Unimpeded Taxiways. Master’s Thesis, Purdue University, West Lafayette, IN, USA, 2014. [Google Scholar]
  41. Massidda, A.; Mattingly, S.P. Empirical Assessment of the End-Around Taxiway’s Operational Benefits at Dallas/Fort Worth International Airport Using ASDE-X Data. In Proceedings of the Transportation Research Board 92nd Annual Meeting, Washington, DC, USA, 13–17 January 2013. [Google Scholar]
  42. Federal Aviation Administration. DOT-FAA-AFS-440-38 End-Around Taxiway (EAT) Analysis-East Traffic Arrivals (Runways 17C and 17R) at Dallas_Fort Worth International Airport (DFW); Federal Aviation Administration: Washington, DC, USA, 2008.
  43. Tianqi, X.; Hongrun, R.; Qingtian, Z.; Gang, S.; Hailiang, L. Analysis on the Effect of End-around Taxiway Screen on the Signal of Localizer. In Proceedings of the 2021 IEEE 3rd International Conference on Civil Aviation Safety and Information Technology (ICCASIT), Changsha, China, 20–22 October 2021; pp. 45–50. [Google Scholar]
  44. Xiong, W. The Planning and Operation of End-Around Taxiway. Master’s Thesis, Civil Aerodrome Civil Aviation University of China, Tianjin, China, 2014. (In Chinese). [Google Scholar]
  45. Federal Aviation Administration. Airport Capacity Profile: Dallas/Fortworth International Airport; Federal Aviation Administration: Washington, DC, USA, 2018; pp. 81–83.
  46. Gao, J. Research of Taxiing Route Optimization for Aircraft Based on the Parallel Runway of Guangzhou Baiyun Airport. Master’s Thesis, Civil Aviation Flight University of China, Deyang, China, 2017. (In Chinese). [Google Scholar]
  47. Satyamurti, S.D. Runway Incursion Mitigation, Capacity Enhancement, and Safety Improvements with Perimeter Taxiway Operations at Dallas Fort Worth International Airport. Ph.D. Thesis, The University of Texas at Arlington, Arlington, TX, USA, 2007. [Google Scholar]
  48. Jadhav, A. Modeling of Ground Operations Using End-Around (Perimeter) Taxiways for the Modernized Chicago O’Hare International Airport. Master’s Thesis, University of Illinois at Urbana-Champaign, Champaign, IL, USA, 2013. [Google Scholar]
  49. McNerney, M.T.; Hargrove, B. Simulation of Quadruple IFR Arrival Runways and End-Around Taxiways at George Bush Intercontinental Airport. In Aviation: A World of Growth; American Society of Civil Engineers: Reston, VA, USA, 2012; pp. 108–121. [Google Scholar]
  50. Zhang, H. Application Research of End-Around Taxiway Inmulti-Runway Airport. Master’s Thesis, Civil Aviation Flight University of China, Deyang, China, 2020. [Google Scholar]
  51. International Civil Aviation Organization. Procedures for Air Navigation Services (PANS)—Air Traffic Management (Doc4444), 16th ed.; International Civil Aviation Organization: Montreal, QC, Canada, 2016. [Google Scholar]
  52. Zhao, Y. Ananalysis of the structure and operations of the end-around taxiways at Hongqiao Airport. Civ. Aviat. Manag. 2022, 80–83. (In Chinese) [Google Scholar]
  53. Wang, W.; Xiong, W.J. Runway operation efficiency analysis for airports with end-around taxiways. J. Civ. Aviat. Univ. China 2015, 33, 14–17. (In Chinese) [Google Scholar]
  54. Lin, Y.; Tang, X. Influence of end-around taxiway on airport operation: Take PVG for instance. J. Civ. Aviat. Univ. China 2019, 37, 29. [Google Scholar] [CrossRef]
  55. Li, X.; Li, D.-B.; Wei, D.X. Airport capacity analysis for typical parallel runways based on simulation method. J. Comput. Appl. 2012, 32, 2648–2651. (In Chinese) [Google Scholar] [CrossRef]
  56. Nikoleris, T.; Gupta, G.; Kistler, M. Detailed estimation of fuel consumption and emissions during aircraft taxi operations at Dallas/Fort Worth International Airport. Transp. Res. Part D Transp. Environ. 2011, 16, 302–308. [Google Scholar] [CrossRef]
  57. Feng, Y. Simulation Analysis of End-Around Taxiway Operations. Ph.D. Thesis, Purdue University, West Lafayette, IN, USA, 2020. [Google Scholar]
  58. Marais, K.B.; Reynolds, T.G.; Uday, P.; Muller, D.; Lovegren, J.; Dumont, J.-M.; Hansman, R.J. Evaluation of potential near-term operational changes to mitigate environmental impacts of aviation. Proc. Inst. Mech. Eng. Part G J. Aerosp. Eng. 2012, 227, 1277–1299. [Google Scholar] [CrossRef]
  59. McNerney, M.T.; Heinold, D. The Case to Build End-Around Taxiways at George Bush Intercontinental Airport for Air Quality Benefit. In Proceedings of the Transportation and Development Institute Congress 2011: Integrated Transportation and Development for a Better Tomorrow, Chicago, IL, USA, 13–16 March 2011; pp. 339–352. [Google Scholar]
  60. Uday, P.; Marais, K.; Burder, D. Environmental benefits of end-around taxiway operations. In Proceedings of the 11th AIAA Aviation Technology, Integration, and Operations (ATIO) Conference, including the AIAA Balloon Systems Conference and 19th AIAA Lighter-Than, Virginia Beach, VA, USA, 20–22 September 2011; p. 7049. [Google Scholar]
  61. Lingling, Z. End-around Taxiway Design Based on Operation Requirements and Site Conditions. J. Civ. Aviat. 2024, 8, 52–55+83. (In Chinese) [Google Scholar]
  62. Kazda, T.; Caves, B. Taxiways. In Airport Design and Operation; Emerald Group Publishing: Bingley, UK, 2017; pp. 113–126. [Google Scholar]
  63. International Civil Aviation Organization. Doc 9643 Manual on Simultaneous Operations on Parallel or Near-Parallel Instrument Runways (SOIR), 2nd ed.; International Civil Aviation Organization: Montreal, QC, Canada, 2020. [Google Scholar]
  64. International Civil Aviation Organization. Doc 9859 Safety Management Manual; International Civil Aviation Organization: Montreal, QC, Canada, 2018. [Google Scholar]
  65. Order 8260.58C; United States Standard for Performance Based Navigation (PBN) Instrument Procedure Design. Federal Aviation Administration: Washington, DC, USA, 2022.
  66. Order 8260.3F; United States Standard for Terminal Instrument Procedures (TERPS). Federal Aviation Administration: Washington, DC, USA, 2023.
  67. AC No: 150/5300-13B; Airport Design. Federal Aviation Administration: Washington, DC, USA, 2020; pp. 4–49.
  68. JO7110.65U; Air Traffic Control Basic with All Changes. Federal Aviation Administration: Washington, DC, USA, 2012.
  69. AC 150 5070-6B; Airport Master Plans. Federal Aviation Administration: Washington, DC, USA, 2015.
  70. International Civil Aviation Organization. Annex 14—Aerodromes Aerodromes Design and Operations; International Civil Aviation Organization: Montreal, QC, Canada, 2022; p. ATT A-32. [Google Scholar]
  71. Mackley, A.R.; Hassan, N.; Habibzai, A.J. Integration of Engineered Material Arresting System and End-Around Taxiways; FAA Design Competition for Universities Runway Safety/Runway Incursions; Federal Aviation Administration: Washington, DC, USA, 2010.
  72. International Civil Aviation Organization. Annex 2 Rules of the Air; International Civil Aviation Organization: Montreal, QC, Canada, 2005. [Google Scholar]
  73. International Civil Aviation Organization. Annex 6—Operation Of Aircraft—Part I—International Commercial Air Transport—Aeroplanes; International Civil Aviation Organization: Montreal, QC, Canada, 2022. [Google Scholar]
  74. Airbus. Global Market Forecast 2023–2042; Airbus: Toulouse, France, 2023. [Google Scholar]
  75. International Civil Aviation Organization. Doc 8168 Procedures for Air Navigation Services, Aircraft Operations Volume—Flight Procedures, 6th ed.; International Civil Aviation Organization: Montreal, QC, Canada, 2018. [Google Scholar]
  76. AC 150-5210-20A; Ground Vehicle Operations to Include Taxiing or Towing an Aircraft on Airports. Federal Aviation Administration: Washington, DC, USA, 2015.
  77. AC150 5200-18C; Airport Safety Self-Inspection. Federal Aviation Administration: Washington, DC, USA, 2023.
  78. AC150-5370-2G; Operational Safety on Airports during Construction. Federal Aviation Administration: Washington, DC, USA, 2017.
  79. Pro2024, A.A. Airplanes Elements Jetblast Thrust level Takeoff. The software AviPlAN Pro 2024.
  80. International Civil Aviation Organization. Annex 13 Aircraft Accident and Incident Investigation; International Civil Aviation Organization: Montreal, QC, Canada, 2016. [Google Scholar]
  81. Sandberg, M.; Simaiakis, I.; Balakrishnan, H.; Reynolds, T.G.; Hansman, R.J. A Decision Support Tool for the Pushback Rate Control of Airport Departures. IEEE Trans. Hum. Mach. Syst. 2014, 44, 416–421. [Google Scholar] [CrossRef]
  82. International Civil Aviation Organization. Annex 4 Aeronautical Charts; International Civil Aviation Organization: Montreal, QC, Canada, 2009. [Google Scholar]
  83. Satyamurti, S.D. Flight Track Data Analysis to Estimate Aircraft Height Above a Perimeter Taxiway System. In Proceedings of the Transportation Research Board 87th Annual Meeting, Washington, DC, USA, 13–17 January 2008. [Google Scholar]
  84. Li, Q.; Wang, D.; Wang, Z.; Yang, Z. Discussion on Key Points and Process of Around Taxiway Operation Safety Analysis Based on Around Taxiway Using Mode. Sci. Technol. Innov. 2022, 21, 167–170. (In Chinese) [Google Scholar]
  85. Federal Aviation Administration. AC150 5325-4B Runway Length Requirements for Airport Design; Federal Aviation Administration: Washington, DC, USA, 2005.
  86. International Civil Aviation Organization. Annex 15 Aeronautical Information Services, 16th ed.; International Civil Aviation Organization: Montreal, QC, Canada, 2015. [Google Scholar]
  87. Liao, X.J. Research on the construction method of airport End-around Around taxiway. Low Carbon World 2018, 10, 232–233. (In Chinese) [Google Scholar] [CrossRef]
  88. International Civil Aviation Organization. Quality Assurance Manual for Flight Procedure, Design, Volume 6 Flight Validation Pilot Tranining and Evaluation; International Civil Aviation Organization: Montreal, QC, Canada, 2012. [Google Scholar]
  89. James, W.; Patterson, J. End-Around Taxiway Screen Evaluation DOT/FAA/AR-TN06/59; Federal Aviation Administration: Washington, DC, USA, 2007.
  90. Ji, X.; Hua, G.; An, H.; Shen, Z.; Xu, L. Analysis of the Electromagnetic Effect of the EAT Screen on the Localizer Antenna and Glide-Slope Localizer Antenna in the Airport. In Proceedings of the 2023 IEEE MTT-S International Wireless Symposium (IWS), Qingdao, China, 14–17 May 2023; pp. 1–3. [Google Scholar]
  91. Federal Aviation Administration. AC 150-5340-30J Design and Installation Details for Airport Visual Aids; Federal Aviation Administration: Washington, DC, USA, 2018.
  92. Yuan, B.; Li, Y.; Lin, H.; Liang, F. Study on the position of Visual screen in airport constructed End-Around Taxiway. In Proceedings of the 2020 IEEE 4th Information Technology, Networking, Electronic and Automation Control Conference (ITNEC), Chongqing, China, 12–14 June 2020; pp. 880–883. [Google Scholar]
  93. Li, C. Design of storage and drainage system for end-around taxiway and feasibility analysis of using which asstorage under recurrence period of water logging. Water Wastewater Eng. 2022, 58, 112–116. (In Chinese) [Google Scholar] [CrossRef]
Figure 1. Flow chart of the study process.
Applsci 14 03500 g001
Figure 2. Shanghai Hongqiao International Airport (SHA) end-around taxiway and runway cross-taxiway.
Applsci 14 03500 g002
Figure 3. Example calculation of EAT length for DTW (Detroit).
Applsci 14 03500 g003
Figure 4. The distribution of the end-around taxiways (EATs) that are in use around the world.
Applsci 14 03500 g004
Figure 5. End-around taxiway layouts. (The red lines indicate EATs).
Applsci 14 03500 g005aApplsci 14 03500 g005bApplsci 14 03500 g005c
Figure 6. EAT taxiing length and layout (m).
Applsci 14 03500 g006
Figure 7. The land occupation of EATs (ha).
Applsci 14 03500 g007
Figure 8. Example of typical BAT operation.
Applsci 14 03500 g008
Figure 9. Example of typical REAT operation.
Applsci 14 03500 g009
Figure 10. Example of typical SAT operation.
Applsci 14 03500 g010
Figure 11. EAT—ADG-III (FAA AC No 150/5300-13B) [67].
Applsci 14 03500 g011
Figure 12. Typical aircraft jet blast impact range of taking off [17].
Applsci 14 03500 g012
Figure 13. The comparison of OIS, take-off clime surface, and type A surface in the vertical direction.
Applsci 14 03500 g013
Figure 14. The vertical direction of the VSS.
Applsci 14 03500 g014
Figure 15. End-around taxiway screen sizing and location [67].
Applsci 14 03500 g015
Figure 16. The elevation of approach lighting system and sunken end-around taxiway of KWE.
Applsci 14 03500 g016
Figure 17. The elevation of runway and end-around taxiway of KWE.
Applsci 14 03500 g017
Table 1. EAT usage at DFW, ATL, and DTW (2012).
AirportDFWATLDTW
Arrival Runway17L26R8L22R4L
EAT Usage Percentage55%62%49%67%56%
Table 2. Comparison of EAT situations at DFW, DTW, and ATL.
ICAO CODESRunway NumberRunway
Flow
Taxiing Time via EAT (min)Taxiing Time
Traditional Crossing (min)
Distance from the Runway End or Threshold to the EAT (m)EAT Length
DFW17LSouth10.498.358002435 m
DTW22RSouth5.955.188151797 m
ATL26REast4.573.214601233 m
Table 3. EAT layouts, classifications, and characteristics.
ClassificationICAO CODESCharacteristics
N-TypeATL, MIA, DXB, KWE, PKX, MXP, IST, IAH, DTWOne or more groups of runways with a distance of less than 760 m.
The main terminal building is arranged on one side of a group of parallel runways.
M-TypeSHA, DFW, FRAOne or more groups of runways with a distance of less than 760 m. The terminal buildings are arranged separately on both sides of the parallel runways.
Large N-TypeAMS, SIN, PEKOne or more groups of runways with a distance of more than 760 m; for aircraft transfer between different terminal areas.
Table 4. Airplane design groups (ADGs).
GroupTail Height (m)Wingspan (m)
I<6 m<15 m
II6–<9 m15–<24 m
III9–<13.5 m24–<36 m
IV13.5–<18.5 m36–<52 m
V18.5–<20 m52–<65 m
VI20–<24.5 m65–<80 m
Table 5. Limiting requirements of BAT, REAT, and SAT end-around taxiways.
Limiting RequirementsBATREATSAT
Appendix 14 Obstacle Limitation Surfaces (ILS Surfaces)Clearance Zone (Runway strips/Inner Transitional, Inner Approach, Balked Landing surface)
Take-off Climb Surface
Approach Surface
Flight Procedures and Aircraft Performance RestrictionObstacle Identification Surface (OIS)
Aerodrome Obstruction Chart-ICAO Type A (Operating Limitation) DisregardDisregard
Obstacle Assessment Surface (OAS)/Collision Risk Model (CRM)
Visual Segment Surface (VSS)
Other RequirementsNavigation Facilities
Lighting Facilities
Visual Obstruction
Jet Blast Effect
Table 6. Distance from the runway end to the REAT (meters).
CODEAircraft TypeVertical Tail HeightTakeoff Climb SurfaceOISType A Surface
CA32012.08664283.21066.7
B73712.76953081118.3
DB75713.74747349.61205.0
B76716.13866.5445.21404.2
EB74719.610405841693.3
A34017.93956.5517.21554.2
A33018.39755321585.0
FA38024.271273.5770.82082.5
Table 7. Half-widths of the REAT in the vertical direction of the runway (meters).
CODEAircraft TypeVertical Tail HeightDistance from the Runway End to the REATHalf-Width in the Vertical Direction
Determined by 2% Climb SurfaceTakeoff Climb SurfaceOISType A Surface
CA32012.08664165.5249.6256.0
B73712.7695169.4254.3263.8
DB75713.74747175.9262.1276.8
B76716.13866.5190.8280.0306.6
EB74719.61040212.5306.0350.0
A34017.93956.5202.1293.5329.1
A33018.3975204.4296.3333.8
FA38024.271273.5241.7341.0408.4
Table 8. Distance from the runway threshold to the SAT (meters).
CODEAircraft TypeVertical Tail HeightApproach SurfaceVSS
CA32012.08664428
B73712.7695446.9
DB75713.74747478.6
B76716.13866.5551.4
EB74719.61040657.1
A34017.93956.5606.2
A33018.3975617.5
FA38024.271273.5799.4
Table 9. Half-widths of the SAT in the vertical direction of the runway (meters).
CODEAircraft TypeVertical Tail HeightDistance from the Runway Threshold to the SATHalf-Width in the Vertical Direction
Approach SurfaceApproach SurfaceVSS
CA32012.08664230.6240.6
B73712.7695235.3245.3
DB75713.74747243.1253.1
B76716.13866.5261.0271.0
EB74719.61040287.0297.0
A34017.93956.5274.5284.5
A33018.3975277.3287.3
FA38024.271273.5322.0332.0
Table 10. Summary of metallic visual screens in use.
ICAO CodeEnd-Around Taxiway ClassificationsLocationHorizontal GeometryVertical Geometry
DFWREAT360 m from the runway south threshold, 400 m from the north threshold217.3 m6.1 m
DTWREAT515 m from the runway threshold, 360 m beyond the physical end of the runway216 m6.1 m
SHAREAT388 m from the runway threshold, 688 m beyond the physical end of the runway240 m6 m
Disclaimer/Publisher’s Note: The statements, opinions and data contained in all publications are solely those of the individual author(s) and contributor(s) and not of MDPI and/or the editor(s). MDPI and/or the editor(s) disclaim responsibility for any injury to people or property resulting from any ideas, methods, instructions or products referred to in the content.

