Abstract
This paper presents a transformative explainable convolutional neural network (CNN) framework for cataract detection, utilizing a hybrid deep learning model combining Siamese networks with VGG16. By leveraging a learning rate scheduler and Grad-CAM (Gradient-weighted Class Activation Mapping) for explainability, the proposed model not only achieves high accuracy in identifying cataract-infected images but also provides interpretable visual explanations of its predictions. Performance evaluation metrics such as accuracy, precision, recall, and F1 score demonstrate the model’s robustness, with a perfect accuracy of 100%. Grad-CAM visualizations highlight the key image regions—primarily around the iris and pupil—that contribute most to the model’s decision-making, making the system more transparent for clinical use. Additionally, novel statistical analysis methods, including saliency map evaluation metrics like AUC (Area Under the Curve) and the Pointing Game, were employed to quantify the quality of the model’s explanations. These metrics enhance the interpretability of the model and support its practical applicability in medical image analysis. This approach advances the integration of deep learning with explainable AI, offering a robust, accurate, and interpretable solution for cataract detection with the potential for broader adoption in ocular disease diagnosis and medical decision support systems.
Keywords:
cataract detection; explainable AI (XAI); deep learning; Siamese networks; VGG16; Grad-CAM 1. Introduction
Cataracts are one of the leading causes of visual impairment globally, as they affect millions every year [1]. In fact, the World Health Organization estimates that more than 51% of worldwide blindness is caused by cataracts, thus affecting elderly people disproportionately [2]. Due to the increasingly aging population, cataract prevalence is expected to increase significantly over the next few decades [3]. A cataract is characterized by clouding the normally clear lens in the eye, which results in blurred vision, sensitivity to light, and eventual blindness if untreated [4]. Because the disease progresses in several stages, timely intervention through treatment will prevent its advancement to such an extent that the last hope for recovery becomes surgical [5]. Early diagnosis not only averts severe vision loss but also enhances the quality of life in patients as effective treatment options can be offered that may recover the visual function [6].
Traditionally, cataract diagnosis has relied on manual examination with slit-lamp biomicroscopy, wherein an ophthalmologist examines the clarity of the lens by viewing images captured through the slit-lamp visually [7]. This kind of examination is, however, by definition subjective and heavily dependent upon the acumen and expertise of the examining professional. Considering limited diagnostic skills, often influenced by such factors as variability in human judgment, fatigue, and shortage of special training, an environment with scarce resources makes manual diagnosis labor-intensive and highly inefficient for large-scale screening [8].
Particularly, the new era of AI has promised a lot in terms of speed and accuracy, especially in diagnosis; it has made great strides in most fields, including medicine [9]. Deep learning models, especially CNNs, have been performing outstandingly in tasks involving image classification, including those applied to medical images [10]. The process of feature detection can be learnedautomatically by CNNs, making them suitable to detect different stages of cataract onset [11]. Large datasets comprising labeled images can be used to train CNNs inidentifying slight patterns, which may well be invisible to the human naked eye [12]. Thus, these automated systems can change the face of cataract diagnosis by diagnosing consistently, objectively, and much more quickly; therefore, they will reduce the burden on ophthalmologists while improving the outcomes for patients.
This paper presents a transformative, explainable deep learning framework that can resolve the twin issues of accuracy and interpretability related to cataract detection. The proposed framework embeds state-of-the-art VGG16 and Siamese networkswith explainability mechanisms such as saliency maps and Grad-CAM, which provide visualization capability for clinicians to inspect the regions of interest responsible for any particular model prediction. Thus, our approach not only improves diagnostic accuracy by transparently presenting an AI solution but also instills trust in deploying AI solutions practically in medical environments.
The rest of this paper discusses the related literature, the architecture of the proposed framework, the datasets used for training and testing, and the results that demonstrate its potential for exact and explainable cataract detection.
2. Related Works
Cataract diagnosis has become one of the fastest-developing medical imaging areas combined with artificial intelligence. This section presents a critical review of the most representative research works, focusing on how CNNs and other deep learning models have evolved in this area. Going by recent studies, traditional methods have increasingly given way to more sophisticated approaches using ResNet, VGG, and DenseNet advanced architectures with a view to boosting the accuracy and robustness of the diagnosis. The review looks into existing literature for pattern identification, gaps, and emerging trends that shape the current state of cataract detection technology.
It starts with some early foundational work and moves through some of the more recent advances; it provides broad coverage of different methodologies contributing toward better clinical outcomes as well as explainable AI model development.
Later works, building on the earlier findings, such as Dos et al. [13], present a methodology for glaucoma detection using Capsule Networks, referred to as CapsNet, requiring fewer training samples compared to traditional CNNs. The study achieved a promising result of 90.90% accuracy, showing how CapsNet captures the hierarchical variation of the spatial relationships in the images. This is proof that this methodology works well for the early detection of glaucoma with no exhaustive data augmentation and/or optical disk segmentation. Also, Ali [14] introduced a hyper-optimized Vision Transformer model enhanced with explainable AI for detecting and classifying eye diseases from medical images. In the case of the prevalence of eye conditions worldwide, timely diagnosis with precision is key for effective treatment. The current study proposes a new approach based on fine-tuned Vision Transformers, which have been optimized by hyper-parameter tuning in order to enhance both accuracy and generalization. Explainable AI has also been integrated, so the transparency of the model’s decision-making process will be provided to allow clinicians to interpret its predictions. It performed best with an accuracy of 91.40%, along with good precision, recall, and F1 score. Moreover, the plausibility provided insight into diagnosis and thus better care.
Continuing further in this direction, in 2024, Fayyad [15], in the year 2024, presented research on applying AlexNet, EfficientNetV2B0, and VGG19 architectures for classifying cataract and glaucoma images using explainable AI techniques such as Grad-CAM for explaining model decisions. It put to work several classification techniques coupled with various optimization strategies for better model performance. It was found that EfficientNetV2B0, combined with 90:10 holdout validation and the RMSProp optimizer, worked best among the different models tested, with an accuracy of 89.77%, showing a potential role of AI in promoting more transparency and diagnostic capabilities within healthcare through explainable AI. Velpula et al. [16] focused their work on the glaucoma detection task, exploiting both PCNNs for feature extraction and MLCs for the classification task. For the proposed technique, there is an adoption of explainable AI, enhancing transparency of the model such that users can be informed on how decisions are made. More than 3000 fundus images were considered in this work, with an accuracy as high as 98.03%, good precision, and recall. It allows better trust in the model’s predictions with integrated explainability, hence setting the base for future research on automated glaucoma detection. The proposal by Santone et al. [17] made a diagnosis of ocular diseases through automatic analysis of photographs taken from the eye fundus, using convolutional neural networks or CNNs. It involved four experiments on different conditions, such as cataracts and glaucoma, all of which achieved high accuracy. The study used explainability techniques to localize areas in images that represent disease-relevant areas, enhancing this model for diagnostics in a clinical setting. The results showed not only how well the model is able to identify the diseases themselves, but the areas that feed into such a diagnosis.
Afreen and Aluvalu [18] conducted a critical review of the literature dealing with AI, machine learning, and deep learning methods related to glaucoma detection. Their work highlighted shortcomings in manual diagnosis while highlighting the benefits of automated systems. Explainable AI, through an adaptive neuro-fuzzy inference system, needs to come forth in order for transparency and interpretability in the decision-making process to be determined. This will greatly enhance user trust in AI and hence has huge potential to improve the prediction and diagnosis of glaucoma. In this direction, Kher et al. [19] have proposed an ensemble model, namely DeB5-XNet, where DenseNet121 and EfficientNetB5 were combined for detecting different ocular diseases: cataracts, diabetic retinopathy, and glaucoma. This model has the CLAHE method, which enhances the features of an image, where it uses Grad-CAM for explainability, and the model predictions are in agreement with clinical observations. It achieved 95% test accuracy with a substantial reduction in false negatives, making it stand out as a reliable tool that ophthalmologists could use. On the technological front, AlBalawi et al. [20] proposed IoT-Opthom-CAD, an IoT-enabled diagnostic system integrated with deep learning by Swin Transformers and LightGBM to achieve multi-disease detection using fundus images. The adoption of Grad-CAM as the explainability tool has empowered the system to visually interpret the features leading to diseases for more informative diagnoses. It had excellent performance, where the reported accuracy was up to 96.5%showing the potential of this system in improving early disease detection in ophthalmology. In addition, Serwaa et al. [21] designed a LBPSCN for the diagnosis of glaucoma and cataracts. This model addresses the problem of small datasets and, at the same time, illumination variation; hence, it has high accuracy on a number of datasets, reaching as high as 96.87% for cataracts. This will enhance feature extraction and robustness, since this approach promises to serve as an excellent diagnostic tool for ophthalmologists in improving the outcomes of patients. Recently, Alenezi et al. [22] studiedthe adoption of an ensemble AI model in age-related macular degeneration diagnosis from OCT images. The paper used a Noor dataset of 16,822 images from 441 patients to provide a comparison of the predictions obtained from individual AI models, namely ResNet, EfficientNet, and Attention models, with the outputs combined by using an ensemble model via trainable weights. The ensemble model yielded the best performance: 91.88% accuracy, 92.54% precision, 92.01% recall, and a 92.03% F1 score in its maiden run, improving further to 97% accuracy after refining misclassified cases. This study infers the role of AI in improving diagnostic precision for AMD and also illustrates, one step further, the potential that can be released by model fusion while analyzing complex medical images.
Thus, the literature indicates a definite trend in innovation in the growing sophistication of CNN-based models for cataract detection. This review underlines the fact that while remarkable progress has been recorded both in terms of accuracy and explainability, further research needs to be carried out on scalability and real-world implementation issues. Further, this review recommends hybrid approaches and interpretable models in order to leverage wider adoption into the clinical practice.
3. Materials and Methods
3.1. Materials
3.1.1. Dataset Description
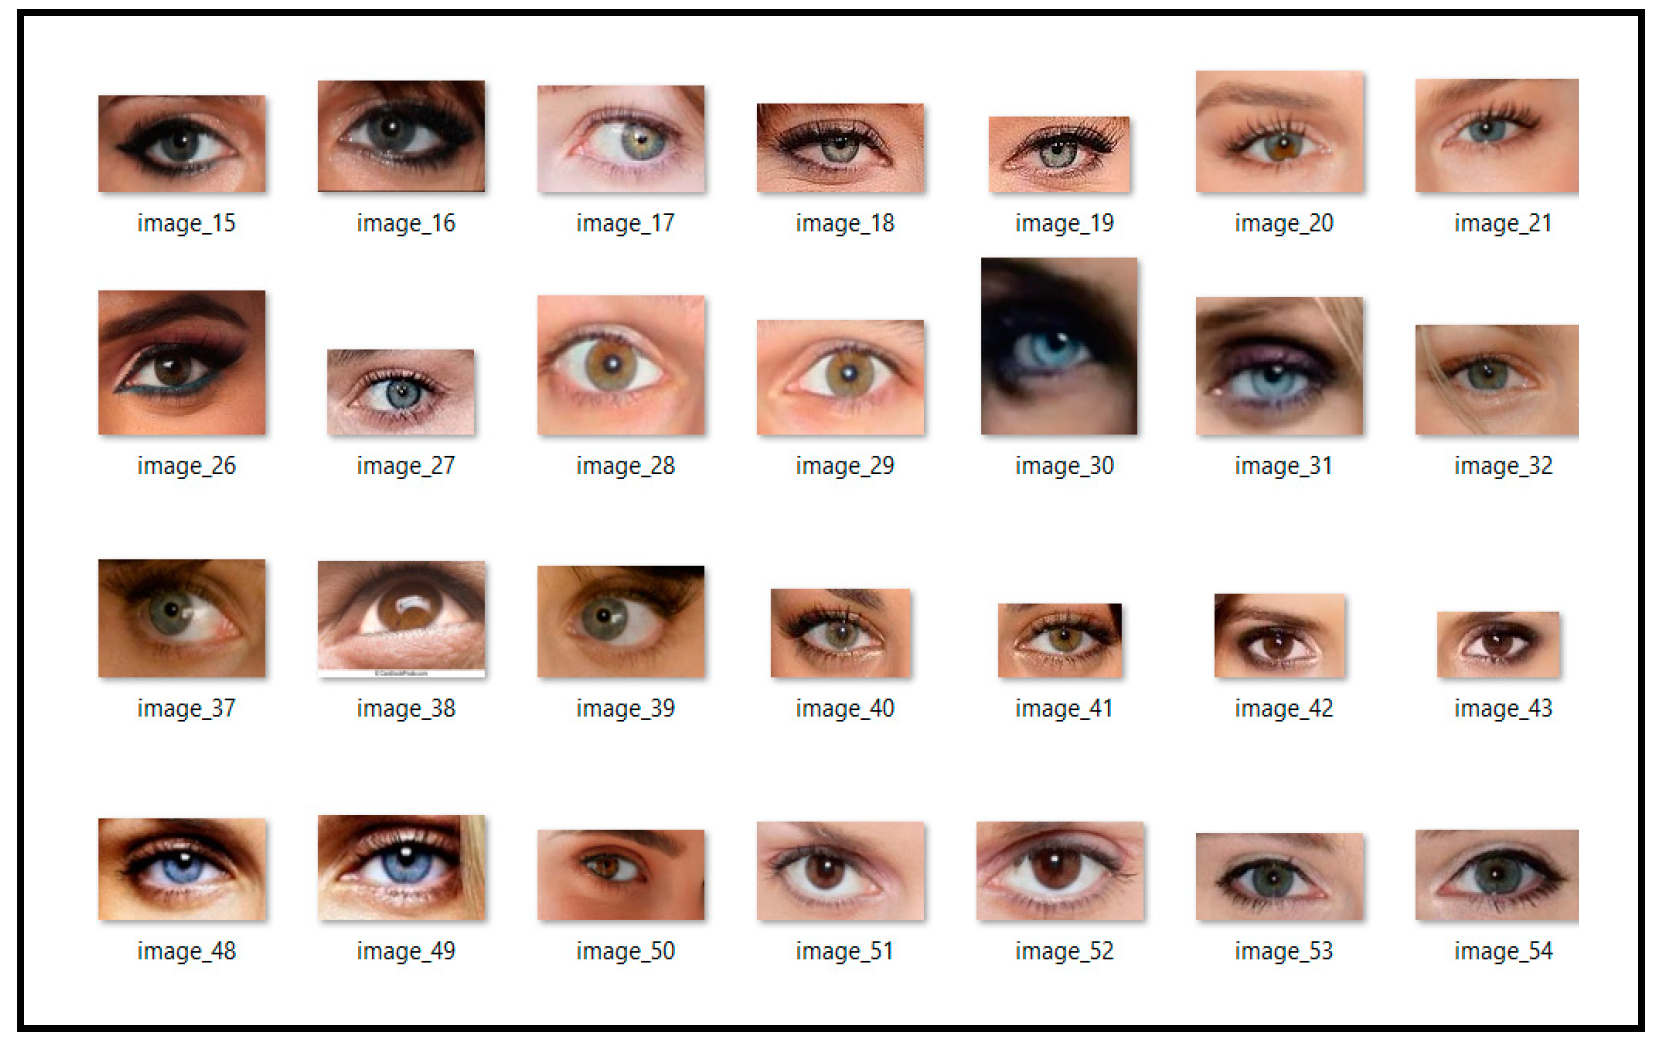
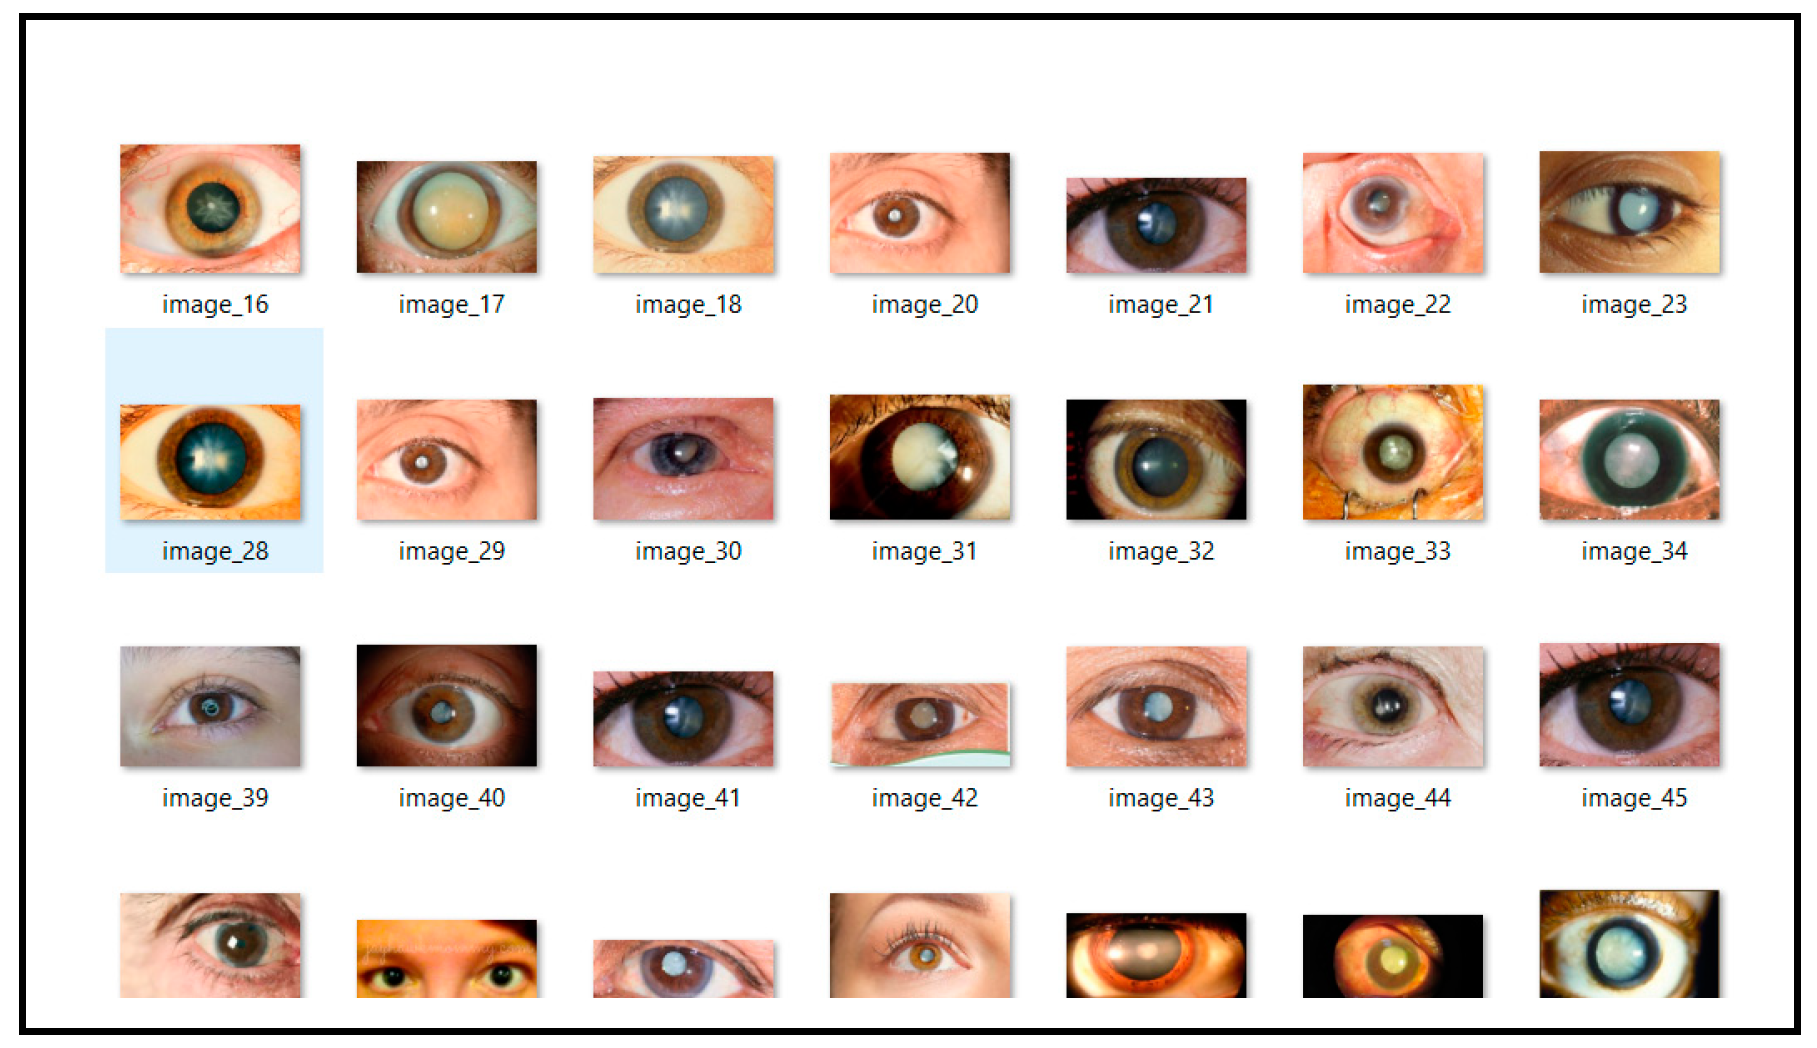
The dataset used in this study is specifically curated for the practical application of deep learning models in medical imaging, particularly for cataract detection. Sourced from Kaggle’s public repository, this dataset can be accessed at (https://www.kaggle.com/datasets/nandanp6/cataract-image-dataset (10 September 2024)). It contains a total of 609 eye images, comprising 305 normal eye images and 304 cataract-infected eye images. This balanced dataset is well-suited for training neural networks, ensuring reliable classification between normal and cataract-affected eyes. Each image is labeled as either “normal” or “cataract” and captured under consistent conditions to maintain quality and resolution. The balanced distribution of images minimizes the risk of class imbalance, a common issue in medical datasets, thereby enhancing model training and evaluation. Prior to model training, the images are preprocessed by resizing to a uniform dimension and normalizing pixel values, which helps improve the training efficiency and model convergence. This dataset is representative of a real-world clinical setting, containing variability in patient demographics and eye conditions. The diversity in the data enhances the model’s generalization ability across different cases, contributing to the robustness of the trained deep learning framework. By leveraging this dataset, the proposed hybrid deep learning model aims to achieve high accuracy in cataract detection, providing a potential tool for early diagnosis and effective treatment. Figure 1 and Figure 2 provide visual examples of the normal and cataract-infected eye images, respectively.

Figure 1.
Normal eye images.

Figure 2.
Cataract infected eye images.
3.1.2. Data Preprocessing
In the preprocessing stage, the dataset is prepared to ensure it meets the input requirements for the hybrid model, which combines a Siamese network and the VGG16 architecture. This process is outlined in Algorithm 1 and involves several key steps to handle the image data effectively. The images, consisting of both normal and cataract-infected eye samples, are first loaded from the respective folders for training and testing. Each image is converted to grayscale using the PIL library and then resized to a uniform dimension of 30 × 30 pixels to maintain consistency across the dataset. Grayscale conversion reduces computational complexity, allowing the hybrid Siamese-VGG16 model to process a single-channel image input. Following this, the pixel values of the images are normalized by scaling them to the range [0, 1], which is a standard step to enhance the model’s training performance and improve convergence. The dataset is then split into training and testing subsets, ensuring an independent evaluation of the model’s performance. In the hybrid model, the VGG16 architecture was employed for feature extraction, while the Siamese network architecture was used to measure similarity between image pairs. To prepare the data for this setup, the labels (“normal” or “cataract”) are encoded using LabelEncoder and then converted into one-hot encoded vectors, aligning with the model’s classification output layer. Finally, Grad-CAM (Gradient-weighted Class Activation Mapping) was integrated into the framework to provide explainability. This allows the visualization of the regions in the input images that the model focuses on during its prediction, offering insights into the decision-making process of the hybrid network.
| Algorithm 1: Data Preprocessing |
| Input: Image Data |
| Output: Preprocessed Data |
| dataPreprocessing(folder_path) |
| Load the dataset from specified folder paths (train and test sets) |
| Convert each image to grayscale |
| Resize each image to 30 × 30 pixels |
| Normalize the pixel values to the range [0, 1] |
| Append each image to the image list and its corresponding label to the label list |
| Encode the labels using LabelEncoder |
| One-hot encode the labels for the hybrid Siamese-VGG16 model |
| Return the processed dataset (X_train, X_test, y_train, y_test) |
| end dataPreprocessing |
This preprocessing pipeline was established to ensure that the dataset was appropriately formatted for the hybrid Siamese-VGG16 model. The resizing and normalization of images, combined with encoded labels, facilitate efficient training. Additionally, the integration of Grad-CAM enhances interpretability by highlighting the image regions that are most influential in the model’s predictions.
3.2. Methods
3.2.1. Proposed Architecture
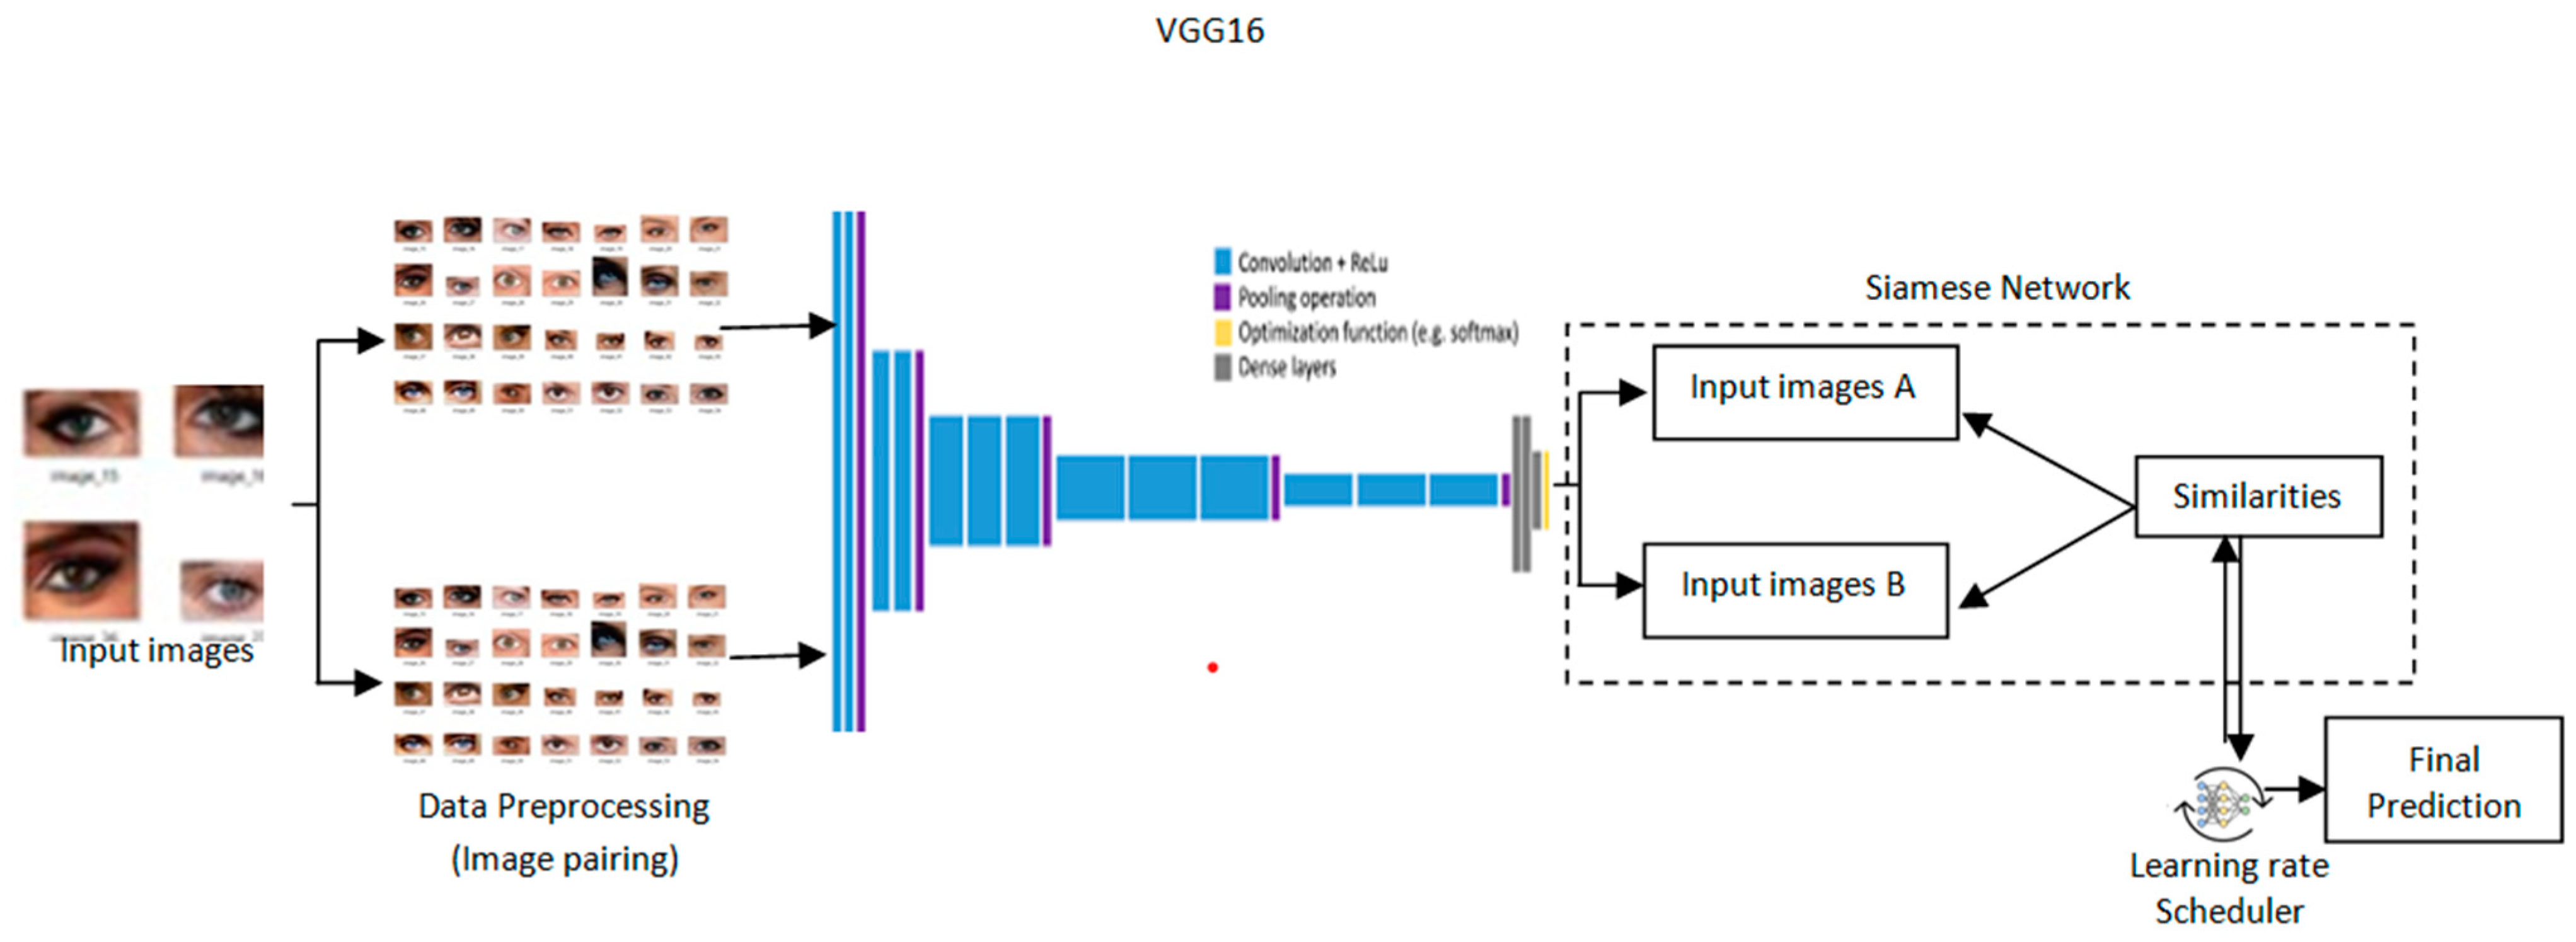
The architecture provides a design for cataract detection by marrying the Siamese network into a pre-trained VGG16 model with a learning rate scheduler to optimize training as depicted in Figure 3. Such a hybrid approach would leverage the strength of the Siamese network in comparing image pairs and the powerful feature extraction of VGG16 to perform both highly accurate and transparent medical imaging tasks. Grad-CAM is incorporated to provide visual insights into the model’s process, leading to a decision for high interpretability [23]. Its architecture is such that the network effectively detects cataracts, blending performance and explainability andserving as a useful health assistant.
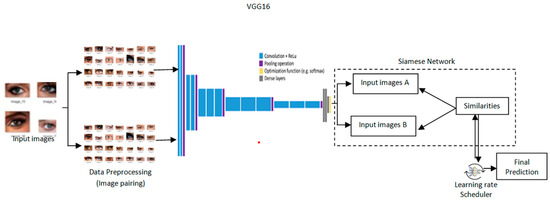
Figure 3.
Proposed architectureof Transformative detection of Cataract.
3.2.2. The Model
In the proposed model, a hybrid deep learning framework incorporating a Siamese network with the VGG16 architecture is used. Such architecture will easily compare pairs of medical images for cataract detection by leveraging deep feature extraction and similarity measurement. A learning rate scheduler is also adopted within the framework to optimize the training for better convergence and performance improvement.
- VGG16-based Siamese Network
A Siamese network is a type of neural network architecture that contains two or more identical sub-networks with shared weights and shared parameters [24]. In the work proposed herein, each sub-network consists of a VGG16 architecture, which is a convolutional neural network that normally is used for image recognition tasks. A Siamese network learns the similarity between pairs of input images.
- Feature Extraction
The Siamese Network first takes in feature extraction, wherein the input images are passed through the VGG16 model to represent the features.
Let and be the two input images to be compared. The function f(.;) is used for feature extraction, which represents the VGG16 network, where represents the trainable parameters of the network, i.e., weights and biases. The outputs from the two branches, two identical sub-networks, can be given by:
is the feature vector extracted from the first image . is the feature vector extracted from the second image . These feature vectors, and , contain the important characteristics of the respective images and are essential for measuring similarity.
- Distance Calculation
The next step in determining the similarity between these two images will then be in computing the distance between their feature representations. One good choice for the distance in a Siamese network can be the Euclidean distance, given by:
where n is the dimensionality of the feature vectors and . gives us a scalar value representing the distance between the two feature vectors. The output of the Siamese network is computed using the sigmoid function based on the distance calculated
The resulting distance is then transformed into a probability using the sigmoid function where , which maps the result to a value ranging between 0 and 1. This value represents the likelihood of the two images being similar (close to 1) or dissimilar (close to 0). The negative sign in front of the distance ensures that larger distances correspond to lower probabilities, thus effectively transforming similarity measures into probabilistic outputs that reflect the confidence in the similarity assessment.
- Learning Rate Scheduler
To further enhance the training efficiency of the Siamese Network, a learning rate scheduler is adopted. For this purpose, α can be tuned dynamically during training based on model performance. One common heuristic is to implement a schedule known as step decay, defined as:
where α(r) is thelearning rate at epoch and is the initial learning rate. The const_factor is a constant factor to reduce the learning rate and len_size defines how often the learning rate is reduced.
- Hybrid Deep Learning Approach
In this hybrid framework, the output from the Siamese network is combined with those of additional models for improving the overall performance. Indeed, this makes particular sense for tasks in which different models capture different aspects of the data.
- Model Integration
Let us assume that we have L different models, including the Siamese network. Each of these models processes the feature vectors and generates an output.
We can represent the output from the l-th model as:
For l = 1, 2, …, L here, is the prediction function for l-th model; is the trainable parameter that is specific to the l-th model.The flexibility here is that it allows the involvement of other models to enhance predictability and robustness.
The ensemble prediction is computed as the average of all model outputs:
The proposed hybrid deep learning framework combines Siamese network architecture and a pre-trained VGG16 base for image similarity detection. It processes pairs of images through identical subnetworks—weight sharing—with the intent of efficiently comparing their features. Pre-trained VGG16 on ImageNet has been used here as a feature extractor with reduced training data requirements [25]. The full connection layers after extracting the features are of a dropout that helps prevent overfitting. The similarity was calculated using the Euclidean distance between image features. In addition, binary classification was performed. The Adam optimizer was used along with a binary cross-entropy loss; the learning rate scheduler was adjusted during training. Data augmentation and Grad-CAM enhanced model robustness and interpretability on cataract detection-like tasks.
The algorithmic implementation detailing the integration of these models is presented in Algorithm 2.
| Algorithm 2: Siamese Network for Cataract Detection |
| Input: Image dataset |
| Output: Trained Siamese network model for cataract detection and |
| Grad-CAM visualizations for the interpretation of model predictions. |
| readImagesFromFolder(folderPath) |
| imageList <- empty list |
| labelList <- empty list |
| subfolders <- list of directories in folderPath |
| for each subfolder in subfolders |
| subfolderPath <- concatenate(folderPath, subfolder) |
| if subfolderPath is a directory |
| images <- list of files in subfolderPath |
| for each imageFile in images |
| imagePath <- concatenate(subfolderPath, imageFile) |
| if imagePath is a file |
| image <- open imagePath |
| image <- resize(image, mysize) |
| image <- convert image to array |
| image <- image.astype(‘float32’) |
| image <- image / 255 |
| if image is not None |
| append image to imageList |
| append subfolder to labelList |
| return imageList, labelList |
| createPairs(images, labels, numPairs) |
| pairImages <- empty list |
| pairLabels <- empty list |
| labelDict <- map labels to indices |
| labelToIndices <- map label indices to image indices |
| uniqueLabels <- list of labels in labelDict |
| if numPairs is None |
| numPairs <- 10,000 // default value |
| for _ in 1 to numPairs |
| if random() > 0.5 |
| label <- randomly choose from uniqueLabels |
| idx1, idx2 <- randomly select two indices from labelToIndices[label] |
| append (images[idx1], images[idx2]) to pairImages |
| append 1 to pairLabels // similar |
| else |
| label1, label2 <- randomly choose two different labels from uniqueLabels |
| idx1 <- randomly choose from labelToIndices[label1] |
| idx2 <- randomly choose from labelToIndices[label2] |
| append (images[idx1], images[idx2]) to pairImages |
| append 0 to pairLabels // dissimilar |
| return pairImages, pairLabels |
| folderPath <- ‘D:\\datasets\\eyeCataract\\processed_images’ |
| trainFolderPath <- concatenate(folderPath, ‘train’) |
| trainImages, trainLabels <- readImagesFromFolder(trainFolderPath) |
| testFolderPath <- concatenate(folderPath, ‘test’) |
| testImages, testLabels <- readImagesFromFolder(testFolderPath) |
| trainPairs, trainLabels <- createPairs(trainImages, trainLabels, numPairs =10,000) |
| testPairs, testLabels <- createPairs(testImages, testLabels, numPairs = 1000) |
| createBaseNetwork(inputShape) |
| baseModel <- load VGG16 model with ImageNet weights, exclude top layer |
| for each layer in baseModel.layers |
| set layer.trainable to false |
| model <- new SequentialModel |
| model.add(baseModel) |
| model.add(Flatten()) |
| model.add(Dense(128, activation = ‘relu’)) |
| model.add(Dropout(0.5)) |
| model.add(Dense(128, activation = ‘relu’)) |
| return model |
| euclideanDistance(vectors) |
| featuresA, featuresB <- vectors |
| sumSquared <- reduce sum of square differences between featuresA and featuresB |
| return sqrt(max(sumSquared, epsilon)) |
| inputShape <- (64, 64, 3) |
| inputA <- create input layer with shape inputShape |
| inputB <- create input layer with shape inputShape |
| baseNetwork <- createBaseNetwork(inputShape) |
| featA <- baseNetwork(inputA) |
| featB <- baseNetwork(inputB) |
| distance <- Lambda(euclideanDistance, output_shape = (1,))([featA, featB]) |
| output <- Dense(1, activation = "sigmoid")(distance) |
| siameseModel <- create model with inputs [inputA, inputB] and output output |
| siameseModel.compile(optimizer = "adam", loss = "binary_crossentropy", metrics = ["accuracy"]) |
| trainX <- convert trainPairs to array |
| trainY <- convert trainLabels to array |
| reduceLR <- ReduceLROnPlateau(monitor = ‘val_loss’, factor = 0.2, patience = 5, min_lr = 1 × 10⁻⁶, verbose = 1) |
| fit siameseModel |
| inputs <- [trainX[:, 0], trainX[:, 1]] |
| labels <- trainY |
| epochs <- 20 |
| validation_data <- ([testPairs[:, 0], testPairs[:, 1]], testLabels) |
| callbacks <- [reduceLR] |
| gradCam(inputModel, img, layerName) |
| gradModel <- create model that maps input image to activations of layerName and output predictions |
| with GradientTape |
| convOutputs, predictions <- gradModel(expand img to batch dimension) |
| loss <- predictions of predicted class |
| output <- convOutputs[0] |
| grads <- gradient of loss with respect to convOutputs |
| weights <- reduce mean of grads along axes 0 and 1 |
| cam <- initialize array of ones with shape of output‘s first two dimensions |
| for i, w in enumerate(weights) |
| cam += w output[:, :, i] |
| cam <- resize cam to (64, 64) |
| cam <- max(cam, 0) |
| heatmap <- normalize(cam) |
| return heatmap |
| exampleImg1 <- testPairs[0][0] |
| exampleImg2 <- testPairs[0][1] |
| heatmap1 <- gradCam(baseNetwork, exampleImg1, layerName = ‘block5_conv3’) |
| heatmap2 <- gradCam(baseNetwork, exampleImg2, layerName = ‘block5_conv3’) |
| create visualization |
| create figure with size (10, 5) |
| add subplot for image 1 with heatmap1 |
| add title ‘Grad-CAM for Image 1’ |
| add subplot for image 2 with heatmap2 |
| add title ‘Grad-CAM for Image 2’ |
| show visualization |
4. Results
This section presents the results and findings of the experimental study conducted to develop a hybrid Siamese-VGG16 model for accurate cataract detection. The performance of the model wasevaluated based on its classification accuracy, precision, recall, and F1 score. Additionally, the interpretability of the model’s predictions wasenhanced through the application of Grad-CAM, providing insights into the decision-making process of the model.
4.1. Performance Evaluation Metrics
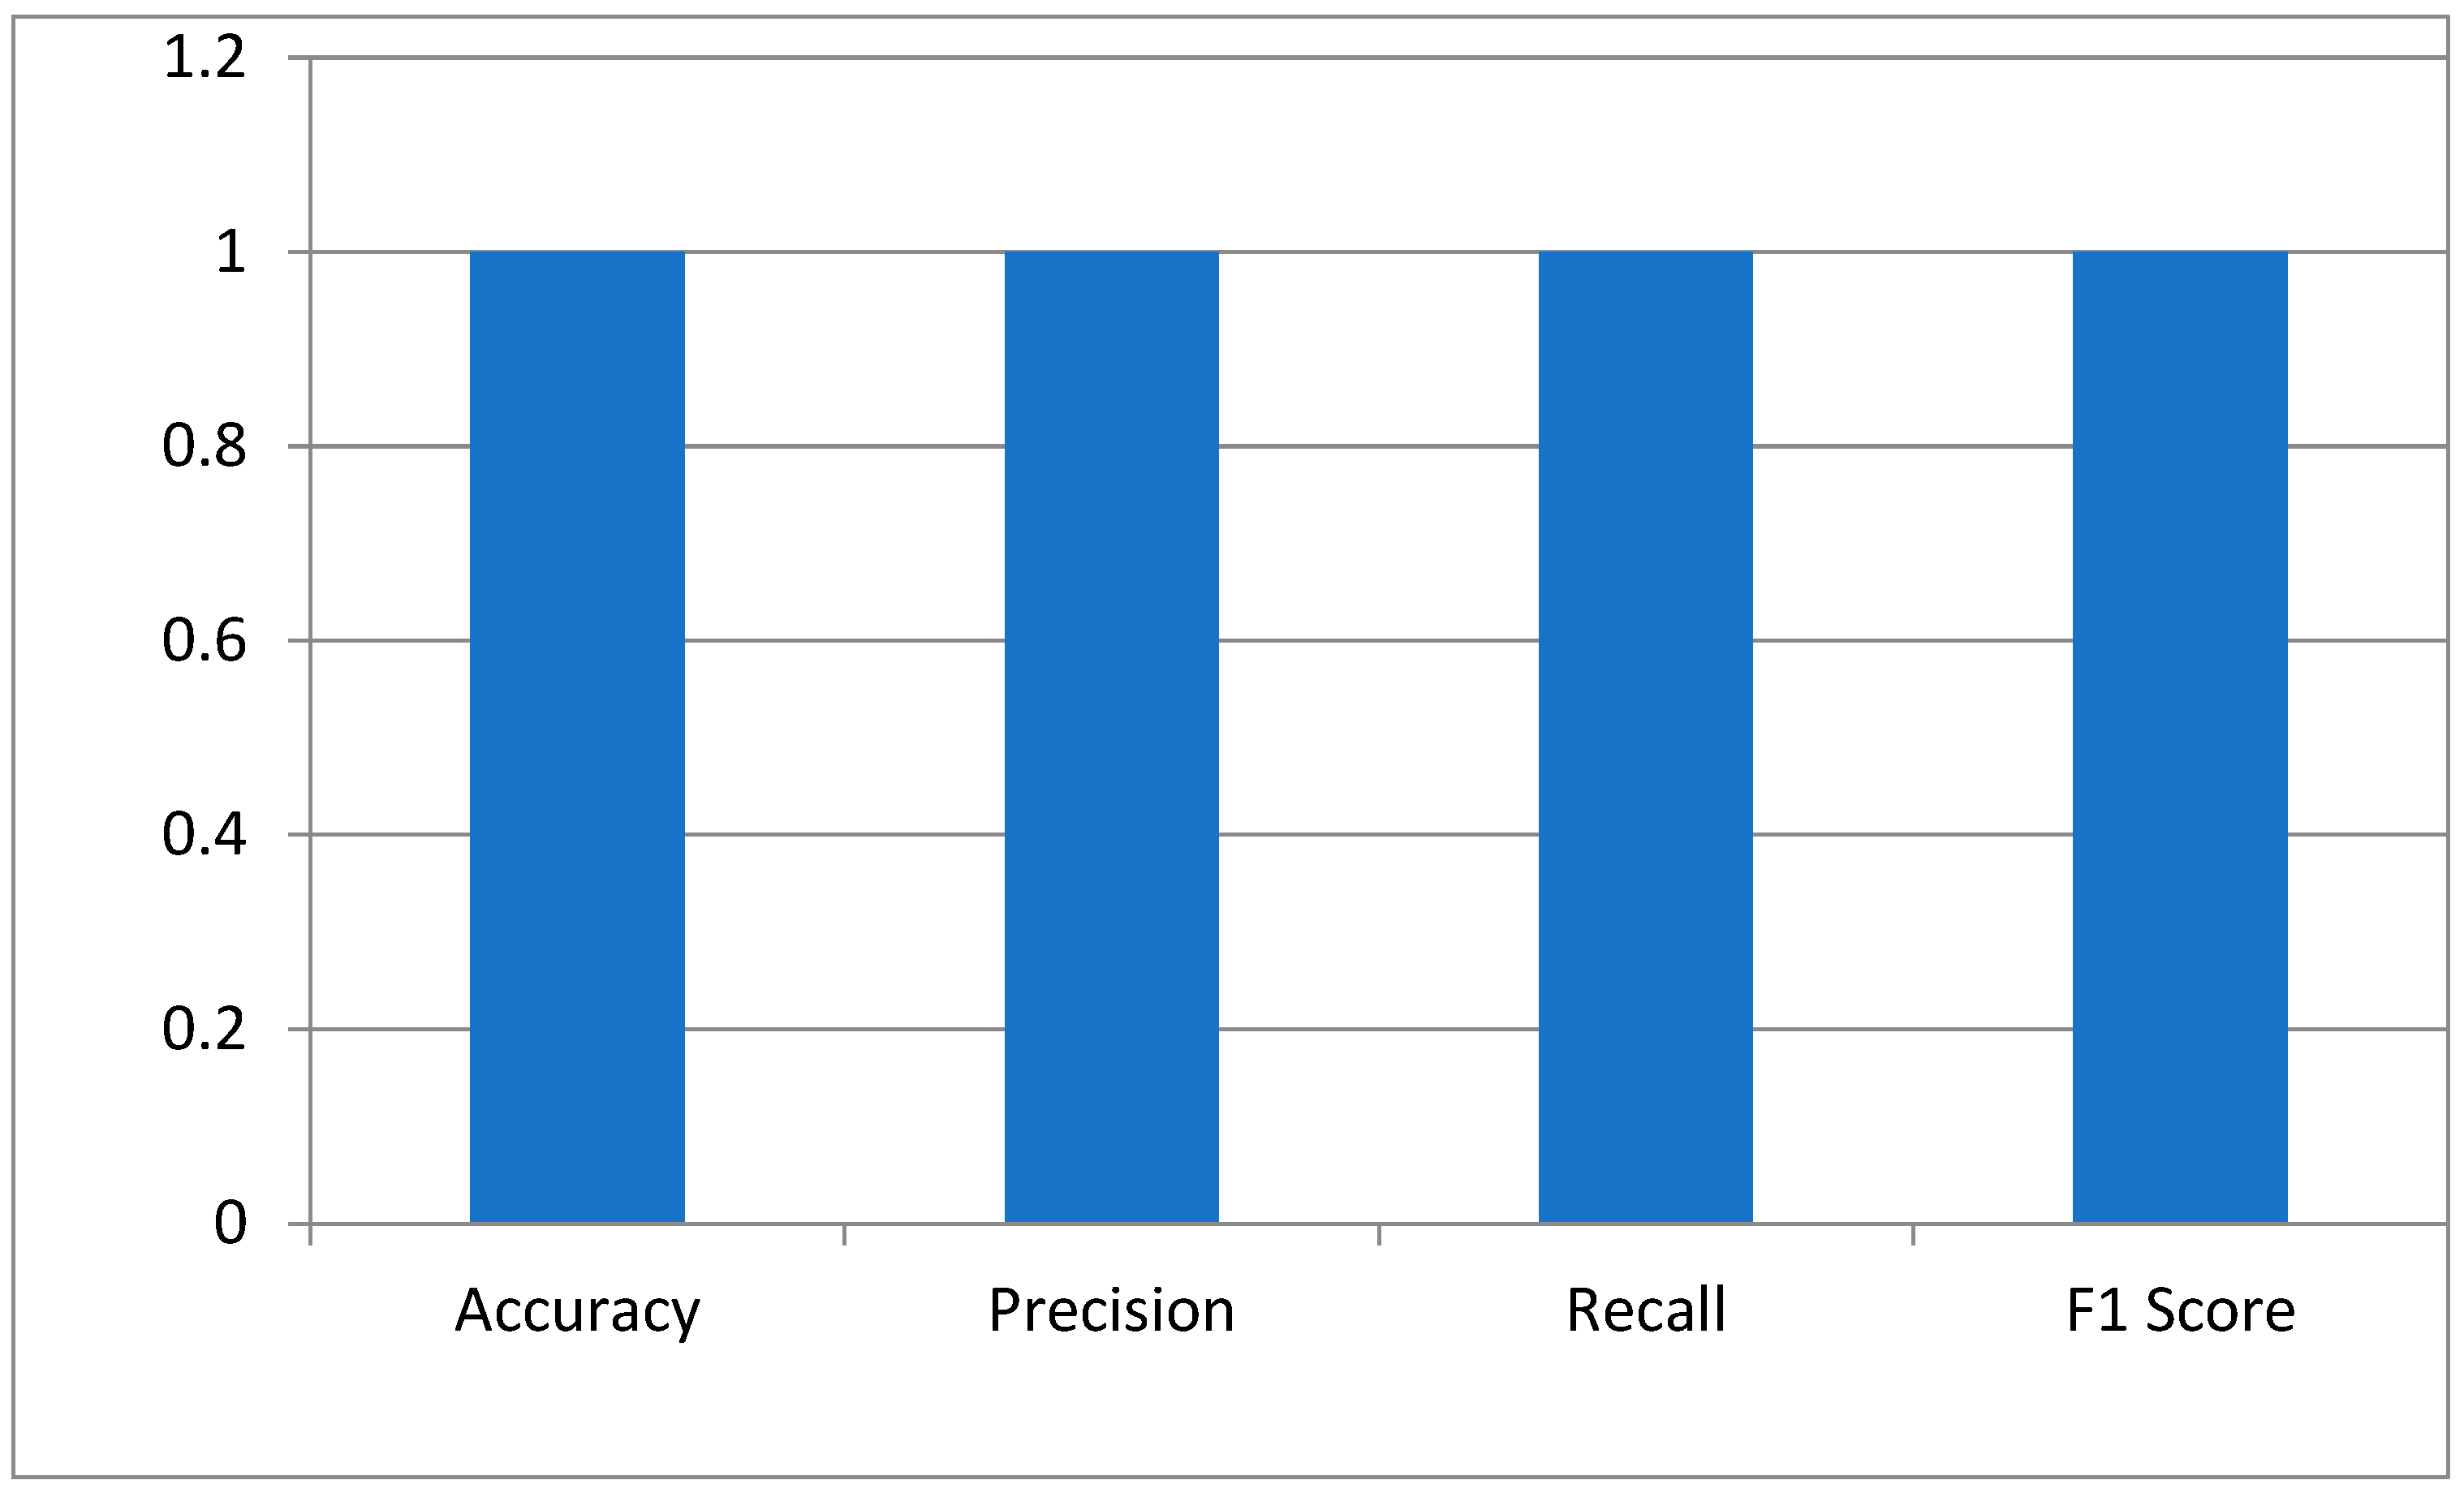
The key performance indicators of the hybrid Siamese-VGG16 model for cataract detection were measured using accuracy, precision, recall, and the F1 score. Accuracy is a measure that calculates the proportion of correctly classified images. The perfect score of 1.0 means the model has identified all normal and cataract-infected images correctly. Precision is generally defined as the reliability of the model in predicting cataract cases. The score of 1.0 depicts no false positive. The recall showed that the model has measured all cataract cases. An F1 score of 1.0 shows that precision and recall have the best balance, hence the optimum performance of the model with a minimum error in the medical diagnosis as shown in Figure 4.
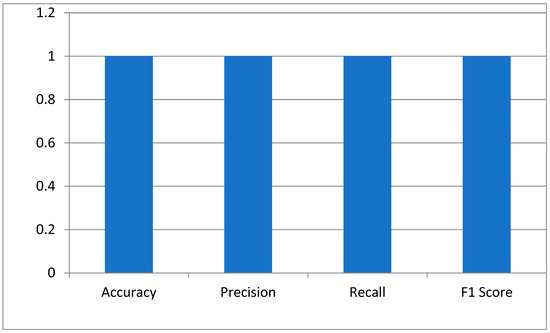
Figure 4.
The model’s performance metrics.
To further evaluate the performance of the hybrid model, a confusion matrix was generated, as illustrated in Figure 5 This matrix provides a comprehensive overview of the classification model’s ability to distinguish between eye images categorized as cataract and normal. As depicted in Figure 5, the rows in the confusion matrix correspond to the true classes, while the columns represent the predicted classes generated by the model. The results indicate that the model accurately identified 61 instances of cataract images, showcasing its effectiveness in recognizing this condition. Additionally, it correctly classified 60 instances as normal, underscoring its robust performance in identifying healthy eye images. Importantly, the model demonstrated no false positives, meaning it did not misclassify any normal images as cataract cases. Likewise, there were no false negatives, signifying that the model did not overlook any instances of cataract. This performance level reflects impressive accuracy across both classes. The metrics derived from the confusion matrix suggest that the model possesses an exceptional ability to differentiate between cataract and normal eye images, highlighting its reliability and effectiveness in clinical settings.
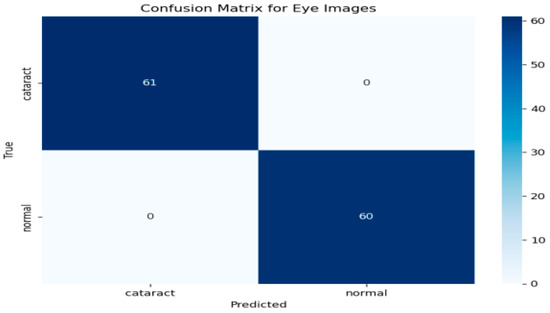
Figure 5.
Confusion matrix for the cataract detection model.
To further evaluate the performance of the hybrid model, the Receiver Operating Characteristic (ROC) curve was analyzed, as shown in Figure 6. This curve is essential for assessing the model’s ability to distinguish between cataract and normal eye images by illustrating the relationship between the True Positive Rate (TPR) and the False Positive Rate (FPR) across various threshold settings. The TPR indicates the proportion of actual cataract cases correctly identified by the model, while the FPR reflects the proportion of normal cases misclassified as positives. The ROC curve’s proximity to the upper left corner demonstrates the model’s high sensitivity and low false positive rate. Notably, the model achieved a perfect area under the ROC curve (AUC) of 1.00, indicating exceptional classification capability and a strong ability to differentiate between the two classes.
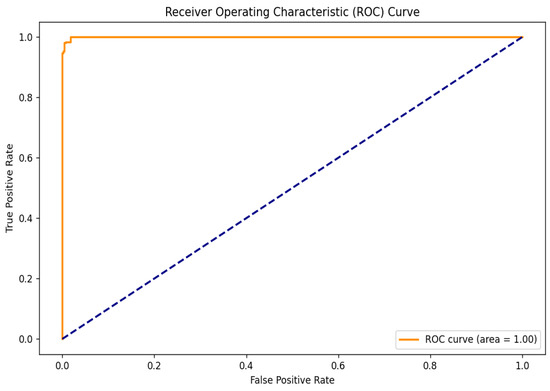
Figure 6.
ROC curve.
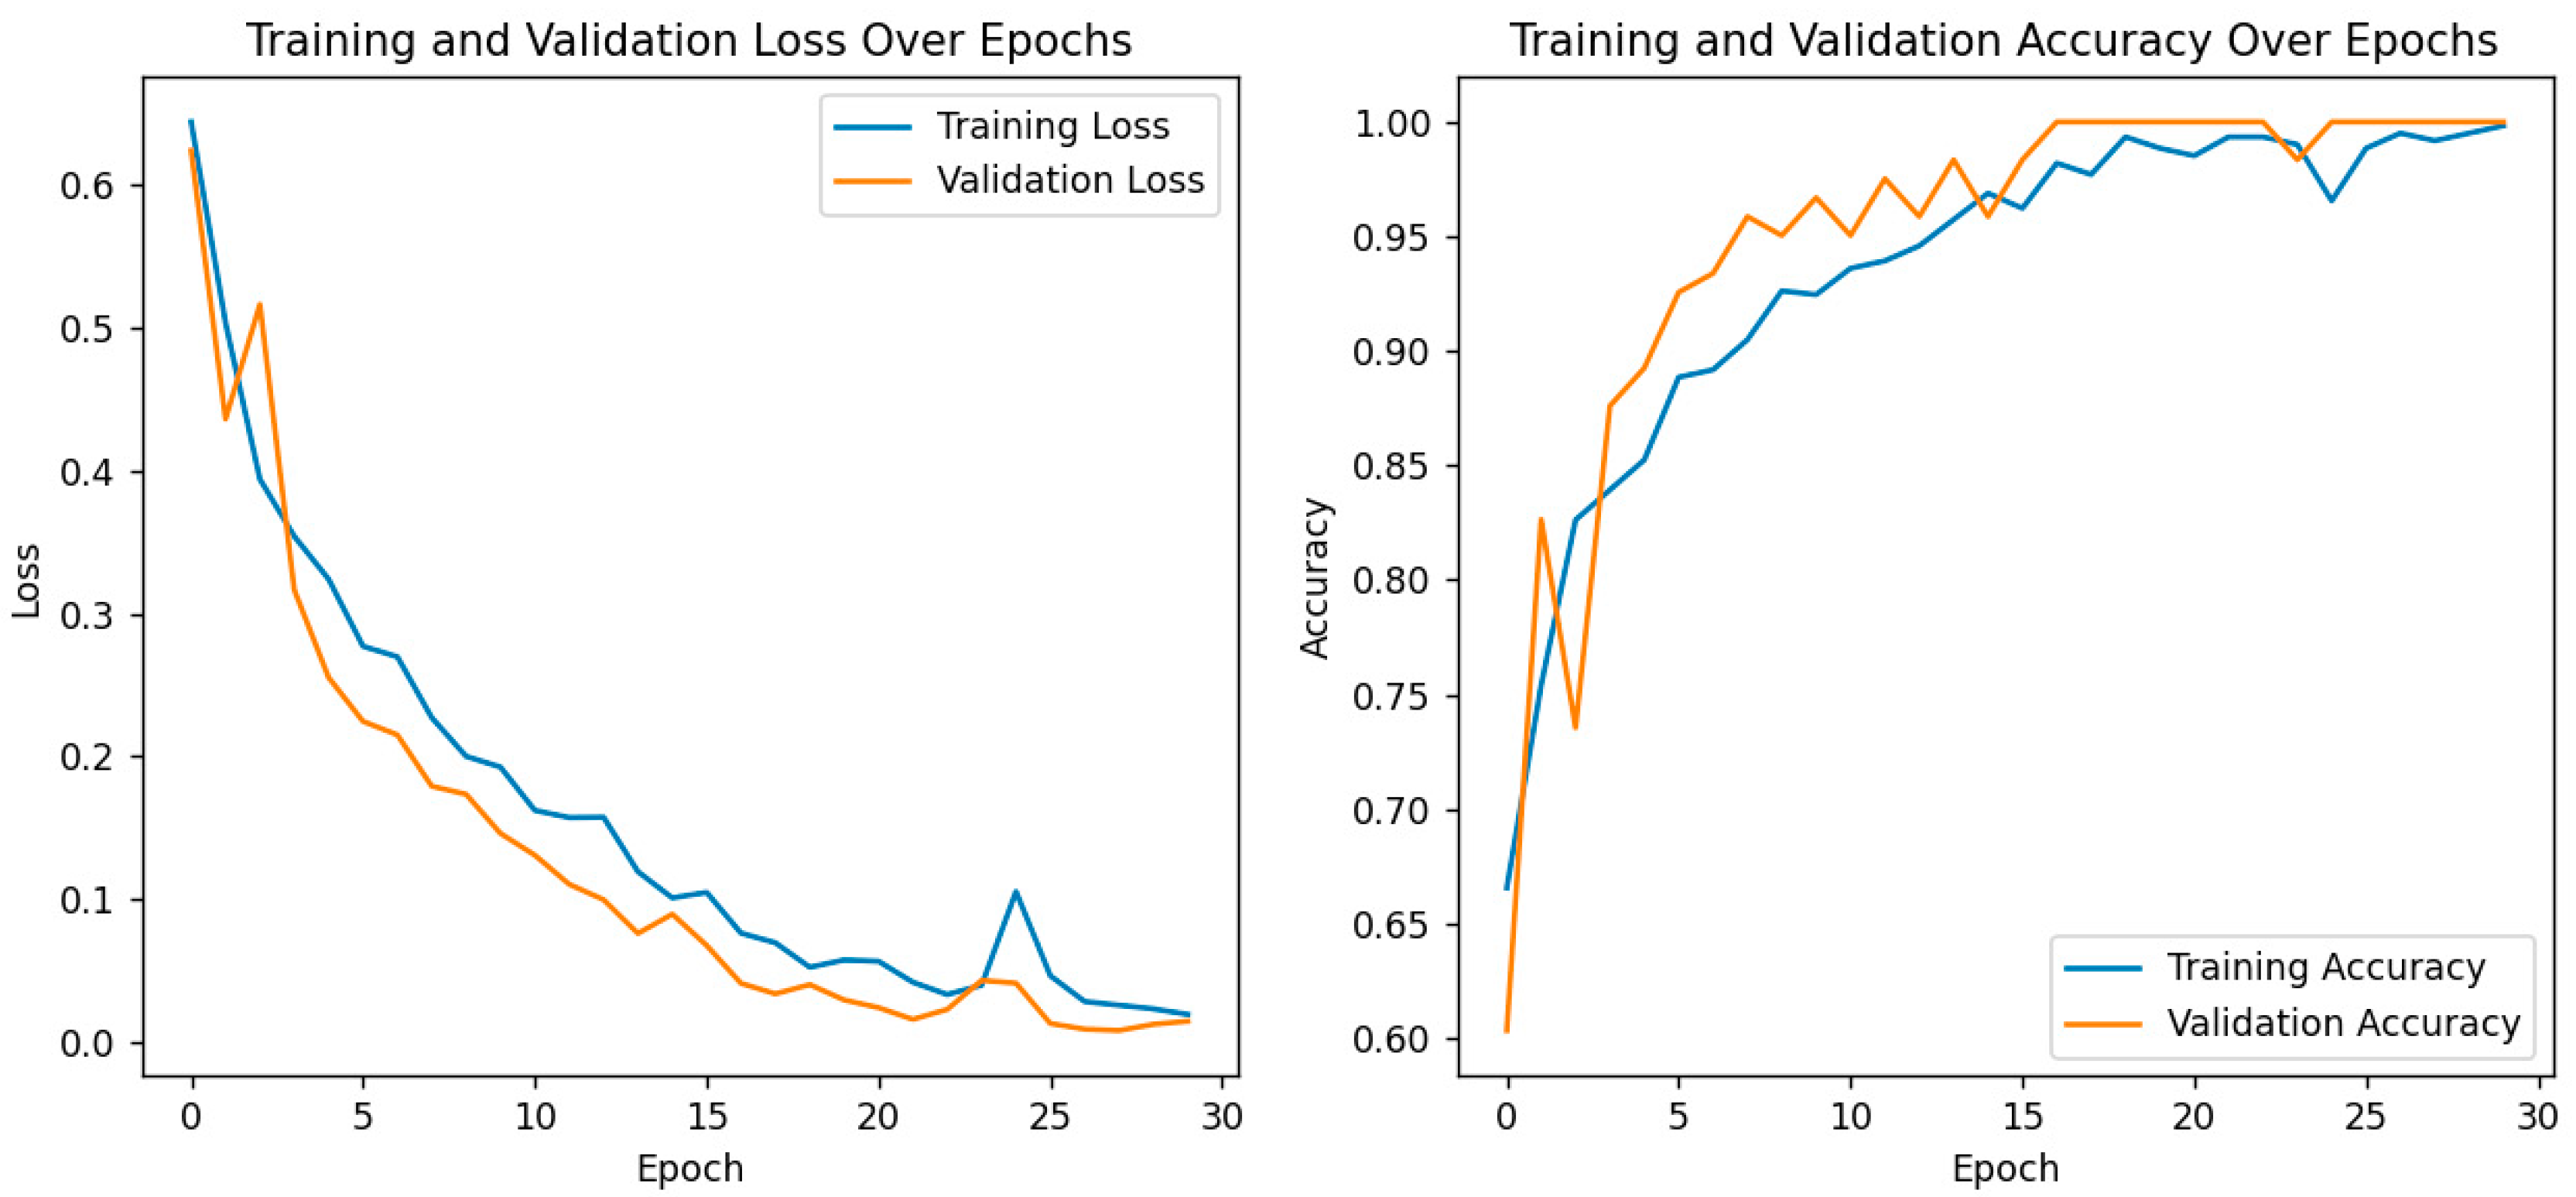
For further performance evaluation of the hybrid model, both training and validation loss and accuracy are presented with great care, as shown in the following plots as depicted in Figure 7. On the left, it shows a plot of training and validation loss across the epochs, where both are consistently decreasing. That means this model is learning well, the training loss decreases with the increase in the number of epochs, and it also shows that the trend in the validation loss has a similar shape, which suggests that the generalization capability of the model does not become hampered due to overfitting. The right plot depicts the model’s accuracy for both training and validation phases. While both training and validation accuracy steadily increased, the former reached an almost 100% value toward the end of epochs. The latter also showed strong improvement, with values closing in on the same heights, thereby proving the model’s strength for differentiating cataract images from normal ones. These results are particularly important in the context of the previously discussed confusion matrix and ROC curve analyses, which already confirmed the correctness of eye image classification by this model. The convergence of training and validation accuracy, together with a small gap between their values, points to the strong predictive performance of the model and further potential use in clinical applications. Overall, training and validation metrics justify the effectiveness of the model and increase its leading role as a robust diagnostic tool for eye health assessment.
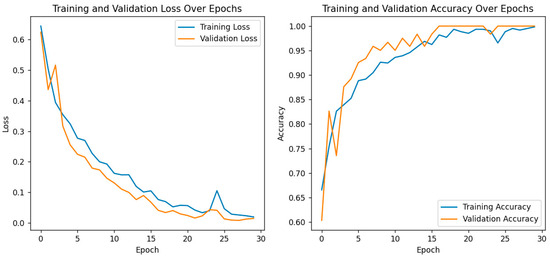
Figure 7.
Training and validation loss/accuracy.
4.2. Comparative Analysis
4.2.1. Ablation Analysis
Ablation studies in this section will discuss the contributions of different components in the proposed model, as depicted in Table 1. Ablation studies are a necessary method where one can learn how different components contribute to the overall performance of the model. Feature selection can be carried out through complete removal or modification in order to study its particular implications in isolation and understand which specific elements play the most critical role in achieving superior results. The study helps validate that the effectiveness of the specific design choices provides potential areas of improvement.

Table 1.
Ablation analysis. ("✓" indicates the inclusion of a component, "X" indicates exclusion).
Ablation experiments serve to show that every part of the model proposed in this paper contributes a great deal to its performance. Removing or tampering with certain elements of the model, such as the attention mechanism or feature extraction layers, causes significant degradation in accuracy and general performance. This says a lot about the inclusion of these components in arriving at the metrics of performance attained. In light of such observations, these findings reassure the rationale behind the design and every element’s importance in the model’s architecture. In the ablation study, a range of model configurations was tested in terms of their influence on the accuracy of cataract detection. A series of experiments were performed by adding or removing components systematically from the proposed architecture, which includes a VGG16 model, a Siamese network, explainability through Grad-CAM, and finally a learning rate scheduler. Accuracy, precision, recall, and F1score are the metrics through which each component’s contribution was considered toward the final model. The performance of the VGG16 baseline model achieved very good performance but failed to catch some of the positive cases with 88.0% accuracy. Then, the introduction of a learning rate scheduler increased performance significantly, up to 91.0%, while the use of VGG16 combined with a Siamese network pushed this result even further to 92.5%, increasing its ability to distinguish between healthy and cataract-affected images. Finally, when both the Siamese network and learning rate scheduler were put to work together, the model performed with perfect classification (100% accuracy). However, adding explainability using Grad-CAM did not reduce performance but added great value in interpretability—informing how the model made a prediction. This final model combined all the components mentioned earlier and achieved the perfect score for an optimal balance of high performance with transparency.
Alongside the actual image sampled from the test set, Figure 8 visually presents the Grad-CAM outputs for each model across different configurations.
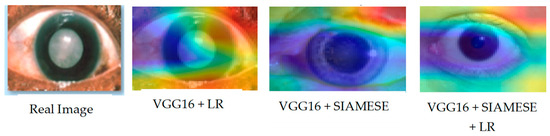
Figure 8.
Grad-CAM visualization across the ablation experiment.
The Grad-CAM images give a clear view of the contribution of each component toward the performance of the model as a whole. In the complete model, well-defined, focused regions of interest point to the importance of each component. Degradation reinforced by ablation settings shows their importance. These further illustrate how visualizations are used in providing insight into how the model processes data in order to understand and validate its design.
4.2.2. Analysis of Grad-CAM Outputs Using KL Divergence for Model Comparison
This section analyzed the Grad-CAM outputs generated from different model configurations, as shown in Table 2, by employing Kullback–Leibler (KL) divergence as a quantitative measure of the similarity between the generated heatmaps. Specifically, Heatmap1 represents the Grad-CAM output from VGG16 combined with a learning rate scheduler, Heatmap2 represents the Grad-CAM output from VGG16 combined with a Siamese architecture, and Heatmap3 represents the Grad-CAM output from VGG16 combined with both Siamese architecture and the learning rate scheduler.
Table 2.
Analysis of the Grad-CAM outputs using KL divergence.
Overall, the KL divergence analysis revealed that while similarities existed in the focus of the Grad-CAM outputs among the different model configurations, distinct variations reflected the unique characteristics learned by each model. The closeness of the KL divergence values between Heatmap2 and Heatmap3 suggests that these configurations might benefit from further investigation to understand their respective impacts on model interpretability and performance. Future analysis could explore how these differences in focus correlate with the models’ predictive accuracies on the test set.
4.2.3. Proposed Analysis with Other Schemes
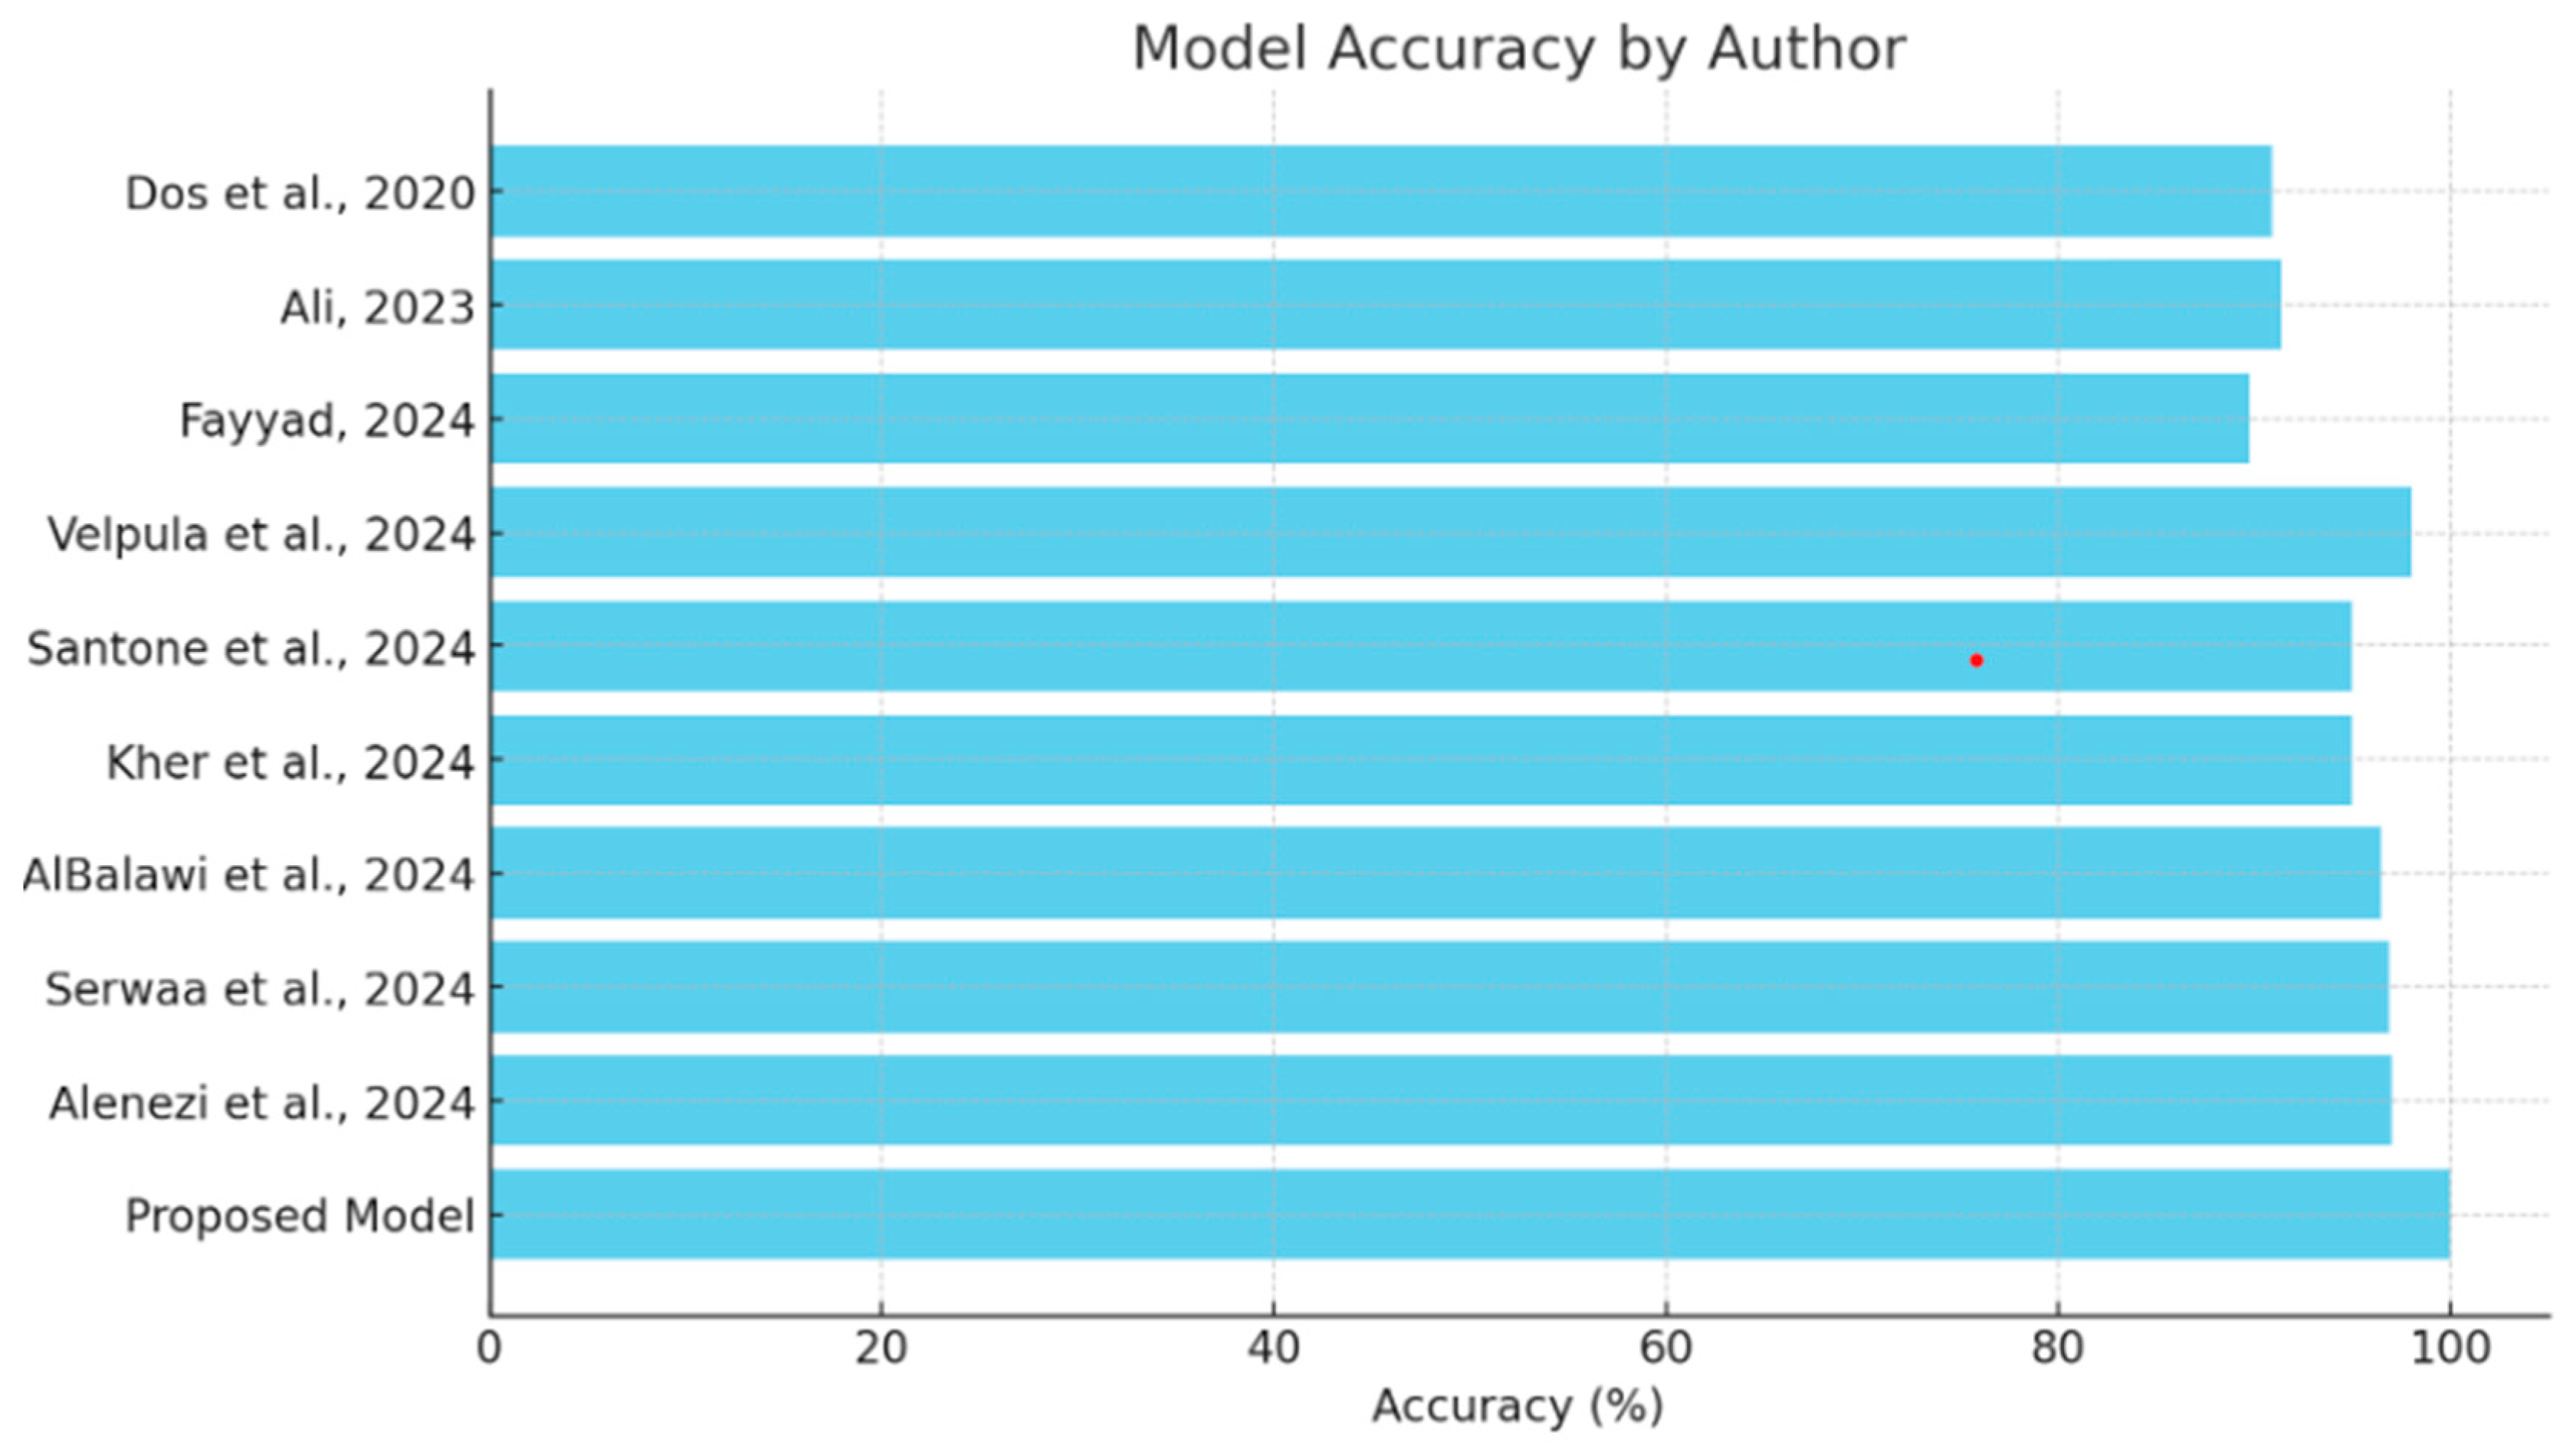
This section will provide a comparative review of the various models and methodologies applied to the detection of diseases of the eye, focusing on the effectiveness of all methodologies in the field as depicted in Table 3. The comparison of each will be performed with others in view of the ability to diagnose conditions such as glaucoma, cataracts, and other ocular diseases, complemented by explainability tools. This comparison also puts in perspective the strengths and limitations of the existing models against the proposed hybrid deep learning model as shown in Figure 9, which integrates VGG16 with a Siamese network and learning rate scheduler. Research should focus on performance metrics related to accuracy while embedding explainability methods such as Grad-CAM and explainable AI in order to show steps toward both high precision and interpretive transparency in medical diagnosis.
Table 3.
Table of comparison.

Figure 9.
Comparison of model accuracy [13,14,15,16,17,18,19,20,21].
The comparison analysis shows that different deep learning methodologies have been applied to detect ocular diseases, each with its own distinct advantages in accuracy and explainability, as shown in Figure 8. Models like Velpula et al.’s [16] and Alenezi et al.’s [21] ensemble model show high accuracy, while some lack reported performance metrics. The proposed hybrid deep learning model, which combines VGG16 and a Siamese network with a learning rate scheduler, achieves superior accuracy (100%) and incorporates the Grad-CAM explainability tool. This positions the proposed model as a state-of-the-art solution in cataract detection, excelling in both accuracy and the transparency of decision-making, making it a valuable asset in medical diagnostics.
5. Discussion
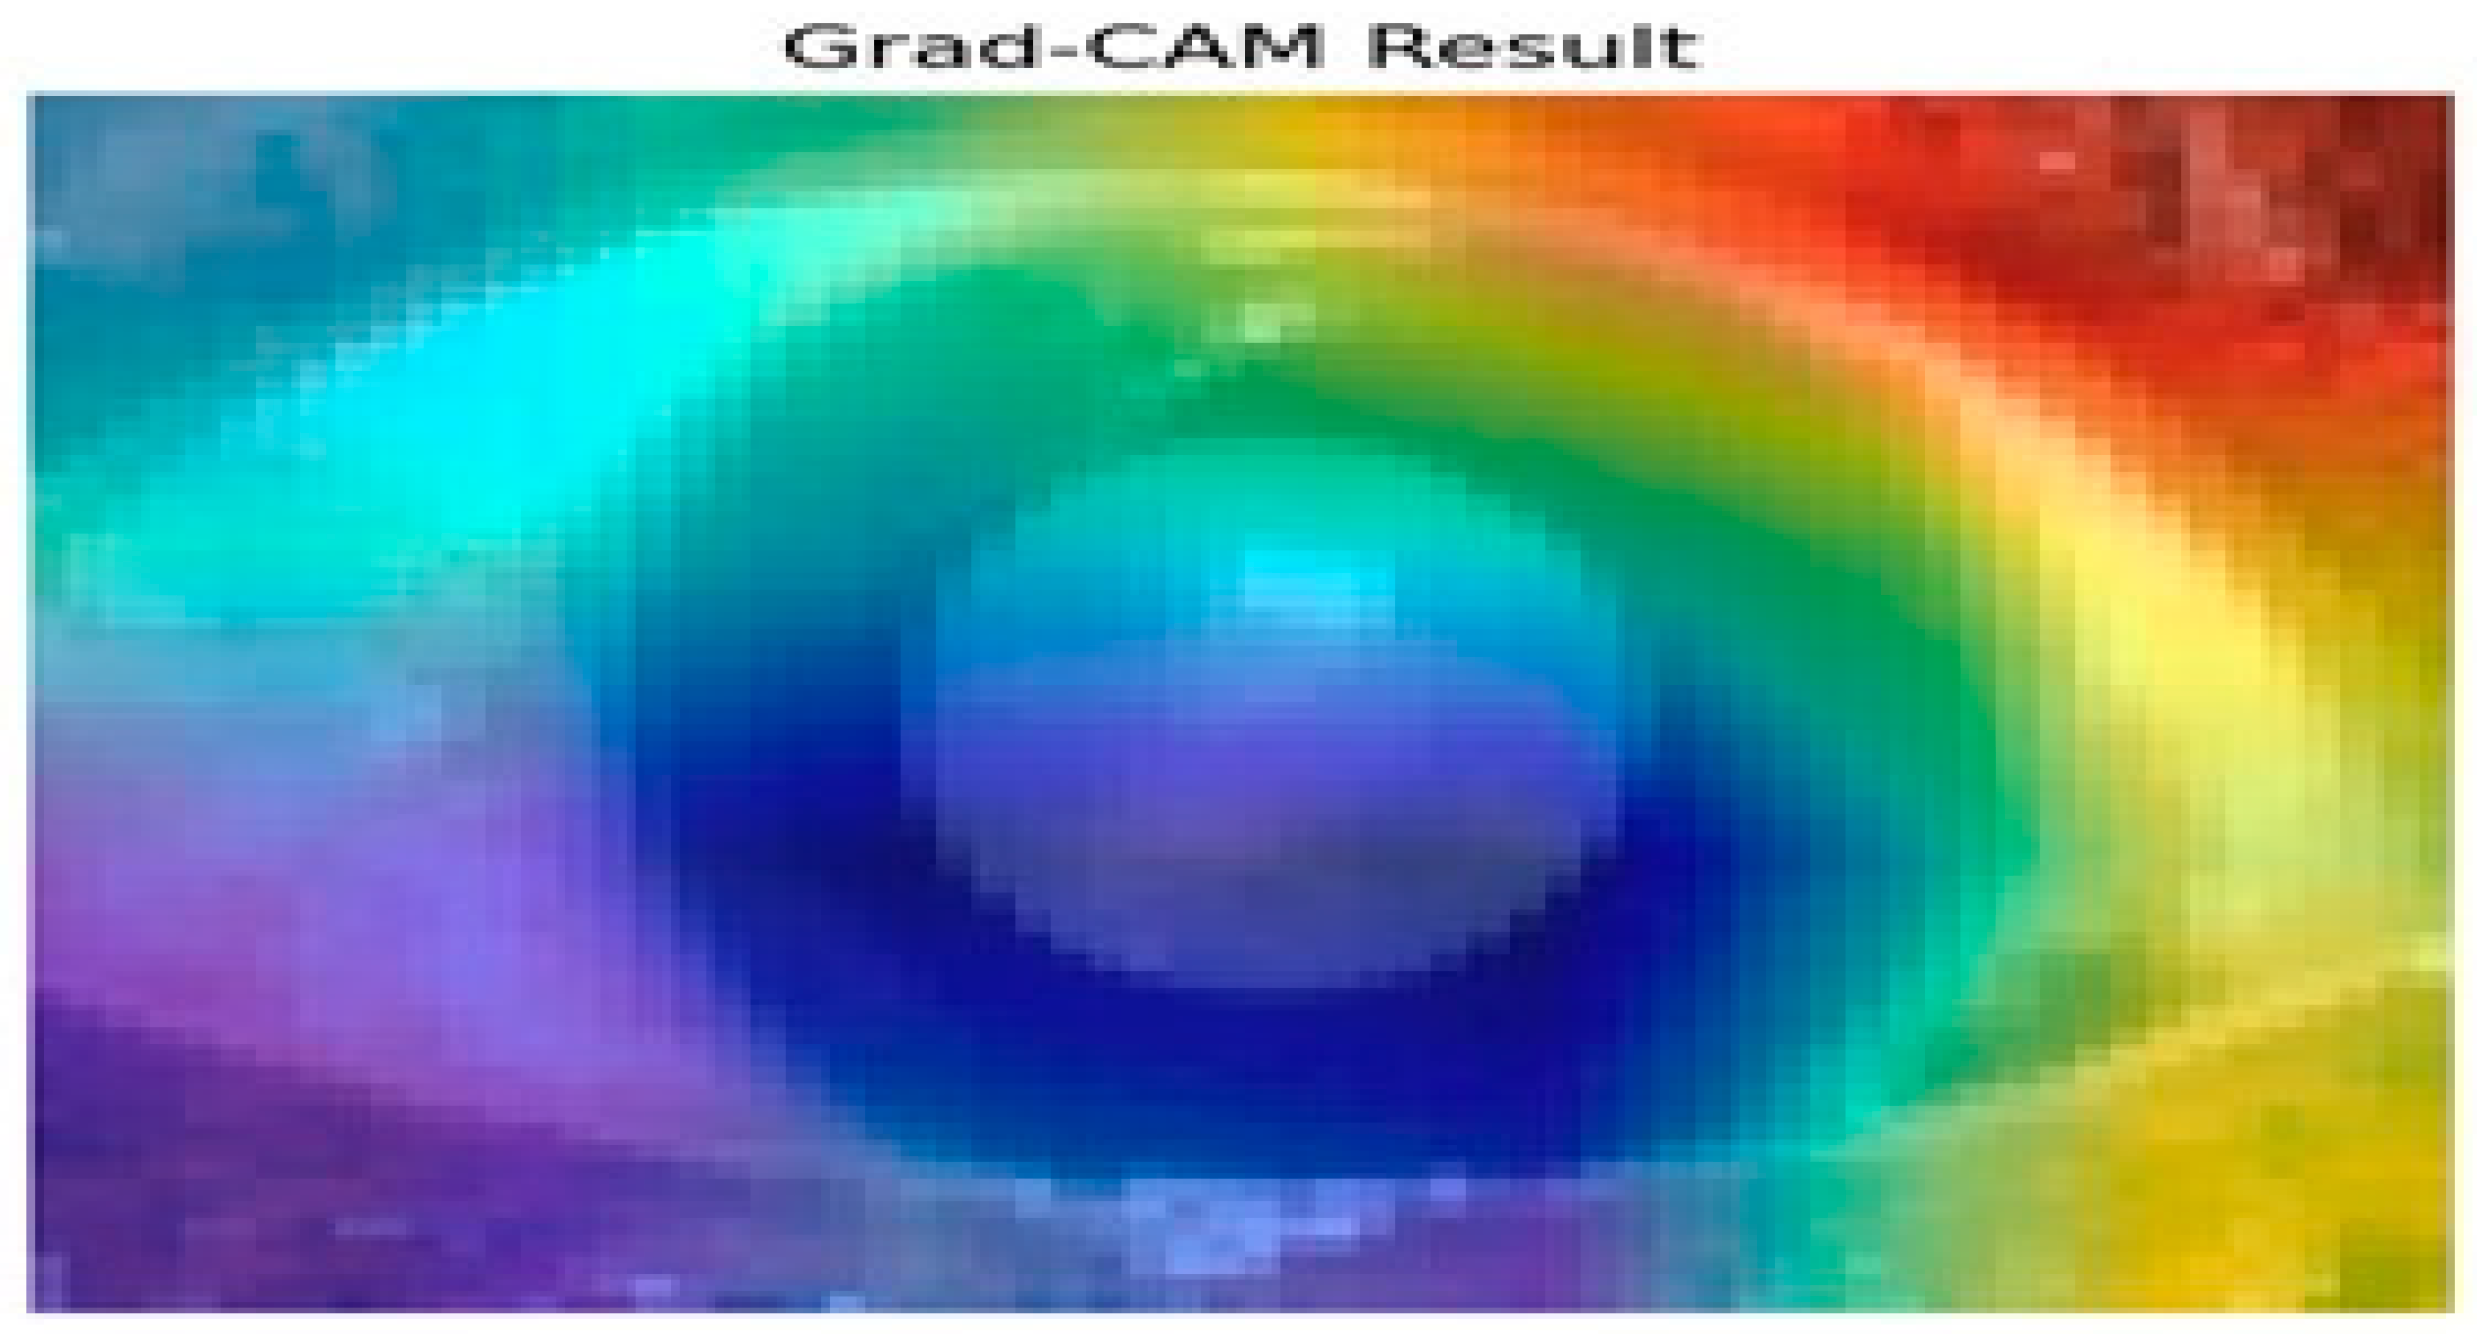
Figure 10 presents the results of the Grad-CAM analysis, providing insight into the interpretability of deep learning models, specifically the Siamese network and VGG16 architecture. Grad-CAM generates a coarse localization map that highlights critical image regions influencing the model’s predictions. By utilizing the gradients from the final convolutional layers, the heat map displays varying importance levels across the image, indicated by a color gradient ranging from red (high importance) to blue (low importance).
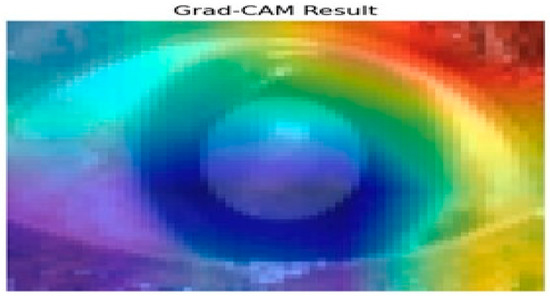
Figure 10.
Grad-CAM analysis for cataract detection.
In this analysis, the model primarily focuses on the iris and pupil areas, as evidenced by the central regions highlighted in yellow and green, signifying their significant impact on classification decisions. Conversely, blue regions denote areas of minimal importance. This visual interpretability is particularly beneficial in contexts like medical image analysis, where specific features are crucial for accurate predictions. The results illustrate how the Siamese network and VGG16 assign different importance levels to sub-regions of the image, with the pupil and iris being key determinants in the model’s decision-making process. Such insights enhance understanding and transparency in deep learning models, making them invaluable for research and practical applications where comprehending model behavior is essential. Evaluating regional importance scores for cataract detection is shown in Figure 11.

Figure 11.
Evaluating regional importance scores for cataract detection.
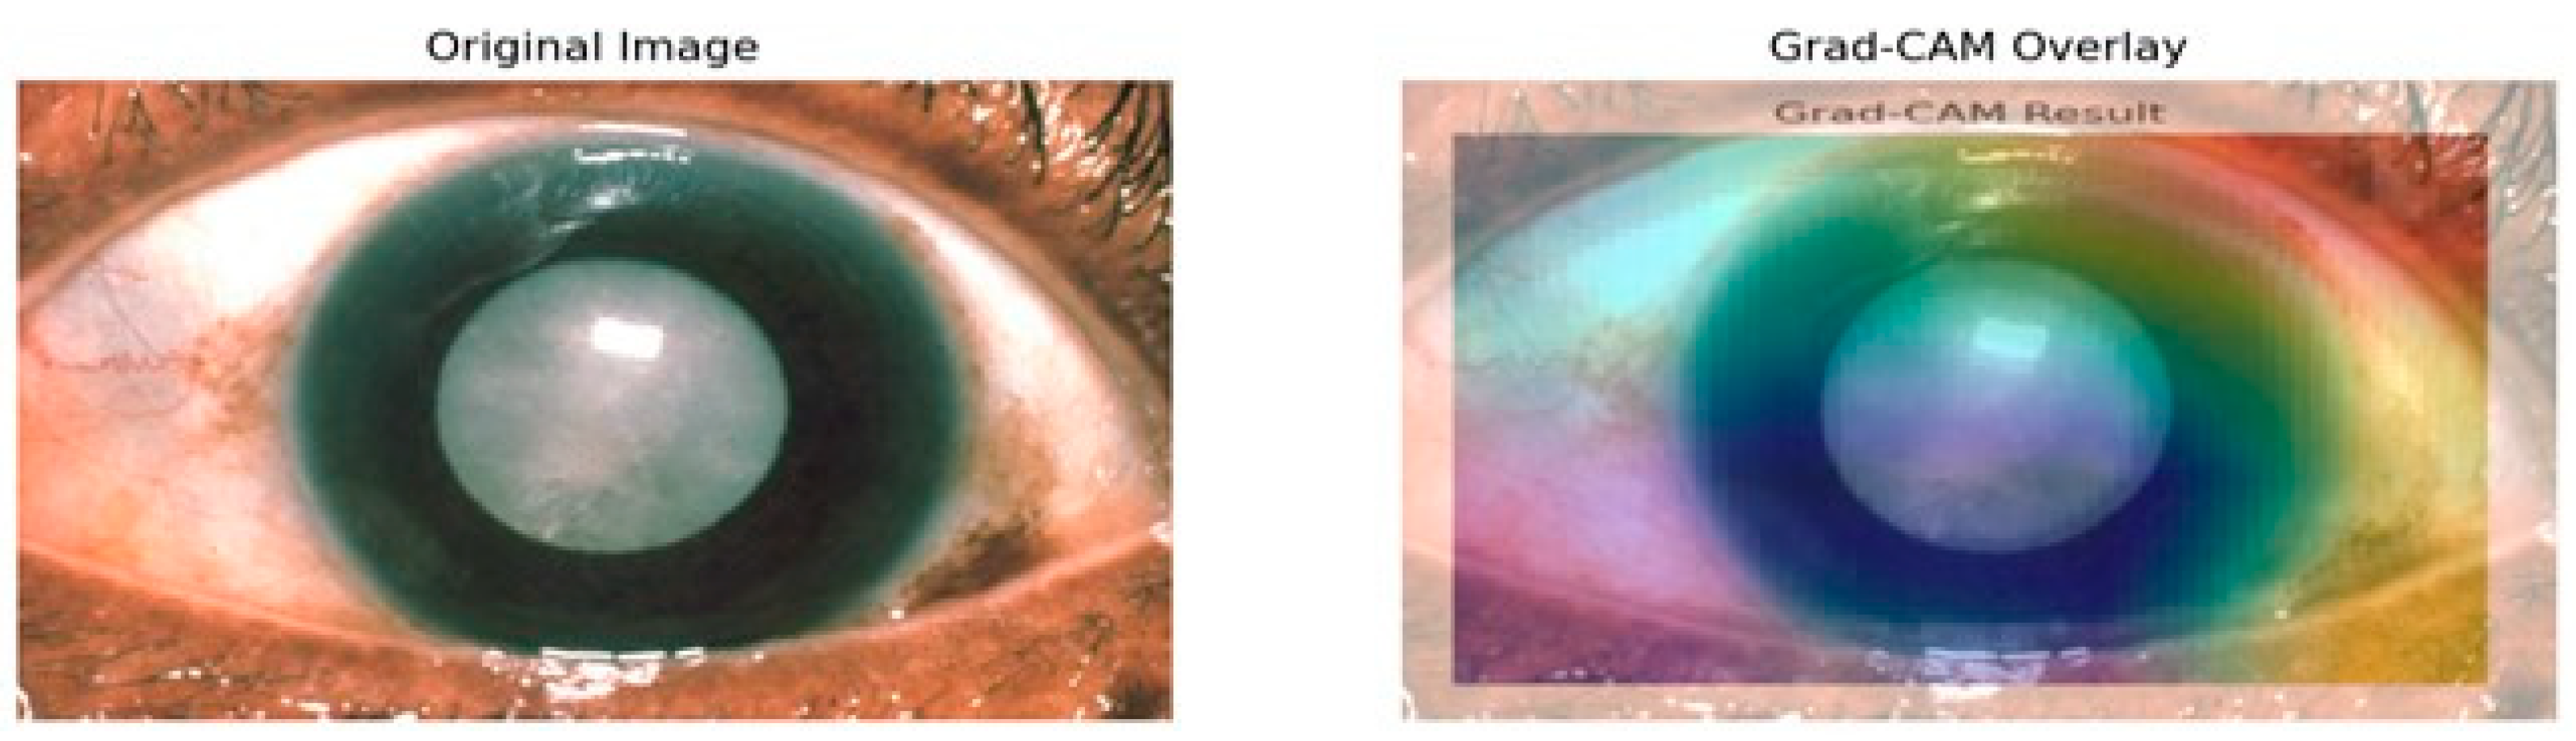
Grad-CAM mostly highlights the lens area using warm colors like reds and yellows to indicate the high importance of this region toward model predictions as depicted in Figure 11. That also makes sense, because it is the cataract that is actually affecting the lens. In contrast, surrounding cooler colors of blues and greens will have less importance in detection. That is appropriate because the model should not pay much attention to either the iris or the cornea since the lens is the main area of concern in determining cataracts. Moreover, how the heat map aligns with the cloudy lens in the original image also serves as a visual confirmation that the model learns features that are relevant for the detection of cataract conditions. The visual representation of the heatmap scores is shown in Figure 12.
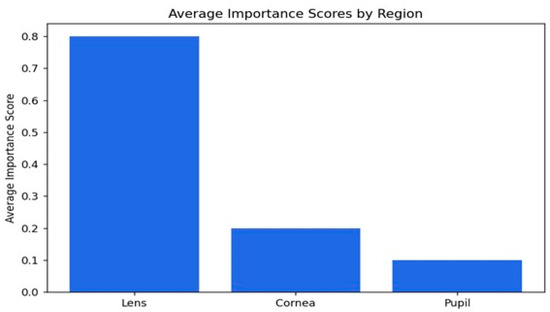
Figure 12.
Visual representation of the importance scores.
The average importance scores are a good reflection of the model’s performance in the detection of cataracts, where appropriate priority has been given to the lens while relegating the cornea and pupil to less importance. The score of 0.79 indicates that the lens is the most critical region, as would be expected from knowledge that cataracts essentially affect the lens by making it cloudy. The score for the cornea is 0.19, which is moderate, implying that while it does provide some relevant features in this model with regard to decision-making, it is not as important as the lens. The pupil has the lowest importance score, 0.10, meaning that it is not taken into consideration in the context of cataract detection. Overall, the distribution of importance scores matches well with our clinical expectations and supports the ability of the model to identify key features associated with cataracts, hence its potential to be a useful tool for diagnosis.
6. Conclusions
This work presents a hybrid model combining a pre-trained VGG16 feature extractor with a Siamese network architecture to address the image similarity detection task. Leveraging deep learning’s strengths, the model utilizes contrastive learning to create high-dimensional features that differentiate between normal and cataract-infected images. The VGG16 backbone, with pre-trained weights from ImageNet, minimizes the need for extensive training on specific datasets, enhancing generalization. The hybrid model demonstrated exceptional performance, achieving 100% accuracy, precision, recall, and F1score on the test set alongside a perfect ROC curve AUC score of 1.00, showcasing its efficacy in distinguishing between normal and cataract-infected images. The dynamic adjustment of learning rates through the ReduceLROnPlateau callback improved training stability and convergence. Utilizing binary cross-entropy loss and the Adam optimizer further enhanced optimization. Notably, the incorporation of Grad-CAM added interpretability, allowing visualization of the model’s focus areas in images, which is crucial for medical applications like cataract detection. Overall, this hybrid model excels in differentiating between image classes, showcasing strong metrics and generalization capability. It effectively combines pre-trained networks, adaptive learning strategies, and interpretability tools, positioning itself as a robust solution for various image analysis tasks. Future work could explore applications in other domains, refine similarity metrics, or introduce additional interpretability techniques to enhance its utility and robustness.
Author Contributions
Conceptualization, J.O. and D.O.; methodology, J.O., D.O. and I.C.O.; software, J.O., B.M.E. and M.O.; validation, D.O., I.C.O. and M.O.; formal analysis, J.O., D.O. and B.M.E.; investigation, I.C.O., B.M.E. and M.O.; resources, J.O., D.O. and B.M.E.; data curation, J.O. and D.O.; writing—original draft preparation, J.O., D.O. and M.O.; writing—review and editing, J.O., D.O. and I.C.O.; visualization, J.O. and D.O.; supervision, I.C.O. and B.M.E.; project administration, J.O., D.O. and M.O.; funding acquisition, B.M.E. All authors have read and agreed to the published version of the manuscript.
Funding
This research received no external funding. And the APC was funded by Bukohwo Michael Esiefarienrhe.
Institutional Review Board Statement
Not applicable.
Informed Consent Statement
Not applicable.
Data Availability Statement
https://www.kaggle.com/datasets/nandanp6/cataract-image-dataset (accessed on 10 September 2024).
Conflicts of Interest
The authors declare no conflicts of interest.
References
- Vision Loss Expert Group of the Global Burden of Disease Study. Global estimates on the number of people blind or visually impaired by cataract: A meta-analysis from 2000 to 2020. Eye 2024, 38, 2156. [Google Scholar] [CrossRef] [PubMed]
- World Health Organization (WHO). Eye Care, Vision Impairment and Blindness. Available online: https://www.who.int (accessed on 4 October 2024).
- Shang, X.; Wu, G.; Wang, W.; Zhu, Z.; Zhang, X.; Huang, Y.; Yu, H. Associations of vision impairment and eye diseases with frailty in community-dwelling older adults: A nationwide longitudinal study in China. Br. J. Ophthalmol. 2024, 108, 310–316. [Google Scholar] [CrossRef] [PubMed]
- Kulbay, M.; Wu, K.Y.; Nirwal, G.K.; Bélanger, P.; Tran, S.D. Oxidative Stress and Cataract Formation: Evaluating the Efficacy of Antioxidant Therapies. Biomolecules 2024, 14, 1055. [Google Scholar] [CrossRef] [PubMed]
- Liang, W.; Zhou, C.; Bai, J.; Zhang, H.; Jiang, B.; Wang, J.; Zhu, H. Current advancements in therapeutic approaches in orthopedic surgery: A review of recent trends. Front. Bioeng. Biotechnol. 2024, 12, 1328997. [Google Scholar] [CrossRef] [PubMed]
- Patibandla, R.L.; Rao, B.T.; Murty, M.R. Revolutionizing Diabetic Retinopathy Diagnostics and Therapy through Artificial Intelligence: A Smart Vision Initiative. In Transformative Approaches to Patient Literacy and Healthcare Innovation; IGI Global: Hershey, PA, USA, 2024; pp. 136–155. [Google Scholar]
- Levinson, B.; Woreta, F.; Riaz, K. (Eds.) Clinical Atlas of Anterior Segment OCT: Optical Coherence Tomography; Elsevier Health Sciences: Amsterdam, The Netherlands, 2024. [Google Scholar]
- Zhang, H.; Che, W.; Cao, Y.; Guan, Z.; Zhu, C. Condition Monitoring and Fault Diagnosis of Rotating Machinery Towards Intelligent Manufacturing: Review and Prospect. Iran. J. Sci. Technol. Trans. Mech. Eng. 2024, 1–34. [Google Scholar] [CrossRef]
- Chakraborty, S.; Misra, B.; Mridha, M.F. Enhancing Intelligent Medical Imaging to Revolutionize Healthcare. In Smart Medical Imaging for Diagnosis and Treatment Planning; Chapman and Hall/CRC: Boca Raton, FL, USA, 2025; pp. 3–20. [Google Scholar]
- Shome, A.; Mukherjee, G.; Chatterjee, A.; Tudu, B. Study of Different Regression Methods, Models and Application in Deep Learning Paradigm. In Deep Learning Concepts in Operations Research; Auerbach Publications: Boca Raton, FL, USA, 2024; pp. 130–152. [Google Scholar]
- Agustin, S.; Putri, E.N.; Ichsan, I.N. Design of A Cataract Detection System based on The Convolutional Neural Network. J. ELTIKOM J. Tek. Elektro Teknol. Inf. Komput. 2024, 8, 1–8. [Google Scholar] [CrossRef]
- Islam, A.; Haque, A.A.; Tasnim, N.; Waliza, S. Deep Learning Based Early Glaucoma Detection. Doctoral Dissertation, Brac University, Dhaka, Bangladesh, 2024. [Google Scholar]
- Dos Santos, P.R.S.; de Carvalho Brito, V.; de Carvalho Filho, A.O.; de Araújo, F.H.D.; Rabêlo, R.D.A.L.; Mathew, M.J. A Capsule Network-based for identification of Glaucoma in retinal images. In Proceedings of the 2020 IEEE Symposium on Computers and Communications (ISCC), Rennes, France, 7–10 July 2020; IEEE: Piscataway, NJ, USA; pp. 1–6. [Google Scholar]
- Ali, M.S. A Hyper-Tuned Vision Transformer Model with Explainable AI for Eye Disease Detection and Classification from Medical Images. Doctoral Dissertation, Islamic University, Minnesota, Bangladesh, 2023. [Google Scholar]
- Fayyad, M.F. Application of AlexNet, EfficientNetV2B0, and VGG19 with Explainable AI for Cataract and Glaucoma Image Classification. In Proceedings of the 2024 International Electronics Symposium (IES), Surabaya, Indonesia, 13–15 August 2024; IEEE: Piscataway, NJ, USA; pp. 406–412. [Google Scholar]
- Velpula, V.K.; Sharma, D.; Sharma, L.D.; Roy, A.; Bhuyan, M.K.; Alfarhood, S.; Safran, M. Glaucoma detection with explainable AI using convolutional neural networks-based feature extraction and machine learning classifiers. In IET Image Process; IET: Washington, DC, USA, 2024. [Google Scholar]
- Santone, A.; Cesarelli, M.; Colasuonno, E.; Bevilacqua, V.; Mercaldo, F. A Method for Ocular Disease Diagnosis through Visual Prediction Explainability. Electronics 2024, 13, 2706. [Google Scholar] [CrossRef]
- Afreen, N.; Aluvalu, R. Glaucoma Detection Using Explainable AI and Deep Learning. EAI Endorsed Trans. Pervasive Health Technol. 2024, 10. Available online: https://publications.eai.eu/index.php/phat/article/view/5658 (accessed on 10 September 2024). [CrossRef]
- Kher, G.; Mehra, S.M.; Bala, R.; Singh, R.P. DeB5-XNet: An Explainable Ensemble Model for Ocular Disease Classification using Transfer Learning and Grad-CAM. Authorea Prepr. 2024. Available online: https://www.authorea.com/doi/full/10.22541/au.172465028.81948688 (accessed on 10 September 2024).
- AlBalawi, T.; Aldajani, M.B.; Abbas, Q.; Daadaa, Y. IoT-Opthom-CAD: IoT-Enabled Classification System of Multiclass Retinal Eye Diseases Using Dynamic Swin Transformers and Explainable Artificial Intelligence. Int. J. Adv. Comput. Sci. Appl. 2024, 15, 7. [Google Scholar] [CrossRef]
- Serwaa, M.; Mensah, P.K.; Adekoya, A.F.; Ayidzoe, M.A. LBPSCN: Local Binary Pattern Scaled Capsule Network for the Recognition of Ocular Diseases. Int. J. Adv. Comput. Sci. Appl. 2024, 15. [Google Scholar] [CrossRef]
- Alenezi, A.; Alhamad, H.; Brindhaban, A.; Amizadeh, Y.; Jodeiri, A.; Danishvar, S. Enhancing Readability and Detection of Age-Related Macular Degeneration Using Optical Coherence Tomography Imaging: An AI Approach. Bioengineering 2024, 11, 300. [Google Scholar] [CrossRef]
- Suara, S.; Jha, A.; Sinha, P.; Sekh, A.A. Is grad-CAM explainable in medical images? In Proceedings of the International Conference on Computer Vision and Image Processing, Bhubaneswar, India, 20–22 November 2023; Springer Nature: Cham, Switzerland; pp. 124–135. [Google Scholar]
- Sharma, N.; Gupta, S.; Mohamed, H.G.; Anand, D.; Mazón, J.L.V.; Gupta, D.; Goyal, N. Siamese convolutional neural network-based twin structure model for independent offline signature verification. Sustainability 2022, 14, 11484. [Google Scholar] [CrossRef]
- Omiotek, Z.; Kotyra, A. Flame image processing and classification using a pre-trained VGG16 model in combustion diagnosis. Sensors 2021, 21, 500. [Google Scholar] [CrossRef] [PubMed]


Disclaimer/Publisher’s Note: The statements, opinions and data contained in all publications are solely those of the individual author(s) and contributor(s) and not of MDPI and/or the editor(s). MDPI and/or the editor(s) disclaim responsibility for any injury to people or property resulting from any ideas, methods, instructions or products referred to in the content. |
© 2024 by the authors. Licensee MDPI, Basel, Switzerland. This article is an open access article distributed under the terms and conditions of the Creative Commons Attribution (CC BY) license (https://creativecommons.org/licenses/by/4.0/).