Article

Wintertime Diurnal Variation in Absorption Coefficient of Brown Carbon Associated with the Molecular Marker of Levoglucosan

Department of Environmental Engineering, Mokpo National University, Muan 58554, Republic of Korea
*
Author to whom correspondence should be addressed.
Appl. Sci. 2024, 14(10), 4117; https://doi.org/10.3390/app14104117
Submission received: 23 April 2024 / Revised: 9 May 2024 / Accepted: 9 May 2024 / Published: 13 May 2024
(This article belongs to the Special Issue Short- and Long-Term Air Pollution Analysis, Modeling and Prediction)

Abstract

:
This study investigated the aerosol particle properties and light absorption properties of brown carbon (BrC) by utilizing a seven-wavelength aethalometer, and analyzed NH4+, NO3, SO42−, K+, K, organic carbon, elemental carbon, levoglucosan, and mannosan in PM2.5. The research was conducted in a rural area of Jeonnam, South Korea, during the winter season. In addition, the dithiothreitol assay-oxidative potential normalized to 9,10-phenanthrenequinone (QDTT-OP) was investigated throughout the study period. The absorption coefficient was found to be 2.6 to 5.6 times higher at 370 nm compared to 880 nm, suggesting the presence of light-absorbing substances in addition to black carbon (BC) particles. The estimated absorption coefficient of BrC370 was 29.9% of the total light absorption coefficient at 370 nm. Furthermore, BrC370 exhibited a strong affinity with levoglucosan while showing a weak correlation with K+, confirming the suitability of levoglucosan as a tracer for biomass burning. The QDTT-OP was 5.3 nM m−3, and highly correlated with the carbonaceous components levoglucosan and mannosan, suggesting a relatively high contribution of biomass combustion emissions to oxidative potential. Further research should be conducted to assess the health risks associated with future PM2.5 exposure related to biomass burning in the atmosphere.

1. Introduction

Black carbon (BC) and brown carbon (BrC) absorb light, significantly impacting the Earth’s radiative forcing [1]. BC is emitted only through the incomplete combustion of fossil fuels in biomass burning (BB) processes. In contrast, BrC is emitted through primary sources and formed through secondary oxidation processes of volatile organic compounds [2,3]. Currently, BrC is receiving significant attention due to its potential impact on the Earth’s radiative balance, atmospheric chemical reactions, and human health [4,5,6,7]. BB is primarily recognized as a significant primary source of BrC, and the optical absorption characteristics of BrC are greatly influenced by fuel types and combustion conditions [8,9]. BrC strongly absorbs solar radiation and thereby affects Earth’s climate [1,10]. BrC absorbs light more strongly within the ultraviolet range (300–400 nm), impacting the Earth’s radiative forcing. Currently, it is necessary to investigate the contribution of specific emission sources to BrC absorption and to study the relationship between specific emission sources and BrC.
The combustion of biomass and fossil fuels emits substantial amounts of gaseous and particulate pollutants on both local and global scales. BB is a worldwide phenomenon and includes agricultural residue burning, illegal burning, wildfires, and residential wood burning for cooking and heating purposes [11]. BB activities are intense, and the contribution of BrC to light absorption ranges from 20 to 50%. Therefore, it is necessary to investigate the characteristics of BrC light absorption in regions with concentrated BB activities. BB emits various gases, including volatile organic compounds (VOCs) and particulate matter containing BC, BrC, and organic matter (OM), making it a significant source of greenhouse gases [12,13]. Due to its significance as a source of diverse pollutants, it has received considerable attention in recent years. However, there are significant challenges in identifying and quantifying BB emissions in the atmosphere and assessing their environmental impacts. Satellite observations, such as Moderate-Resolution Imaging Spectroradiometer (MODIS) active fire detection, are commonly used to capture their spatial occurrence in open fields [14]. However, these methods have limitations in detecting emissions from residential fuel combustion, which dominates in certain regions, resulting in underestimation. For this reason, various chemical tracers have wide use in identifying BB sources. Several organic molecular markers, such as levoglucosan, mannosan, and galactosan, have been employed recently. Among these BB tracers, levoglucosan is the most suitable as it exhibits high availability and chemical stability under various environmental conditions [15]. Wood combustion emissions in Europe contribute approximately 60% to primary pyrogenic organic carbon (OC) based on conversion factors derived from levoglucosan [16].
According to previous studies, particulate matter (PM) poses numerous health risks, including cardiovascular diseases, mental disorders, carcinogenic diseases, and respiratory problems [17]. Moreover, PM interacts with cells and macrophages to generate reactive oxygen species (ROS) that can alter cellular redox state. Recently, several studies have used oxidative potential (OP) as an indicator to evaluate the impact of PM toxicity, defined as the ability of PM to generate ROS [18,19,20,21]. OP integrates various physicochemical properties of PM, including size, surface area, and chemical composition, to assess its effects on human health. The dithiothreitol (DTT) assay, a non-cellular chemical reaction using DTT for biological reducing agents, is one of the methods used to estimate OP [18,21].
This study aimed to evaluate the optical absorption coefficient of BrC by measuring PM2.5 and BC concentrations during the winter season at Mokpo University located in Muan-gun, Jeonnam, Republic of Korea. In addition, this study aims to provide an outlook on levoglucosan as a tracer for BB. Additionally, the dithiothreitol (DTT) assay was employed to determine the dithiothreitol-oxidative potential normalized to quinone (QDTT-OP), and its association with essential chemical components was analyzed.

2. Materials and Methods

2.1. PM2.5 Measurement

To analyze the mass concentration and chemical composition of atmospheric PM2.5, sampling was conducted on the rooftop of a four-story building at Mokpo National University’s Dorim Campus (latitude: 34.9133, longitude: 126.4373). The sampling period spanned from 13 February 2023 at 12:00 AM to 23 February 2023 at 9:00 AM. Figure 1 shows the measurement location, a rural area with small residential and agricultural areas nearby and no industrial facilities. Real-time PM2.5 mass concentrations were measured using a beta-ray analyzer (Model 5014i Beta, Thermo Fisher Inc., Waltham, MA, USA) at a flow rate of 16.7 L min−1.
PM2.5 samples were collected at 3 h intervals using quartz filters (Pallflex 2500QAT-UP, Pall Corp., New York, NY, USA) and Teflon filters, with flow rates of 500 L/min and 42 L/min, respectively. A total of 160 samples were collected using both quartz and Teflon filters during the 10-day sampling period. Before sampling, the quartz filters underwent combustion pretreatment at 450 °C for 6 h to remove impurities and minimize the presence of carbonaceous components in blank samples. Analysis of water-soluble ionic components was conducted on samples collected from quartz filters. The filters were subjected to ultrasonic extraction with 10 mL of distilled water for 2 h. Anion (using a Metrohm 930 Switzerland, Metrosep A Supp 150/4.0 column with 3.7 mM Na2CO3 & 1.0 mM NaHCO3) and cation (using a Metrohm 930 Switzerland, Metrosep C4-250/4.0 column with 5 mM HNO3) ion chromatography were employed for quantitative analysis. The collected quartz filters were punched into 1.5 cm2 pieces for carbonaceous component analysis. OC and elemental carbon (EC) were quantified using a carbon analyzer (Lab-based OCEC Carbon Aerosol Analyzer, Sunset Laboratory Inc., Tigard, OR, USA) based on the Thermal–Optical Transmittance (TOT) method following the NIOSH 5040 protocol. X-ray fluorescence spectrometry (XRF, X-ray fluorescence spectrometry, QUANT’X, Thermo Scientific, Waltham, MA, USA) was utilized to analyze the K component in the samples employed in this study. Levoglucosan and mannosan were used to analyze BB’s influence at the measurement site. In this study, Liquid Chromatography/Quadrupole Time-of-Flight (LC/QTOF) (1290 Infinity II LC, Agilent Technologies, Santa Clara, California, USA; X500r QTOF, SCIEX, Toronto, ON, Canada) coupled with a UK-Amino (UKA26U, Imtakt Unison) column was used to quantify levoglucosan and mannosan. It was briefly used, and an analysis was performed using a mobile phase consisting of 0.1% formic acid (15%) and acetonitrile (85%) at a flow rate of 0.4 mL min−1 (Matějíček and Vašíčková, 2016). Ultimately, levoglucosan and mannosan ([M + HCOO]) were separated and analyzed at 2.85 and 2.63 min retention times, respectively. For all samples, the initial calibration curve’s consistency was maintained within 5% by injecting standard samples every 10 sample analyses, and precision within 3% was confirmed through duplicate analysis [22,23,24].

2.2. Optical Absorption Coefficient of BC

This study measured BC in PM2.5 at one-minute intervals under a flow rate condition of 5.0 L/min using a 7-wavelength dual-spot aethalometer (AE33, Aerosol Corp., Berkeley, CA, USA) equipped with a PM2.5 impactor. Measurements were conducted across different wavelengths (370, 470, 520, 590, 660, 880, 950 nm). The BC instrument improved measurement accuracy by compensating for measurement errors caused by the loading effect of aerosol particles on the quartz filter. The BC concentration calculation utilized the attenuation of light (ΔATN1) at the first spot of the high-flow-rate filter, and detailed information about the measurement method is given in [2]. Briefly, the optical absorption coefficients of aerosol particles in the measurement device were simultaneously measured at seven wavelengths. The mass absorption cross-sections used in calculating BC(λ) mass concentrations were 18.47, 14.54, 13.14, 11.58, 10.35, 7.77, and 7.19 m2 g−1 at each respective wavelength. Furthermore, the aerosol particle’s light absorption coefficient, measured using the aethalometer, is expressed as the sum of contributions from light absorption due to automobile emissions, biomass combustion, and inorganic dust emissions.

2.3. Evaluation of Contribution to BrC Light Absorption Coefficient

BC, BrC, and inorganic dust components primarily cause light absorption in atmospheric aerosol particles. In this study, the aethalometer’s measured optical absorption coefficient represents the combined contributions of these three components, necessitating their separation. In order to evaluate BrC’s contribution, this study utilized the BC absorption Ångström exponent (AAE) value. Previous studies have reported that BC AAE values emitted from fossil fuel combustion are ~1.0, while those emitted from BB are ~2.0, and desert dust exhibits values between 1 and 2 [1]. Thus, the light absorption by BC particles does not vary significantly with wavelength and exhibits an AAE value of approximately 1.0. On the other hand, BrC, which absorbs significant light in the ultraviolet wavelength range, is associated with emission sources exhibiting AAE values greater than 1.0 [25,26]. This study used the AAE to separate BrC, which strongly absorbs light near the ultraviolet wavelength, from the total light absorption coefficient. The total light absorption coefficient (babs, λ) at each wavelength was defined as the sum of the light absorption coefficients of BC (BCλ) and BrC (BrCλ). The light absorption coefficients at 880 and 950 nm, where BrC absorption is assumed to be negligible, were attributed solely to BC absorption, with an assumed BC AAE of 1.0. Following this assumption, the light absorption coefficients due to b B C , λ were computed. This methodology enabled the determination of the optical absorption coefficient of BC at 370 nm (BC370). The total light absorption coefficient of aerosol particles at each wavelength babsλ can be represented according to Equation (1) as the sum of the light absorption coefficients of BC and BrC, denoted as bBC,λ and bBrC,λ, respectively, as follows:
b a b s , λ = b B C , λ + b B r C , λ
In this study, the absorption coefficient of light attributed to BrC370 at a wavelength of 370 nm was employed, calculated by subtracting the light absorption coefficient due to BC370 from the total light absorption coefficient at 370 nm.

2.4. QDTT-OP Evaluation

In this study, a dithiothreitol (DTT) assay was conducted to analyze the oxidative potential (OP) at a constant temperature (37 °C) with pH adjustment to 7.4 using 0.2 mM DTT, 2.32 mM DTNB, 100 mM potassium phosphate dibasic, and 500 mM potassium phosphate monobasic. The OP analysis of residual DTT and the reaction product, 5-thio-2-nitrobenzoate (TNB), measured absorbance at 412 nm over time using a microplate absorbance reader (Multiskan SkyHigh, Waltham, MA, USA). The DTT consumption rate (nmol/min), representing the final consumption of DTT, was calculated as the slope of the absorbance decrease (σABS) obtained from four absorbance measurements within the reaction time. The background absorbance decrease slope of the blank sample was adjusted, and the DTT consumption rate was normalized to the trapping volume concentration to calculate the dithiothreitol-oxidative potential (DTT-OP) [27,28]. Detailed information on the DTT assay can be found in [28].
Furthermore, the DTT analysis process shares similarities with the redox cycling of quinones, which generate reactive oxygen species (ROS) in the human body. For this reason, quinones are used as a metric for PM-related human toxicity, and the DTT assay can measure PM oxidative potential (OP) based on the DTT loss rate. The present study used quinone to normalize the DTT reduction rate to quinone concentration, yielding the quinone dithiothreitol-oxidative potential (QDTT-OP). The consumption of DTT was analyzed through absorbance analysis over a total duration of 40 min, at 10 min intervals, for six quinone concentrations, including blanks (Figure 2). Upon verifying the final calibration curve based on quinone concentration and reduction rate, a high correlation coefficient (r2 = 0.99) was observed. Consequently, this slope was applied to the study samples to calculate the final QDTT-OP. Detailed descriptions can be found in previous studies [23,29,30]. Duplicate and standard quinone concentration analyses were performed every 15 samples to maintain accuracy and precision within 5%.

3. Results and Discussion

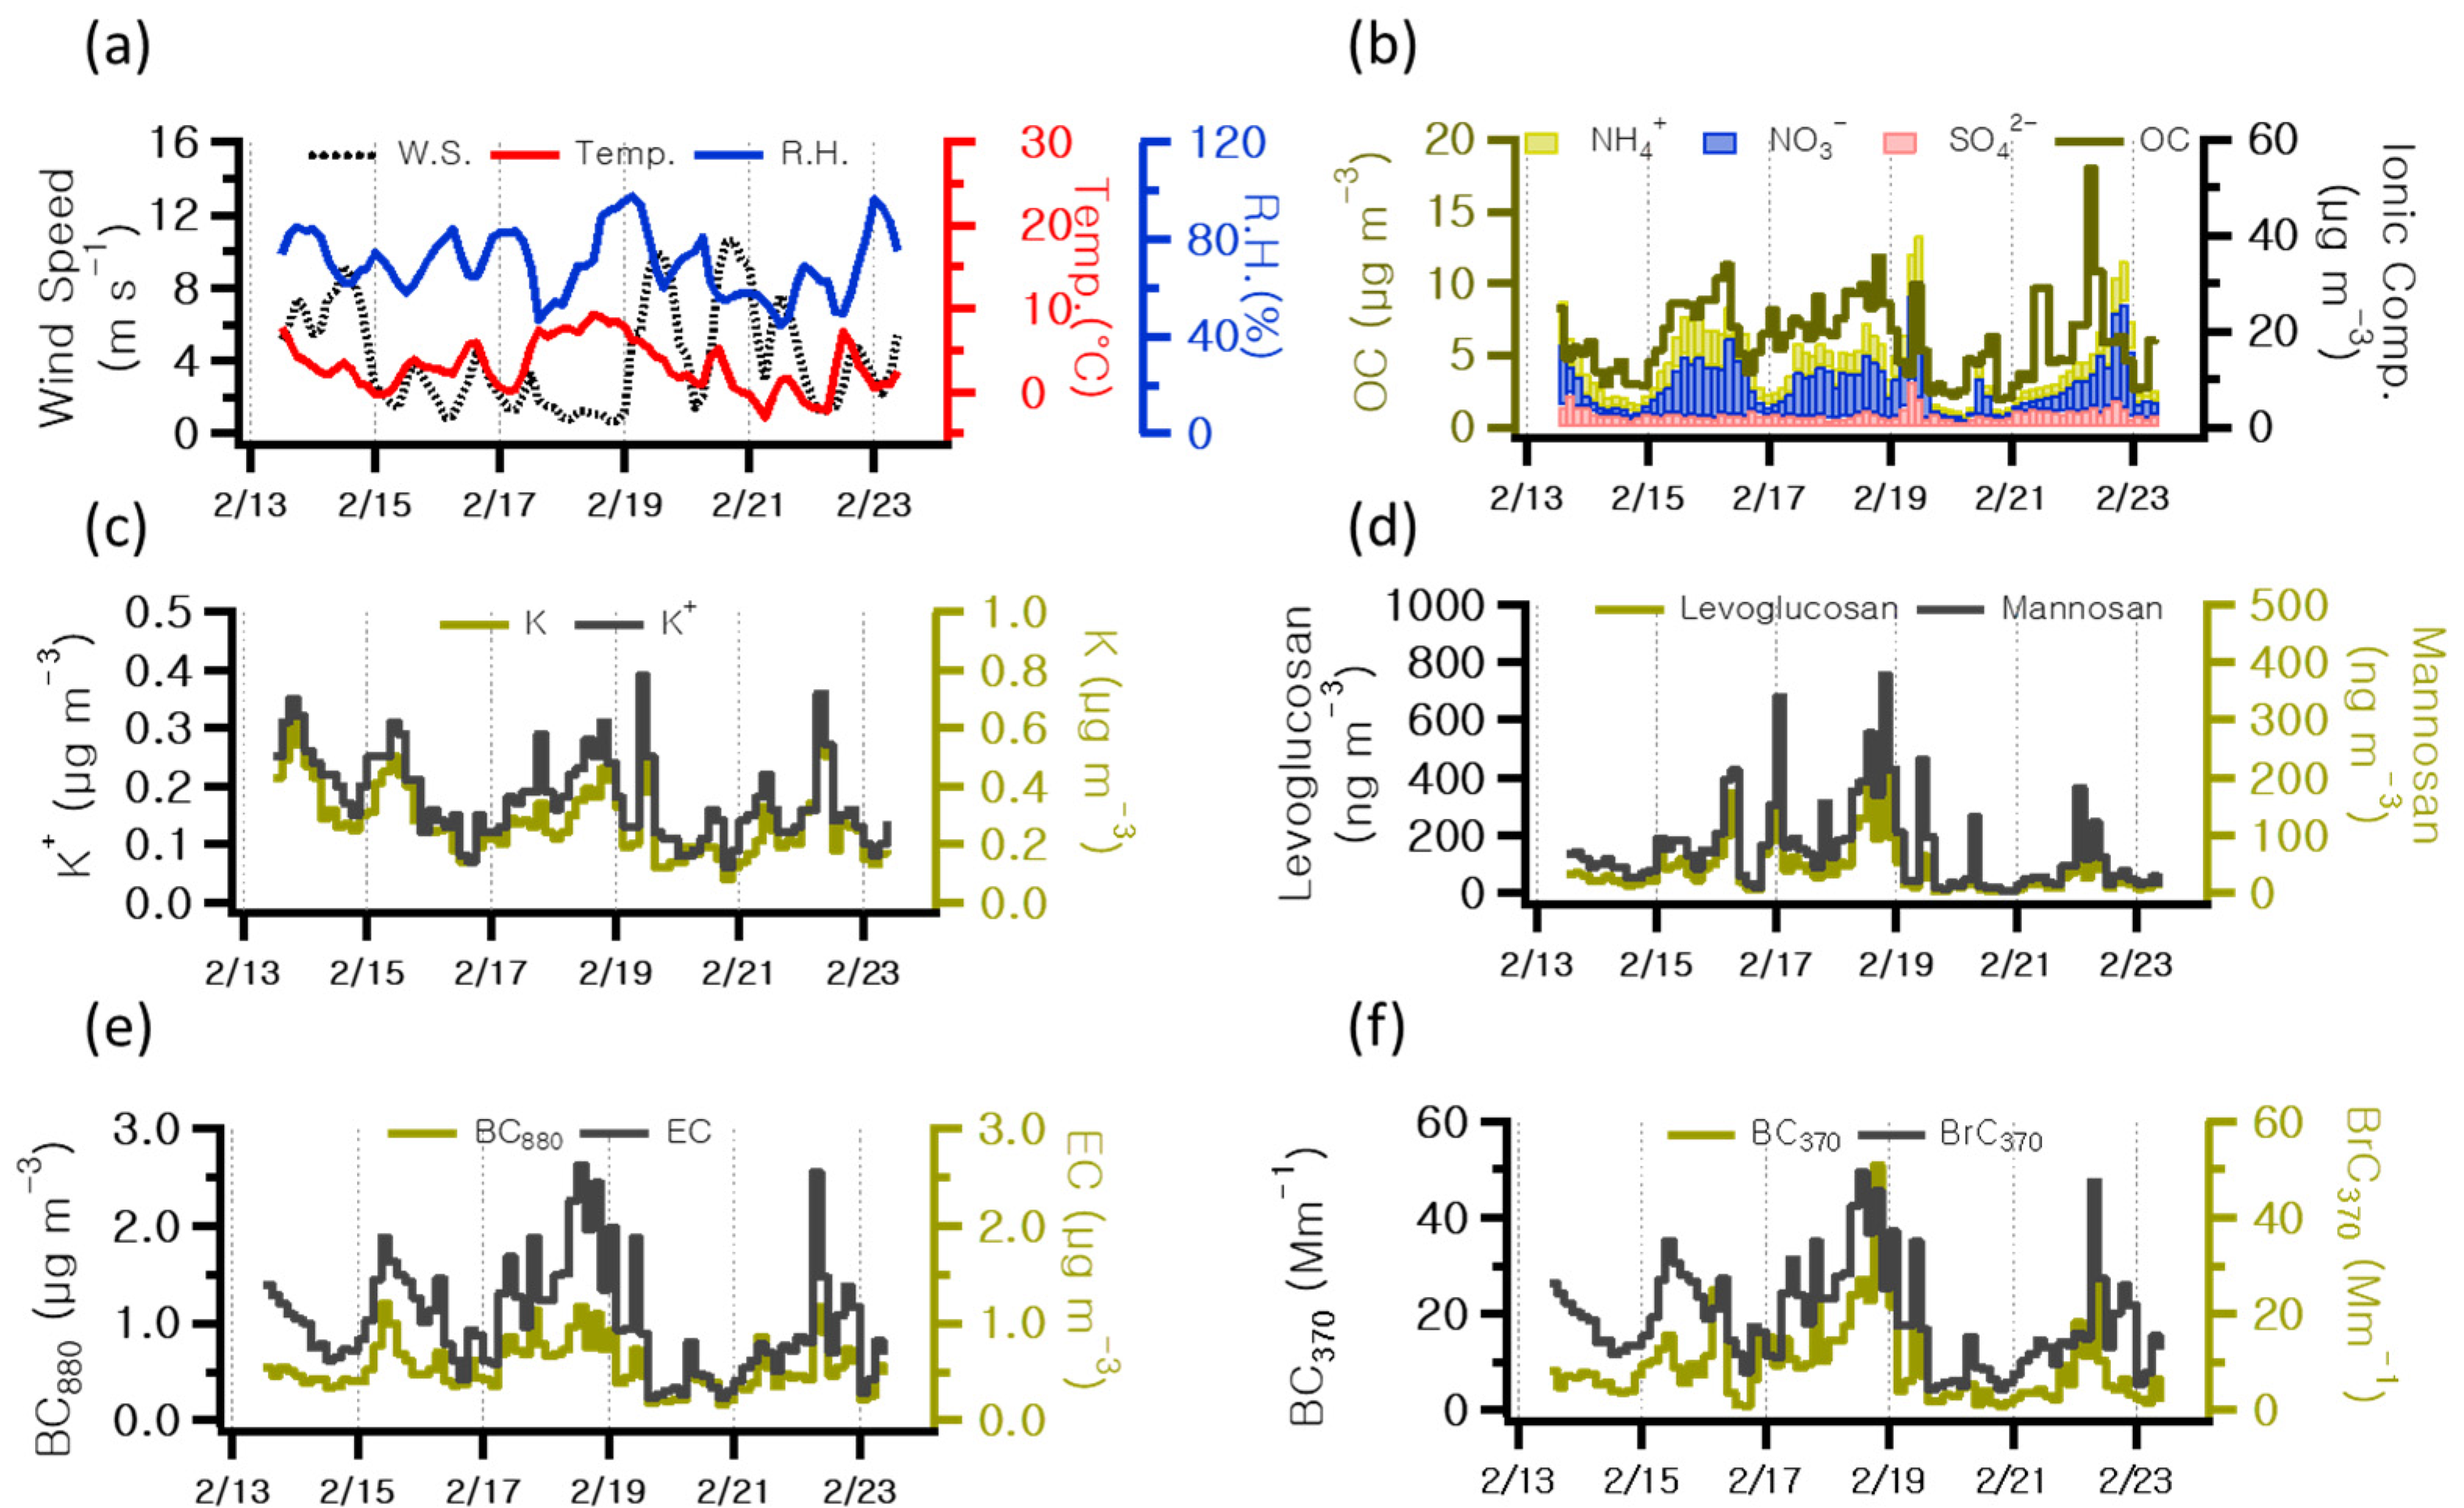
3.1. Chemical Components in PM2.5

Table 1 presents the concentrations of chemical components analyzed in this study. Figure 3 illustrates the temporal concentrations of wind speed, temperature, and relative humidity; OC; ionic compounds; K+ and K; levoglucosan and mannosan; BC880; and BrC370 observed at 3 h intervals throughout the study period. Figure 3f shows the contributions to the light absorption coefficients of BC and BrC at 370 nm. Meteorological variables such as temperature, relative humidity, precipitation, wind direction, wind speed, mixing height, and atmospheric boundary layer play an essential role in influencing the levels of and variations in atmospheric constituents due to their impact on air pollution [31]. For this study, temperature, relative humidity, and wind speed data were obtained from the Meteorological Data Open Portal (https://data.kma.go.kr/cmmn/main.do accessed on 1 May 2024), as shown in Figure 3a. The average values for temperature, relative humidity, and wind speed were 3.1 °C, 70.1%, and 4.2 m s−1, respectively. The average concentration of PM2.5 was 21.27 μg m−3, with the highest value recorded at 9:00 am on 19 February, coinciding with elevated levels of the secondary inorganic ions. According to previous studies, PM2.5 occurring in winter was analyzed to have NO3 and NH4+ as its main ionic components, appearing as a result of fuel combustion for heating and vehicle emissions due to cold weather [22,32]. In this study, the average concentrations of NO3, NH4+, and SO42− were 6.6, 4.4, and 2.9 μg m−3, respectively. Atmospheric NO3 is known to be associated with NH3, sea salt, or soil dust particles (heterogeneous reactions) and favors the formation of NH4NO3 under high-humidity and low-temperature conditions. During the measurement period, a strong correlation coefficient of determination (r2 = 0.78) was observed between the observed NO3 and NH4+ concentrations, while a weak correlation (r2 = 0.19) was observed between NH4+ and SO42−. These results indicate that NH4+ in the atmosphere may have contributed to PM2.5 concentrations by forming NH4NO3. The average concentrations of OC and EC were 6.1 and 0.5 μg m−3, respectively, exhibiting a correlation coefficient of 0.62. Ref. [33] reported OC/EC ratios of 4.2 and 14.5 for residential wood combustion and wildfires, respectively. Figure 4 depicts the diurnal variations in the average hourly concentrations of EC and BrC880. In addition, the figure includes scatterplots illustrating pairwise correlations between EC and BrC880. A discernible decline is observed in both EC and BrC880 during the morning and afternoon periods, attributed to anthropogenic sources such as traffic emissions.

3.2. Light Absorption Contribution of BC and BrC

The BC880 concentration calculated using the mass absorption cross-section (MAC) at a wavelength of 880 nm (7.77 m2 g−1) was 1.02 μg m−3, which accounted for 5.4% (ranging from 1.7% to 14.4%) of the PM2.5 mass. The BC370 concentration, calculated using MAC at a wavelength of 370 nm (18.47 m2 g−1), was 1.5 μg m−3, representing 8.1% (ranging from 2.4% to 27.5%) of the BC880 concentration. The temporal variation in EC and BC concentrations measured at 880 nm exhibited a similar trend, with the highest levels observed during the morning commute and gradually decreasing in the afternoon before increasing again during the evening commute. These results are attributed to increased vehicular traffic travelling on the four-lane road near the measurement site during commuting hours.
The absorption coefficients at 880 nm and 370 nm ranged from 1.8 to 20.4 Mm−1 and 5.2 to 96.3 Mm−1, respectively, while the absorption coefficient at 370 nm was 3.5 times that at 880 nm (ranging from 2.6 to 5.6). These results indicate that in addition to BC, other carbonaceous particles absorb light in the ultraviolet wavelength range. According to previous studies [34,35,36], BB has been identified as a primary source of BrC, and the optical absorption properties of BrC are significantly influenced by fuel types and the conditions of combustion. This study evaluated the BrC370 absorption coefficient using the BC absorption coefficient measured during observation. Figure 3f shows the temporal variation in the BrC absorption coefficient at 370 nm, evaluated by Equation (1) using the aerosol light absorption coefficients. The average light absorption coefficient of BrC370 was 9.6 mM−1, accounting for about 30% of BC370 (19.1 mM−1). The time-resolved BrC absorption coefficients at 370 nm exhibited a trend similar to BC, reaching peak values in the same hours of the day, and the mass absorption coefficient of BrC had higher values at night and a diurnal pattern consistent with enhanced nocturnal primary emission in winter. As a result of comparing the contributions of BrC370 and BC370 to the total optical absorption coefficient measured at 370 nm, the daily changes showed contrasting trends. The contribution of BC370 tended to increase from morning to afternoon, and BrC370 tended to increase from evening to dawn. These results show that local primary emissions occur at night. It can be inferred that BB and vehicle emissions mainly influence the primary emission sources at the study site during commuting hours and BB activities such as heating and incineration, occurring at night. Table 2 summarized a summary of previous research findings on BC370 and BrC370. It compiles data across different studies and provides information on the absorption levels, contribution percentages, and the locations of the studies [10,27,37,38,39,40].

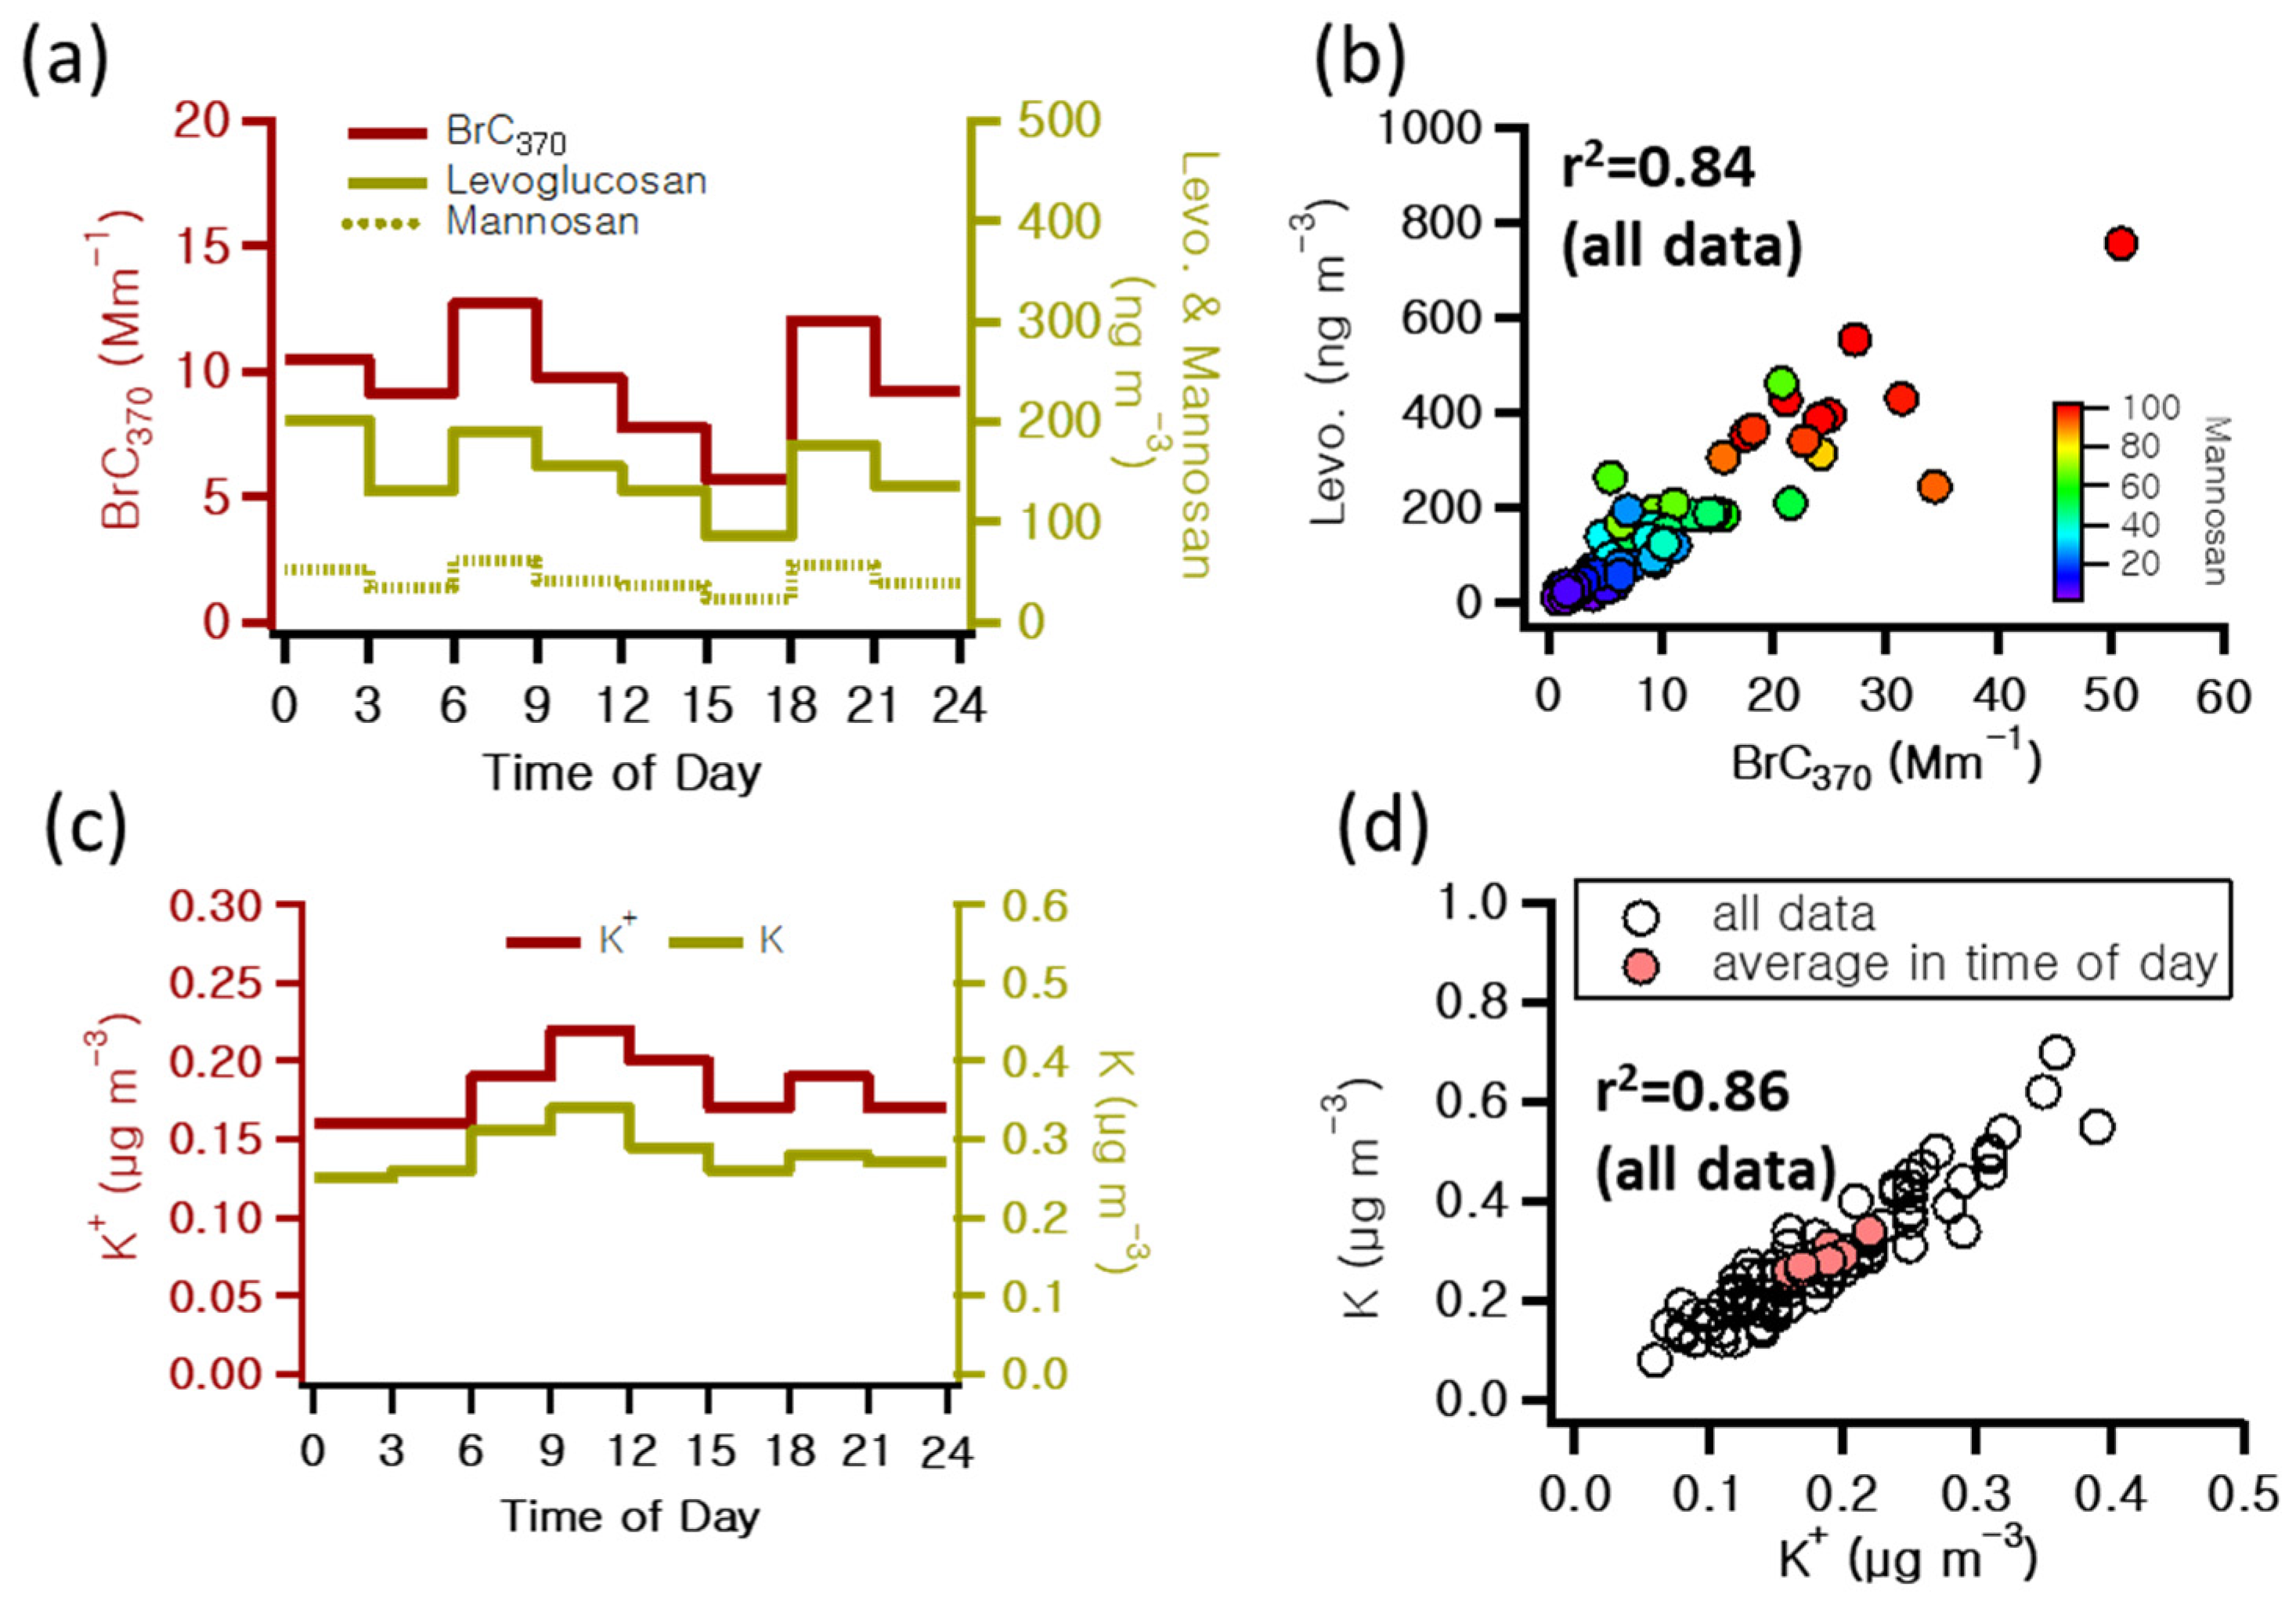
3.3. Identification of the Biomass Burning Tracer Levoglucosan

Levoglucosan, generated through the thermal decomposition of cellulose and hemicellulose at temperatures above 300 °C, can serve as a tracer for BB [41]. According to [42], levoglucosan, a molecular marker of organic components, can be utilized as a tracer for BB emissions. During the measurement period, the concentrations of levoglucosan and mannosan were found to be 151.3 ng m−3 and 43.1 ng m−3, respectively. The highest concentrations were observed on the evening of February 18th, coinciding with a low wind speed of 0.7 m s−1. According to [43], levoglucosan measured in background areas exhibited an average concentration of 43 ng m−3 during winter. Furthermore, measurements in Shanghai reported similar concentrations of 161 ng m−3 in the winter, aligning with the findings of this study. Among the saccharide components analyzed, levoglucosan contributed the most, accounting for 81% of the markers for BB emissions, followed by mannosan, which contributed 13%.
Burning residential wood for heating in winter has been identified as a significant source of atmospheric PM2.5 [44]. Furthermore, the levoglucosan/OC ratio widely estimates BB contribution [45]. According to the report by the Environmental Protection Agency (EPA), the levoglucosan/OC ratio for wood combustion was 0.15 [45]. In this study, the average levoglucosan/OC ratio was found to be 0.02, with a maximum value of 0.08 observed on 17 February at 0:00. The levoglucosan concentration at that time measures 679 ng m−3, the second-highest concentration during the measurement period. In addition, the estimated BC370 and BrC370 mass absorption coefficients are 11.3 Mm−1 and 15.1 Mm−1, respectively, with BrC370 accounting for 57% of the total BC light absorption coefficient at 370 nm, the highest contributor. These results suggest that BB activities for residential heating increased significantly as the temperature gradually decreased from 6.5 °C to −0.1 °C, from 15:00 on 16 February to 04:00 on 17 February.
The BrC370 light absorption coefficient’s diurnal variations closely mirrored those of levoglucosan and mannosan, as shown in Figure 5a. Since no dust events occurred during the study period, it can be inferred that BB emissions influenced the majority of BrC. Figure 5 illustrates the correlations between levoglucosan, mannosan, and K+, well-known tracers of BB. Levoglucosan and mannosan exhibited a high correlation with BrC370 (r2 = 0.84, 0.82, respectively). However, K+, commonly used as a BB tracer, is not dependent on BB sources alone and may be misinterpreted due to the interference of crustal materials and other sources [46]. The levoglucosan/OC ratio was used to estimate the contribution of BB to OC mass. During the study period, the levoglucosan/OC ratio was determined to be 0.022 (Table 1).
Furthermore, levoglucosan/BC370 (0.010) was approximately three times higher than levoglucosan/BrC370 (0.031). Ref. [47] reported that the contribution of BB was 1.7 to 2.8 times higher in winter compared to the other seasons. In addition, the levoglucosan/OC ratio was 0.019 in winter, which is similar to the findings of this study. Soluble K+ is well known to be generated from BB and commonly used as a tracer for wood smoke. It is also predominantly emitted as insoluble K through the resuspension of particulate matter in the atmosphere. K emissions are also associated with sea salt particles and cooking aerosols. Ref. [42] confirmed that levoglucosan and soluble Cd, Cs, K, Rb, and Tl can be used as tracers for BB. This study observed a strong correlation (r2 = 0.86) between observed K and K+ (Figure 5d), indicating that K+ accounted for approximately 54% of the total K concentration. In this study, the measured K+ showed a low correlation of 0.28 with BrC370 and also exhibited weak correlations with the sum of levoglucosan and mannosan (r2 = 0.25). The observed K+ in this study is believed to be influenced by coastal influences located approximately 2.8 km from the measurement site as well as the impact of resuspended dust originating from a four-lane road. These results underscore the importance of exercising caution when utilizing K+ as an indicator for BB markers. In addition, BB had the most pronounced influence on BrC observed during the measurement period. Furthermore, this confirms that levoglucosan and mannosan can be effectively used as BB tracers.

3.4. Comparison of Oxidation Potential in PM2.5

Our DTT analysis results can be used to measure PM biotoxicity, and the DTT loss rate was employed to indicate the OP of PM. In this study, the QDTT-OP for PM2.5 measured during the study period was analyzed and found to have an average value of 5.3 nM m−3. The diurnal concentration trend gradually increased during the early morning hours, reaching the highest levels during commuting hours and decreasing in the afternoon. The assessment of OP using the DTT method has been extensively studied. Ref. [48] analyzed the characteristics of oxidative potential in Milan, Italy, and reported that BB, which occurs in winter, influenced oxidative potential. Ref. [49] reported that the OP of PM2.5 measured in downtown Atlanta, USA, during winter was associated with BB. Figure 6 shows the correlation between the QDTT-OP results and significant components. Overall, OC (r2 = 0.62) and EC (r2 = 0.59) showed higher correlations compared to K (r2 = 0.35) and K+ (r2 = 0.35). These results suggest the influence of mobile sources, the primary emission sources of carbonaceous components. QDTT-OP showed correlations of 0.53 and 0.69 with levoglucosan and BrC370, respectively, with levoglucosan exhibiting the highest correlation. On February 18th at 18:00, when levoglucosan levels were also highest, QDTT-OP reached 12.1 nM m−3, the highest value observed. It was approximately 2.3 times higher than the overall average OP during the study period. Considering the correlations above, it can be inferred that the influence of biomass combustion enhanced oxidative potential to a greater extent.

4. Conclusions and Discussion

This study investigated the chemical composition of PM2.5 and the light absorption characteristics of BC and BrC using filter analysis and a seven-wavelength aethalometer, located about 800 m away from a four-lane road. The measurements were conducted from 13 to 23 February 2022. The BC light absorption coefficient due to PM2.5 was higher at 370 nm than at 880 nm during the study period, indicating the presence of substances that absorb light at ultraviolet wavelengths in addition to BC. These results include contributions from primary emissions and combustion sources such as BB to the light absorption properties of winter PM2.5 at the study site, indicating a dual influence. Furthermore, BrC370 exhibited a strong correlation with levoglucosan and mannosan, while showing a weak correlation with K+, indicating that levoglucosan and mannosan are more suitable as BB tracers than K+. Furthermore, the influence of QDTT-OP on the chemical components of PM2.5 generated during the study period was investigated. The oxidative potential showed relatively high correlations with OC, EC, levoglucosan, BC370, and BrC370, indicating a close association with primary combustion sources (vehicular exhaust and biomass combustion) during the winter measurements of PM2.5 oxidative potential. Evaluating the oxidative potential of PM2.5 based on differences in the emission sources and chemical components can provide insights into the health risks associated with exposure to atmospheric PM2.5. Moreover, it will serve as a crucial factor in establishing policies for controlling atmospheric PM2.5. In addition, to thoroughly analyze the relationship between the chemical components of PM2.5 and their oxidative potential, investigations should be conducted from a long-term perspective, encompassing various emission sources.

Author Contributions

G.-H.Y. contributed to this work via experimental measurements, data analysis, and manuscript preparation. M.S., S.-H.O., S.C., H.J. and D.-H.K. contributed to the research sample analyses. M.-S.B. contributed to the experimental planning and data analysis. All authors have read and agreed to the published version of the manuscript.

Funding

This research was supported by the Research Funds of Mokpo National University in 2023.

Institutional Review Board Statement

Not applicable.

Informed Consent Statement

Not applicable.

Data Availability Statement

The data presented in this study are available on request from the corresponding author. The data are not publicly available due to the data policy of the Mokpo National University, Republic of Korea.

Conflicts of Interest

The authors declare no conflict of interest.

References

  1. Laskin, A.; Laskin, J.; Nizkorodov, S.A. Chemistry of atmospheric brown carbon. Chem. Rev. 2015, 115, 4335–4382. [Google Scholar] [CrossRef]
  2. Park, S.S.; Yu, G.H.; Lee, S.L. Optical absorption characteristics of brown carbon aerosols during the KORUS-AQ campaign at an urban site. Atmos. Res. 2018, 203, 16–27. [Google Scholar] [CrossRef]
  3. Zhang, X.; Lin, Y.H.; Surratt, J.D.; Weber, R.J. Sources, composition and absorption Angstrom exponent of light-absorbing organic components in aerosol extracts from the Los Angeles Basin. Environ. Sci. Technol. 2013, 47, 3685–3693. [Google Scholar] [CrossRef]
  4. Feng, Y.; Ramanathan, V.; Kotamarthi, V.R. Brown carbon: A significant atmospheric absorber of solar radiation? Atmos. Chem. Phys. 2013, 13, 8607–8621. [Google Scholar] [CrossRef]
  5. Chakrabarty, R.K.; Gyawali, M.; Yatavelli, R.L.N.; Pandey, A.; Watts, A.C.; Knue, J.; Chen, L.W.A.; Pattison, R.R.; Tsibart, A.; Samburova, V.; et al. Brown carbon aerosols from burning of boreal peatlands: Microphysical properties, emission factors, and implications for direct radiative forcing. Atmos. Chem. Phys. 2016, 16, 3033–3040. [Google Scholar] [CrossRef]
  6. Liu, J.; Lin, P.; Laskin, A.; Laskin, J.; Kathmann, S.M.; Wise, M.; Caylor, R.; Imholt, F.; Selimovic, V.; Shilling, J.E. Optical properties and aging of light-absorbing secondary organic aerosol. Atmos. Chem. Phys. 2016, 16, 12815–12827. [Google Scholar] [CrossRef]
  7. Wong, J.P.S.; Nenes, A.; Weber, R.J. Changes in Light Absorptivity of Molecular Weight Separated Brown Carbon due to Photolytic Aging. Environ. Sci. Technol. 2017, 51, 8414–8421. [Google Scholar] [CrossRef] [PubMed]
  8. Hecobian, A.; Zhang, X.; Zheng, M.; Frank, N.; Edgerton, E.S.; Weber, R.J. Water-Soluble Organic Aerosol material and the light-absorption characteristics of aqueous extracts measured over the Southeastern United States. Atmos. Chem. Phys. 2010, 10, 5965–5977. [Google Scholar] [CrossRef]
  9. Hu, Z.; Kang, S.; Li, C.; Yan, F.; Chen, P.; Gao, S.; Wang, Z.; Zhang, Y.; Sillanpaa, M. Light absorption of biomass burning and vehicle emission-sourced carbonaceous aerosols of the Tibetan Plateau. Environ. Sci. Pollut. Res. 2017, 24, 15369–15378. [Google Scholar] [CrossRef]
  10. Chen, P.; Kang, S.; Gan, Q.; Yu, Y.; Yuan, X.; Liu, Y.; Tripathee, L.; Wang, X.; Li, C. Concentrations and light absorption properties of PM2.5 organic and black carbon based on online measurements in Lanzhou, China. J. Environ. Sci. 2023, 131, 84–95. [Google Scholar] [CrossRef]
  11. Bhattarai, H.; Saikawa, E.; Wan, X.; Zhu, H.; Ram, K.; Gao, S.; Kang, S.; Zhang, Q.; Zhang, Y.; Wu, G.; et al. Levoglucosan as a tracer of biomass burning: Recent progress and perspectives. Atmos. Res. 2019, 220, 20–33. [Google Scholar] [CrossRef]
  12. Andreae, M.O.; Merlet, P. Emission of trace gases and aerosols from biomass burning. Glob. Biogeochem. Cycles 2001, 15, 955–966. [Google Scholar] [CrossRef]
  13. Van der Werf, G.R.; Randerson, J.T.; Giglio, L.; Collatz, G.; Mu, M.; Kasibhatla, P.S.; Morton, D.C.; DeFries, R.; Jin, Y.V.; van Leeuwen, T.T. Global fire emissions and thecontribution of deforestation, savanna, forest, agricultural, and peat fires (1997–2009). Atmos. Chem. Phys. 2010, 10, 11707–11735. [Google Scholar] [CrossRef]
  14. Venkataraman, C.; Habib, G.; Kadamba, D.; Shrivastava, M.; Leon, J.F.; Crouzille, B.; Boucher, O.; Streets, D.G. Emissions from open biomass burning in India: Integrating the inventory approach with high-resolution Moderate Resolution Imaging Spectroradiometer (MODIS) active-fire and land cover data. Glob. Biogeochem. Cycles 2006, 20, 1–12. [Google Scholar] [CrossRef]
  15. You, C.; Xu, C.; Xu, B.; Zhao, H.; Song, L. Levoglucosan evidence for biomass burning records over Tibetan glaciers. Environ. Pollut. 2016, 216, 173–181. [Google Scholar] [CrossRef] [PubMed]
  16. Bond, T.C.; Streets, D.G.; Yarber, K.F.; Nelson, S.M.; Woo, J.H.; Klimont, Z. A technology-based global inventory of black and organic carbon emissions from combustion. J. Geophys. Res Atmos. 2004, 109, D14203. [Google Scholar] [CrossRef]
  17. Farahani, V.J.; Altuwayjiri, A.; Pirhadi, M.; Verma, V.; Ruprecht, A.A.; Diapouli, E.; Eleftheriadis, K.; Sioutas, C. The oxidative potential of particulate matter (PM) in different regions around the world and its relation to air pollution sources. Environ. Sci. Atmos. 2022, 2, 1076–1086. [Google Scholar] [CrossRef] [PubMed]
  18. Li, Q.; Wyatt, A.; Kamens, R.M. Oxidant generation and toxicity enhancement of aged-diesel exhaust. Atmos. Environ. 2009, 43, 1037–1042. [Google Scholar] [CrossRef]
  19. Liu, W.J.; Xu, Y.S.; Liu, W.X.; Liu, Q.Y.; Yu, S.Y.; Liu, Y.; Wang, X.; Tao, S. Oxidative potential of ambient PM2.5 in the coastal cities of the Bohai Sea, northern China: Seasonal variation and source apportionment. Environ. Pollut. 2018, 236, 514–528. [Google Scholar] [CrossRef]
  20. Bates, J.T.; Fang, T.; Verma, V.; Zeng, L.; Weber, R.J.; Tolbert, P.E.; Abrams, J.Y.; Sarnat, S.E.; Klein, M.; Mulholland, J.A.; et al. Review of Acellular Assays of Ambient Particulate Matter Oxidative Potential: Methods and Relationships with Composition, Sources, and Health Effects. Environ. Sci. Technol. 2019, 53, 4003–4019. [Google Scholar] [CrossRef]
  21. Cho, A.K.; Sioutas, C.; Miguel, A.H.; Kumagai, Y.; Schmitz, D.A.; Singh, M.; Eiguren-Fernandez, A.; Froines, J.R. Redox activity of airborne particulate matter at different sites in the Los Angeles Basin. Environ. Res. 2005, 99, 40–47. [Google Scholar] [CrossRef] [PubMed]
  22. Song, M.; Chio, J.; Oh, S.H.; Cheo, S.; Yu, G.H.; Cho, S.S.; Park, J.; Bae, M.S. Diurnal dithiothreitol assays for biomass burning source in PM1.0 and PM2.5 during summer and winter. Atmos. Environ. 2023, 313, 1200033. [Google Scholar] [CrossRef]
  23. Oh, S.H.; Choe, S.; Song, M.; Yu, G.H.; Schauer, J.J.; Shin, S.A.; Bae, M.S. Effects of long-range transport on carboxylic acids, chlorinated VOCs, and oxidative potential in air pollution events. Environ. Pollut. 2024, 347, 123666. [Google Scholar] [CrossRef] [PubMed]
  24. Oh, S.; Park, K.; Park, M.; Song, M.; Jang, K.S.; Schauer, J.J.; Bae, G.N.; Bae, M.S. Comparison of the sources and oxidative potential of PM2.5 during winter time in large cities in China and South Korea. Sci. Total Environ. 2023, 859, 160369. [Google Scholar] [CrossRef] [PubMed]
  25. Ferrero, L.; Bernardoni, V.; Santagostini, L.; Cogliati, S.; Soldan, F.; Valentini, S.; Massabo, D.; Mocnik, G.; Gregoric, A.; Rigler, M.; et al. Consistent determination of the heating rate of light-absorbing aerosol using wavelength-and time-dependent Aethalometer multiple-scattering correction. Sci. Total Environ. 2021, 791, 148277. [Google Scholar] [CrossRef] [PubMed]
  26. Bernardoni, V.; Valli, G.; Vecchi, R. Set-up of a multi wavelength polar photometer for off-line absorption coefficient measurements on 1-h resolved aerosol samples. Aerosol Sci. 2017, 107, 84–93. [Google Scholar] [CrossRef]
  27. Wang, Q.; Han, Y.; Ye, J.; Liu, S.; Pongpiachan, S.; Zhang, N.; Han, Y.; Tian, J.; Wu, C.; Long, X.; et al. High contribution of secondary brown carbon to aerosol light absorption in the southeastern margin of Tibetan Plateau. Geophys. Res. Lett. 2019, 46, 4962–4970. [Google Scholar] [CrossRef]
  28. Lee, Y.; Kim, E.; Ryu, C.; Oh, S.H.; Joo, H.; Bae, M.S. Relationship between cholesterol and oxidative potential from meat cooking. J. Korean Soc. Atmos. Environ. 2018, 34, 639–650. [Google Scholar] [CrossRef]
  29. Song, M.; Choe, S.; Song, M.Y.; Shin, S.K.; Oh, S.H.; Jeon, H.; Yu, G.H.; Lee, T.; Bae, M.S. Identifying Sources of Atmospheric Pollutants in Densely Populated Urban Areas from a Particle Toxicity Perspective: A Study Using PMF Model and Vehicle Flux Analysis. Asia-Pac. J. Atmos. Sci. 2023, 60, 95–106. [Google Scholar] [CrossRef]
  30. Song, M.; Kim, M.; Oh, S.H.; Yu, G.H.; Choe, S.H.; Jeon, H.; Ko, D.H.; Park, C.; Bae, M.S. Characteristics of Atmospheric Pollutants in Paddy and Dry Field Regions: Analyzing the Oxidative Potential of Biomass Burning. Atmosphere 2024, 15, 493. [Google Scholar] [CrossRef]
  31. Snowani, S.; Saxena, P.; Shukla, A. Carbonaceous Aerosol Characterization and Their Relationship with Meteorological Parameters During Summer Monsoon and Winter Monsoon at an Industrial Region in Delhi, India. Earth Space Sci. 2021, 8, e2020EA001303. [Google Scholar] [CrossRef]
  32. Liu, K.; Ren, J. Seasonal characteristics of PM2.5 and its chemical species in the northern rural China. Atmos. Pollut. Res. 2020, 11, 1891–1901. [Google Scholar] [CrossRef]
  33. Watson, J.G.; Chow, J.C.; Houck, J.E. PM2.5 chemical source profiles for vehicle exhaust, vegetative burning, geological material, and coal burning in northwestern Colorado during 1995. Chemosphere 2001, 43, 1141–1151. [Google Scholar] [CrossRef]
  34. Fan, X.; Li, M.; Cao, T.; Cheng, C.; Li, F.; Xie, Y.; Wei, S.; Song, J.; Peng, P. Optical properties and oxidative potential of water and alkaline-soluble brown carbon in smoke particles emitted from laboratory simulated biomass burning. Atmos. Environ. 2018, 194, 48–57. [Google Scholar] [CrossRef]
  35. Saleh, R.; Robinson, E.S.; Tkacik, D.S.; Ahern, A.T.; Liu, S.; Aiken, A.C.; Sullivan, R.C.; Presto, A.A.; Dubey, M.K.; Yokelson, R.J.; et al. Brownness of organics in aerosols from biomass burning linked to their black carbon content. Nat. Geo. Sci. 2014, 7, 647. [Google Scholar] [CrossRef]
  36. Pokhrel, R.P.; Beamesderfer, E.R.; Wagner, N.L.; Langridge, J.M.; Lack, D.A.; Jayarathne, T.; Stone, E.A.; Stockwell, C.E.; Yokelson, R.J.; Murphy, S.M. Relative importance of black carbon, brown carbon, and absorption enhancement from clear coatings in biomass burning emissions. Atmos. Chem. Phys. 2017, 17, 5063–5078. [Google Scholar] [CrossRef]
  37. Xie, C.; Xu, W.; Wang, J.; Wang, Q.; Liu, D.; Tang, G.; Chen, P.; Du, W.; Zhao, J.; Zhang, Y.; et al. Vertical characterization of aerosol optical properties and brown carbon in winter in urban Beijing, China. Atmos. Chem. Phys. 2019, 19, 165–179. [Google Scholar] [CrossRef]
  38. Sun, J.; Xie, C.; Xu, W.; Chen, C.; Ma, N.; Xu, W.; Lei, L.; Li, Z.; He, Y.; Qiu, Y.; et al. Light absorption of black carbon and brown carbon in winter in North China Plain: Comparisons between urban and rural sites. Sci. Environ. 2021, 770, 144821. [Google Scholar] [CrossRef]
  39. Qin, Y.M.; Tan, H.B.; Li, Y.J.; Li, Z.J.; Schurman, M.I.; Liu, L.; Wu, C.; Chan, C.K. Chemical characteristics of brown carbon in atmospheric particles at a suburban site near Guangzhou, China. Atmos. Chem. Phys. 2018, 18, 16409–16418. [Google Scholar] [CrossRef]
  40. Singh, S.; Gokhale, S. Source apportionment and light absorption properties of black and brown carbon aerosols in the Brahmaputra River valley region. Urban Clim. 2021, 39, 100963. [Google Scholar] [CrossRef]
  41. Simoneit, B.R.T.; Schauer, J.J.; Nolte, C.G.; Oros, D.R.; Elias, V.O.; Fraser, P.; Rogge, W.F.; Cass, G.R. Levoglucosan, a tracer for cellulose in biomass burning and atmospheric particles. Atmos. Environ. 1999, 33, 173–182. [Google Scholar] [CrossRef]
  42. Massimi, L.; Simonetti, G.; Buiarelli, F.; Di Filippo, P.; Pomata, D.; Riccardi, C.; Ristorini, M.; Astolfi, M.L.; Canepari, S. Spatial distribution of levoglucosan and alternative biomass burning tracers in atmospheric aerosols, in an urban and industrial hot-spot of Central Italy. Atmos. Res. 2020, 239, 104904. [Google Scholar] [CrossRef]
  43. Li, X.; Chen, M.; Le, H.P.; Wang, F.; Guo, Z.; Iinuma, Y.; Chen, J.; Herrmann, H. Atmospheric outflow of PM2.5 saccharides from megacity Shanghai to East China Sea: Impact of biological and biomass burning sources. Atmos. Environ. 2016, 143, 1–14. [Google Scholar] [CrossRef]
  44. Jeong, C.H.; Evans, G.J.; Dann, T.; Graham, M.; Herod, D.; Dabek-Zlotorzynska, E.; Mathieu, D.; Ding, L.; Wang, D. Influence of biomass burning on wintertime fine particulate matter: Source contribution at a valley site in rural British Columbia. Atmos. Environ. 2008, 42, 3684–3699. [Google Scholar] [CrossRef]
  45. Al-Naiema, I.M.; Offenberg, J.H.; Madler, C.J.; Lewandowski, M.; Ettler, J.; Fang, T.; Stone, E.A. Secondary organic aerosols from aromatic hydrocarbons and their contribution to fine particulate matter in Atlanta, Georgia. Atmos. Environ. 2020, 223, 117227. [Google Scholar] [CrossRef]
  46. Cheng, Y.; Engling, G.; He, K.B.; Duan, F.K.; Ma, Y.L.; Du, Z.Y.; Liu, J.M.; Zheng, M.; Weber, R.J. Biomass burning contribution to Beijing aerosol. Atmos. Chem. Phys. 2013, 13, 7765–7781. [Google Scholar] [CrossRef]
  47. Ho, K.F.; Engling, G.; Ho, S.S.H.; Huang, R.; Lai, S.; Cao, J.; Lee, S.C. Seasonal variations of anhydrosugars in PM2.5 in the Pearl River Delta Region, China. Tellus B Chem. Phys. Meteo. 2014, 66, 22577. [Google Scholar] [CrossRef]
  48. Hakimzadeh, M.; Soleimanian, E.; Mousavi, A.; Borgin, A.; Macro, C.D.; Ruprecht, A.A.; Sioutas, C. The impact of biomass burning on the oxidative potential of PM2.5 in the metropolitan area of Milan. Atmos. Environ. 2020, 224, 117328. [Google Scholar] [CrossRef]
  49. Verma, V.; Fang, T.; Guo, H.; King, L.; Bates, J.T.; Peltier, R.E.; Edgerton, E.; Russell, A.G.; Weber, R.J. Reactive oxygen species associated with water-soluble PM2.5 in the southeastern United States: Spatiotemporal trends and source apportionment. Atmos. Chem. Phys. 2014, 14, 12915–12930. [Google Scholar] [CrossRef]
Figure 1. Sampling site on the rooftop of a 4-story building at the Mokpo University, Republic of Korea.
Applsci 14 04117 g001
Figure 2. DTT-OP reduction rate results by quinone concentration.
Applsci 14 04117 g002
Figure 3. Time series concentrations of (a) wind speed, temperature, and relative humidity; (b) OC, NH4+, NO3, and SO42−; (c) K+ and K; (d) levoglucosan and mannosan; (e) BC880 and EC; and (f) BC370 and BrC370 in the sampling periods.
Applsci 14 04117 g003
Figure 4. (a) Diurnal patterns of 3-h integrated elemental carbon (EC) and brown carbon at 880 nm (BrC880), and (b) pairwise correlation scatterplots between EC and black carbon at 880 nm (BC880) during the measurement period.
Applsci 14 04117 g004
Figure 5. (a) Diurnal patterns of 3-h integrated brown carbon at 370 nm (BrC370), levoglucosan, and mannosan; (b) correlation of levoglucosan and BrC370; (c) diurnal patterns of mean hourly potassium ions (K+) and elemental potassium (K); (d) correlation of K+ and K during the measurement period.
Applsci 14 04117 g005
Figure 6. Correlation of DTT-OP with (a) organic carbon (OC), (b) levoglucosan, (c) black carbon at 370 nm (BC370), and (d) brown carbon at 370 nm (BrC370) during the measurement period.
Applsci 14 04117 g006
Table 1. Overall average results of major chemical compounds in PM2.5 in this study.
CompoundsUnitAverage ± S.D (1)Range
PM2.5 massμg/m321.3 ± 6.67.9–37.2
OCμg/m36.1 ± 2.82.0–18.0
ECμg/m30.5 ± 0.20.2–1.2
NO3μg/m36.6 ± 5.00.5–21.9
SO42−μg/m32.9 ± 1.31.0–9.8
NH4+μg/m34.4 ± 2.41.0–13.2
K+μg/m30.2 ± 0.10.1–0.4
Kμg/m30.3 ± 0.10.1–0.7
Levoglucosanng/m3151.3 ± 152.69.0–754.8
Mannosanng/m343.1 ± 46.92.9–268.3
BC370μg/m31.6 ± 1.00.3–5.2
BC880μg/m31.0 ± 0.60.2–2.6
BC370 (babs)Mm−119.1 ± 10.54.2–49.3
BrC370 (babs)Mm−19.6 ± 8.90.9–50.8
Levoglucosan/OC-0.022 ± 0.0160.003–0.084
Levoglucosan/BC370μg/Mm20.010 ± 0.0070.003–0.031
Levoglucosan/BrC370μg/Mm20.031 ± 0.0320.003–0.155
QDTT-OPnM/m35.3 ± 2.01.2–12.1
(1) Standard deviation.
Table 2. Results of previous research on BC and BrC light absorption coefficients at 370 nm.
BC370
(Mm−1)
BrC370
(Mm−1)
BrC Contribution
(%)
SiteReference
382052Urban[10]
261038Urban[27]
472246Urban[37]
672436Urban[38]
1756738Rural[38]
561424Urban[39]
2314620Rural[40]
Disclaimer/Publisher’s Note: The statements, opinions and data contained in all publications are solely those of the individual author(s) and contributor(s) and not of MDPI and/or the editor(s). MDPI and/or the editor(s) disclaim responsibility for any injury to people or property resulting from any ideas, methods, instructions or products referred to in the content.

