Article

Plant Density and Health Evaluation in Green Stormwater Infrastructure Using Unmanned-Aerial-Vehicle-Based Imagery

1
Department of Civil and Environmental Engineering, Morgan State University, 1700 East Cold Spring Lane, Baltimore, MD 21251, USA
2
DOE Great Lakes Bioenergy Research Center, University of Wisconsin—Madison, Madison, WI 53726, USA
*
Author to whom correspondence should be addressed.
Appl. Sci. 2024, 14(10), 4118; https://doi.org/10.3390/app14104118
Submission received: 3 April 2024 / Revised: 2 May 2024 / Accepted: 10 May 2024 / Published: 13 May 2024
(This article belongs to the Section Environmental Sciences)

Abstract

:

Featured Application

This framework can be applied to evaluate plant density and health in different types of green stormwater infrastructures, agriculture land, and forests.

Abstract

Over the past few decades, there has been a notable surge in interest in green stormwater infrastructure (GSI). This trend is a result of the need to effectively address issues related to runoff, pollution, and the adverse effects of urbanization and impervious surfaces on waterways. Concurrently, umanned aerial vehicles (UAVs) have gained prominence across applications, including photogrammetry, military applications, precision farming, agricultural land, forestry, environmental surveillance, remote-sensing, and infrastructure maintenance. Despite the widespread use of GSI and UAV technologies, there remains a glaring gap in research focused on the evaluation and maintenance of the GSIs using UAV-based imagery. This study aimed to develop an integrated framework to evaluate plant density and health within GSIs using UAV-based imagery. This integrated framework incorporated the UAV (commonly known as a drone), WebOpenDroneMap (WebDOM), ArcMap, PyCharm, and the Canopeo application. The UAV-based images of GSI components, encompassing trees, grass, soil, and unhealthy trees, as well as entire GSIs (e.g., bioretention and green roofs) within the Morgan State University (MSU) campus were collected, processed, and analyzed using this integrated framework. Results indicated that the framework yielded highly accurate predictions of plant density with a high R2 value of 95.8% and lower estimation errors of between 3.9% and 9.7%. Plant density was observed to vary between 63.63% and 75.30% in the GSIs at the MSU campus, potentially attributable to the different types of GSI, varying facility ages, and inadequate maintenance. Normalized difference vegetation index (NDVI) maps and scales of two GSIs were also generated to evaluate plant health. The NDVI and plant density results can be used to suggest where new plants can be added and to provide proper maintenance to achieve proper functions within the GSIs. This study provides a framework for evaluating plant performance within the GSIs using the collected UAV-based imagery.

1. Introduction

Rapid urbanization, aging infrastructure, and climate change impacts have put a stress on existing the stormwater drainage systems and one commonly used solution to solve these challenges is green stormwater infrastructure (GSI) [1]. GSI represents an innovative approach to stormwater management with three primary functions: mitigating stormwater runoff, controlling floods, and improving water quality [2,3]. GSI encompasses features such as bioretention areas, rain gardens, bioswales, green roofs, permeable pavements, green spaces, and wetlands, all of which utilize vegetation, substrate (or media), soils, and natural processes. GSIs have numerous environmental, social, and economic benefits, including stormwater-runoff reduction [4], air-quality improvement [5], heat-island-effect reduction [6], carbon storage and sequestration, resilience of drainage-system improvement, pollutant reduction, water-quality improvement, urban beautification, land-value increment, and energy-demand reduction [4,5,6,7]. Consequently, there is a global surge in interest and implementation of GSIs aimed at mitigating adverse impacts such as flooding, waterway contamination, and stream degradation. This is achieved by disconnecting the expanding impervious surfaces such as pavements and rooftops in the cities from the storm sewer systems [7,8,9].
Plants play an integral part and multifaceted role within GSIs and contribute to various environmental, ecological, and aesthetic functions. A modeling study using hourly meteorological and pollution concentration data from across the US demonstrate the substantial air-pollution-removal capacity of urban trees for pollutants such as O3, NO2, SO2, and CO, thereby enhancing urban air quality [10]. Additionally, vegetation is widely acknowledged as a particulate matter (PM)-removal solution in cities, taking various forms of green infrastructure [11]. Plants contribute to the improvement of runoff quality by removing nutrients (nitrogen and phosphorus), heavy metals, total suspended solids (TSSs), pathogens, emerging contaminants, and organic pollutants. They also enhance hydrological performance by preventing substrate clogging, mitigating stormwater volume infiltration and evapotranspiration, mitigating erosion, and influencing preferential flow paths [12,13]. Furthermore, plants in GSIs offer additional benefits such as urban greening (enhancing aesthetics), creating habitats for insects and diverse species, and further enhancing air quality [12,13,14]. The effectiveness of GSIs is contingent upon several factors, including plant traits (e.g., plant density), plant health, plant species, soil properties, media types, and retention time [12]. Integrated studies of the impact of trees on air pollution suggest that management of plant canopy cover (also referred to as plant density) could serve as a viable strategy for enhancing air quality and achieving clean air standards [10]. Moreover, the morphological traits of plants (e.g., root structure and plant canopy architecture) play a crucial role in managing the hydrological cycle [12]. Increased vegetation cover is correlated to increased environmental and ecological co-benefits such as habitat enhancement and bird species richness [2,15]. Conversely, low plant density increases the risk of weed invasion and subsequently escalates maintenance costs [16].
Plant density is a critical factor in crop growth and yield, exerting influence over both inter- and intraspecific competition for vital resources (e.g., water, nutrients, and radiation) [17]. Traditionally, monitoring plant density relied on ground-level counts conducted within quadrats or segmented areas [18,19]. Manual plant counting in the field is labor-intensive and disruptive, rendering it impractical for large-scale assessments. In response, an algorithm was developed to count corn plants (or plant density) and estimate plant location and intra-row spacing in segmented images [20]. Machine-vision-based methods have emerged to automate the measurement of wheat plant density during early stages using high-resolution imagery [17,21]. Maize plant density from UAV red, green, and blue (RGB) images was also estimated to investigate the impact of image ground sampling distance (GSD) on the performance of maize plant detection at the three-to-five-leaves stage using a faster region-based convolutional neural network (RCNN) object-detection algorithm [22]. More recently, advancements in UAV imagery coupled with deep-learning techniques have enabled the estimation of plant density, including tillers, in wheat plants [19]. However, there remains a scarcity of research focused on plant density estimation specifically within GSIs.
Healthy plants not only optimize the functionality of GSIs, but also contribute to the attractiveness of facilities to the public and the appreciation of property values. Vegetation indices, such as the normalized difference vegetation index (NDVI) and the normalized difference red edge (NDRE) index, offer crucial insights into vegetation characteristics, including growth, vigor, and plant dynamics [23,24,25]. NDVI and NDRE indices serve as reliable indicators for plant health and field assessment [25,26]. The NDVI is derived from multispectral information as a normalized ratio between the red and near infrared bands [26]. The NDVI is a widely used vegetation index and a way to measure aggregate urban greenness and ecosystem service benefits by evaluating both the quality and quantity of vegetation through the spectral band math of remotely sensed images [2,27,28]. In numerous studies, the NDVI has been applied to investigate specific aspects of land degradation or habitat condition within conservation areas, including examining vegetation cover change, assessing forage quantity and quality, monitoring soil erosion and salinization, and studying the impacts of wildfire and pollutants on vegetation cover [29]. More recently, the NDVI has been utilized as a metric to discern trends in vegetation and to spatially track the installation of GSIs [2]. Therefore, in this study, the NDVI was selected as the primary metric for evaluating plant health within the GSIs of the university campus.
Plant information extracted from remote-sensed imagery primarily relies on interpreting differences and changes in the green foliage and canopy spectral characteristics. Therefore, hyperspatial imagery obtained through UAVs enables the quantification of plant cover, composition, and structure across various spatial scales. There are three types of platforms, including satellite-based remote-sensing, airborne, and, more recently, UAV platforms, to collect remote-sensed information. Compared with remote-sensing and airborne platforms, UAVs are relatively affordable and easier to carry and use [30]. In the past, UAVs have been widely applied in natural resource management, with precision agriculture and rangeland monitoring emerging as the most common applications [31]. Moreover, multispectral remote-sensing data and geographic information systems (GISs) have been leveraged to assess greenness and health condition in both forest and urban ecosystems [32]. European forest research studies have highlighted that the majority of UAV studies have been focused on the estimation of dendrometry parameters, followed by forest health monitoring and disease mapping, tree-species composition classification, post-fire recovery monitoring, and the estimation of post-harvest soil displacement [33]. More recently, the NDVI from UAV waveband data were derived to detect health and disease in vegetation in an urban green space in Bulgaria [34]. Additionally, feasibility studies comparing ground-based and UAV methods of monitoring biomass and primary production in two bioswale cells at an urban stormwater facility have been conducted [35]. Despite the wide-range of applications of UAVs in recent decades, their utilization in GSIs has been surprisingly limited. This study aimed to apply UAVs in the collection of images and to develop an integrated framework for evaluating plant density and health within GSIs. It is crucial to inspect and validate plant density and health for optimizing GSI performance and maintaining their functionality.

2. Methods

2.1. List of Instrumentation and Software

The tools and software, including (1) DJI Phantom 4 Pro drone (resolution: 4096 × 2160), controller, Secure Digital (SD) card, and charged battery pack; (2) MAPIR Survey3N NIR camera and SD card; (3) MAPIR Camera Control (MCC) software(v2019.10.16); (4) iPad (DJI GS Pro app included); (5) WebOpenDroneMap (WebODM); (6) ArcMap; (7) PyCharm; and (8) Canopeo, were used to evaluate the plant density and health within the GSIs. The DJI Phantom 4 Pro drone (resolution: 4096 × 2160) has (effectively) a 20-megapixel camera with a focal length of 8.6 mm, a lens FOV of 84°, a CMOS sensor size of 1 inch, and it captures images at ISO-100 (Dymatize, Tustin, CA, USA) with a shutter speed of 1/320 s [36]. The Survey3N NIR 12 MP camera (MAPIR, San Diego, CA, USA) has a focal length of 8 mm, a 41o FOV, and imagery captured at ISO-400 with a shutter speed of 1/500 s [37]. Survey3N takes pictures every 0.5 s during the flight and saves the photos in RAW image format [37]. Using the MAPIR Camera Control software, the data from the image RAW files and the Global navigation satellite system (GNSS) data stored with the image files are combined. DJI GS Pro app in iPad was used for designing an appropriate flight plan of each studied site. WebODM is an open-source drone mapping software that was implemented to generate orthorectified maps, point clouds, and digital surface models (DSMs) from aerial imagery using image processing libraries including OpenSfM and Primitive Machine Vision System (PMVS) [38,39]. ArcMap was used to view, edit, and analyze geospatial data and maps while PyCharm is an integrated development environment (IDE) which was used in computer programming, specifically for the Python programming language and codes. Python (version 3.9.13) along with libraries (e.g., numpy, cv2, pyplot) were used for developing the framework, and alternative code (e.g., Visual Studio Code) can be used based on individual skills, availability, and familiarity.

2.2. Plant Density and Health Identification Framework

Figure 1 depicts a schematic diagram outlining the workflow for estimating plant density and evaluating the plant health. There were three major steps involved in plant density and health evaluation using the instrumentation and software outlined in Section 2.1. The first step entailed installing a MAPIR camera into the drone and planning the flight path. The DJI GS Pro app was employed to generate flight paths for the drone to automatically capture UAV-based imagery. During flight planning, various parameters were configured to optimize image quality. The primary parameters included flight height, front and side overlap ratio, flight path parallel to the boundary of bioretention, estimated flight duration, and total image quantity to assign drones to fly along the designated path, autonomously capturing images in sequence. For instance, in the case of bioretention, imagery was acquired at an altitude of 35.05 m (115 feet) and at a speed of 1.83 m per second (4.1 mile per hour) with front and side overlap of 90% and 95%, respectively, following a lawn mower pattern to ensure comprehensive coverage. This high-overlap setting ensured that the near infrared (NIR) camera mounted on the drone captured imagery with sufficient overlap to facilitate accurate data collection and processing. Upon completion of the flight mission, two sets of images were collected: red, green, blue (RGB) and NIR images from DJI-drone-equipped RGB camera and additional mounted MAPIR camera. There were two file formats of raw data in the SD card: (1) RAW format, preserving pixel information and (2) JPG format, containing metadata. Both files were required to process the TIFF output and create NIR images.
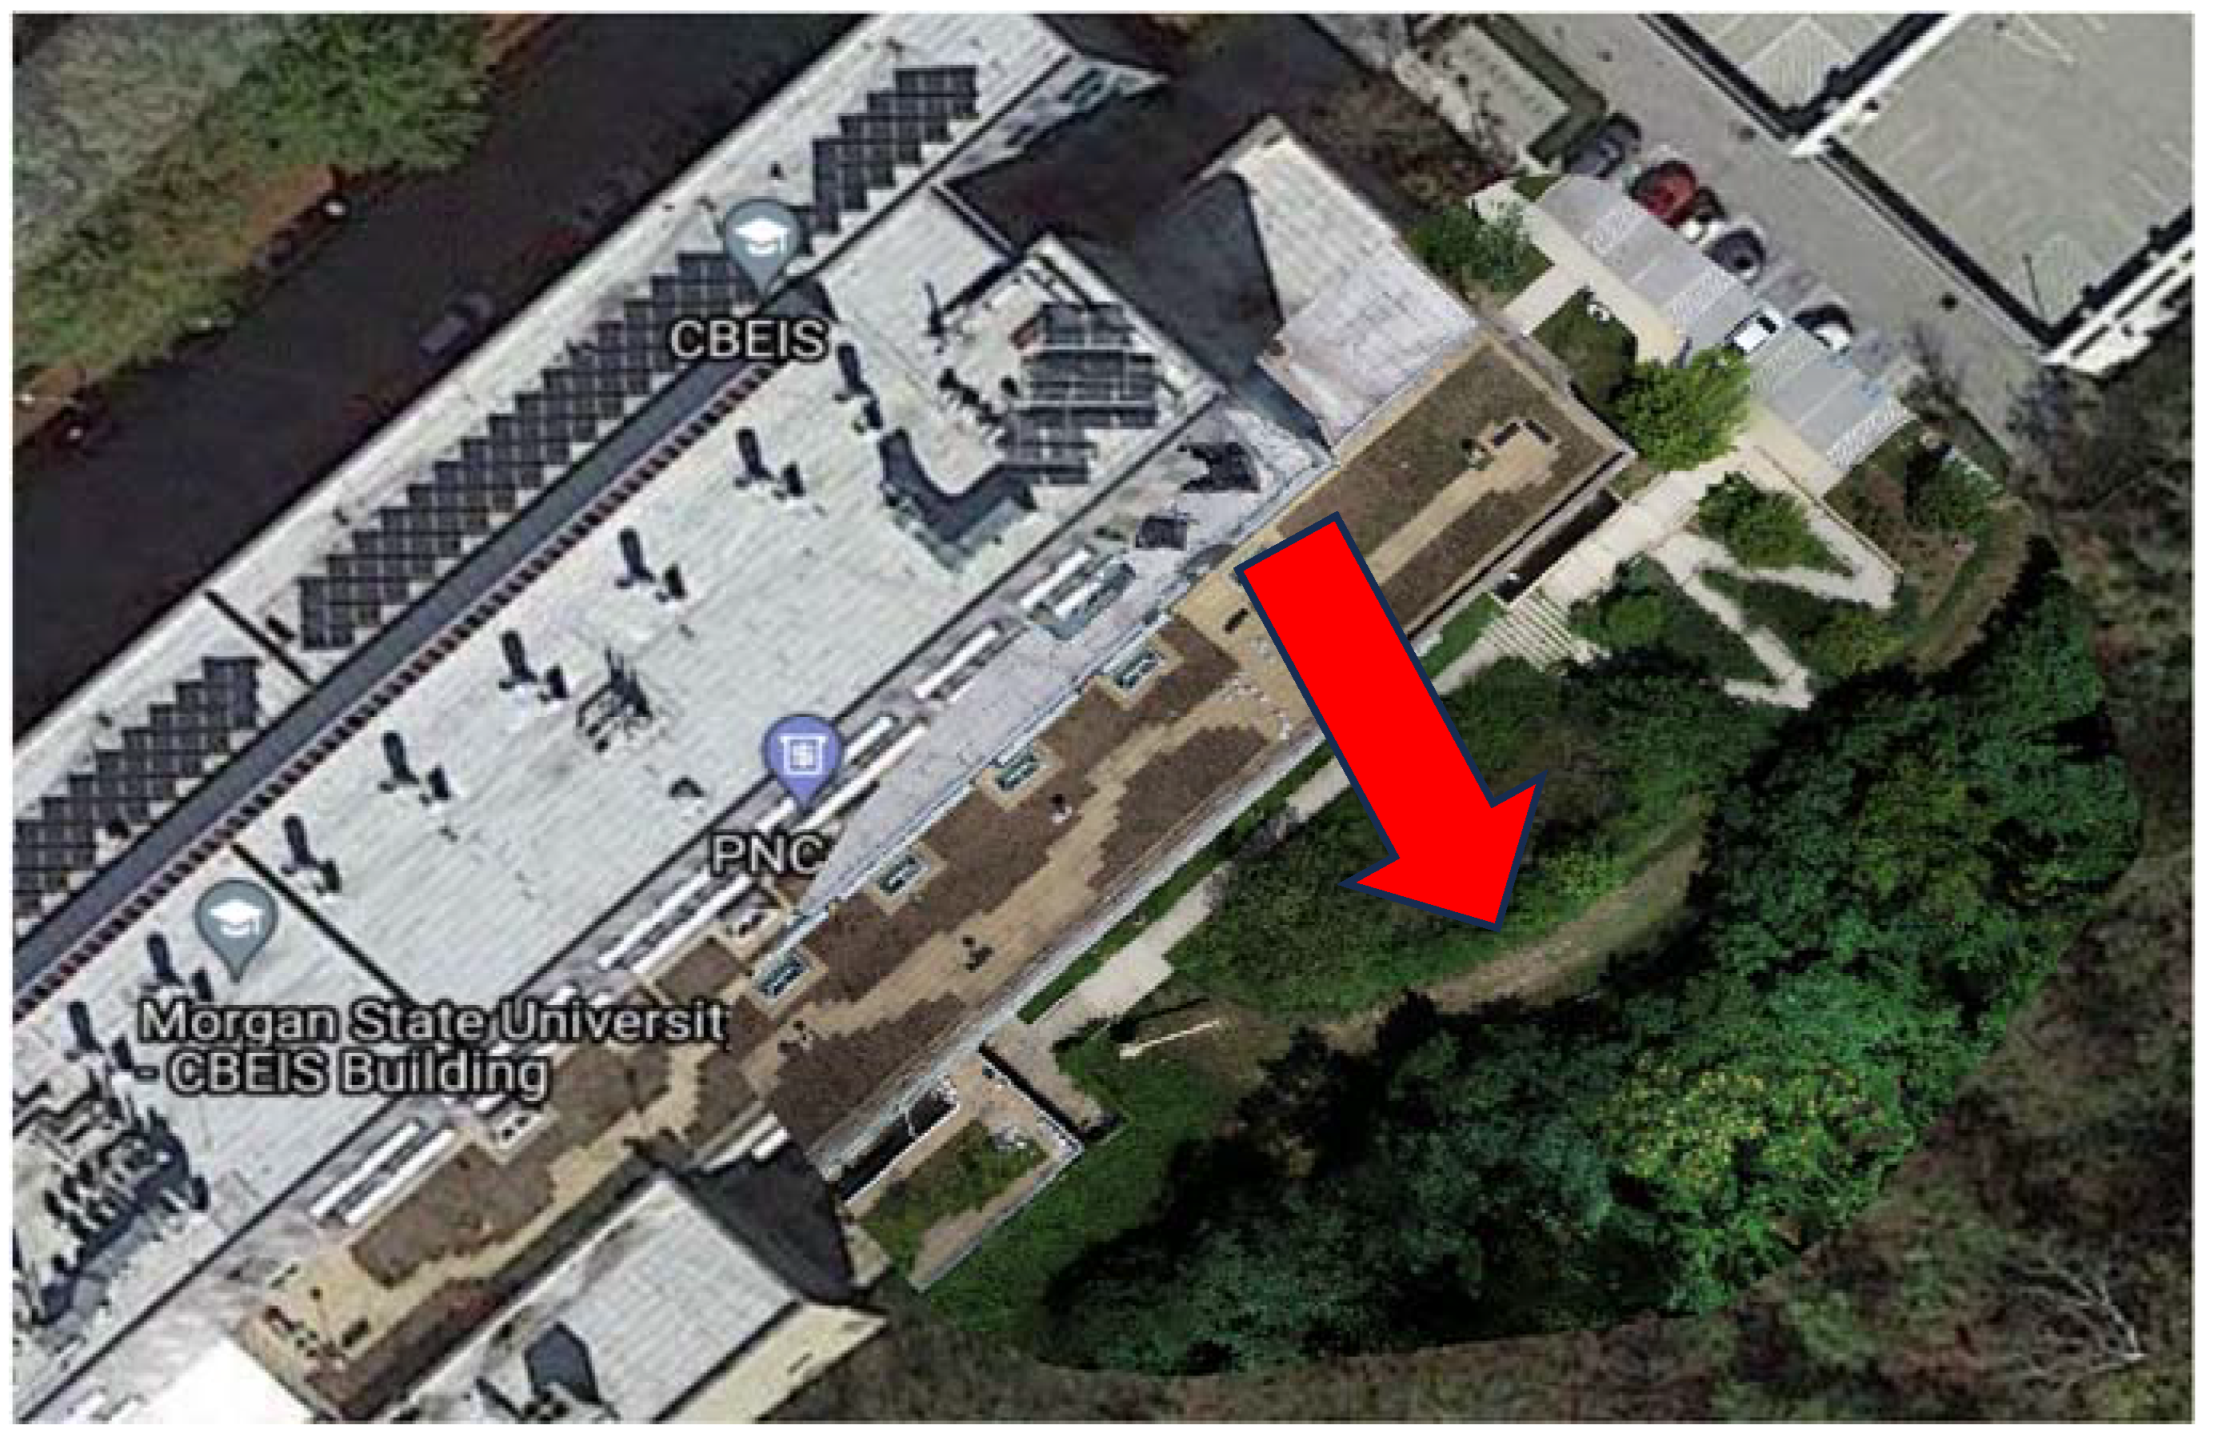
The second step involved preprocessing of the captured images into orthophotos by WebOpenDroneMap (WebODM) Software (v1.9.2). After checking, sorting, and integrating the input RGB and NIR images, we separately imported each set to WebODM software (v1.9.2). Default settings were applied for generating high-resolution orthomosaics to obtain two orthophotos for each flight. One was the RGB orthophoto from the Phantom 4 Pro CMOS camera and the other one was the NIR orthophoto from Survey3N NIR camera. The orthomosaic was generated at a resolution of 1 cm/pixel, chosen to minimize distortion in the orthomosaic and ensure adequate detail for further analysis. Then, a JPG image was created for motion structure processing using WebODM software. Figure 2 shows the UAV-based RGB orthophoto (about 30 images were generated) of GSIs within the campus. The UAV-based image notably exhibits superior resolution (as highlighted with the red arrow) and sensitivity compared to surrounding areas captured by Google Map, which relies on satellite and aerial imagery to create detailed maps and images of the GSIs. Similarly, recent research also concluded that the UAV-based images showed more details of all classes of habitat conditions than the satellite-based Sentinel-2 maps [29].
The third step involved predicting plant density and evaluating plant health using the Canopeo application and PyCharm software (v2020.3.3), in conjunction with ArcMap software (v10.8.1). The ArcMap software was utilized to crop RGB and NIR orthophotos to identical regions of interest (ROIs), focusing exclusively on the GSI areas. Subsequently, the cropped RGB orthophoto was imported into Canopeo and PyCharm software to obtain the plant density percentage using the Python programming codes (Supplementary Materials). In the provided programming code, a pixel intensity value threshold was established to convert green pixels into white and the rest of the pixels into black. The number of white pixels over total pixel numbers was counted to obtain the plant density percentage. Additionally, RGB images captured above the plants were imported to analyze plant density via the Canopeo application. The accuracy was tested and validated by comparing the predicted plant density results from program codes and the calculated values from the Canopeo application. Three statistical parameters, average absolute error (AAE), average biased error (ABE), and coefficient of determination (R2), were employed to evaluate the accuracy and suitability of the program code [40]. Estimation errors, such as ABE, quantify the degree of overestimation and underestimation of models, while AAE measures the degree of closeness between the predicted and measured results. R2 value is widely used in statistical and regression analyses to determine the degree of goodness and accuracy of program code. All the estimation errors and R2 were derived from equations listed below:
AAE = ( i = 1 n P i M i M i ) n × 100 % ,
ABE = ( i = 1 n ( P i M i ) M i ) n × 100 % ,
R 2 = 1 i = 1 n ( P i M i ) 2 i = 1 n ( M i M ¯ ) 2 ,
where P, M, i, and n represent predicted results, measured results, specific sample number, and total number of samples, respectively. Physical measurement of plant density in the field is challenging and labor-intensive due to the irregular shape and unclear boundaries. Therefore, the estimated results from the Canopeo application were assumed and considered as the measured results in this study because the Canopeo application is a commercial product with relatively high accuracy. Results from the Pycharm Software were used as predicted results. Prediction was considered accurate if the estimation errors, AAE and ABE, tended toward zero and the R2 value approached 1. The ArcMap software was utilized to generate NDVI maps, classify NDVI ranges, and extract NDVI values based on the formula, NDVI = (NIR-RED)/(NIR + RED), where NIR stands for the near-infrared spectral band and RED stands for the red spectral band [27,28,29]. The NDVI maps were calculated and generated through ArcToolbox and the Image Analysis Function within ArcMap software.

2.3. Study Sites Selection

Morgan State University (MSU) is situated in the Baltimore City, Maryland, USA. As shown in Table 1, there are several types of GSIs, also known as best management practices (BMPs), including bioretention, green roofs, rain gardens, permeable pavements, and ponds (there were more than 41 GSIs, and 20 of these are summarized). This study used selected specific components of GSIs, such as trees, grass, soil, and unhealthy trees, along with the entire area of the GSIs. For instance, bioretention (the Center for Build Environment & Infrastructure Studies (CBEIS)); green roofs (one at the Earl S. Richardson Library (ESRL) and another at the Graves School of Business and Management (GSBM)), as well as both micro-bioretention and a green roof (Calvin and Tina Tyler Hall (CTTH)) within the MSU Campus were selected for analysis. NAD83 coordinates (north and east points, units: meters, SPC zone: MD-1900) were converted into latitude and longitude (decimal degrees (DD) in Google Map) using the National Geodetic Survey (NGS) coordinate conversion and transformation tool (NCAT). The number ID of GSIs within the MSU are also labeled on top of the downloaded university map and are included in Supplementary Materials.

3. Results and Discussion

3.1. Plant Density Prediction and Validation

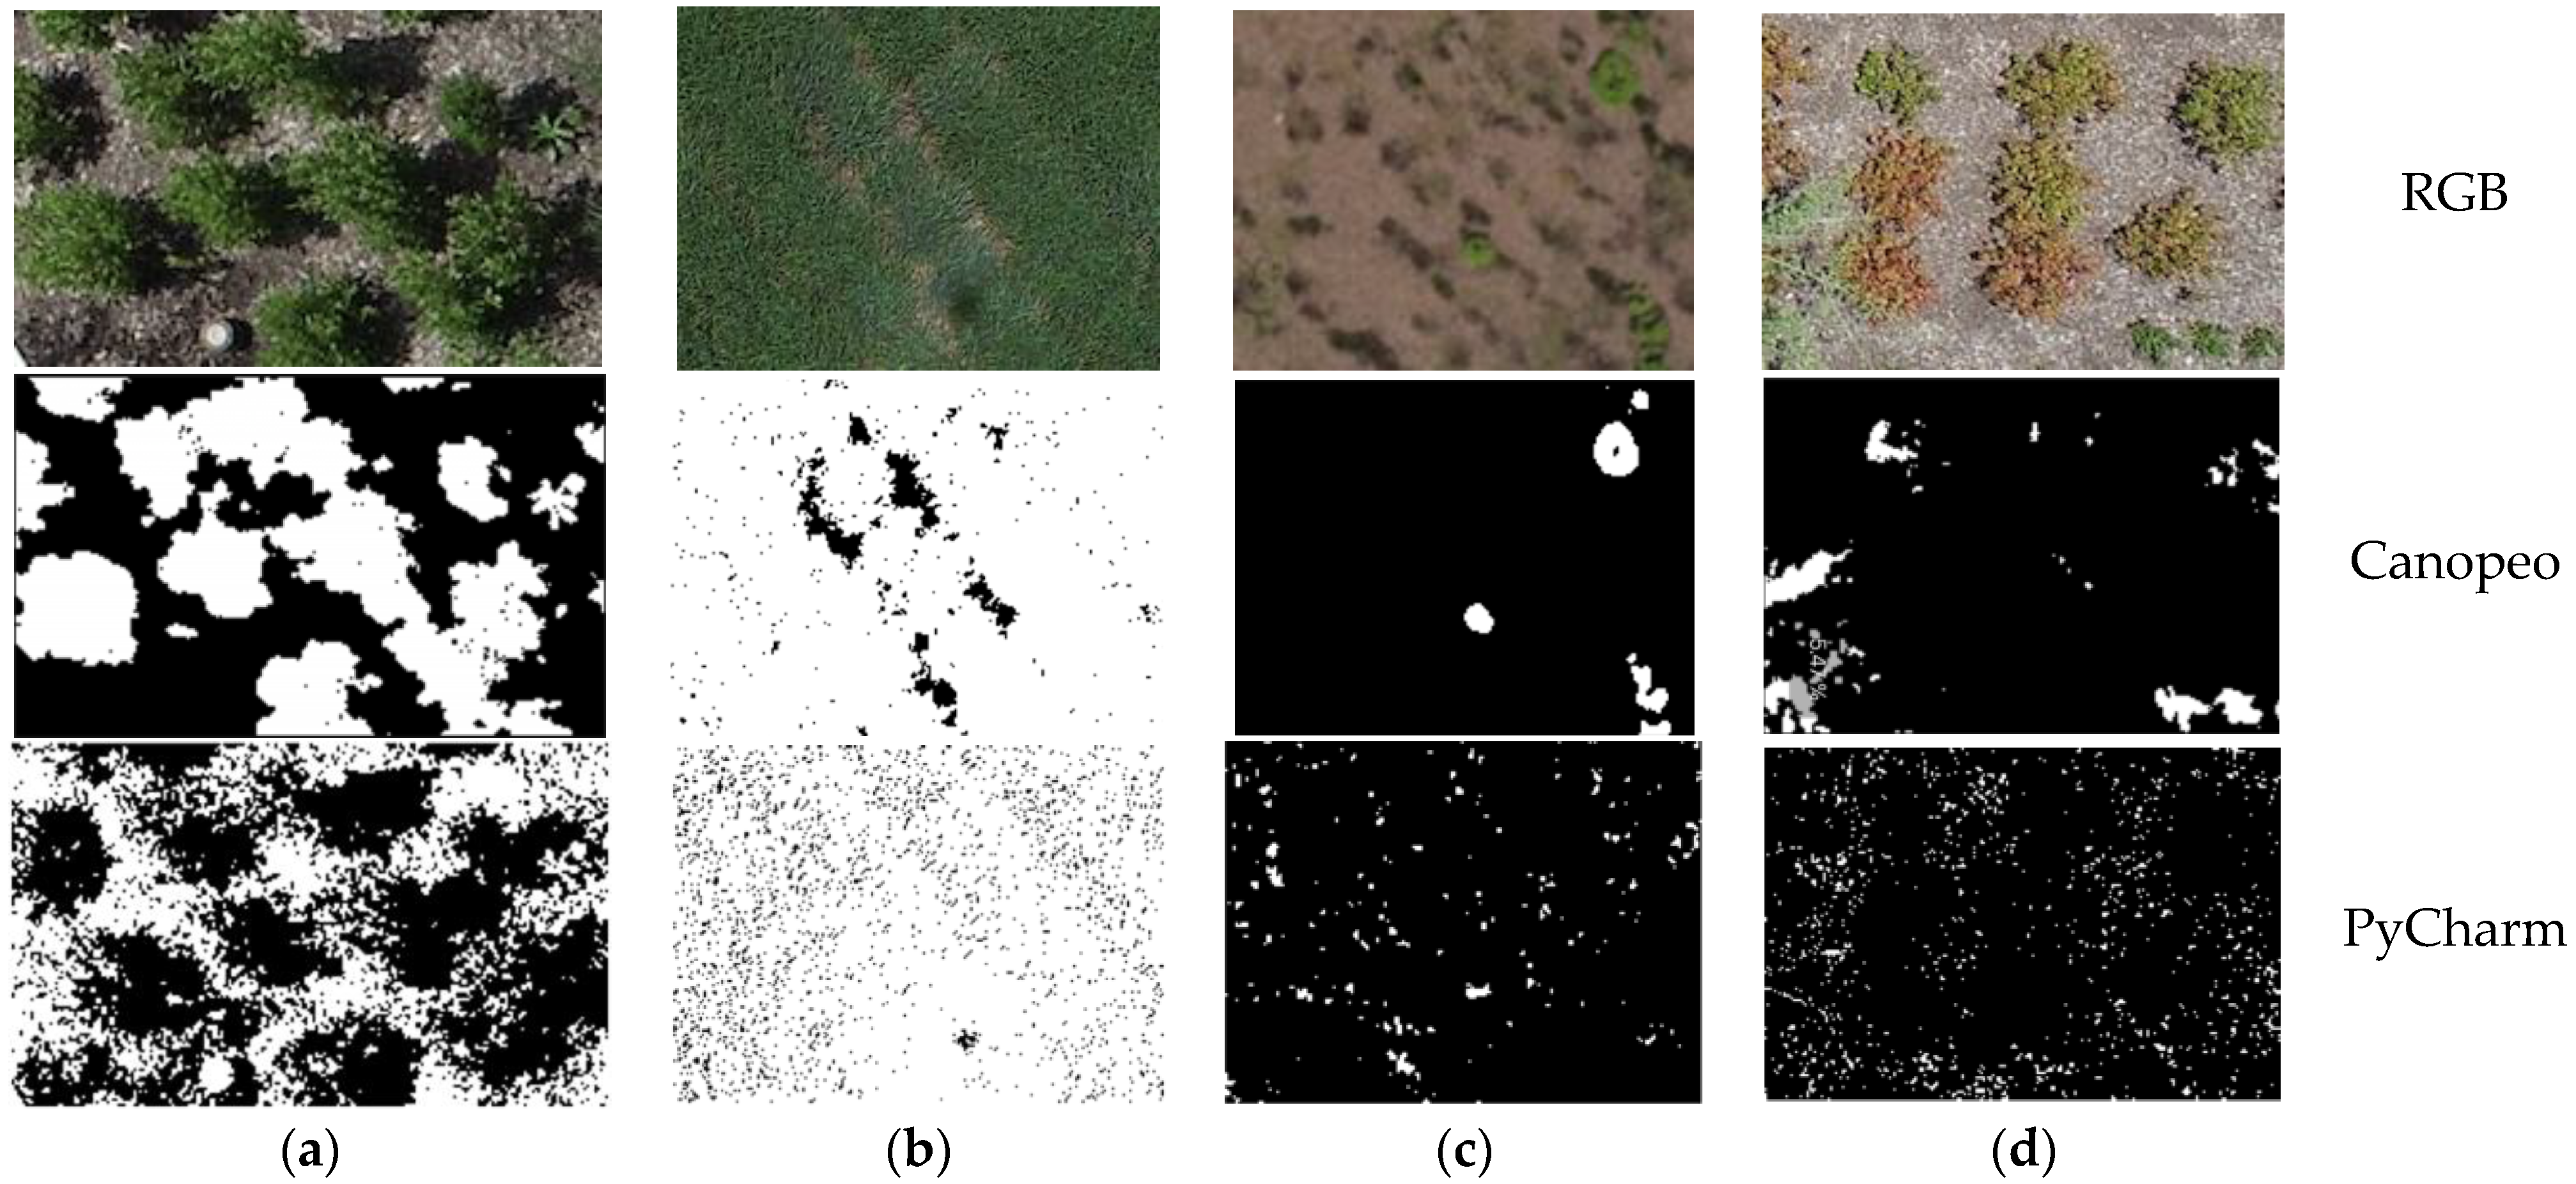
As depicted in first row of Figure 3, RGB images of various GSI components, including trees, grass, soil, and unhealthy trees within the MSU Campus were collected using the drone and extracted from the entire area of GSIs (Supplementary Materials). Subsequently, these images underwent processing and were imported into the Canopeo application, which was developed to quantify canopy cover (or plant density) of green vegetation for any agricultural crop, turf, or grassland based on downward-facing photos. Green live vegetation appears as white pixels and other background elements appear as black pixels in Canopeo, which was the opposite case in code. Results from the Canopeo application in the second row revealed that the plant density percentages were 43.09, 94.69%, 2.51%, and 5.47% for the selected trees, grass, soil, and unhealthy trees, respectively. Additionally, plant density was predicted by self-developed programming codes (Supplementary Materials) in the PyCharm environment. In the last row of Figure 3, the estimated plant densities using the programming code were 42.19%, 93.03%, 2.65%, and 4.96% for the selected trees, grass, soil, and unhealthy trees, respectively.
Plant density prediction between these two methods was very similar, with only a slight difference. Furthermore, three images were further analyzed for each component and the results are summarized in Table 2 (These images can be found in Figure S1 of Supplementary Materials). Errors, including ABE, AEE, and R2 were computed to validate the proposed method based on the computer vision techniques. In this method, the image is initially binarized to identify the green objects, which are then classified into plants based on the geometrical features. The results indicated that self-developed codes for plant density estimation had a high R2 value of 99% and a relatively low estimation errors of 9.7% for AAE and 3.9% for ABE. Previous studies have concentrated on machine-learning and deep-learning algorithms. However, machine learning may be prone to significant errors due to the lack of representativeness of the training dataset and deep learning may be encounter challenges in labeling very large training datasets [19,22]. This study adopted a computer-vision-based code, offering a simple alternative approach to predicting the plant density.

3.2. Plant Density Prediction and Validation

A total of 30–50 RGB images were utilized to generate orthogonal images for two different periods. Then, program codes were implemented to assess the plant density of the entire GSI with multiple components (specifically, bioretention at the back side of the CBEIS building). As shown in Figure 4, the results indicated that the plant density was 75.30% on 27 May 2021, and 74.51% on 28 June 2021.
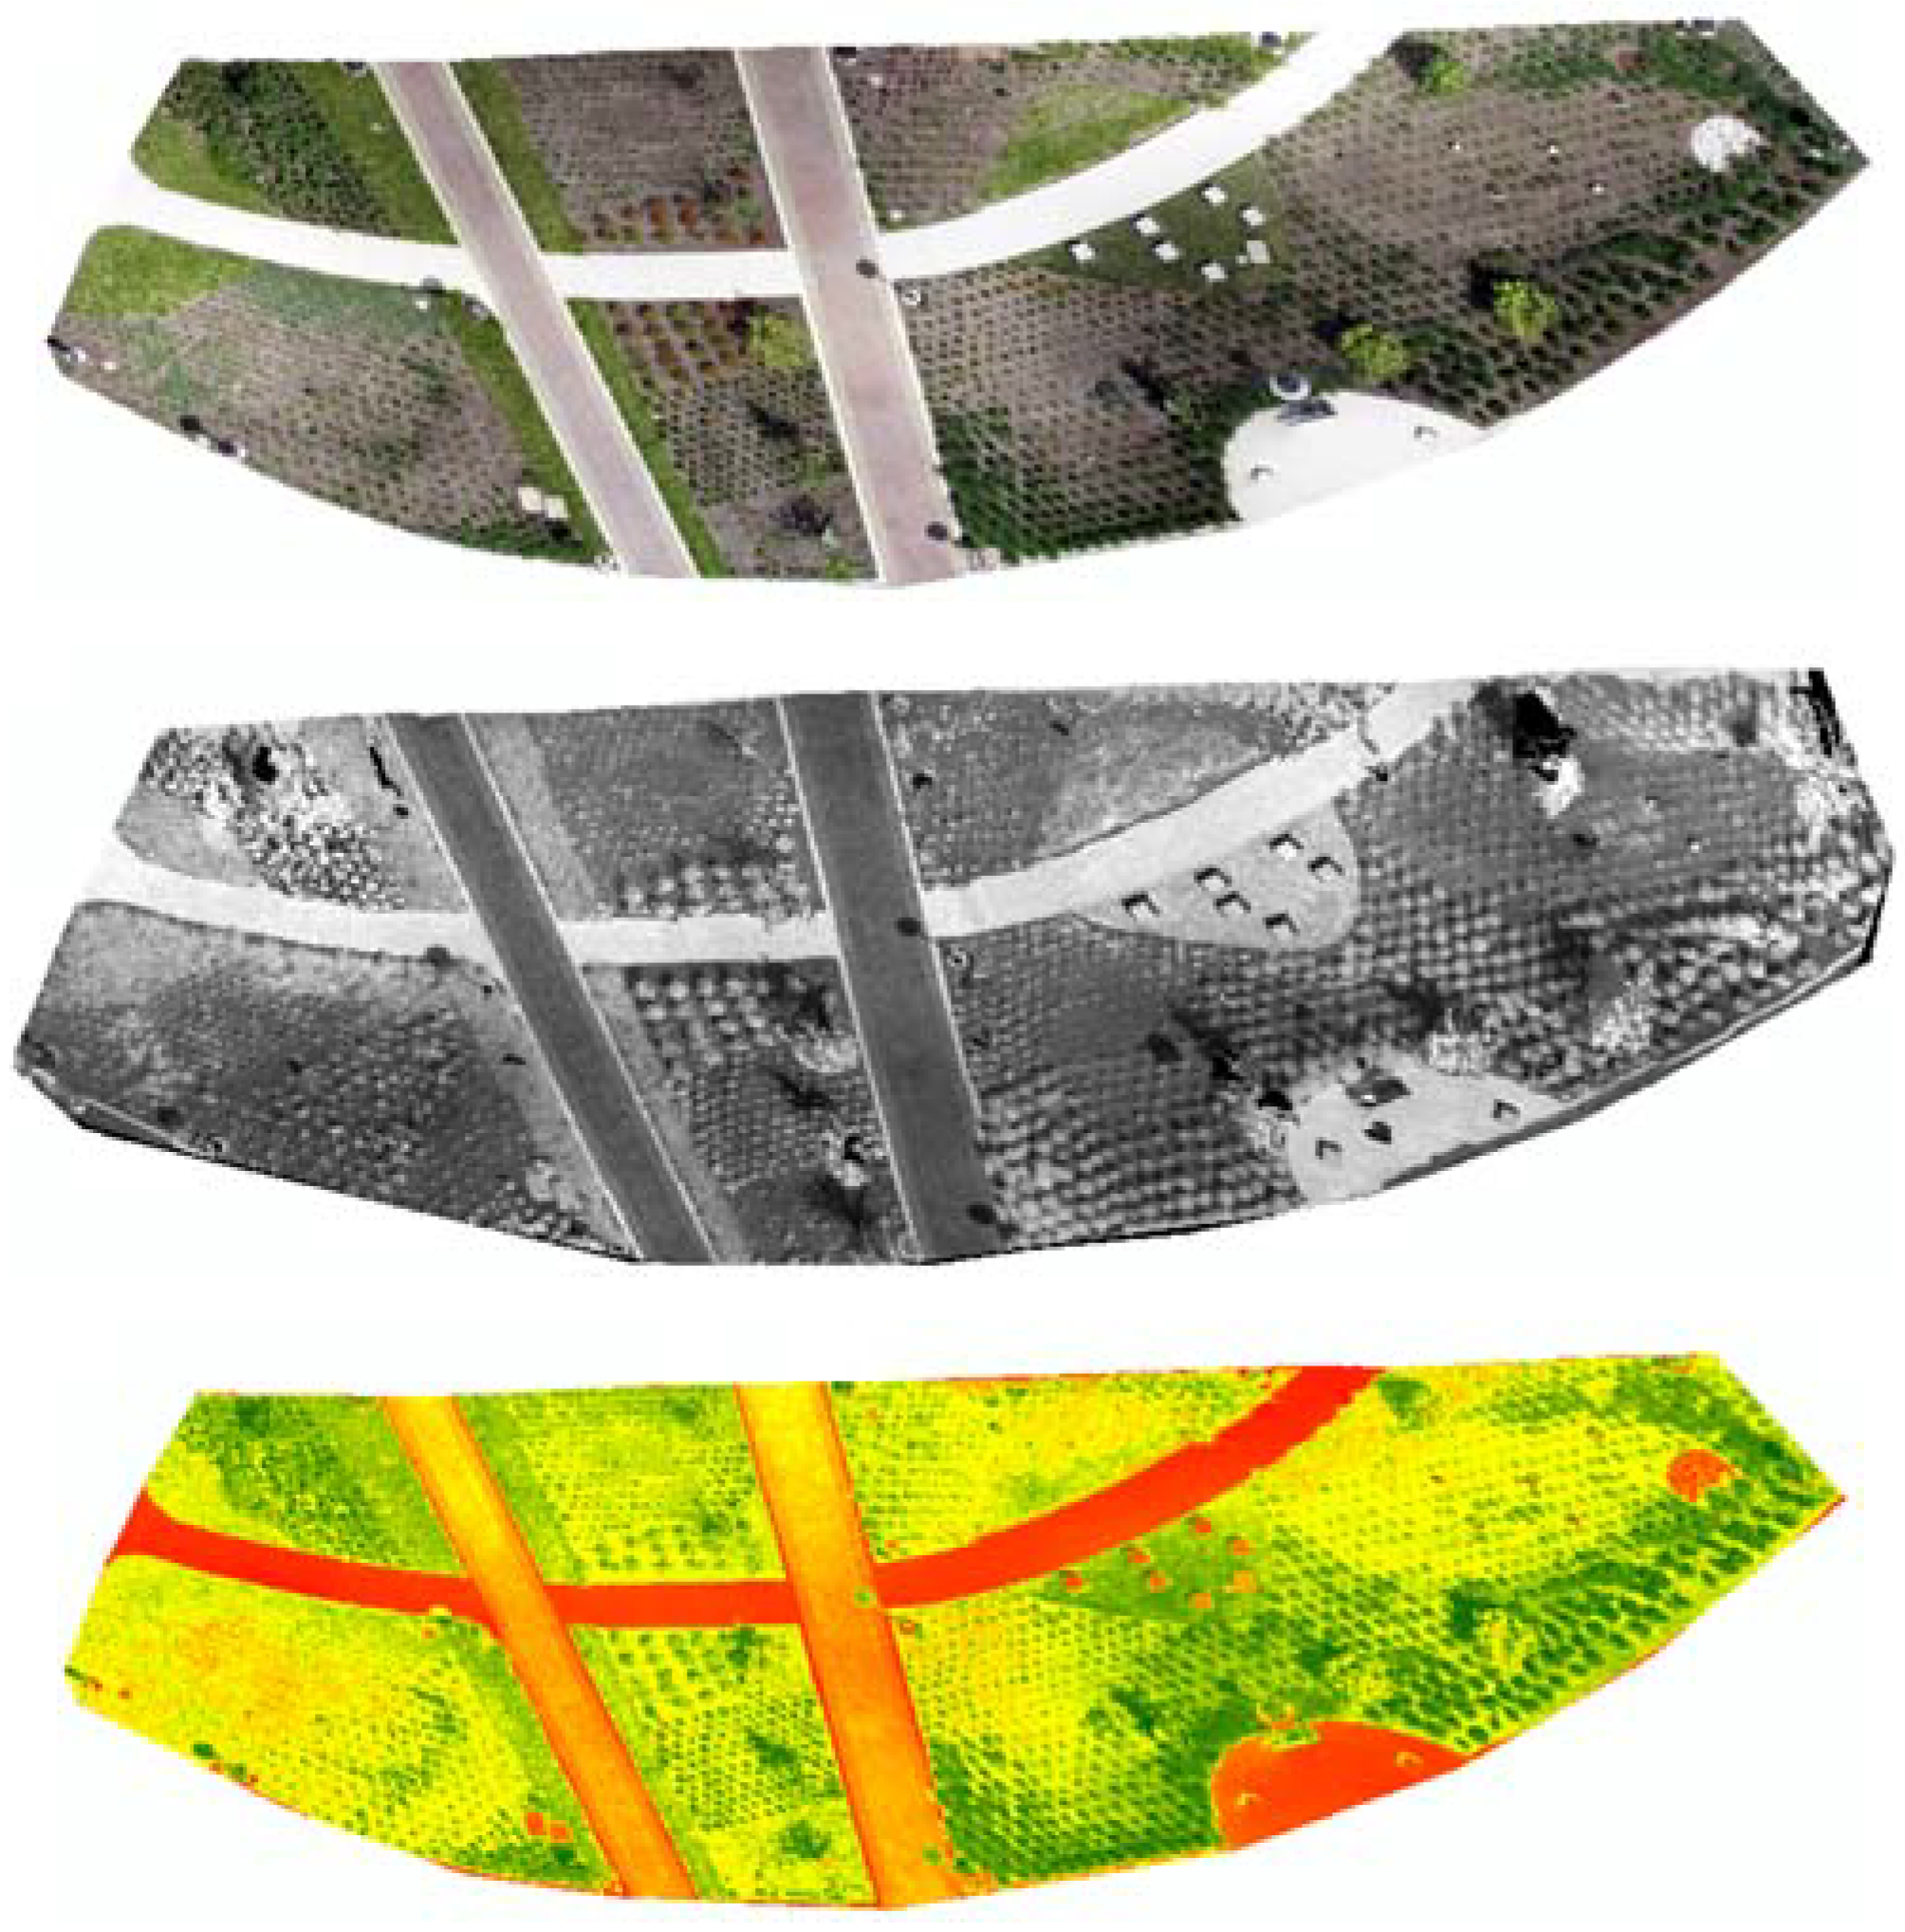
Normally, there might be slight increase in vegetation growth and plant cover from May to June. However, this study found a slight decrease in plant density, which was attributed to the expansion of a stagnant water area (highlighted in red arrow) and inadequate maintenance of GSIs. In the meantime, expansion of the stagnant area was also observed by visual inspection. The minor differences in plant density may also be attributed to variations in growth stages in the previous study. In the previous study, the impact of growth stage on mean plant counting was investigated and the results indicated the significance of shape and size analysis of corn plant canopies/density on population estimation [20]. In addition, high-resolution imagery has been employed to estimate wheat plant density at early stages in external studies. Thus, growth stage and time point should be considered during the plant density identification. Previous studies have primarily focused on agriculture plants, making this study the first implementation on plants within GSIs. Therefore, this study establishes a framework for estimating plant density within GSIs. These preliminary findings also provide an insight into the performing of future studies to collect additional UAV-images monthly and annually to monitor the real-time changes in plant growth and to identify the necessary proper maintenance plans for the GSIs.

3.3. NDVI for Plant Health

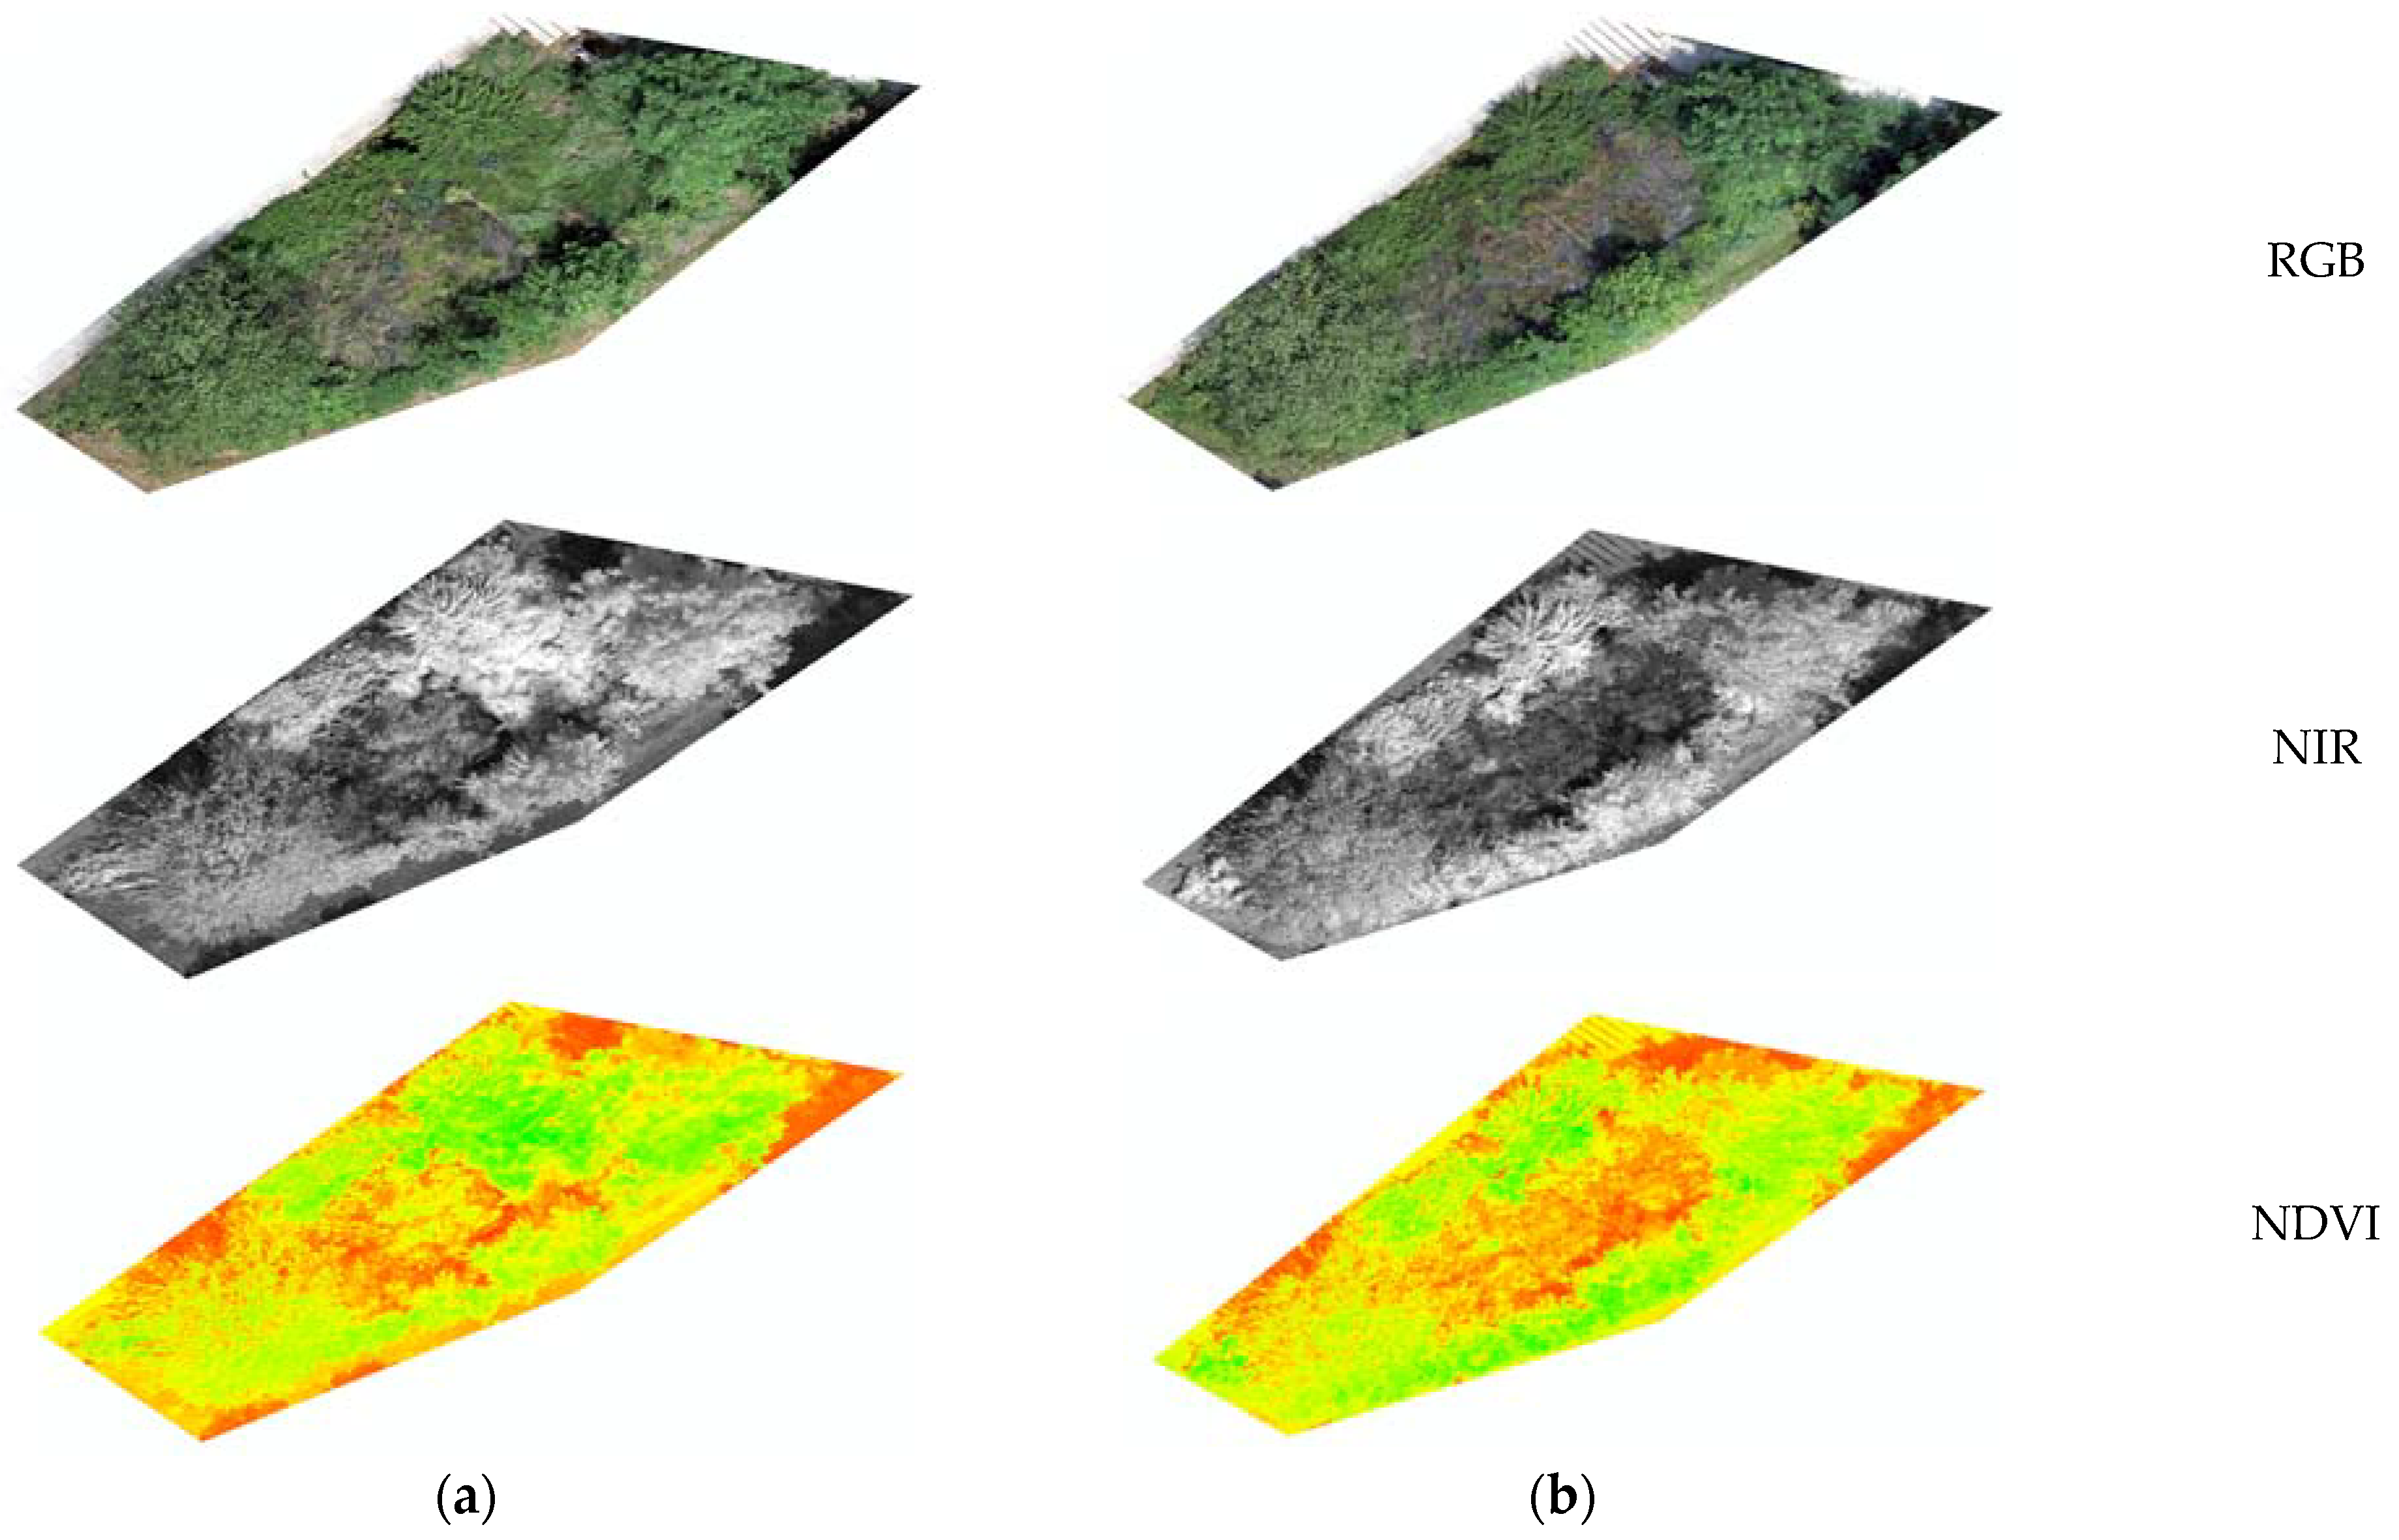
As presented in Table 3, this study determined NDVI values of plants within the GSIs using the multispectral images obtained from the UAV platform and categorized them into three plant-condition classes: excellent, good, and poor. This classification criterion was adopted, and color scale patterns were modified based on published resources [29,41]. The matching vegetation index color patterns at six levels depicted the three classes along the color scale ranging from −1.0 to 1.0. Additionally, minimal and maximal NDVI values were extracted and classified into classes, as detailed in Table 3. As shown in Figure 5, RGB and NIR images were processed and used to generate NDVI maps. NDVI maps of the bioretention behind the CBEIS building of MSU campus were analyzed for two different time points (May and June in 2021). In these NDVI maps, green represents healthy vegetation, yellow indicates senescent or declining vegetation, orange and brown represent soil and dead vegetation, and red denotes the areas with no vegetation such as water bodies or equipment. For further exploration of the condition of orange and red areas in GSIs where NDVI values were less than 0, it is essential to investigate the presence of long-standing water, as this is a crucial issue affecting GSI performance. The central area of red color in the NDVI map increased from May to June. This was attributed to increased rainfall events in summer leading to stagnant water in the pond in the center area of this bioretention. Stagnant water in a pond not only results in decreased levels of dissolved oxygen, but also fosters the growth of harmful organisms, deteriorates water quality, and adversely affects plant (or grass) health. This observation suggests the need to consider appropriate plants and to replace typical plant and grass in the central area of the GSIs.

3.4. Evaluation of Implementation in Additional Sites

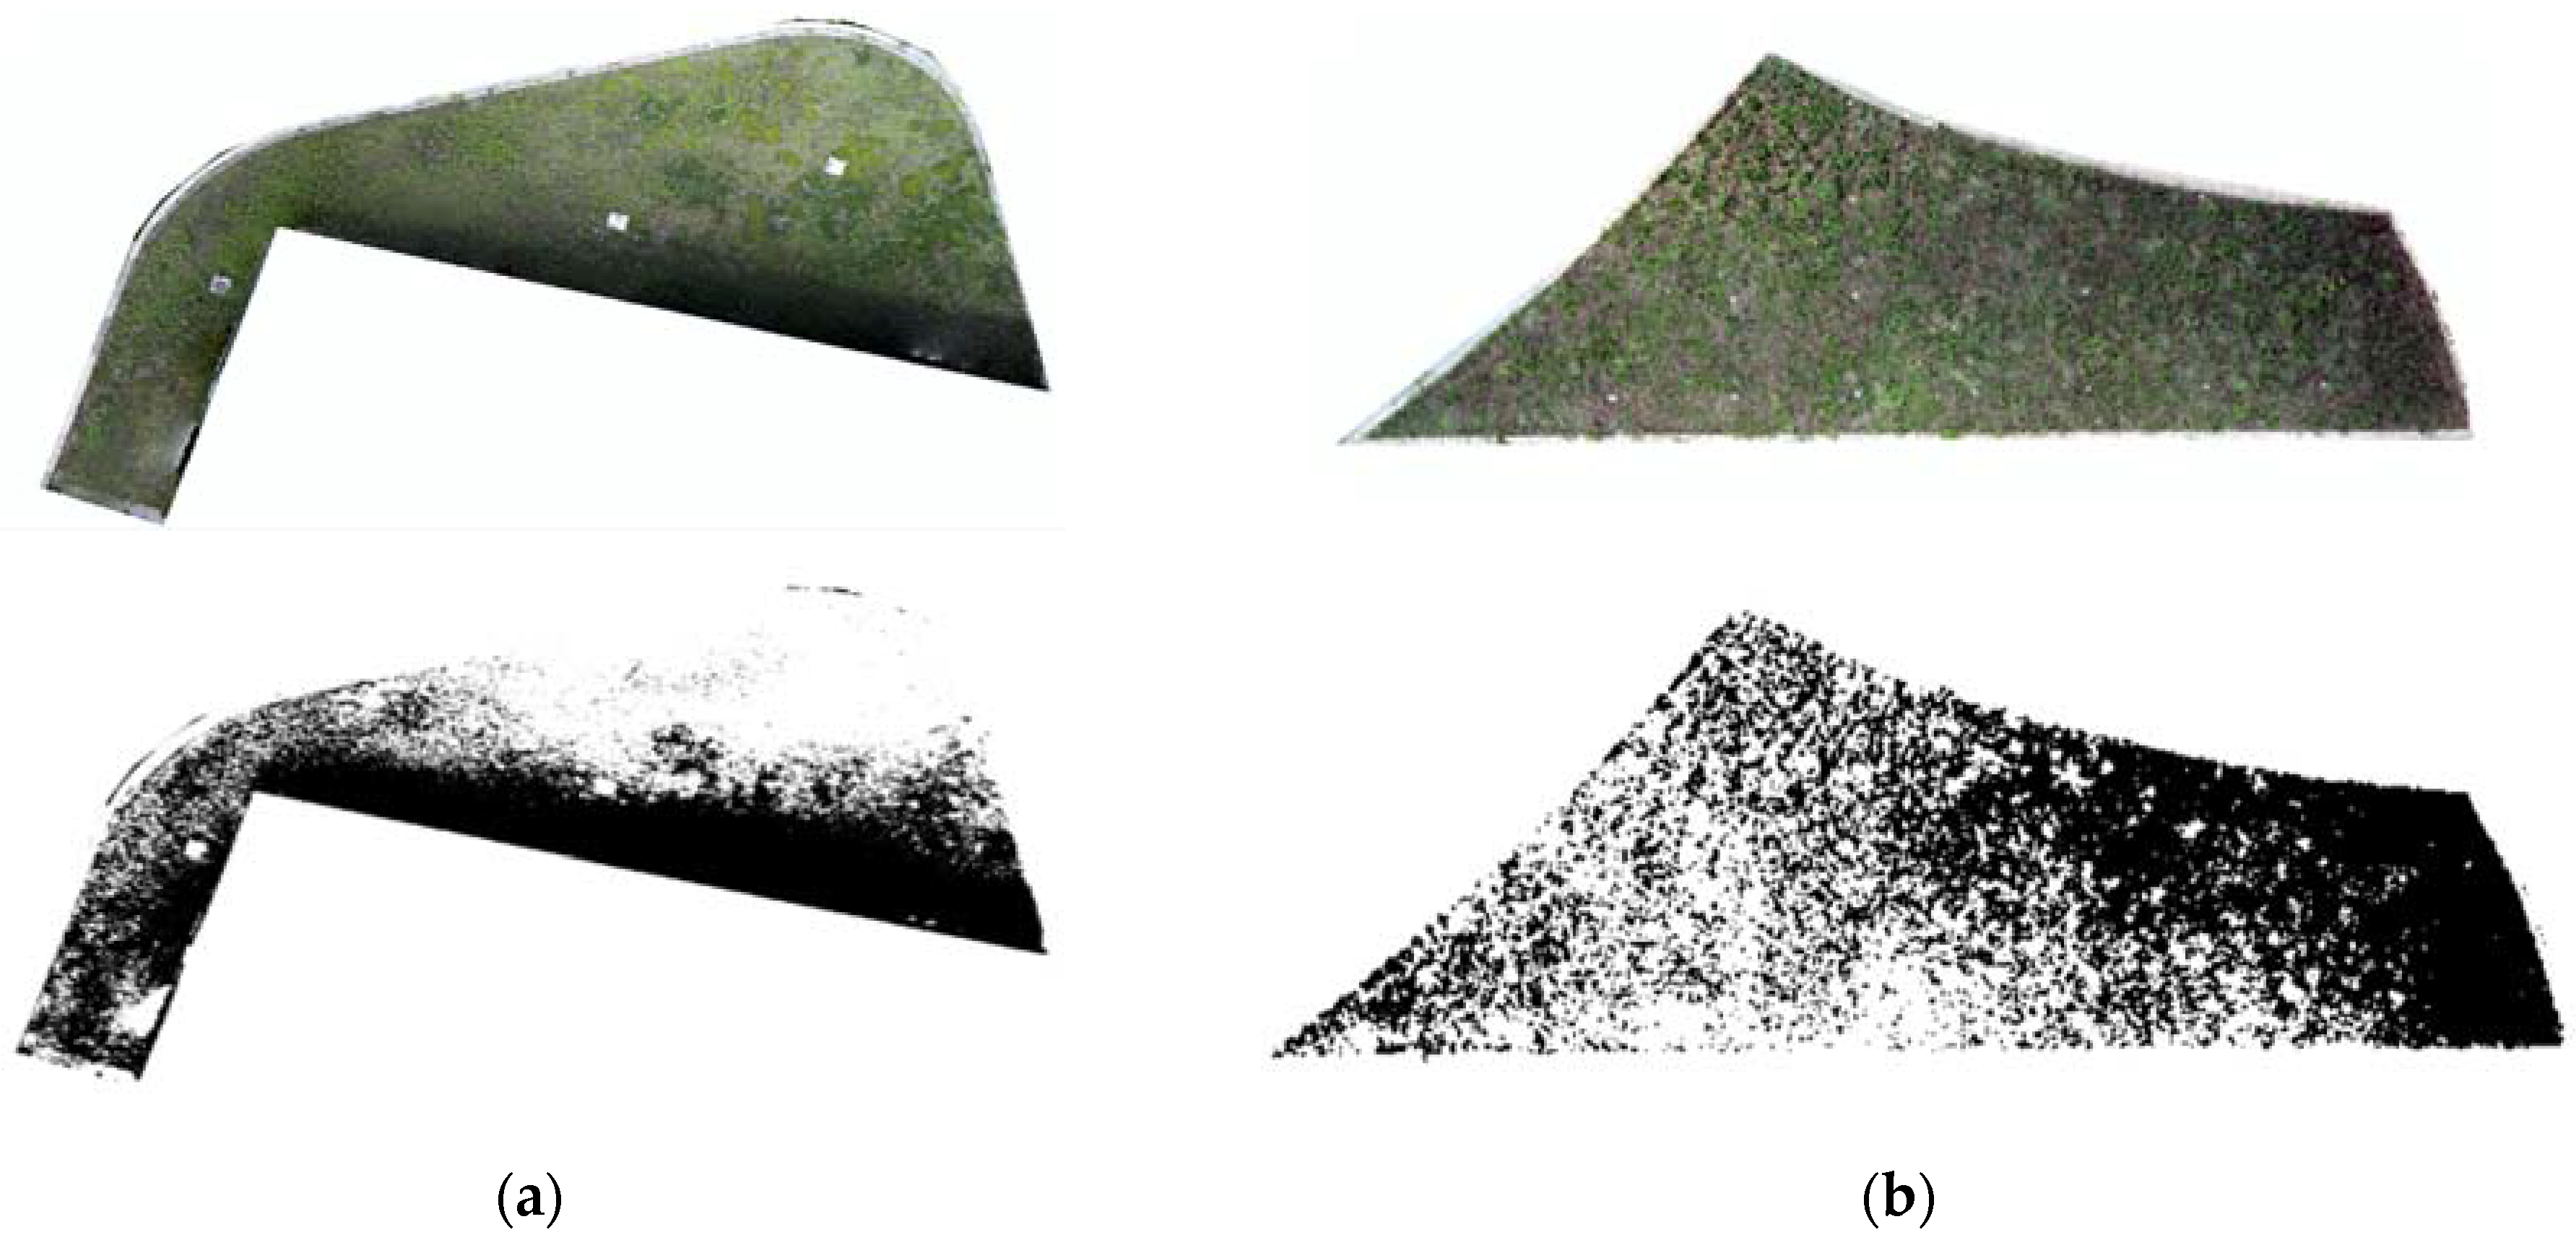
Based on the validated plant density identification and NDVI calculation methods, additional GSI sites, including the green roof of the library (ESRL) and the green roofs of the business school (GSBM) and Tyler Hall (CTTH) were evaluated and are presented in Figure 6 and Figure 7. The results indicated that plant density of the green roof in the library building was 72.76%, slightly lower than the bioretention of the CBEIS building (ranging from 75.30% to 74.51%). This variance can be attributed to the age of the GSIs; the green roof of the library was constructed in 2007, while the bioretention of CBEIS was constructed in 2012. In contrast, the green roof of the business school was built later than that of the CBEIS (in 2015). However, the plant density value (63.63%) was lower than the CBEIS bioretention, likely due to limited maintenance since its construction. Typically, the green roofs require extra maintenance, including watering, fertilizing, and weeding, to maintain proper plant coverage and functionality (e.g., thermal performance, environment, and air quality). Compared with the NDVI map of CBEIS (in Figure 5), MSU Tyler Hall (Figure 7) exhibits dark green and dense green areas. This observation leads to the conclusion that the MSU Tyler Hall (built in 2020) has more healthy plants. However, there was a significant area of yellow which likely represents soil or sideways. In Figure 7, this suggests the need to add additional plants in sections 2–5 compared with sections 1 and 6, and to increase the plant coverage areas to reduce the volume of stormwater discharges, reduce urban heat island effects, and improve air quality [42]. These results underscore that the age of a building, as well as proper maintenance, are crucial factors for achieving higher plant density and better plant health in the GSIs.

4. Conclusions

In this study, an integrated framework was developed and implemented to calculate plant density and evaluate the health of plants within GSIs in the MSU campus using UAV-based imagery. The DJI Phantom 4 Pro drone, equipped with (effectively) a 20-megapixel camera and a Survey3N NIR 12 MP camera were utilized to capture both UAV-based RGB and NIR images. Additionally, WebODM, ArcMap, PyCharm, and Canopeo were integrated into the framework for the evaluation process. The results indicated that the proposed programming codes successfully predicted plant density with relatively low errors and high R2 values. The plant density of components (e.g., trees, grass, soil, and unhealthy trees) as well as of entire bioretention and green-roof sites were evaluated. The NDVI results revealed that the CTTH had a higher NDVI value than the CBEIS, possibly due to its later construction and proper maintenance practices. Meanwhile, the lower plant density and NDVI values suggested the necessity for implementing a proper maintenance plan for the GSIs. Plant health is critical to mitigate stormwater runoff, control the floor, improve water quality, increase attractiveness of facilities to the public, and appreciate property values. This study demonstrated the potential of using this framework to calculate plant density and monitor the plant health using UAV imagery, providing a rapid and cost-effective tool for assessing the plant performance of the rapidly growing GSIs. In future studies, the effects of UAV-image collection height, building ages, and GSI types will be investigated and analyzed to further enhance the understanding of GSI dynamics.

Supplementary Materials

The following supporting information can be downloaded at: https://www.mdpi.com/article/10.3390/app14104118/s1, Programming code to predict the plant density and Figure S1: Selected subcomponents of GSIs. (a) Trees, (b) grass, (c) soil, and (d) unhealthy trees.

Author Contributions

J.G.H. coordinated projects and received grants from the Office of Technology Transfer (OTT) at Morgan State University (MSU); J.X. and J.G.H. reviewed published literature reviews and found the research gaps; J.X. collected, processed, and analyzed images; J.X. and X.Q. wrote the draft manuscript; J.G.H. and D.H.K. reviewed this manuscript and provided constructive comments and suggestions to improve the quality of article. All authors have read and agreed to the published version of the manuscript.

Funding

This research was partially funded by the Office of Technology Transfer (OTT) at Morgan State University (MSU), grant number I-GAP Award # OTT-STT-120.

Institutional Review Board Statement

Not applicable.

Informed Consent Statement

Not applicable.

Data Availability Statement

The original contributions presented in the study are included in the article/Supplementary Materials, further inquiries can be directed to corresponding author.

Acknowledgments

The author (Jingwen Xue) would like to acknowledge the Office of Technology Transfer (OTT) and the School of Graduate Studies (SGS) at Morgan State University (MSU) for providing a partial financial support for this study.

Conflicts of Interest

The authors declare no conflicts of interest.

References

  1. Heidari, B.; Randle, S.; Minchillo, D.; Jaber, F.H. Green stormwater infrastructure: A critical review of the barriers and solutions to widespread implementation. Wiley Interdiscip. Rev. Water 2023, 10, e1625. [Google Scholar] [CrossRef]
  2. Spahr, K.M.; Bell, C.D.; McCray, J.E.; Hogue, T.S. Greening up stormwater infrastructure: Measuring vegetation to establish context and promote cobenefits in a diverse set of US cities. Urban For. Urban Green. 2020, 48, 126548. [Google Scholar]
  3. Andersson, E.; McPhearson, T.; Kremer, P.; Gomez-Baggethun, E.; Haase, D.; Tuvendal, M.; Wurster, D. Scale and context dependence of ecosystem service providing units. Ecosyst. Serv. 2015, 12, 157–164. [Google Scholar] [CrossRef]
  4. Luan, B.; Yin, R.; Xu, P.; Wang, X.; Yang, X.; Zhang, L.; Tang, X. Evaluating Green Stormwater Infrastructure strategies efficiencies in a rapidly urbanizing catchment using SWMM-based TOPSIS. J. Clean. Prod. 2019, 223, 680–691. [Google Scholar] [CrossRef]
  5. Abhijith, K.V.; Kumar, P. Field investigations for evaluating green infrastructure effects on air quality in open-road conditions. Atmos. Environ. 2019, 201, 132–147. [Google Scholar] [CrossRef]
  6. Shafique, M.; Kim, R. Application of green blue roof to mitigate heat island phenomena and resilient to climate change in urban areas: A case study from Seoul, Korea. J. Water Land Dev. 2017, 33, 165. [Google Scholar] [CrossRef]
  7. Lemieux, C.; Bichai, F.; Boisjoly, G. Synergy between green stormwater infrastructure and active mobility: A comprehensive literature review. Sustain. Cities Soc. 2023, 99, 104900. [Google Scholar] [CrossRef]
  8. Ebrahimian, A.; Wilson, B.N.; Gulliver, J.S. Improved methods to estimate the effective impervious area in urban catchments using rainfall-runoff data. J. Hydrol. 2016, 536, 109–118. [Google Scholar] [CrossRef]
  9. Ebrahimian, A.; Gulliver, J.S.; Wilson, B.N. Estimating effective impervious area in urban watersheds using land cover, soil character and asymptotic curve number. Hydrol. Sci. J. 2018, 63, 513–526. [Google Scholar] [CrossRef]
  10. Nowak, D.J.; Crane, D.E.; Stevens, J.C. Air pollution removal by urban trees and shrubs in the United States. Urban For. Urban Green. 2006, 4, 115–123. [Google Scholar] [CrossRef]
  11. Wróblewska, K.; Jeong, B.R. Effectiveness of plants and green infrastructure utilization in ambient particulate matter removal. Environ. Sci. Eur. 2021, 33, 110. [Google Scholar] [CrossRef] [PubMed]
  12. Muerdter, C.P.; Wong, C.K.; LeFevre, G.H. Emerging investigator series: The role of vegetation in bioretention for stormwater treatment in the built environment: Pollutant removal, hydrologic function, and ancillary benefits. Environ. Sci. Water Res. Technol. 2018, 4, 592–612. [Google Scholar] [CrossRef]
  13. Vijayaraghavan, K.; Biswal, B.K.; Adam, M.G.; Soh, S.H.; Tsen-Tieng, D.L.; Davis, A.P.; Chew, S.H.; Tan, P.Y.; Babovic, V.; Balasubramanian, R. Bioretention systems for stormwater management: Recent advances and future prospects. J. Environ. Manag. 2021, 292, 112766. [Google Scholar] [CrossRef] [PubMed]
  14. Payne, E.G.; Pham, T.; Deletic, A.; Hatt, B.E.; Cook, P.L.; Fletcher, T.D. Which species? A decision-support tool to guide plant selection in stormwater biofilters. Adv. Water Resour. 2018, 113, 86–99. [Google Scholar] [CrossRef]
  15. Leveau, L.M.; Isla, F.I.; Bellocq, M.I. Predicting the seasonal dynamics of bird communities along an urban-rural gradient using NDVI. Landsc. Urban Plan. 2018, 177, 103–113. [Google Scholar] [CrossRef]
  16. Hunt, W.F.; Davis, A.P.; Traver, R.G. Meeting Hydrologic and Water Quality Goals through Targeted Bioretention Design. J. Environ. Eng. 2012, 138, 698–707. [Google Scholar] [CrossRef]
  17. Liu, S.; Baret, F.; Andrieu, B.; Burger, P.; Hemmerlé, M. Estimation of wheat plant density at early stages using high resolution imagery. Front. Plant Sci. 2017, 8, 739. [Google Scholar] [CrossRef] [PubMed]
  18. Liu, S.; Baret, F.; Allard, D.; Jin, X.; Andrieu, B.; Burger, P.; Hemmerlé, M.; Comar, A. A method to estimate plant density and plant spacing heterogeneity: Application to wheat crops. Plant Methods 2017, 13, 38. [Google Scholar] [CrossRef] [PubMed]
  19. Peng, J.; Rezaei, E.E.; Zhu, W.; Wang, D.; Li, H.; Yang, B.; Sun, Z. Plant Density Estimation Using UAV Imagery and Deep Learning. Remote Sens. 2022, 14, 5923. [Google Scholar] [CrossRef]
  20. Shrestha, D.S.; Steward, B.L. Shape and size analysis of corn plant canopies for plant population and spacing sensing. Appl. Eng. Agric. 2005, 21, 295–303. [Google Scholar] [CrossRef]
  21. Jayasuriya, N.; Guo, Y.; Hu, W.; Ghannoum, O. Machine vision-based plant height estimation for protected crop facilities. Comput. Electron. Agric. 2024, 218, 108669. [Google Scholar] [CrossRef]
  22. Velumani, K.; Lopez-Lozano, R.; Madec, S.; Guo, W.; Gillet, J.; Comar, A.; Baret, F. Estimates of maize plant density from UAV RGB images using faster-RCNN detection model: Impact of the spatial resolution. Plant Phenomics 2021, 2021, 9824843. [Google Scholar] [CrossRef] [PubMed]
  23. Bannari, A.; Morin, D.; Bonn, F.; Huete, A. A review of vegetation indices. Remote Sens. Rev. 1995, 13, 95–120. [Google Scholar] [CrossRef]
  24. Jackson, R.D.; Huete, A.R. Interpreting vegetation indices. Prevent. Vet. Med. 1991, 11, 185–200. [Google Scholar] [CrossRef]
  25. Davidson, C.; Jaganathan, V.; Sivakumar, A.N.; Czarnecki, J.M.P.; Chowdhary, G. NDVI/NDRE prediction from standard RGB aerial imagery using deep learning. Comput. Electron. Agric. 2022, 203, 107396. [Google Scholar] [CrossRef]
  26. Rouse, J.W., Jr.; Haas, R.H.; Schell, J.A.; Deering, D.W. Monitoring Vegetation Systems in the Great Plains with ERTS; NASA Special Publication: Greenbelt, MD, USA, 1974; pp. 309–317. [Google Scholar]
  27. Krishnaswamy, J.; Bawa, K.S.; Ganeshaiah, K.N.; Kiran, M.C. Quantifying and mapping biodiversity and ecosystem services: Utility of a multi-season NDVI based Mahalanobis distance surrogate. Remote Sens. Environ. 2009, 113, 857–867. [Google Scholar] [CrossRef]
  28. Martínez-Harms, M.J.; Balvanera, P. Methods for mapping ecosystem service supply: A review. Int. J. Biodivers. Sci. Ecosyst. Serv. Manag. 2012, 8, 17–25. [Google Scholar] [CrossRef]
  29. Mangewa, L.J.; Ndakidemi, P.A.; Alward, R.D.; Kija, H.K.; Bukombe, J.K.; Nasolwa, E.R.; Munishi, L.K. Comparative assessment of UAV and sentinel-2 NDVI and GNDVI for preliminary diagnosis of habitat conditions in Burunge wildlife management area, Tanzania. Earth 2022, 3, 769–787. [Google Scholar] [CrossRef]
  30. Xiang, T.Z.; Xia, G.S.; Zhang, L. Mini-unmanned aerial vehicle-based remote sensing: Techniques, applications, and prospects. IEEE Geosci. Remote Sens. Mag. 2019, 7, 29–63. [Google Scholar] [CrossRef]
  31. Shahbazi, M.; Théau, J.; Ménard, P. Recent applications of unmanned aerial imagery in natural resource management. GIScience Remote Sens. 2014, 51, 339–365. [Google Scholar] [CrossRef]
  32. Xiao, Q.; McPherson, E.G. Tree health mapping with multispectral remote sensing data at UC Davis, California. Urban Ecosyst. 2005, 8, 349–361. [Google Scholar] [CrossRef]
  33. Torresan, C.; Berton, A.; Carotenuto, F.; Di Gennaro, S.F.; Gioli, B.; Matese, A.; Miglietta, F.; Vagnoli, C.; Zaldei, A.; Wallace, L. Forestry applications of UAVs in Europe: A review. Int. J. Remote Sens. 2017, 38, 2427–2447. [Google Scholar] [CrossRef]
  34. Dimitrov, S.; Georgiev, G.; Georgieva, M.; Gluschkova, M.; Chepisheva, V.; Mirchev, P.; Zhiyanski, M. Integrated assessment of urban green infrastructure condition in Karlovo urban area by in-situ observations and remote sensing. One Ecosyst. 2018, 3, e21610. [Google Scholar] [CrossRef]
  35. Prettyman, K.; Babbar-Sebens, M.; Parrish, C.E.; Babbar-Sebens, J.M. A feasibility study of uninhabited aircraft systems for rapid and cost-effective plant stress monitoring at green stormwater infrastructure facilities. J. Hydroinformatics 2021, 23, 417–437. [Google Scholar] [CrossRef]
  36. DJI. Phantom 4 Pro/Pro+ User Manual; DJI, 2017. Available online: https://www.dji.com/phantom-4-pro/info (accessed on 1 May 2021).
  37. MAPIR. MAPIR Survey3 Quick Start Guide. 2017. Available online: https://cdn.shopify.com/s/files/1/0878/4732/files/MAPIR_Survey3_Manual_v1.pdf?12365009533491002433 (accessed on 1 May 2021).
  38. WebODM. (n.d.) WebODM Drone Mapping Software. OpenDroneMap. Available online: https://www.opendronemap.org/webodm/ (accessed on 12 June 2021).
  39. Zecevic, Z.; Popovic, T.; Krstajic, B. Cloud Based Solution for 22nd Automatic Image Mosaicking and Georeferencing. In Proceedings of the 22nd International Scientific-Professional Conference Information Technology; 2017. Available online: https://researchgate.net/publication/315839453 (accessed on 10 July 2022).
  40. Candiago, S.; Remondino, F.; De Giglio, M.; Dubbini, M.; Gattelli, M. Evaluating multispectral images and vegetation indices for precision farming applications from UAV images. Remote Sens. 2015, 7, 4026–4047. [Google Scholar] [CrossRef]
  41. Qian, X.; Xue, J.; Yang, Y.; Lee, S.W. Thermal Properties and Combustion-Related Problems Prediction of Agricultural Crop Residues. Energies 2021, 14, 4619. [Google Scholar] [CrossRef]
  42. Rainey, W.; McHale, M.; Arabi, M. Characterization of co-benefits of green stormwater infrastructure across ecohydrologic regions in the United States. Urban For. Urban Green. 2022, 70, 127514. [Google Scholar] [CrossRef]
Figure 1. Schematic diagram of framework for plant density and health identification.
Applsci 14 04118 g001
Figure 2. UAV-based RGB orthophoto of GSIs within Morgan State University campus.
Applsci 14 04118 g002
Figure 3. Plant density prediction for GSI components. (a) Trees, (b) grass, (c) soil, and (d) unhealthy trees. Note: Vegetation in white pixels, and other media in black pixels in Canopeo and Pycharm results.
Applsci 14 04118 g003
Figure 4. Plant density prediction of bioretention at MSU Campus.
Applsci 14 04118 g004aApplsci 14 04118 g004b
Figure 5. RGB, NIR, and NDVI maps of bioretention at CBEIS. (a) 27 May 2021 and (b) 28 June 2021.
Applsci 14 04118 g005
Figure 6. Plant density prediction. (a) Library building (72.76%) and (b) green roof of business building (63.63%).
Applsci 14 04118 g006
Figure 7. RGB, NIR, and NDVI maps of GSI in MSU Tyler Hall. In each map, 6 sections were divided by sideways. Section 1, section 2, section 3 (top row, left to right) while section 4, section 5, section 6 (bottom row, left to right).
Applsci 14 04118 g007
Table 1. Summary of GSIs at Morgan State University.
No.NameGSI TypeMD_North 1MD_East 1Year BuiltCoordinates (Latitude, Longitude)Collection Date (2021)
1CBEIS #1Bioretention187,162.20900436,344.28000201239.351953, −76.578343-
2CBEIS #2Bioretention187,113.57600436,268.57600201239.351518, −76.57922427 May/28 June
3CBEIS #3Bioretention187,230.99400436,342.13500201239.352573, −76.578364-
4CBEISGreen roof187,076.04700436,213.66600201239.351183, −76.5798633 September
5CBEISPermeable pavement187,224.81000436,334.30700201239.352517, −76.578455-
6CBEISOil/grit separator187,178.68400436,284.47300201239.352104, −76.579036-
7GSBMBioretention185,898.43700435,461.47700201539.340606, −76.588651-
8GSBMGreen roof185,956.83500435,517.33600201539.341130, −76.5880003 September
9BSSC 2 #1Micro-bioretention186,040.89000435,446.26600201739.341890, −76.588820-
10BSSC #2Micro-bioretention186,028.51900435,410.97700201739.341780, −76.589230-
11BSSC #3Micro-bioretention186,024.34600435,470.47900201739.341740, −76.588540-
12BSSCGreen roof186,009.97200435,483.47500201739.341610, −76.588390-
13LB 3Micro-bioretention186,020.65200435,617.57800201739.341701, −76.586834-
14ESRLGreen roof186,325.25200435,724.28700200739.344440, −76.5855803 September
15CTTHMicro-bioretentionN/AN/A2020N/A29 May
16CTTHRain gardenN/AN/A2020N/A-
17CTTHGreen roofN/AN/A2020N/A29 May
18COMM 4Pond186,716.92100435,964.39900200639.347958, −76.582774-
19COMMPermeable pavement186,824.20600435,978.10200200639.348924, −76.582609-
20AH 5Pond185,704.34600435,902.97700192239.338840, −76.583540-
1 Note: North and east are geographic points used to locate BMPs. Maryland requires the use of State Plane NAD 83 m for geographic location. Geographic Information Systems (GIS) can be used to provide these coordinates. 2 Behavioral Social Science Center (BSSC). 3 Legacy Bridge (LB). 4 School of Global Journalism & Communication (COMM). 5 Alumni House (AH).
Table 2. Summary of error estimations for GSI components. The number of each component (e.g., Tree1 vs. Tree2 vs. Tree3) of GSIs represents the different images collected at different regions. Threshold was used to identify pixels between plants and non-plants.
ComponentsCanopeo (%)Programming Code (%)ThresholdCategory
Tree196.5195.5040Tree
Tree269.9765.9070
Tree343.0942.1985
Grass194.6993.0350Grass
Grass2100.00100.0040
Grass395.8494.2030
Soil10.020.03105Soil
Soil22.512.65113
Soil34.054.49131
Unhealty_Tree10.140.13231Unhealthy tree
Unhealty_Tree25.474.96180
Unhealty_Tree30.790.80131
AAE = 0.080, ABE = 0.032, R2 = 0.958
Table 3. Ranges of NDVI values for plant conditions [25,29]. Two sets of colors and associated NDVI scales are used to precisely distinguish the plant health conditions of each class (excellent, good, and poor).
ClassesColorNDVI ScaleColorNDVI Scale
ExcellentApplsci 14 04118 i0010.67~1.00Applsci 14 04118 i0020.34~0.67
GoodApplsci 14 04118 i0030.00~0.34Applsci 14 04118 i0040.00~−0.34
PoorApplsci 14 04118 i005−0.34~−0.67Applsci 14 04118 i006−0.67~−1.00
Disclaimer/Publisher’s Note: The statements, opinions and data contained in all publications are solely those of the individual author(s) and contributor(s) and not of MDPI and/or the editor(s). MDPI and/or the editor(s) disclaim responsibility for any injury to people or property resulting from any ideas, methods, instructions or products referred to in the content.