Abstract
Currently, immersive virtual environments (IVE) are widely used in fields such as architecture and environmental psychology. These simulated environments allow for a detailed evaluation of how different designs impact users’ perception and interaction with the built environment, under controlled conditions and without incurring high costs. The validity of these IVEs is related to their capacity to evoke a participant’s response similar to that of the space they are simulating. This paper presents a validation study of a virtual classroom with two phases: the analysis of the sense of presence in the generated IVE and the comparison of the psychological and neurophysiological response of subjects in the two environments (physical vs. IVE). The psychological response captures cognitive processes via the performance of attention and memory tasks. The physiological response records the subject’s activity monitored via electroencephalogram, electrocardiogram, and electrodermal activity. The results showed that the psychological and physiological responses in both environments (physical vs. IVE) were similar. This may be of interest to architecture researchers and professionals as they validate IVE systems as tools to study the effects of the built environment on users’ cognitive responses.
1. Introduction
Immersive virtual environments (IVEs) are virtual reality environmental simulations reproduced using systems highly isolated from the physical environment; this isolation makes their users perceive they are not synthetic [1]. Their virtuality and accessibility [2] allow them to generate simulated spaces that can be dynamically altered based on their users’ responses [3]. This can be achieved under controlled conditions and in very environmentally [4] and economically sustainable ways [5]. This makes them powerful tools to assess users’ responses to a variety of stimuli not easily controllable in physical environments [6].
Very different domains have taken advantage of these capabilities. Above all, those in which the user’s interaction with his/her environment is important, such as medicine [7], product design [8], environmental design [9], and education [10]. Architectural design is no exception; IVEs allow researchers to investigate the responses of users to different design alternatives and, thus, facilitate decision making. Many studies have used these tools to incorporate users’ responses into architectural research [11,12,13].
Within the architectural field, the potential of applying the IVE to the design of spaces with different uses stands out [14,15,16]. In fieldwork, researchers often face challenges in modifying spaces to represent study variables or selecting diverse spaces to capture variable conditions. Both approaches have drawbacks; the first is costly and time-consuming, while the second may encounter methodological issues related to applying ceteris paribus logic. This logic involves identical designs with differing variables, necessitating a large sample of spaces. However, these limitations are overcome using IVEs. Furthermore, because of their level of experimental control, IVEs have been used to enhance attention in the absence of unexpected distractors [17], and it has been suggested that IVEs could improve the validity of measurements and treatments [18]. In fact, many studies have validated teaching IVEs for the assessment and rehabilitation of attention deficit hyperactivity disorder (ADHD) [6,19,20,21,22].
The advantages of IVE for research into architectural spaces are more evident for certain variables such as their geometry. However, more studies have analysed, for example, environmental variables such as temperature, air quality, acoustics, and lighting [23]. The complexity of modifying the geometry of physical spaces has had the consequence that it has been examined to a lesser extent [24], although several architectural studies have emphasised the importance of volume and, specifically, ceiling design [25].
Furthermore, IVEs are compatible with the simultaneous application of various physiological measurement devices to record users’ responses to simulated spaces. Thus, several physiological measures can contribute to the study of performance in teaching spaces. For example, electroencephalograms (EEG) [26,27], heart rate variability (HRV) [28], and electrodermal activity (EDA) [29] have proven effective in evaluating attention. Some authors have even suggested, given their greater experimental control, that the results of physiologically evaluating users with IVEs are more rigorous than those achieved in physical settings [18].
However, the application of immersive virtual environment (IVE) systems requires a critical evaluation of their validity. The question arises as to how closely simulations resemble the physical environments they seek to recreate. Numerous studies have addressed this issue via comparing the responses of subjects to simulated settings with their responses to physical settings.
In general, equivalence has been discovered in various types of settings for different psychological responses. For instance, self-report measures in a conference center [30] exhibited few statistically significant discrepancies between the ratings of the real and virtual buildings based on quantitative data. Similarly, studies conducted in offices [31,32] revealed no significant differences in the performance of tasks performed by participants between well-lit and dimly-lit conditions in both physical and IVE environments. Equivalence has also been observed in studies examining the estimation of dimensions in generic rooms [33] and in the biophilic hypothesis [34], which concluded that exposure to natural elements in IVE reduced negative mood to the same extent as exposure to natural elements in situ with a comparative study. However, the same effect was not observed for the tests of positive affect, visual working memory, and stress level. These findings suggest that virtual environments can be a valuable tool for psychological research, as they can provide a similar experience to that of physical environments.
Additionally, other studies have generated physiological responses in subjects that are similar to those obtained in corresponding physical environments [3]. For example, an investigation of an art museum [35] that utilised an electroencephalogram (EEG) and heart rate variability (HRV) analysed the psychophysiological patterns induced during the unguided exploration of the virtual and physical museums. The results indicated that IVEs are effective tools for evoking emotions, as most stimuli did not elicit significant differences in the affective statements reported by subjects compared to those evoked in physical environments. Other studies have employed electrodermal activity (EDA) and heart rate variability (HRV) in commercial settings [36]. These authors compared the psychological and physiological responses induced by simulated environments with those of a physical environment. The analysis showed that 360° panoramas provided the most similar-to-reality results according to the participants’ psychological responses, while virtual reality offered the closest resemblance to the physical environment based on physiological responses. Correlations were also observed between the sense of presence and both physiological and psychological responses. The participants’ pleasure was predicted using EDA phasic and the sense of presence using nHF-HRV. Furthermore, it is essential that IVEs are capable of inducing a high level of sense of presence in subjects [37]: that is, the extent to which a medium can create seemingly accurate representations of real-world objects, events, and individuals [38]. In conclusion, the validity of IVEs indicates that they are tools that provide results that can be applied to physical environments.
This study aims to compare the real and virtual environments via examining the psychological and physiological responses of participants. The goal is to establish the validity of immersive virtual environments (IVEs) for use in architecture and environmental psychology research. A classroom was selected as the IVE environment due to its activation of critical cognitive functions such as attention and memory and its relevance to architects and designers for potential design interventions.
2. Materials and Methods
The methodology consisted of a field study for the comparison of the simulated environment in two phases. In Phase I, the feeling of presence generated in the IVE was measured. Phase II was carried out in a physical classroom and in a laboratory. In this phase, the psychological responses (performance in an attention task and in a memory task) and neurophysiological responses (EEG, HRV, and EDA metrics) generated in a real university classroom and its IVE replica were compared. The IVE obtained as a result of the comparison is valid for use in architecture and environmental psychology studies to modify design conditions in a controlled and cost-effective manner. Figure 1 shows the general methodological outline.
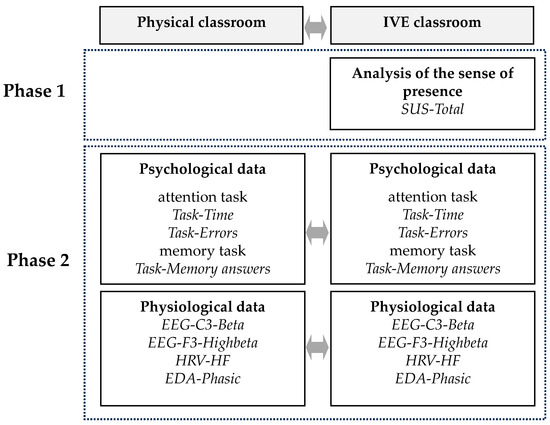
Figure 1.
General outline of the methodology.
2.1. Participants
This study had 52 participants (50% men and 50% women) with an average age of 23.06 years (σ = 3.392). Inclusion and exclusion criteria were established for recruitment. The inclusion criteria were: (1) being a university student; (2) being Spanish (to avoid possible cultural effects); and (3) being between 18 and 23 years old (the most common age range among university students in Spain). The exclusion criteria were: (1) having vision problems that were not corrected with contact lenses (to avoid the problems that glasses would cause in the IVE displays); (2) having formal education in art or fine art, having previous experience with virtual reality; and (3) having consumed performance-altering substances (such as caffeine) in the previous 24 h. All participants were recruited using a public announcement on the Polytechnic University of Valencia campus. None dropped out of the experiment during its course. Table 1 shows the general sequence that the participants followed.

Table 1.
General experimental sequence.
2.2. Stimuli
The IVE virtual replica of a representative physical classroom was taken as the base stimulus. Specifically, a classroom in the Higher Technical School of Building Engineering (ETSIE) at the Polytechnic University of Valencia. The classroom has dimensions of 16.50 m in length, 8.50 m in width, and 3.40 m in height. This results in a space with sufficient capacity for 96 students, seated at 4-seat tables arranged in 8 rows and 3 columns. All lighting is artificial (with 45 panels of 4 fluorescent tubes each) with no windows or transparent doors. Half of the participants took part in the physical classroom experiment and half of them viewed the replica IVE. Figure 2 shows the comparison between the two “classrooms”.
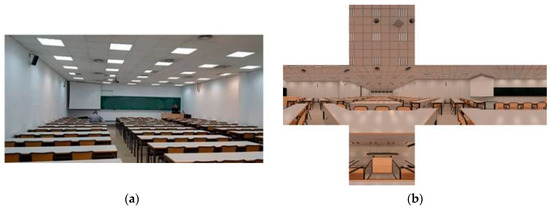
Figure 2.
Comparison of the physical classroom (a) and its IVE replica (b).
2.3. Environmental Simulation Set-Ups
The participants experienced the replica IVE via visual environmental simulations. Some aspects related to the development and the experiences of the simulations should be highlighted.
The simulations were developed via a process of modelling and rendering. The modelling was carried out using Rhinoceros (v.5.0), and the virtual implementation was undertaken using Unity3D (v5.6).
The HTC Vive device was used in the experiment. This is a head-mounted display (HMD) produced by HTC and Valve (www.vive.com). It has a resolution of 1080 × 1200 pixels per eye (2160 × 1200 in total), with a field of view of 110° and a refresh rate of 90 Hz. Figure 3 shows participants taking part in the experiment.

Figure 3.
Participants during the IVE experiment.
2.4. Data Analysis
The research protocol and the compilation-synchronization of the recordings were carried out using iMotions software (v.6.1). Psychological and physiological data were recorded for all participants, and they completed a basic demographic questionnaire.
The focus of the psychological data was on quantifying cognitive performance (attention and memory) and sense of presence.
Psychological attention task. The task was to react as soon as possible to a specific auditory stimulus (target) with a mouse click and avoid clicking the mouse when four other auditory stimuli were presented (distractors); the task is similar to the auditory continuous performance test [39]. The task was configured with 20% object stimuli (8 objects and 32 distractors); the minimum time between stimuli was 800 ms and the maximum was 1600 ms. The participants had 750 ms to react to the stimuli; the number of errors made (that is, reactions slower than the time limit or made to distractors) and reaction times were recorded (Task-Time and Task-Errors, respectively).
Psychological memory task. The psychological memory task involved a structured exercise that bore resemblance to the experimental setup of the Deese, Roediger, and McDermott (DRM) paradigm experiments [40]. Within this task, participants were instructed to commit to memory sets of words that were connected to a broader concept but were not directly presented as explicit words themselves. This memory exercise comprised a list of 15 words, and the retention performance was observed to be comparable to findings of previous research [41]. The presentation of the word lists was delivered orally with the utilization of Loquendo TTS 7 (www.loquendo.com). Each participant was tasked with listening to the provided word lists and subsequently repeating them accurately within a designated time frame of no more than 30 s before progressing to the subsequent word set. Each subject performed 3 memory tasks for each scenario (real and virtual), so 6 counterbalanced lists were chosen. After the test, the number of words that subjects remembered was quantified and corrected for the recall rate reported [41] for each word (Memory-Correct answers metric).
Presence. Sense of presence is the illusion of “being there” [42] in an environmental simulation. To quantify sense of presence, the participants completed the SUS (after the surname of its authors Slater, Usoh, and Steed; for further information see [43]) questionnaire. The questionnaire consists of six items, which assesses the user’s impression of three facets of the simulated environment: the participant’s immersion; the realism of the spatial experience; and the degree to which it is remembered as a space. The items are valued using a Likert-type scale from 1 to 7. The sum of the six questionnaire items (SUS-Total) was quantified.
Physiological data. These focused on quantifying complementary aspects related to the attention process. The metrics were based on EEG, HRV, and EDA recordings.
Electroencephalogram (EEG). EEGs measure variations in the electrical activity of the surface of the scalp [44]. In the present study, two metrics were calculated: the relative power (to reduce data variability between subjects; [45]) of the beta band (13–30 Hz) of the C3 electrode, which is associated with increased attention [46,47]; and the high-beta band (21–30 Hz), which is associated with alertness [48], specifically of electrode F3, since the left prefrontal lobe has concentration and working memory among its functions [49]. The means (EEG-C3-Beta and EEG-F3-Highbeta, respectively) were quantified during each experiment. The recordings were made using the b-Alert X10 device (www.advancedbrainmonitoring.com). The raw signal, sampled at 256 Hz, was pre-processed and analysed using the EEGLAB toolbox [50] via Matlab (v.2016a).
Heart rate variability (HRV). HRV measures variations in the intervals between heartbeats [51]. The present study analysed frequency to identify the high frequency, or HF, (0.04–0.15 Hz) of the signal, which is related to activation of the parasympathetic system [52] and attentional control [53]. The mean (HRV-HF) was quantified during each experiment. The recordings were, again, made using the b-Alert x10 device. The raw signal, sampled at 256 Hz, was pre-processed and analysed using the HRVAS toolbox (v.2014-03-21), via Matlab (v.2012a).
Electrodermal activity (EDA). EDA measures variations in the sweating of the skin [54]. The present study identified the phasic component of the signal, which is related to the sympathetic system [55] and attention paid to stimuli [56]. The mean (EDA-Phasic) was quantified during each experiment. The signal was recorded using the Shimmer 3GSR+ device (www.shimmersensing.com). The raw signal was pre-processed and analysed using Ledalab (v.3.4.8), via Matlab (v.2016a).
The physiological metrics were all normalised based on the values obtained for the baselines ().
2.5. Statistical Analysis
Statistical analyses were carried out on the anonymised database (Table 2). IBM SPSS v.26.0 was used.
Table 2.
Statistical treatments.
3. Results
The statistical analysis of the data produced the following results.
3.1. Phase 1: Analysis of Level of Sense of Presence
The average levels of the sense of presence per participant (based on the SUS questionnaire) for the environmental simulation were obtained. It consists of six items, which are rated on a Likert scale from 1 (completely disagree) to 7 (completely agree). Taken together, the six items address three aspects of the sense of presence: being inside the simulation; regarding the simulation as real; and remembering the simulation as a place.
Table 3 presents a comprehensive overview of the average scores and standard deviations derived from the SUS questionnaire for each individual item.
Table 3.
Means and standard deviations provided by the SUS questionnaire for each item.
The average of the set of items is 4.93 out of 7. The highest rated item (5.33) is “I had a sense of “being there” in the classroom space”, and, on the other hand, the lowest rated item (4.07) is “I think of the classroom space as a place similar to other places that I’ve been today”.
The mean value of the SUS-Total was 29.6. Taking into account the results obtained by studies that used similar technologies [57], the IVE was considered satisfactory.
3.2. Phase 2: Analysis of the Similarity between the Physical Experiment and the IVE
The statistical treatment for this analysis depends on the normality of data for each variable. The Kolmogorov–Smirnov (K–S) test was used to assess the normality of the data. As the Task-Time variable follows a normal distribution (K–S test, p > 0.05), an ANOVA was applied. Due to the non-normality of data for the other variables (K–S test, p < 0.05), the Mann–Whitney test was used. The effect sizes were reported with partial eta squared (η2p). The results show that there were no significant differences in cognitive performance and physiological response. Table 4 and Table 5 present the results of the statistical analysis, showing the test statistic value and the obtained p-value.
Table 4.
Statistical differences in attention and memory performance.
Table 5.
Statistical differences in physiological response.
4. Discussion
This paper analyses the validity of IVE in terms of its capacity to evoke a similar (psychological and physiological) response to that generated by physical space. A classroom is selected as the IVE environment since it is a space in which important cognitive processes are activated, such as attention and memory, and it is a space of interest for architects and designers due to its potential design interventions. In general, IVEs can help architects make better design decisions. They can provide a more comprehensive understanding of physical environments, human interaction, and user needs. This seamless integration of technology not only empowers architects but also fosters effective communication between clients and design professionals, ultimately contributing to the refinement and optimization of architectural projects.
This study validates the use of IVEs as effective tools for visualizing environments that act as stimuli in studies related to environmental psychology and architecture. These virtual environments not only allow for a precise and detailed representation of different spaces, but they also make it possible to collect the simultaneous responses of subjects related to their interaction and perception of these environments.
With a validated IVE, researchers could analyse a wide range of design configurations in a controlled and relatively low-cost manner. This is especially advantageous as it provides the opportunity to explore diverse environmental and architectural design variables without the inherent restrictions of experimentation in real-world physical spaces. This advance represents an important milestone in this field, as until now most studies that have analysed the impact of classroom design variables on student performance have been conducted primarily in conventional physical environments [15,58]. However, these stimuli have certain limitations that could affect the accuracy and breadth of the results obtained.
Despite the power of these visualization tools, there is a scarcity of studies that compare human responses in real and IVEs [3,30,32], especially in relation to psychophysiological responses; these studies are necessary.
This study proposes an experimental protocol to compare a real and virtual environment via collecting psychological and physiological responses in combination with the sense of presence, based on the visualization of an IVE scenario in head-mounted displays (HMD).
Three issues stand out from this experimental protocol. Firstly, it is essential to measure the physiological response, as cognitive-emotional states are characterised by both psychological and physiological responses [59]. It should be noted that although several works have studied the use of IVE systems in the assessment of subjects’ cognitive performance [17,22,60], there are fewer studies that have analysed IVE and physiological responses, such as EEG, HRV, and EDA [61,62,63].
Secondly, it is important that IVEs can generate a high level of sense of presence in subjects [11,37]. Although this system is questioned in terms of its reliability and inability to provide real-time information [64], it plays an important role in studies on environmental psychology and architecture. It is a fast and low-cost system that allows for the validation of multiple design configurations, which is hardly achievable with real vs. virtual comparison. Thus, there would be a dual validation system: initially, the starting scenario is validated using real vs. virtual comparison, and subsequently, each design configuration, hardly transferable to physical space, is validated using the presence test.
Thirdly, the utilised support, the HMDs, is crucial. These provide fully immersive systems that isolate the user from stimuli in the external world. Additionally, some studies demonstrate that emotional content enhances the sense of presence in an IVE [65], and that, when exposed to the same content, the self-reported intensity of emotion is significantly higher in immersive environments than in non-immersive ones [66]. Therefore, IVEs, which showcase 360° panoramas or 3D scenarios using an HMD [67], are powerful tools for psychological research.
Finally, in relation to the limitations of this study, it is worth noting that there is currently a wide range of HMDs available on the market. Some of these HMDs, with more limited capabilities, such as resolution, field of view, and refresh rate, may provide lower levels of accuracy. This suggests that their use should be undertaken with caution. However, the ongoing advances in HMD technology suggest that this problem will be overcome in the near future. This study also presents as a limitation the choice of only one point of view within the classroom (the center of the second row of tables). This could have included a position-related effect. An experimental approach with different positions could have reduced this effect, but it would have required a larger sample of participants. Another limitation of this study is that the subjects of the experiment were all university students. Therefore, the results are limited to this specific demographic group. Given that the demographic characteristics of the subjects could affect their previous experience and adaptability to HMDs and their resulting responses, additional experiments would be needed to generalise the findings of this study to other demographic groups.
5. Conclusions
The results of this study provide strong support for the use of IVEs as tools for research, training, and education. IVEs offer a number of advantages over traditional methods, such as their ability to provide a precise and detailed representation of environments, their ability to collect data on subjects’ interaction and perception of these environments, and their ability to be used to create immersive and engaging experiences.
Furthermore, the practical potential of IVEs makes them versatile and suitable tools for the study and design of classrooms, aiming to enhance student’ attention and memory performance. Their ability to simulate educational contexts in an immersive and realistic manner provides researchers and professionals with an invaluable tool to better understand the factors influencing attention memory and learning in educational settings. Consequently, the results of this study can directly benefit those involved in the design and planning of educational centers, providing them with fundamental insights to optimise the layout and design of classrooms. Likewise, they can be highly valuable for researchers dedicated to studying the physiological bases of how physical spaces affect students’ attention, memory, and cognitive performance.
Author Contributions
Conceptualization, C.L., J.L.H.-T. and A.M.; methodology, C.L., J.L.H.-T. and A.M.; software, C.L. and J.L.H.-T.; validation, C.L., J.L.H.-T. and A.M.; formal analysis, C.L. and J.L.H.-T.; investigation, C.L., J.L.H.-T. and A.M.; resources, C.L., J.L.H.-T. and A.M.; data curation, C.L. and J.L.H.-T.; writing—original draft preparation, C.L., J.L.H.-T. and A.M.; writing—review and editing, C.L., J.L.H.-T. and A.M.; visualisation, C.L., J.L.H.-T. and A.M.; supervision, C.L.; project administration, C.L.; funding acquisition, C.L. All authors have read and agreed to the published version of the manuscript.
Funding
This research was funded by Generalitat Valenciana (Conselleria de Innovación, Universidades, Ciencia y Sociedad Digital de la Generalitat), grant number CIAICO/2022/031.
Institutional Review Board Statement
The study was conducted according to the guidelines of the Declaration of Helsinki and approved by the Institutional Review Board of the Universitat Politècnica de València (P1_25_07_18; 25 July 2018).
Informed Consent Statement
Informed consent was obtained from all subjects involved in the study.
Data Availability Statement
The data presented in this study are available on request from the corresponding author. The data are not publicly available due to the risk that disclosure could jeopardize the privacy of the individuals involved in the study.
Conflicts of Interest
The authors declare no conflicts of interest.
References
- Smith, J.W. Immersive Virtual Environment Technology to Supplement Environmental Perception, Preference and Behavior Research: A Review with Applications. Int. J. Environ. Res. Public Health. 2015, 12, 11486–11505. [Google Scholar] [CrossRef] [PubMed]
- Parsons, T.D. Virtual Reality for enhanced ecological validity and experimental control in the clinical, affective and social neurosciences. Front. Hum. Neurosci. 2015, 9, 660. [Google Scholar] [CrossRef] [PubMed]
- Yeom, D.; Choi, J.H.; Kang, S.H. Investigation of the physiological differences in the immersive virtual reality environment and real indoor environment: Focused on skin temperature and thermal sensation. Build. Environ. 2019, 154, 44–54. [Google Scholar] [CrossRef]
- Rose, D.; Foreman, N. Virtual Reality. Psychologist 1999, 12, 550–554. [Google Scholar] [CrossRef]
- Moscoso, C.; Matusiak, B.; Svensson, U.P.; Orleanski, K. Analysis of stereoscopic images as a new method for daylighting studies. ACM Trans. Appl. Percept. 2015, 11, 21. [Google Scholar] [CrossRef]
- Alamirah, H.; Schweiker, M.; Azar, E. Immersive virtual environments for occupant comfort and adaptive behavior research–A comprehensive review of tools and applications. Build Environ. 2022, 207, 108396. [Google Scholar] [CrossRef]
- Gloy, K.; Weyhe, P.; Nerenz, E.; Kaluschke, M.; Uslar, V.; Zachmann, G.; Weyhe, D. Immersive anatomy atlas: Learning factual medical knowledge in a virtual reality environment. Anat. Sci. Educ. 2022, 15, 360–368. [Google Scholar] [CrossRef]
- Ye, J.; Badiyani, S.; Raja, V.; Schlegel, T. Applications of virtual reality in product design evaluation. In Human-Computer Interaction. HCI Applications and Services: 12th International Conference, HCI International 2007, Beijing, China, 22–27 July 2007, Proceedings, Part IV 12; Jacko, J.A., Ed.; Springer: Berlin, Germany, 2007; pp. 1190–1199. [Google Scholar]
- Tea, S.; Panuwatwanich, K.; Ruthankoon, R.; Kaewmoracharoen, M. Multiuser immersive virtual reality application for real-time remote collaboration to enhance design review process in the social distancing era. J. Eng. Des. Technol. 2022, 20, 281–298. [Google Scholar] [CrossRef]
- Radianti, J.; Majchrzak, T.A.; Fromm, J.; Wohlgenannt, I. A systematic review of immersive virtual reality applications for higher education: Design elements, lessons learned, and research agenda. Comput. Educ. 2020, 147, 103778. [Google Scholar] [CrossRef]
- Prabhakaran, A.; Mahamadu, A.M.; Mahdjoubi, L. Understanding the challenges of immersive technology use in the architecture and construction industry: A systematic review. Autom. Constr. 2022, 137, 104228. [Google Scholar] [CrossRef]
- Azarby, S.; Rice, A. Understanding the effects of virtual reality system usage on spatial perception: The Potential impacts of immersive virtual reality on spatial design decisions. Sustainability 2022, 14, 10326. [Google Scholar] [CrossRef]
- Zhang, Y.; Liu, H.; Kang, S.C.; Al-Hussein, M. Virtual reality applications for the built environment: Research trends and opportunities. Autom. Constr. 2020, 118, 103311. [Google Scholar] [CrossRef]
- Choi, H.H.; Van Merriënboer, J.J.; Paas, F. Effects of the physical environment on cognitive load and learning: Towards a new model of cognitive load. Educ. Psychol. Rev. 2014, 26, 225–244. [Google Scholar] [CrossRef]
- Marchand, G.C.; Nardi, N.M.; Reynolds, D.; Pamoukov, S. The impact of the classroom built environment on student perceptions and learning. J. Environ. Psychol. 2014, 40, 187–197. [Google Scholar] [CrossRef]
- Suleman, Q.; Hussain, I. Effects of classroom physical environment on the academic achievement scores of secondary school students in Kohat Division, Pakistan. Int. J. Learn. Dev. 2014, 4, 71–82. [Google Scholar] [CrossRef]
- Cho, B.H.; Ku, J.; Jang, D.P.; Kim, S.; Lee, Y.H.; Kim, I.Y.; Lee, J.H.; Kim, S.I. The effect of virtual reality cognitive training for attention enhancement. CyberPsychology Behav. 2002, 5, 129–137. [Google Scholar] [CrossRef]
- Rizzo, A.A.; Schultheis, M.; Kerns, K.A.; Mateer, C. Analysis of assets for virtual reality applications in neuropsychology. Neuropsychol. Rehabil. 2004, 14, 207–239. [Google Scholar] [CrossRef]
- Adams, R.; Finn, P.; Moes, E.; Flannery, K.; Rizzo, A.S. Distractibility in attention/deficit/hyperactivity disorder (ADHD): The virtual reality classroom. Child Neuropsychol. 2009, 15, 120–135. [Google Scholar] [CrossRef]
- Parsons, T.D.; Bowerly, T.; Buckwalter, J.G.; Rizzo, A.A. A controlled clinical comparison of attention performance in children with ADHD in a virtual reality classroom compared to standard neuropsychological methods. Child Neuropsychol. 2007, 13, 363–381. [Google Scholar] [CrossRef]
- Parsons, T.D.; Rizzo, A.A.; Rogers, S.; York, P. Virtual reality in paediatric rehabilitation: A review. Dev. Neurorehabil. 2009, 12, 224–238. [Google Scholar] [CrossRef]
- Rizzo, A.A.; Buckwalter, J.G.; Bowerly, T.; Van Der Zaag, C.; Humphrey, L.; Neumann, U.; Sisemore, D. The virtual classroom: A virtual reality environment for the assessment and rehabilitation of attention deficits. CyberPsychology Behav. 2000, 3, 483–499. [Google Scholar] [CrossRef]
- Barrett, P.; Davies, F.; Zhang, Y.; Barrett, L. The impact of classroom design on pupils’ learning: Final results of a holistic, multi-level analysis. Build. Environ. 2015, 89, 118–133. [Google Scholar] [CrossRef]
- Yang, Z.; Becerik-Gerber, B.; Mino, L. A study on student perceptions of higher education classrooms: Impact of classroom attributes on student satisfaction and performance. Build. Environ. 2013, 70, 171–188. [Google Scholar] [CrossRef]
- Vartanian, O.; Navarrete, G.; Chatterjee, A.; Fich, L.B.; Gonzalez-Mora, J.L.; Leder, H.; Modroño, C.; Nadal, M.; Rostrup, N.; Skov, M. Architectural design and the brain: Effects of ceiling height and perceived enclosure on beauty judgments and approach-avoidance decisions. J. Environ. Psychol. 2015, 41, 10–18. [Google Scholar] [CrossRef]
- Ghassemi, F.; Moradi, M.H.; Doust, M.T.; Abootalebi, V. Classification of sustained attention level based on morphological features of EEG’s independent components. In Proceedings of the 2009 ICME International Conference on Complex Medical Engineering, Tempe, AZ, USA, 9–11 April 2009; pp. 1–6. [Google Scholar]
- Liu, Y.; Sourina, O.; Nguyen, M.K. Real-time EEG-based emotion recognition and its applications. In Transactions on Computational Science XII: Special Issue on Cyberworlds; Gavrilova, M.L., Kenneth Tan, C.J., Sourin, A., Sourina, O., Eds.; Springer: Heidelberg, Germany, 2011; pp. 256–277. [Google Scholar]
- Artífice, A.; Ferreira, F.; Marcelino-Jesus, E.; Sarraipa, J.; Jardim-Gonçalves, R. Student’s attention improvement supported by physiological measurements analysis. In Proceedings of the 8th IFIP WG 5.5/SOCOLNET Advanced Doctoral Conference on Computing, Electrical and Industrial Systems, DoCEIS 2017, Costa de Caparica, Portugal, 3–5 May 2017; Camarinha-Matos, L., Parreira-Rocha, M., Ramezani, J., Eds.; Springer: Costa de Caparica, Portugal, 2017; pp. 93–102. [Google Scholar]
- Sakai, T.; Tamaki, H.; Ota, Y.; Egusa, R.; Inagaki, S.; Kusunoki, F.; Mizoguchi, H. EDA-based estimation of visual attention by observation of eye blink frequency. Int. J. Smart Sens. Intell. Syst. 2017, 10, 296–307. [Google Scholar] [CrossRef]
- Kuliga, S.; Thrash, T.; Dalton, R.; Hölscher, C. Virtual reality as an empirical research tool—Exploring user experience in a real building and a corresponding virtual model. Comput. Environ. Urban Syst. 2015, 54, 363–375. [Google Scholar] [CrossRef]
- Chamilothori, K.; Chinazzo, G.; Rodrigues, J.; Dan-Glauser, E.; Wienold, J.; Andersen, M. Subjective and physiological responses to façade and sunlight pattern geometry in virtual reality. Build. Environ. 2019, 150, 144–155. [Google Scholar] [CrossRef]
- Heydarian, A.; Carneiro, J.P.; Gerber, D.; Becerik-Gerber, B.; Hayes, T.; Wood, W. Immersive virtual environments versus physical built environments: A benchmarking study for building design and user-built environment explorations. Autom. Constr. 2015, 54, 116–126. [Google Scholar] [CrossRef]
- Loyola, M. The influence of the availability of visual cues on the accurate perception of spatial dimensions in architectural virtual environments. Virtual Real. 2018, 22, 235–243. [Google Scholar] [CrossRef]
- Emamjomeh, A.; Zhu, Y.; Beck, M. The potential of applying immersive virtual environment to biophilic building design: A pilot study. J. Build. Eng. 2020, 32, 101481. [Google Scholar] [CrossRef]
- Marín-Morales, J.; Higuera-Trujillo, J.L.; Greco, A.; Guixeres, J.; Llinares, C.; Gentili, C.; Pasquale, E.; Alcañiz, M.; Valenza, G. Real vs. immersive-virtual emotional experience: Analysis of psycho-physiological patterns in a free exploration of an art museum. PLoS ONE 2019, 14, e0223881. [Google Scholar] [CrossRef] [PubMed]
- Higuera-Trujillo, J.L.; López-Tarruella, J.; Llinares Millán, C. Psychological and physiological human responses to simulated and real environments: A comparison between Photographs, 360° Panoramas, and Virtual Reality. Appl. Ergon. 2017, 65, 398–409. [Google Scholar] [CrossRef] [PubMed]
- Kooi, F.L.; Toet, A. Visual comfort of binocular and 3D displays. Displays 2004, 25, 99–108. [Google Scholar] [CrossRef]
- Lombard, M.; Ditton, T. At the heart of it all: The concept of presence. J. Comput. Commun. 1997, 3, JCMC321. [Google Scholar] [CrossRef]
- Seidman, L.J.; Breiter, H.C.; Goodman, J.M.; Goldstein, J.M.; Woodruff, P.W.; O’Craven, K.; Rosen, B.R.; Tsuang, M.T.; Rosen, B.R. A functional magnetic resonance imaging study of auditory vigilance with low and high information processing demand. Neuropsychology 1998, 12, 505–518. [Google Scholar] [CrossRef] [PubMed]
- Beato, M.S.; Díez, E. False recognition production indexes in Spanish for 60 DRM lists with three critical words. Behav. Res. Methods. 2011, 43, 499–507. [Google Scholar] [CrossRef][Green Version]
- Alonso, M.Á.; Fernández, Á.; Díez, E.; Beato, M.S. Índices de producción de falso recuerdo y falso reconocimiento para 55 listas de palabras en castellano. Psicothema 2004, 16, 357–362. [Google Scholar][Green Version]
- Steuer, J. Defining Virtual Reality: Dimensions determining telepresence. J. Commun. 1992, 42, 73–93. [Google Scholar] [CrossRef]
- Slater, M.; Usoh, M.; Steed, A. Depth of Presence in virtual environments. Presence Teleoperators Virtual Environ. 1994, 3, 130–144. [Google Scholar] [CrossRef]
- Niedermeyer, E.; da Silva, F.L. Electroencephalography: Basic Principles, Clinical Applications, and Related Fields; Lippincott Williams & Wilkins: Philadelphia, PA, USA, 2005. [Google Scholar]
- Knyazev, G.G.; Savostyanov, A.N.; Levin, E.A. Alpha oscillations as a correlate of trait anxiety. Int. J. Psychophysiol. 2004, 53, 147–160. [Google Scholar] [CrossRef]
- Fuchs, T.; Birbaumer, N.; Lutzenberger, W.; Gruzelier, J.H.; Kaiser, J. Neurofeedback treatment for attention-deficit/hyperactivity disorder in children: A comparison with methylphenidate. Appl. Psychophysiol. Biofeedback 2003, 28, 1–12. [Google Scholar] [CrossRef] [PubMed]
- Egner, T.; Gruzelier, J.H. Learned self-regulation of EEG frequency components affects attention and event-related brain potentials in humans. Neuroreport 2011, 12, 4155–4159. [Google Scholar] [CrossRef] [PubMed]
- Marzbani, H.; Marateb, H.R.; Mansourian, M. Neurofeedback: A Comprehensive Review on System Design, Methodology and Clinical Applications. Basic Clin. Neurosci. 2016, 7, 143–158. [Google Scholar] [PubMed]
- Demos, J.N. Getting Started with Neurofeedbac; W.W. Norton & Company, Inc.: New York, NY, USA, 2005. [Google Scholar]
- Delorme, A.; Makeig, S. EEGLAB: An open source toolbox for analysis of single-trial EEG dynamics including independent component analysis. J. Neurosci. Methods. 2004, 134, 9–21. [Google Scholar] [CrossRef] [PubMed]
- Goldman, M. Principles of Clinical Electrocardiography; LANGE: Los Altos, CA, USA, 1976. [Google Scholar]
- Berntson, G.G.; Bigger, J.T.; Eckberg, D.L.; Grossman, P.; Kaufmann, P.G.; Malik, M. Heart rate variability: Origins, methods, and interpretive caveats. Psychophysiology 1997, 34, 623–648. [Google Scholar] [CrossRef] [PubMed]
- Ramírez, E.; Ortega, A.R.; Reyes Del Paso, G. Anxiety, attention, and decision making: The moderating role of heart rate variability. Int. J. Psychophysiol. 2015, 98, 490–496. [Google Scholar] [CrossRef] [PubMed]
- Boucsein, W. Electrodermal Activity, 2nd ed.; Springer Science & Business Media: Newsbury Park, CA, USA; London, UK; New Dehli, India, 2012. [Google Scholar]
- Braithwaite, J.J.; Watson, D.G.; Jones, R.; Rowe, M. A guide for analysing electrodermal activity (EDA) & skin conductance responses (SCRs) for psychological experiments. Psychophysiology 2013, 49, 1017–1034. [Google Scholar]
- Raskin, D.C. Attention and arousal. In Electrodermal Activity in Psychological Research; Prokasy, W.F., Raskin, D.C., Eds.; Academic Press: London, UK, 1973; pp. 123–156. [Google Scholar]
- Slater, M.; Steed, A. A Virtual Presence Counter. Presence Teleoperators Virtual Environ. 2000, 9, 413–434. [Google Scholar] [CrossRef]
- Hygge, S.; Knez, I. Effects of noise, heat and indoor lighting on cognitive performance and self-reported affect. J. Environ. Psychol. 2001, 21, 291–299. [Google Scholar] [CrossRef]
- Izard, C.E. Basic emotions, relations among emotions, and emotion-cognition relations. Psychol. Rev. 1992, 99, 561–565. [Google Scholar] [CrossRef]
- Baceviciute, S.; Terkildsen, T.; Makransky, G. Remediating Learning from Non-immersive to Immersive Media: Using EEG to Investigate the Effects of Environmental Embeddedness on Reading in Virtual Reality. Comput. Educ. 2021, 164, 104122. [Google Scholar] [CrossRef]
- Hildebrandt, L.K.; Mccall, C.; Engen, H.G.; Singer, T. Cognitive flexibility, heart rate variability, and resilience predict fine-grained regulation of arousal during prolonged threat. Psychophysiology 2016, 53, 880890. [Google Scholar] [CrossRef] [PubMed]
- Amaral, C.P.; Simões, M.A.; Mouga, S.; Andrade, J.; Castelo-Branco, M. A novel Brain Computer Interface for classification of social joint attention in autism and comparison of 3 experimental setups: A feasibility study. J. Neurosci. Methods 2017, 290, 105–115. [Google Scholar] [CrossRef] [PubMed]
- Marín-Morales, J.; Higuera-Trujillo, J.L.; Greco, A.; Guixeres, J.; Llinares, C.; Scilingo, E.P.; Alcañiz, M.; Valenza, G. Affective computing in virtual reality: Emotion recognition from brain and heartbeat dynamics using wearable sensors. Sci. Rep. 2018, 8, 13657. [Google Scholar] [CrossRef]
- Riva, G.; Davide, F.; IJsselsteijn, W.A. Being There: Concepts, Effects and Measurements of User Presence in Synthetic Environments; Ios Press: Amsterdam, The Netherlands, 2003. [Google Scholar]
- Gorini, A.; Capideville, C.S.; De Leo, G.; Mantovani, F.; Riva, G. The Role of Immersion and Narrative in Mediated Presence: The Virtual Hospital Experience. Cyberpsychol. Behav. Soc. Netw. 2011, 14, 99–105. [Google Scholar] [CrossRef]
- Chirico, A.; Cipresso, P.; Yaden, D.B.; Biassoni, F.; Riva, G.; Gaggioli, A. Effectiveness of Immersive Videos in Inducing Awe: An Experimental Study. Sci. Rep. 2017, 7, 1218. [Google Scholar] [CrossRef]
- Blascovich, J.; Loomis, J.; Beall, A.C.; Swinth, K.R.; Hoyt, C.L.; Bailenson, N.; Bailenson, J.N. Immersive Virtual Environment Technology as a Methodological Tool for Social Psychology. Psychol. Inq. 2012, 13, 103–124. [Google Scholar] [CrossRef]
Disclaimer/Publisher’s Note: The statements, opinions and data contained in all publications are solely those of the individual author(s) and contributor(s) and not of MDPI and/or the editor(s). MDPI and/or the editor(s) disclaim responsibility for any injury to people or property resulting from any ideas, methods, instructions or products referred to in the content. |
© 2023 by the authors. Licensee MDPI, Basel, Switzerland. This article is an open access article distributed under the terms and conditions of the Creative Commons Attribution (CC BY) license (https://creativecommons.org/licenses/by/4.0/).