1. Introduction
Telepresence robots (TPRs) incorporate video conferencing equipment into a moving platform that can be controlled remotely. TPRs are growing increasingly popular in different domains, including education, where they are used to enable remote learning and students to participate in class from anywhere [
1,
2,
3]. This can be especially beneficial for students unable to attend in-person classes due to illness or disability. TPRs also allow educators to reach a wider audience and provide access to education to students who may not have had the opportunity to attend in-person classes or are physically unable to be present in a location [
1,
4].
The quality of video streaming significantly affects the usability of TPRs. This is influenced by factors such as the camera used, network connection, and image processing algorithms [
5]. In the context of mobile video streaming applications, video quality is a key element that affects usability, with factors such as bandwidth, network stability, and screen size playing a role [
6]. Several studies suggest that TPRs offer acceptable video quality with SVGA (Super Video Graphics Array) resolution and a wide field of view, improved quality compared to fixed camera systems, and sufficient audio and video quality at certain data rates. Some authors highlight the need to consider both technical and user-related factors in the assessment [
7].
One of the key characteristics that affect the usability of a TPR is its “eyesight” or the quality of video that it streams. The main factor that determines the quality of video is the camera used by the robot; however, this can be affected by other factors, including the network connection, image processing algorithms, and so on.
Comparing the image quality of video streams or still images requires a common scale. In addition, as a substantial amount of information in the education domain is delivered using slides, it is logical to test the operator’s ability to read such text.
Optometrists use a variety of charts to test and evaluate a person’s eyesight. These charts are used to determine a person’s visual acuity, which is a measure of how clearly a person can see, and we believe that the same method can be used to estimate and compare the quality of the robot’s video subsystem. LogMAR (Logarithm of the Minimum Angle of Resolution) and Snellen are among the most popular systems used to measure visual acuity, or the clarity of vision [
8].
The Snellen chart, invented in 1862 by a Dutch ophthalmologist named Herman Snellen, is the most widely recognized eye chart [
9] and is used to measure visual acuity from 20 feet. It consists of rows of letters that are progressively smaller as one moves down the chart. The smallest line of letters that a person can read accurately is used to determine their visual acuity, which is expressed as a fraction, with the top number (numerator) representing the distance at which the test was taken (20 feet or approximately 6 m) and the bottom number (denominator) representing the distance at which a person with normal vision can read the line. For example, 20/20 vision means that a person can see at 20 feet what a person with normal vision can see at the same distance [
10].
The LogMAR chart, introduced in 1976, on the other hand, is a more advanced system [
11]. It uses a logarithmic scale to express visual acuity, with a higher score indicating worse visual acuity. The chart consists of letters that are progressively smaller as one moves down the chart, and the smallest line of letters that a person can read accurately is used to determine their visual acuity; therefore, LogMAR charts have replaced Snellen charts in ETDRS (Early Treatment of Diabetic Retinopathy Study) standard tests [
11].
Overall, the LogMAR system is considered more accurate and precise than the Snellen system [
3], as it considers the size and contrast of the letters on the chart and is not affected by the distance at which the test is taken. However, the Snellen chart is still widely used due to its simplicity and ease of use. Results obtained from the Snellen chart can be converted to the LogMAR scale and vice versa either using conversion tables [
12] or online tools [
13].
Lim et al. demonstrated [
11] that “similar acuity results were recorded from all three charts, suggesting a lack of a systematic bias as regards chart design. A small practice effect was observed for all charts but was greatest for Snellen and least for ETDRS”.
TPRs are gaining prominence as indispensable tools for remote work. In this context, our research aims to guide educational institutions contemplating the integration of TPRs into their educational processes and assist potential users in making well-informed decisions when selecting a model that aligns with their expectations. Our motivation for conducting a comparative analysis lies in the assumption that all TPRs will be employed in identical training scenarios. Consequently, a direct comparison of their characteristics emerges as the most optimal method for deriving meaningful insights. The measurements in our study adhere to an industry-standard approach, utilizing optometric tables—a well-established method for measuring vision acuity over several decades. Extending this approach to estimate the vision properties of TPRs is logical, given the congruence of the measured characteristic. It is noteworthy that various visual cues and indicators are designed with individuals with reduced vision acuity in mind. Leveraging the optometric table allows us to make practical estimates, such as determining if a person with 20/40 acuity can read text without glasses from a certain distance, so can the operator of the TPR. This application adds a pragmatic dimension to our research findings. Thus, this study aims to evaluate the visual capabilities of several TPR models in a test environment that mitigates the effect of secondary factors not directly related to the image acquisition system of TPRs, proving high-quality internet connection and good lighting conditions.
The study is guided by the following research questions:
To what extent do the visual attributes of the examined TPRs facilitate their efficacy in supporting active engagement during academic activities such as school lessons and university lectures?
Which models of examined TPRs demonstrate better results in terms of streaming better-quality videos?
The paper has the following structure. Following this introduction, the paper will outline the materials and methods used in the study, including the measurement of visual acuity and text readability on a wall projector. The results of the study will then be presented, followed by a discussion of the findings. Finally, the paper will conclude with a summary of the key findings and implications for future research.
2. Materials and Methods
The experiments included four models of TPRs: Double 3 by Double Robotics [
14], Ohmni by Ohmnilabs [
15], and Temi 2 and Temi 3 by Roboteam Home Technology [
16]. They consisted of two separate sets of measurements: (1) measuring visual acuity using the Snellen and LogMAR charts at a distance of 3 m and with an illuminance of approximately 600 lux, as recommended for these charts [
10,
17]—(“It is recommended that VA assessment always be performed between 400 lx and 600 lx, as this limits any effect of illuminance change to 0.012 LogMAR”); and (2) measuring the text readability on the wall projector in the class at the distances of 5 m and 10 m. Image acquisition was performed by taking screenshots with the Windows Snipping tool in the lossless format PNG (Portable Network Graphics) [
18,
19] and using the robots’ integrated functions of storing still images from the camera, where available.
Codecs shape video quality, varying even with the same devices. During internet data transmission, dynamic adjustments prevent delays. In our TPR experiment, undisclosed compression details and fixed settings risked video quality decline with low bandwidth. To counter, we used ample network bandwidth, providing ample safe margin compared to the minimal requirements as stated by the manufacturers (Ohmni: 3 Mbps upload and download, as stated on
https://ohmnilabs.com/products/customers/faq/#spec accessed on 24 December 2023; Double 3: 4.5 Mbps, as stated on
https://doublerobotics.my.site.com/s/article/network-connectivity-requirements accessed on 24 December 2023; Temi: at least 3 Mbps upload and 3 Mbps download speeds, as stated on
https://temi-guide.readthedocs.io/en/latest/network-admin/03_temi-robot.html#temi-robot-wifi-requirements accessed on 24 December 2023), ensuring optimal performance despite unknown technical details. Data transfer from TPRs to the operator was conducted via the cloud service; therefore, the quality of the internet connection played a significant role in the experiment. The building where the experiment took place is connected to the internet using two channels with a bandwidth of 1 Gbit each. Robots were connected to a 2.4 GHz wireless network. The experiment took place on Sunday, with no other people present in the building and therefore with minimal interference.
Network connection speed was measured using the Speedtest [
20] service, with a connection to Telia Eesti AS servers (
Table 1).
Double 3 and Ohmni robots have integrated qualitative indicators to inform the user of the networking conditions; they both rated network connection as “good” (the highest category according to their scale).
The readability analysis of the images captured from the robots was performed using the Google Vision AI optical character recognition service [
21], following the principles of generative design—an innovative approach using algorithms and AI to explore and create multiple design options. It relies on computational power to consider constraints and parameters, allowing for the generation of innovative solutions in various industries like architecture and engineering.
Vision AI returns the result in JSON [
22] format, and each recognized symbol is assigned a confidence coefficient. JSON file was parsed using the code from Algorithm 1 and the line of text in the chart was considered not recognized if at least one of the following conditions were met:
Confidence interval of at least half of the symbols in the line was below 0.4,
two or more symbols in the line were recognized incorrectly.
| Algorithm 1. JSON file parsing |
| 1 | import json |
| 2 | import itertools |
| 3 | |
| 4 | def parse_json(file_path): |
| 5 | with open(file_path, 'r', encoding = "utf-8") as f: |
| 6 | |
| 7 | data = json.load(f) |
| 8 | return data['fullTextAnnotation']['pages'][0]['blocks'] |
| 9 | |
| 10 | def get_symbols(blocks): |
| 11 | for block in blocks: |
| 12 | if block['blockType'] == "TEXT": |
| 13 | paragraphs = (p['words'] for p in block['paragraphs']) |
| 14 | words = itertools.chain.from_iterable(paragraphs) |
| 15 | symbols = itertools.chain.from_iterable(w['symbols'] for w in words) |
| 16 | yield from symbols |
| 17 | |
| 18 | def main(): |
| 19 | blocks = parse_json('ocr-google.json') |
| 20 | for symbol in (s for s in get_symbols(blocks) if s['confidence'] > 0.4): |
| 21 | print(f"{symbol['confidence']}\n{symbol['text']}\n{'='*6}") |
| 22 | |
| 23 | if __name__ == '__main__': |
| 24 | main() |
These conditions were found empirically, but uttermost precision is not required as the main goal of using computer OCR technology was to guarantee unbiased performance by applying the same algorithm to all the images (see also [
23]).
Control of the robots and image acquisition was performed on HP Elitebook 620 G4 notebook computer running Microsoft Windows 11 Education 64-bit with a screen resolution of 1920 × 1080@60 Hz at maximum brightness and an external 24” HP E24i G4 monitor, 1920 × 1080@60 Hz, at maximum brightness connected via DisplayPort. Microsoft Edge browser, version 108 (64-bit), and the Photos app (preinstalled in Microsoft Windows) were used.
The robots had the following versions of software installed:
Double 3: head software 1.2.6, base firmware 30.
Ohmni: v. 4.1.7-devedition, release track stable.
Temi 2 and Temi 3: v. 128.12, firmware 20201216.
While Temi has no still image saving functionality, the Double 3 and Ohmni robots have the functionality of taking screenshots in the following formats:
2.1. Measuring Visual Acuity
Although the original LogMAR test requires 20 ft (6 m) distance between the patient and the chart, such spacious rooms are not always available; therefore, scaled options were developed for the distances of 4 m, 3 m, 2.5 m, and 2 m [
24].
Two charts, one Snellen and one LogMAR, were printed out in accordance with the scale required for 3 m distance measurements [
9,
25] using high-contrast printing mode. Although the charts’ printouts size was scaled in accordance with the standards, a quick checkup was performed: one of the authors of the article wears glasses with −2.50 D on the right eye and −1.50 D on the left eye. In accordance with the Snellen chart specification, the person with −2.50D eyesight should be able to see 20/200 letters size (line 1) and with −1.50D 20/100 letters size (line 2). Additionally, with glasses on (normal eyesight), a person must be able to distinguish 20/20 symbols (line 8). Keeping in mind that the conversion of visual acuity into diopters is a far more complicated process, the checkup succeeded, and the ability to distinguish the symbols on the chart corresponded to the expected result.
In most real-life cases, the choice of the chart is affected not only by its quality but also by the qualifications of the personnel, ease of use, and time spent on measurements. However, for this experiment, there was no time limit for a single measurement, and conversion into diopters with a precision required for prescribing glasses was not required; therefore, both the Snellen and LogMAR charts were used in parallel for comparing OCR results that should give the same or similar values in accordance with the conversion table’s data.
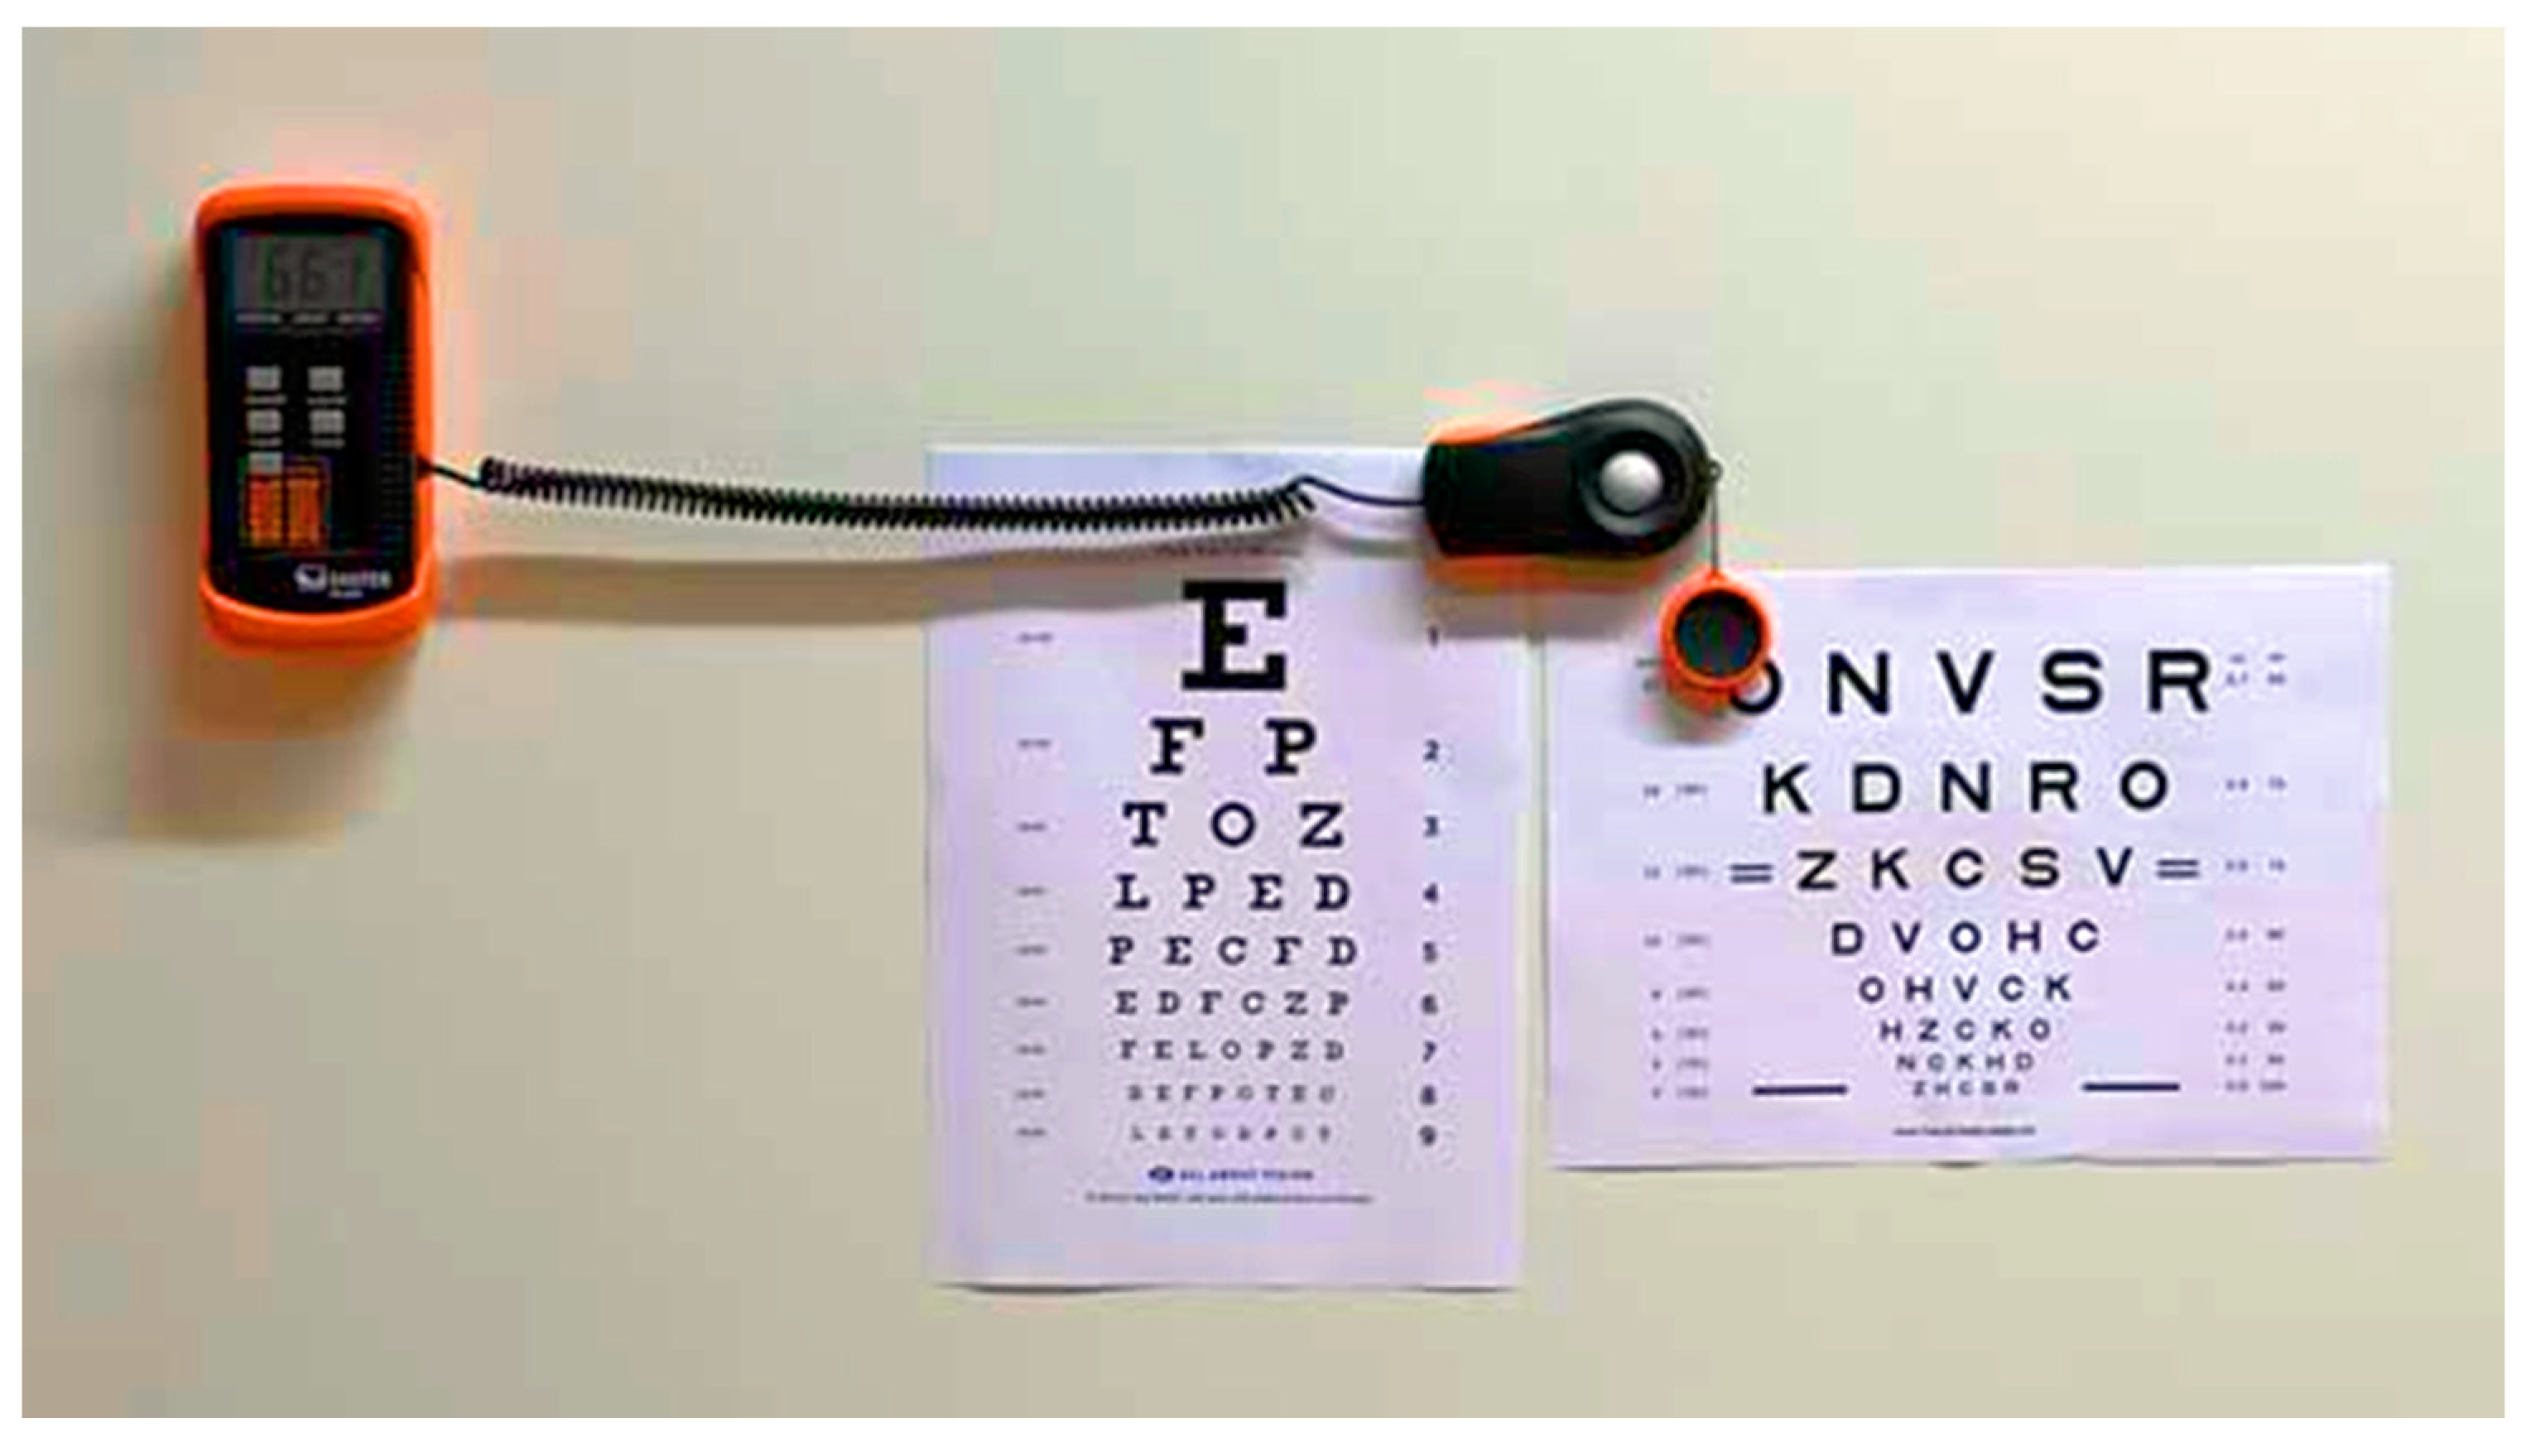
The charts were placed on a white wall illuminated by fluorescent light bulbs. No considerable amount of natural light was present in the room. Illuminance was measured using the Sauter SO 200K digital light meter with a reading accuracy of ±3% rdg ± 0.5% f.s [
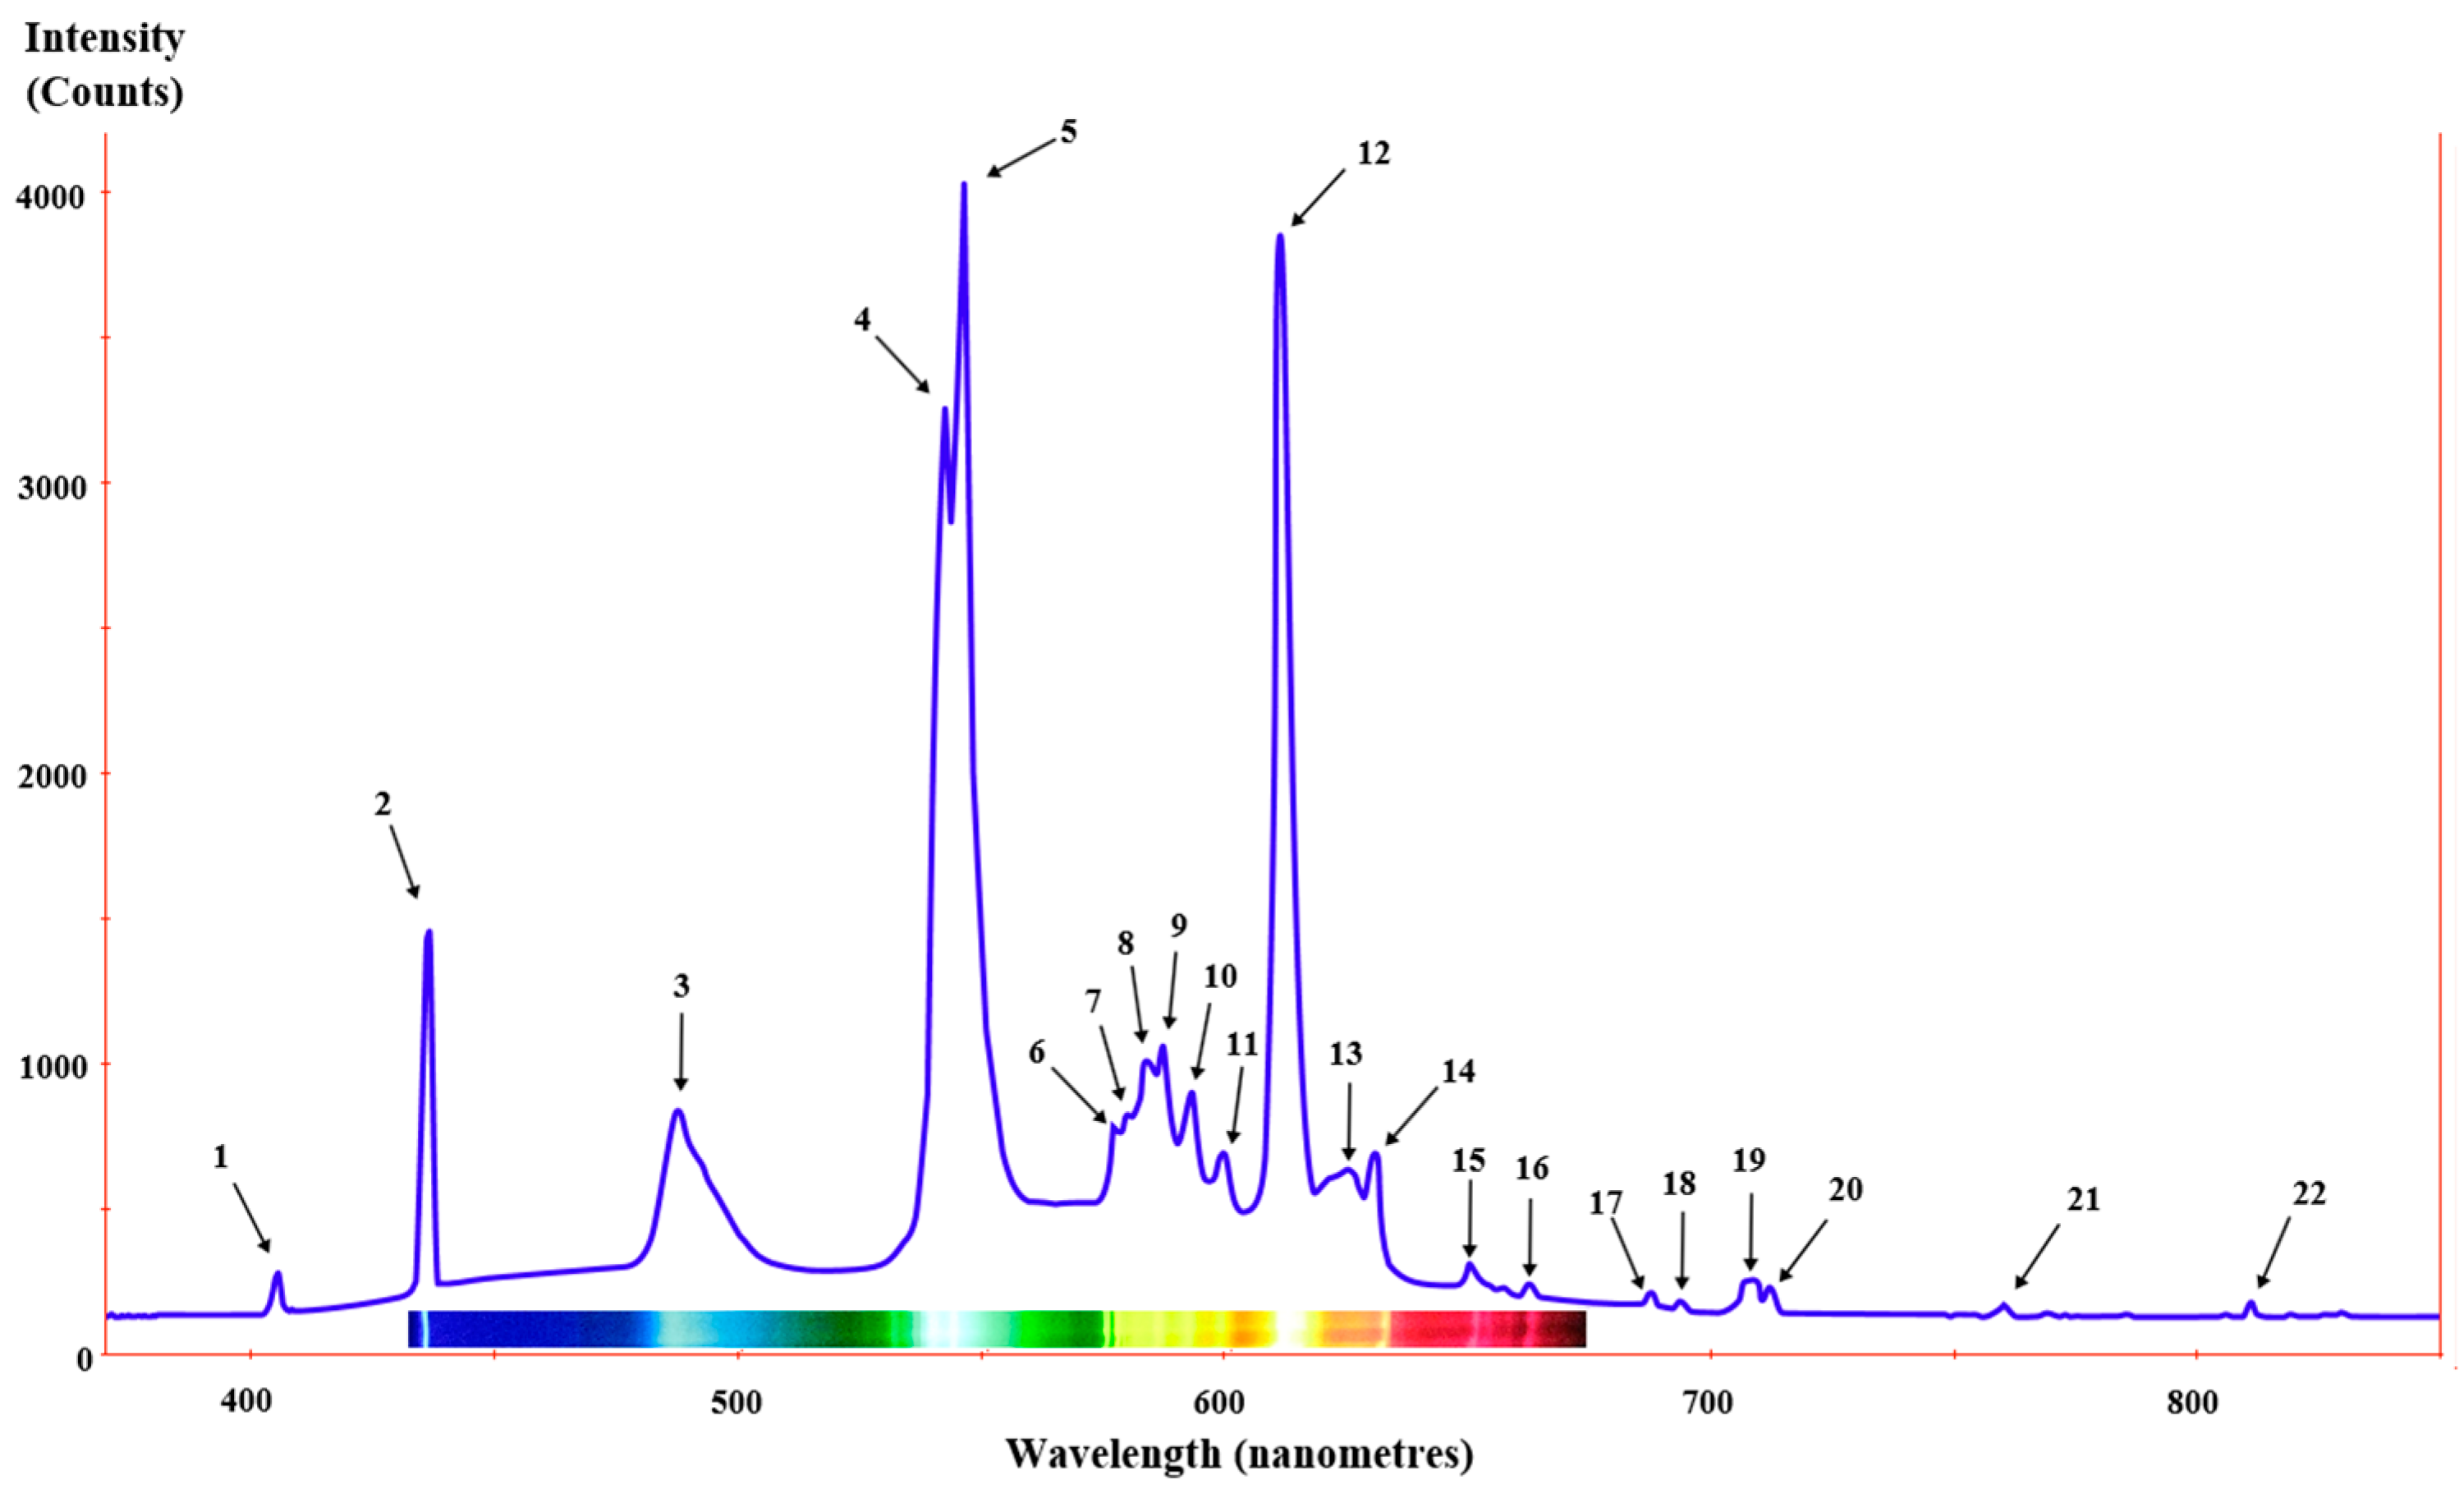
26], with an average value of the measurements being with a value of 662 ± 6 lux. This illuminance distribution is considered even. The authors defined deviation values of ±10 lux as acceptable, and as long as measurement results are within the acceptable interval, their variations will not be considered.
Fluorescent light bulbs have discrete emission spectrum with main peaks at 546 nm and 611 nm (
Figure 1).
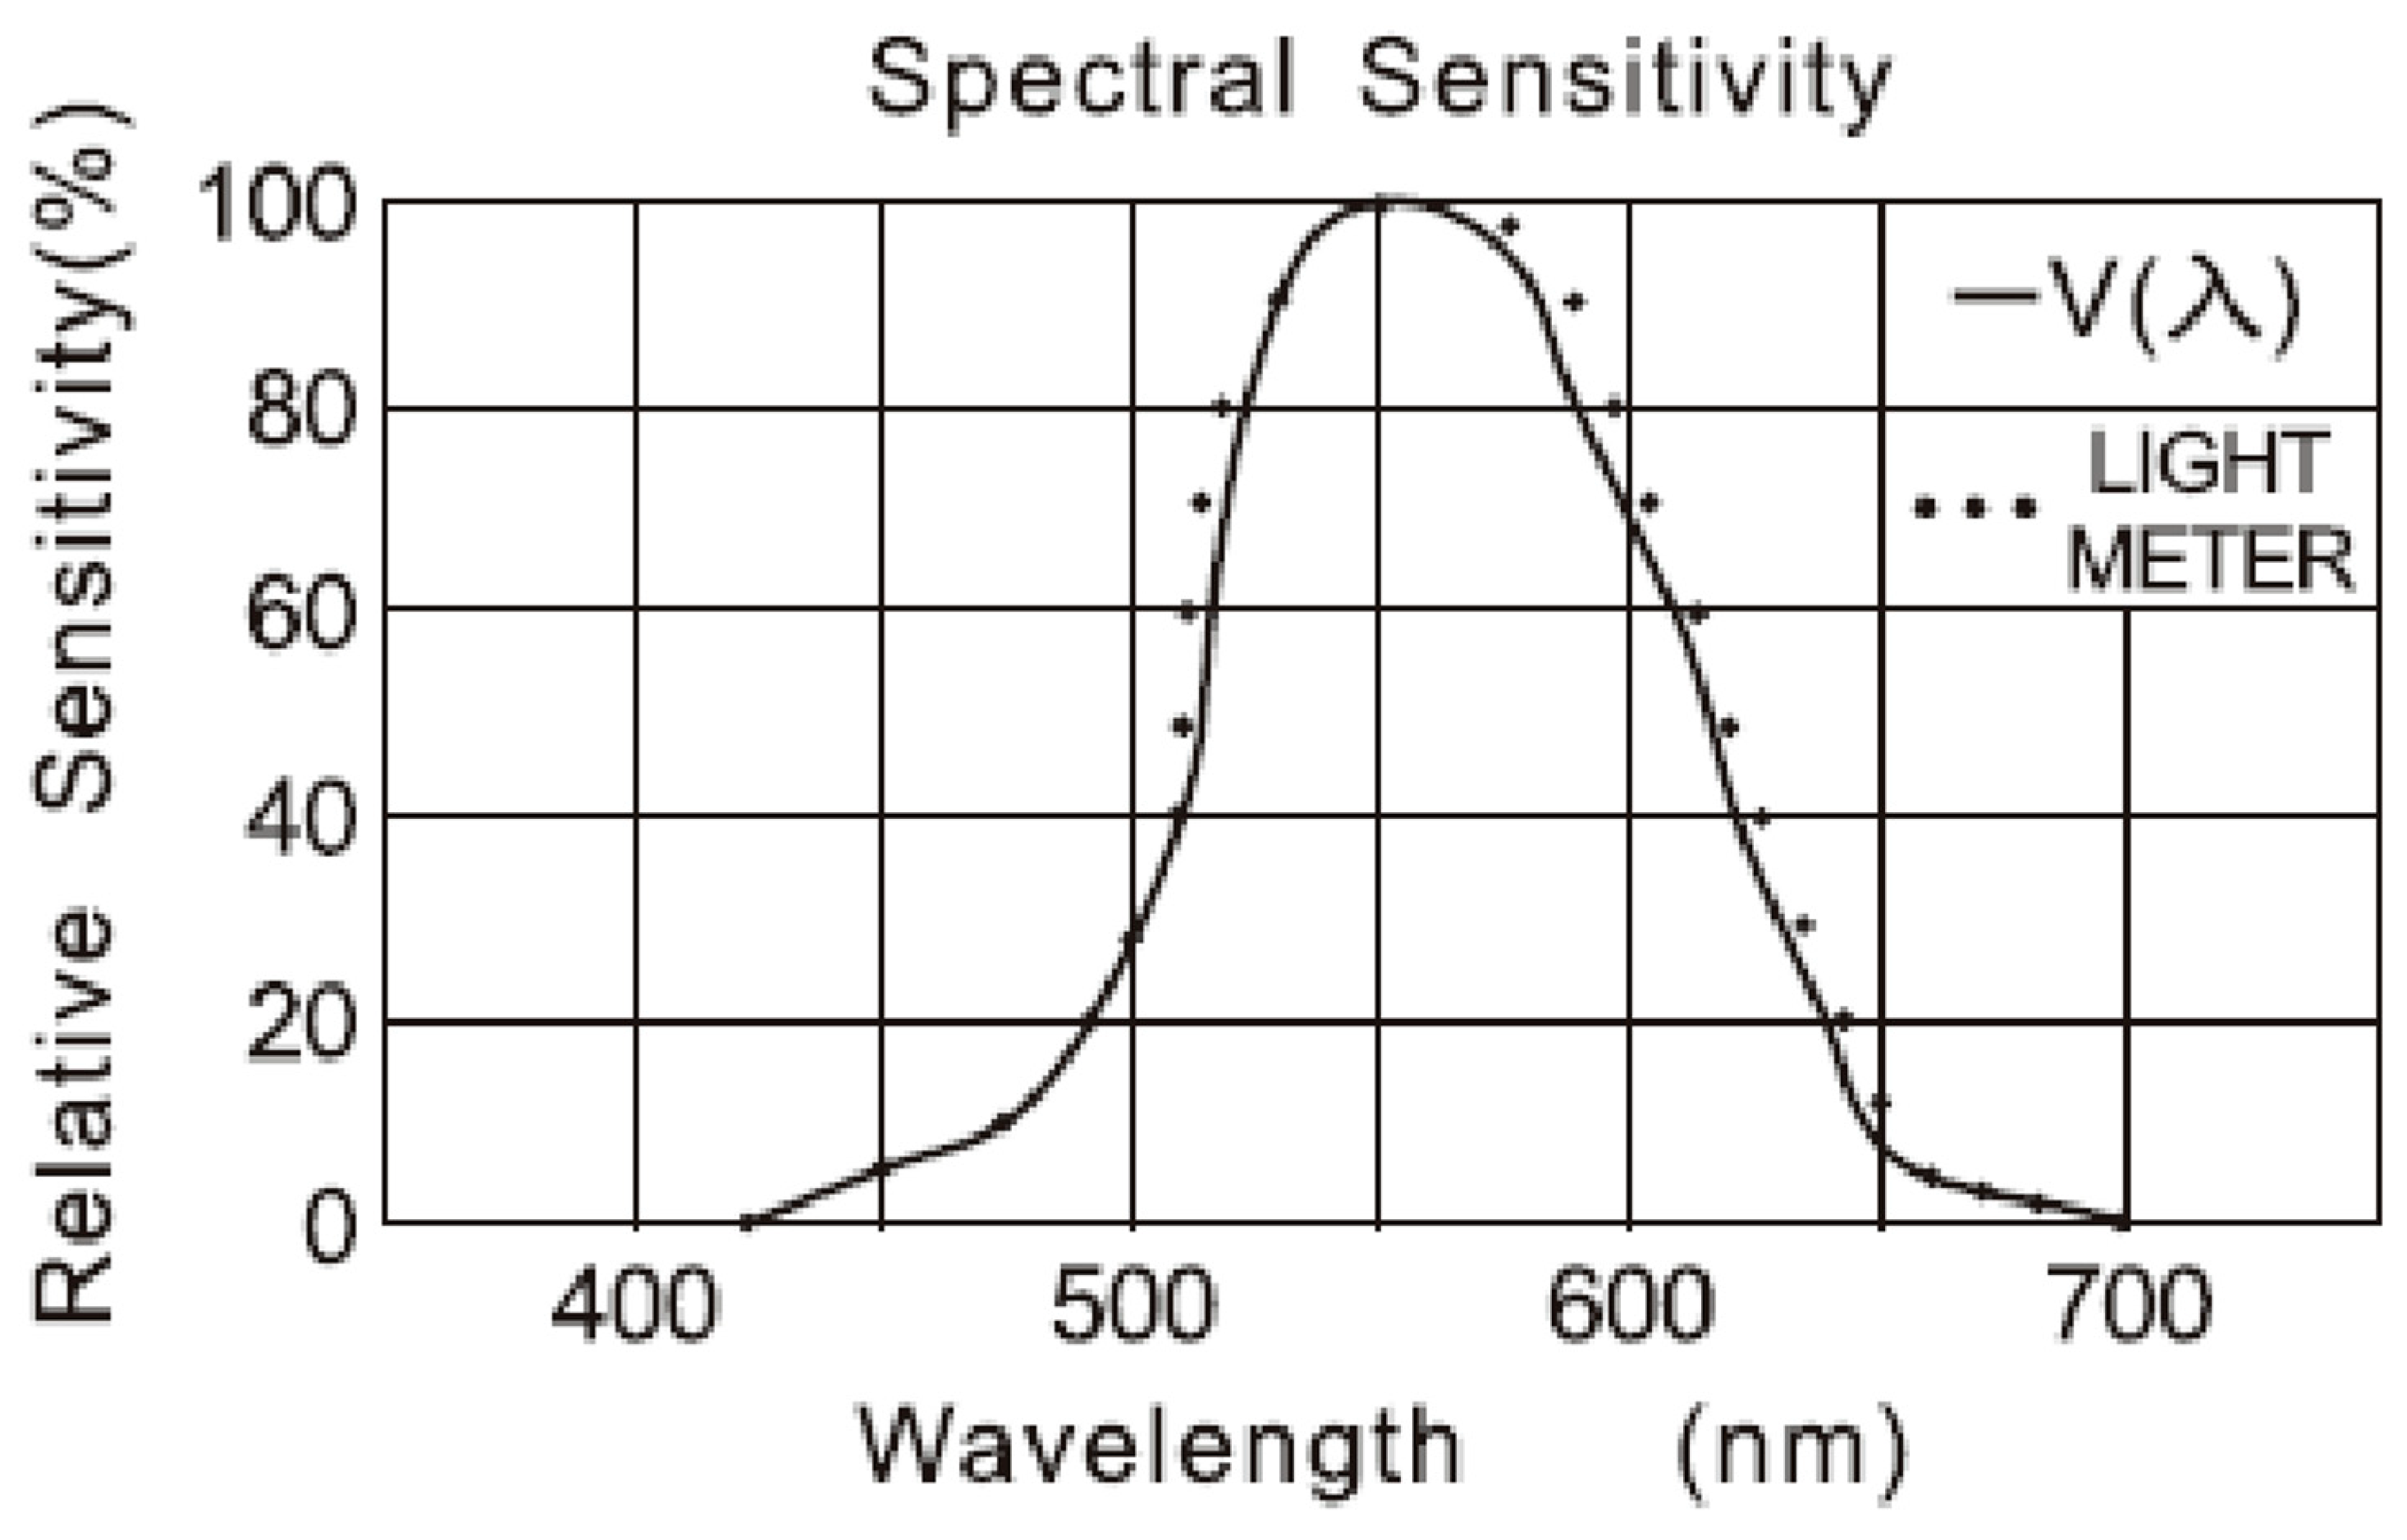
According to Sauter SO 200K lux meter technical specifications [
26], its spectral sensitivity was sufficient for measuring illuminance in this wavelength range (
Figure 2).
The illuminance was measured (
Figure 3) both at the beginning and the end of the measurement session, and the disparity fell within the acceptable limits.
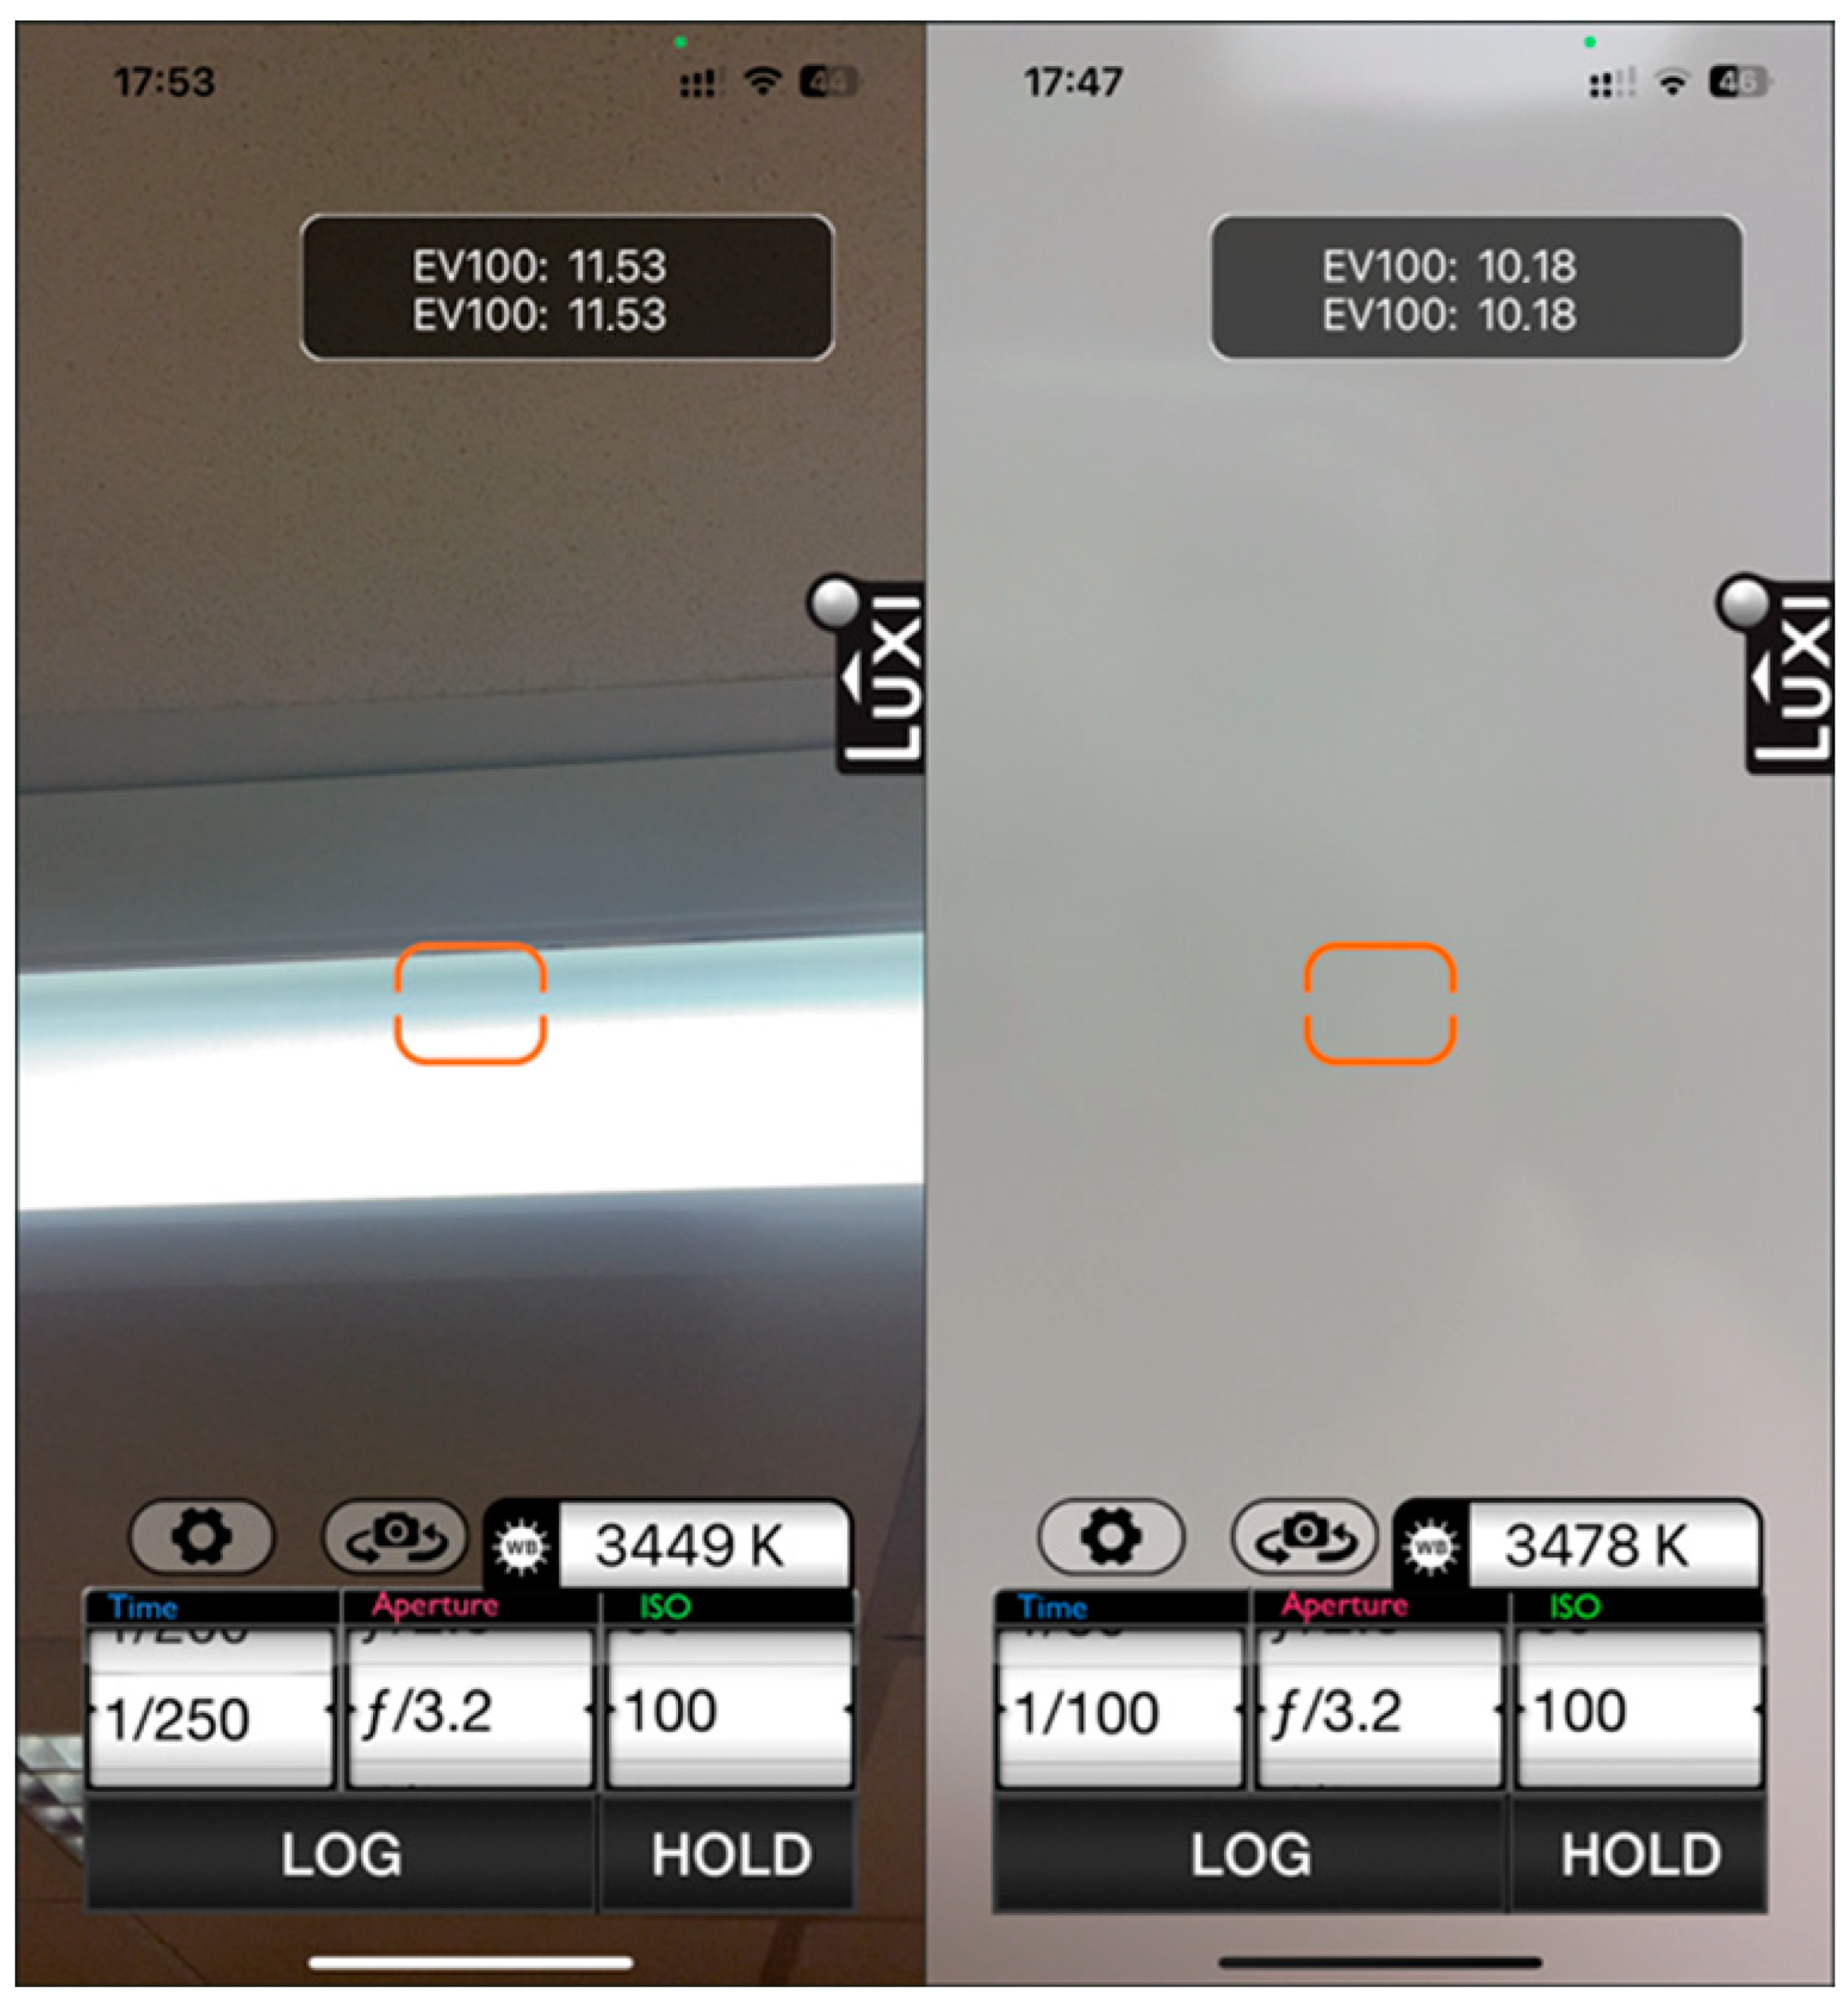
The color temperature was measured using the Pocket Light Meter app by Nuwaster studios [
27] on an iPhone 13 Pro front camera [
28] (
Figure 4).
Distance to the chart is measured by Duka LS-P laser distance measure with an error margin of 1 mm [
29].
The authors define distance measurement deviation of ±10 cm (about 3.94 in) as acceptable and for as long as measurement results are within the acceptable interval.
Out of three robots, Double 3 is the only one with an adjustable height that can be changes withing the range of 120–150 cm (3.94–4.92 ft). Temi camera is located 94 cm (about 3.08 ft) above the floor and Ohmni camera is located 140 cm (about 4.59 ft) above the floor. Middle position was chosen—120 cm that lies within Double 3 height range. Temi and Ohmni TPRs can tilt the camera for the charts to be in the center of the camera viewing field, which is important for measurements in zoom mode.
2.2. Measuring the Text’s Readability on the Wall Projector
Using light projectors to demonstrate slides is a widely used scenario in education. As general CCD (Charged-Coupled Device) and CMOS (Complementary Metal-Oxide-Semiconductor) cameras have a narrower dynamic range in comparison to human eyes, it is important to understand if the robot operator can read the text from the slides.
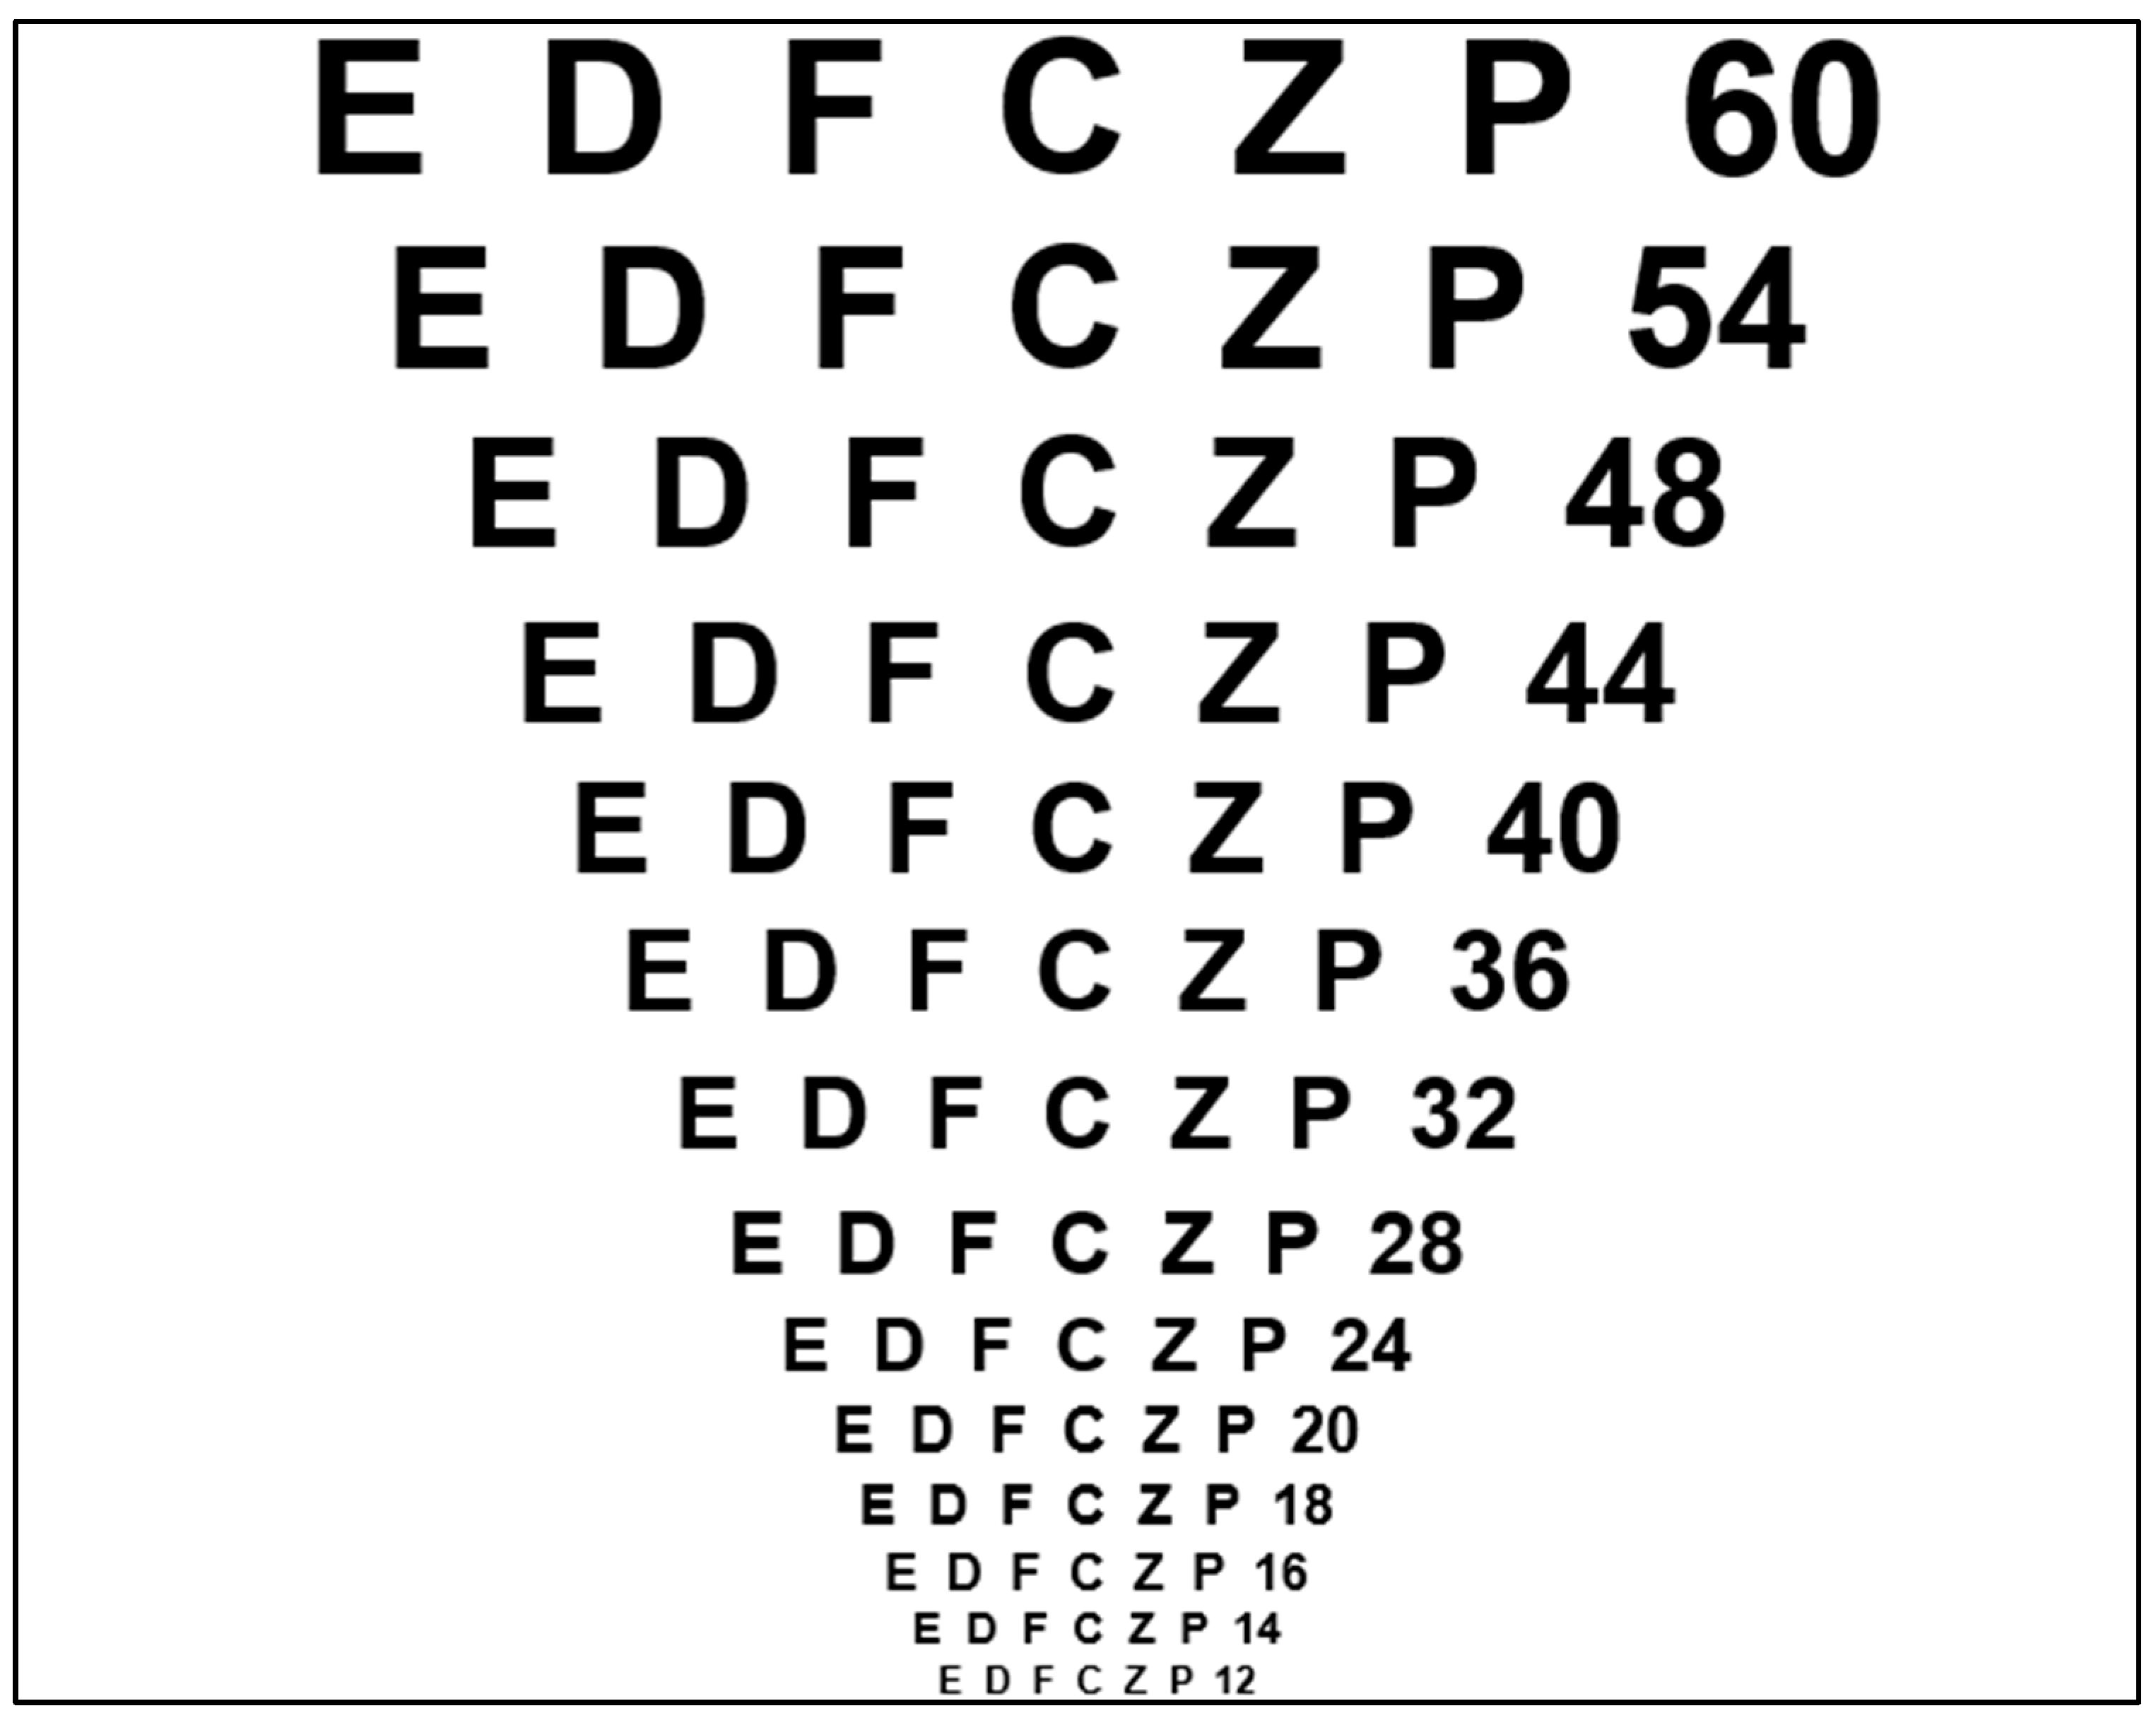
As screen dimensions and room sizes may vary significantly, the use of standard optometric tables is no longer feasible; therefore, it was decided to use a reference slide with black text on a white background and apply Google Vision AI OCR (
https://cloud.google.com/vision (accessed on 11 January 2023)) to obtain relative results for different models of the TPRs. The slide contained lines of black text on a white background and used Arial Bold font (
Figure 5).
The letters for the slide were selected to represent different visual groups of symbols of the Latin alphabet: round letters, straight letters, diagonal letters, and curved letters.
Best practices for presenters recommend using at least 24 pt [
30,
31] font size, but for the purpose of this experiment, the slide contained font sizes in the ranged from 12 pt to 60 pt.
The room was equipped with a NEC P525WL laser projector with a 1280 × 800 resolution and 5000 lumens brightness. The projector was placed at a distance of 5.3 m from the wall.
The robots were placed at a distance of 5 m and 10 m from the screen, and the measurements were made under two different conditions:
Light in the class is turned on,
light in the class is turned off and the only source of light is the projector itself.
3. Results
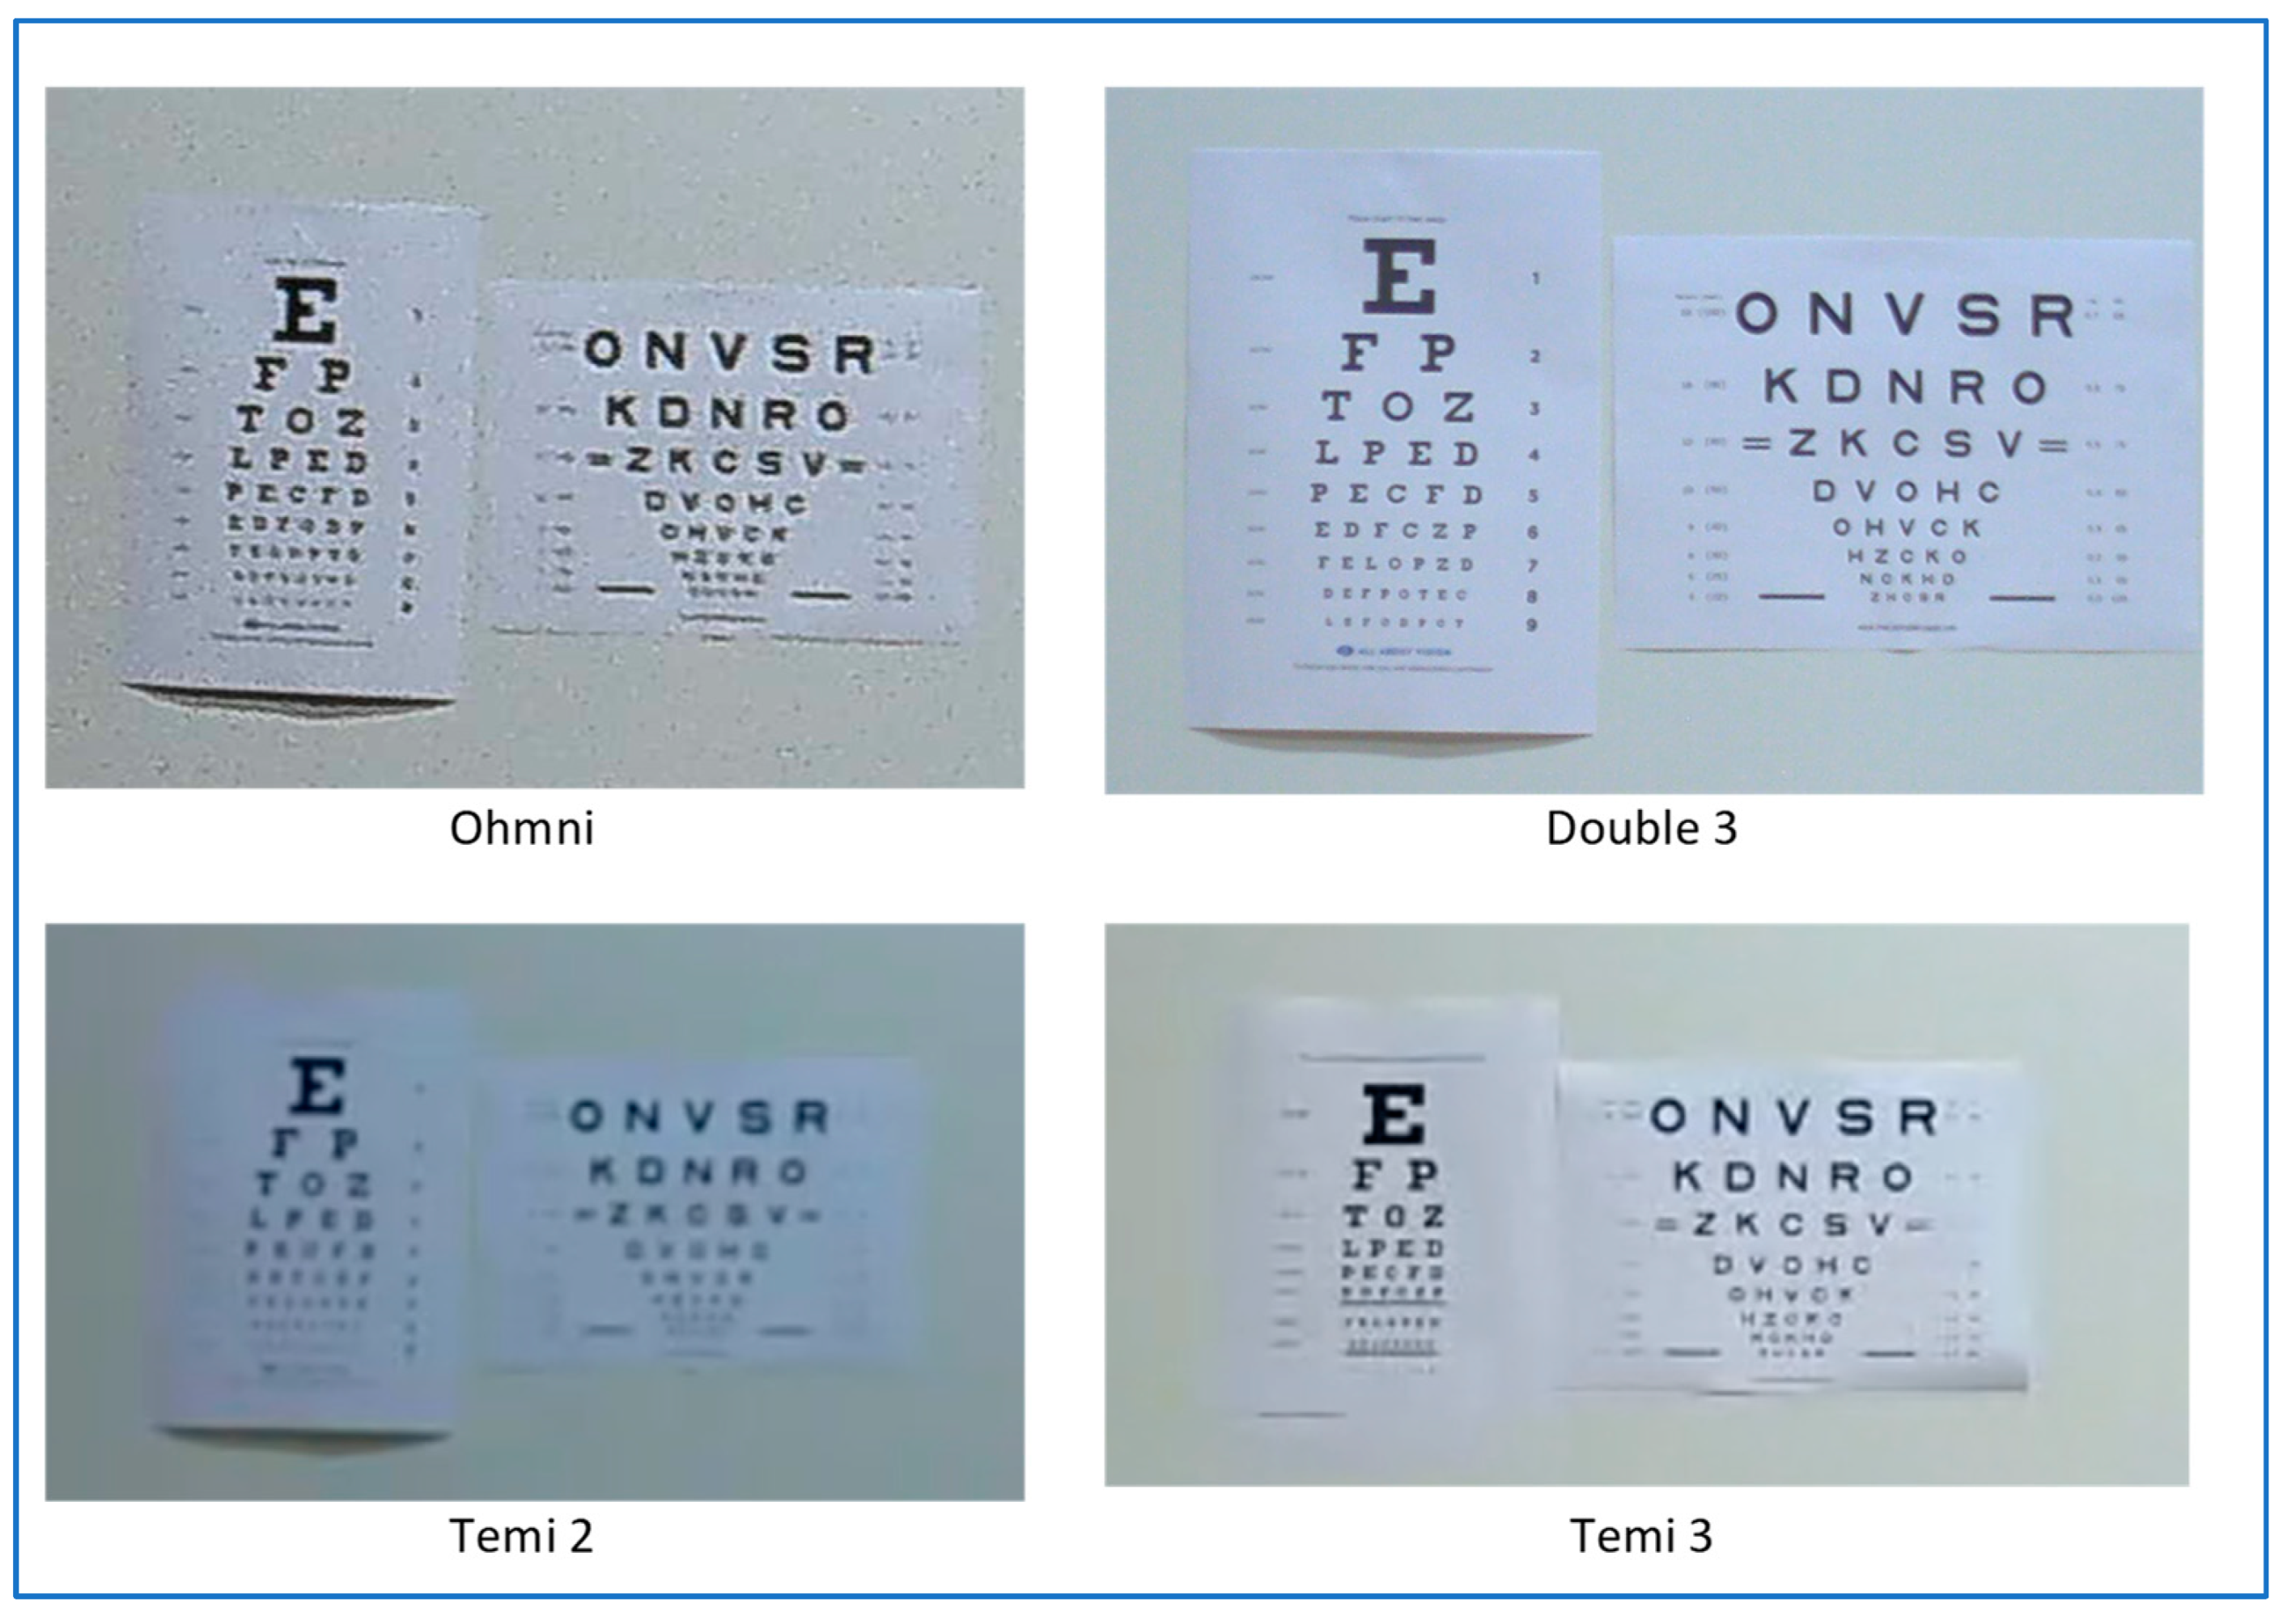
The figures below represent the images taken by different models of TPRs (
Figure 6). The image taken by Temi 2 robot is more blurred compared to the others. Though detailed, the image taken by Ohmni has noticeable artefacts caused by the image processing algorithms.
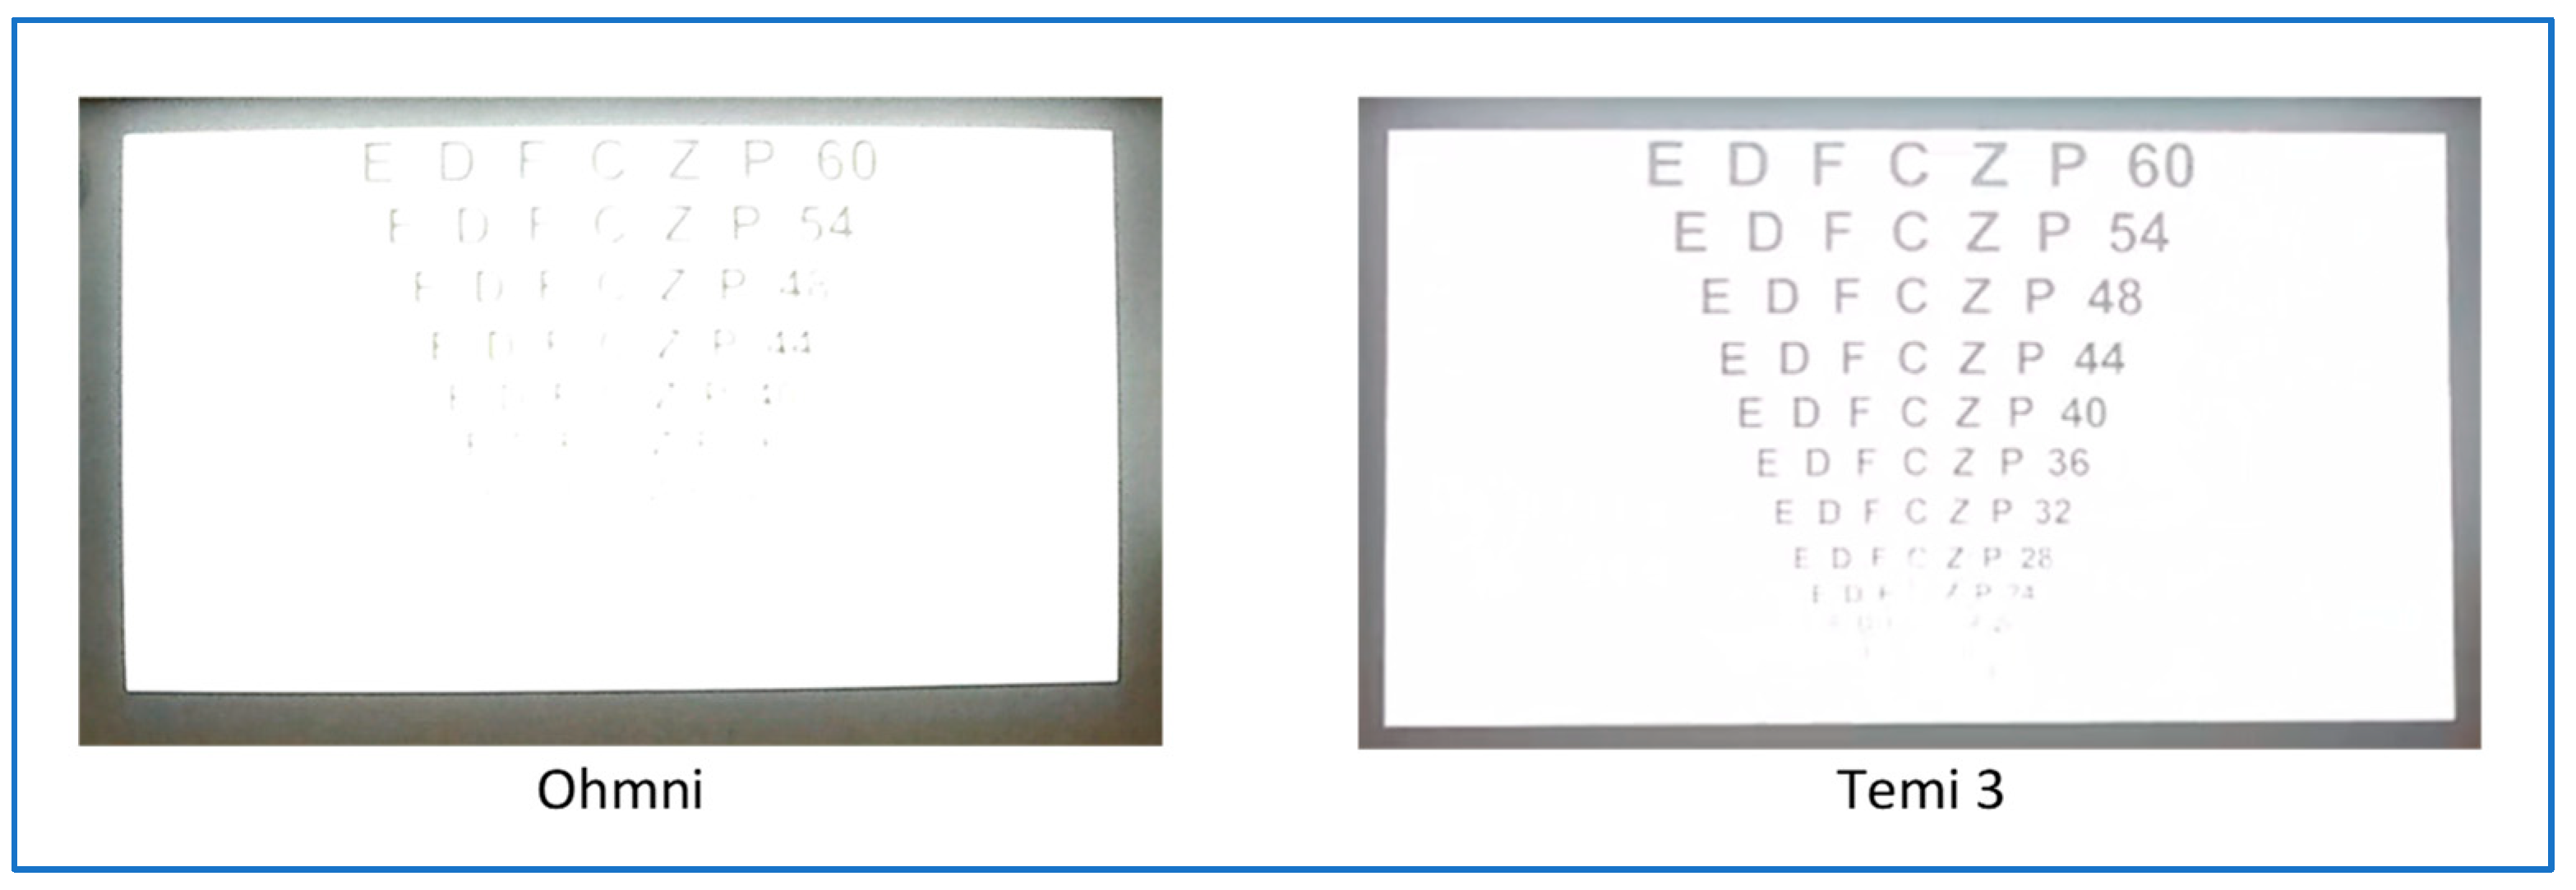
Sample images of the slides in a dark room captured by the Ohmni and Temi 3 TPRs revealed that both robots have sufficient video resolution to make the text readable. However, Ohmni failed to do so due to the camera exposure settings (
Figure 7).
The optometric charts measurement results are presented in
Table 2. The fractions in the Snellen table should be interpreted as follows: the numerator (20) is the distance to the chart in feet, whereas the denominator is the distance at which a person with a normal eyesight must be able to read the letters of the same size. Therefore, only Double 3 demonstrated the results of an average person when using its zoom camera.
Table 3 contains the results of measurements of the readability of text on the slides with the ambient light switched off and on, at distances of 5 m and 10 m from the screen. In this case, a significant role is played by how the robot adjusts the sensitivity of the sensor. Although Temi 2 has a lower quality camera, its image processing algorithms seem to provide a better result compared to the later model.
Double 3 achieved good results due to the presence of a zoom lens, which allowed the slide to take up most of the image so that data processing balanced the result correctly.
Overall, none of the robots demonstrated a clear advantage, although the results of Temi 2 and Double 3 were superior.
4. Discussion
The quality of the final result was determined by two main parameters:
Image processing is a general term for different types of manipulation of digital images, including noise reduction, adjusting contrast, brightness, or sharpness, and applying numerous types of filters.
For example, Ohmni uses aggressive sharpening algorithms that distort the image and make the letters harder to distinguish. Although such image processing may add some benefits in other scenes, it clearly works as a disadvantage when reading text.
Images, with a wide range of light intensities from the darkest to the brightest (wide dynamic range) are still a challenge to camera sensors; therefore, the text on the images obtained from the bright screen in the dark room is sometimes unreadable not due to a low camera resolution but to brightness adjustments made by TPR image processing algorithms. There are different exposure metering modes, such as center-weighted, matrix, or spot metering, with the first ones usually showing better results, but in such a particular case with a bright projector image in the dark environment, they result overexposure of the slide. Double 3 mitigates this problem partially using its zoom camera. In that case, the slide takes up a larger part of the image resulting in better balance.
Ohmni has manual controls for contrast, sharpness, and exposure, but their usage is hardly feasible as lighting conditions may change, settings are unintuitive, and nobody in the experimental group was able to achieve significant improvement of the image quality by adjusting the settings manually.
Although the readability of the slides in general will depend not only on the size of the letters, but on the background color, contrast, and technical specifications of the projector, this experiment provides comparative results.
All TPRs demonstrate much worse readability results in situations where ambient light is turned off; therefore, it is preferable to keep the room lighted when showing slides.
Ohmni demonstrated a significantly better chart readability result when OCR was used on the still image taken by the TPR rather than a frame from the video stream. That was caused by the fact that, though it had a front camera with ultra-high-definition sensor (3840 × 2160 pixels), it only used its full resolution for taking still images, and generally, the robots did not stream video in full camera. Additionally, video resolution was adjusted dynamically depending on the connection quality. The content of Double 3 log-file (see
Appendix A) indicates that even in a high-speed network, it would use a 1152 × 720 pixel resolution for transmitting video, which is significantly lower than what its camera can provide.
Although hardly usable in real time, high-resolution still images give an opportunity to store the text with higher readability compared to the video frames.
This also means that the resolution of the monitor that TPR operator uses in most cases will not affect the readability of the text because the resolution of the video transmitted by the TPRs is lower than Full HD resolution that the vast majority of the common computer screens support.
Double 3 is the only robot that has two front cameras with different focal lengths (optical zoom). The other models offer digital zoom only; in other words, they stretch the center of the image acquired by the camera. The presence of the second camera gives it a significant advantage over the other models, especially in visual acuity measurement using charts. Double 3 is the only robot that achieved the acuity of normal eyesight.
It should be noted that in real life, the result would be influenced by a wide range of factors, including the network connection quality and optimization algorithms implemented by the developers, location of the data centers, sun glare, and additional factors.
Although it was previously demonstrated [
32] that with the increase of the illumination, the readability of the text also increases, illumination above 650 lux should not be expected in school or university class environment.
Whenever possible, the situation with low ambient light conditions should be avoided if one or several persons attend the class using TPR models under study.
This study can be further expanded by adding other models of TPRs and by introducing real-life situations where students or teachers use a telepresence robot in the classroom. The preliminary results indicate that it is highly probable that reading the text from the monitor might be complicated or dependent on its brightness settings, or that image quality will be reduced significantly due to a low-speed connection or long delay in data transmission.
5. Conclusions
The quality of text readability using telepresence robots is influenced by two main factors: camera hardware properties and image processing algorithms. Ohmni, Double 3, Temi 2, and Temi 3 TPRs are four different TPR models that were evaluated for text readability. It was found that Double 3 had the best overall readability, followed by Temi 3 and then the others. This was due to Double 3’s dual-lens camera system, which provided better image quality and zoom capabilities. Ohmni’s readability was hampered by its aggressive sharpening algorithms, which distorted the image and made the letters harder to distinguish. All TPR’s image readability results were also affected by the exposure metering modes, which resulted in overexposed images in certain lighting conditions.
It was also found that using optical zoom, rather than digital zoom, resulted in better image quality and text readability. Additionally, taking still images, rather than using video frames, also improved text readability. This is because still images can be captured at a higher resolution than video frames. In general, it is preferable to keep the room lighted when using TPRs for presentations. This will help to ensure that the text is readable and that the overall presentation quality is high.
The examination of TPR camera capabilities for remote teaching and learning suggests avenues for future research. While the study compared the camera quality of different TPR models, exploring additional factors influencing OCR accuracy in these environments is valuable. Variables like lighting conditions and text complexity could impact OCR performance. Moreover, considering the crucial role of compression algorithms, or codecs, in shaping image quality, it becomes imperative to integrate this aspect into further research. Compression algorithms significantly affect video stream quality, and their dynamic adjustments during data transmission over the Internet can impact image quality. In the experiment, all three TPRs employed dynamic compression algorithms, but manufacturers provided limited technical details and restricted user settings, potentially leading to degraded video quality in low-bandwidth conditions. To minimize the impact of this factor, the study used a network with a bandwidth much larger than the required characteristics stated by the robot manufacturers. In addition, the study primarily focused on OCR accuracy for optometry charts and text on a projector screen. Future research could explore OCR performance in other applications, such as the real-time transcription of lectures or capturing whiteboard notes. Comparing TPR OCR accuracy with human vision under the same conditions could reveal the extent to which OCR can effectively replace human vision in remote teaching and learning scenarios. Furthermore, beyond technical aspects, the study emphasizes the importance of considering user experience and acceptance. Research could explore factors such as user comfort, perceived effectiveness, and potential barriers to the adoption of TPR-based remote learning. While the study involved controlled experiments, future research might implement TPRs in real-world educational settings to assess their effectiveness in enhancing teaching and learning outcomes. Additionally, subsequent research may further explore imaging principles, robot hardware, and related aspects, contributing to a comprehensive understanding of the impact of video codecs on TPR performance.


