
A Smart Framework for Managing Natural Disasters Based on the IoT and ML
 , and
, and
Abstract
1. Introduction
- First: A review study on flood early detection, the solutions presented in that, and the negatives and advantages of those solutions.
- Second: presentation of a proposed approach platform base on a hybrid solution by integrating the IoT and machine learning algorithms.
- Third: Building a smart algorithm to classify and predict the degree of risk in advance. We replaced the traditional prediction of the rainfall amount by RT classification of the level of threat according to many weather variables and previous situations.
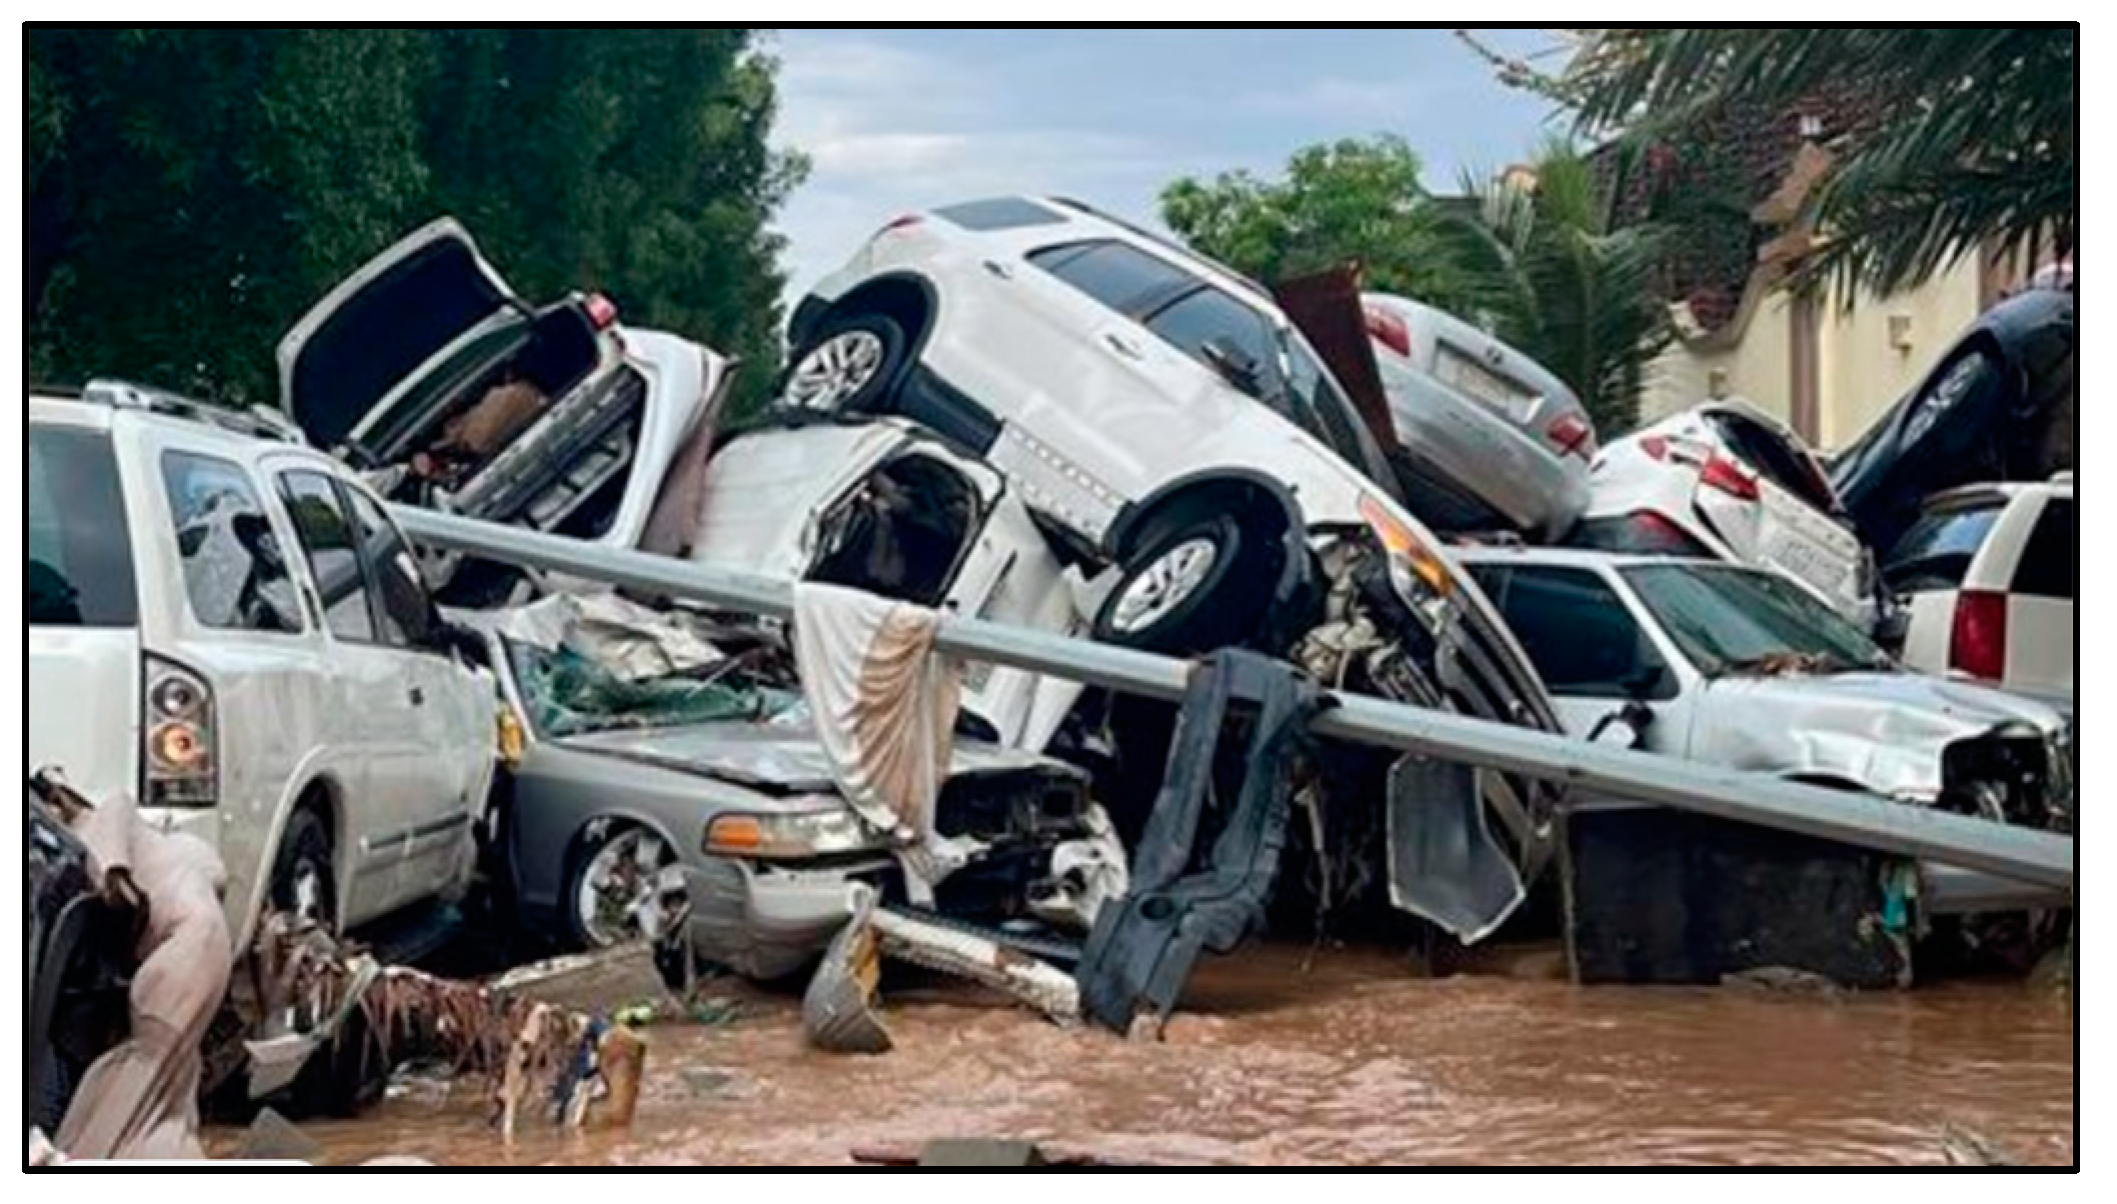
- Fourth: An actual study of actual data in the city of Jeddah, Saudi Arabia, during the previous years (2009 to 2013) and years (2018 to 2022) to prove the effectiveness of the proposed algorithm.
- Fifth: Building an application to alert users and educate them in advance in the event of danger and alert the Civil Defense to take the necessary measures and a decision.
2. Related Work
2.1. Internet of Things in Disaster Management
2.2. Machine Learning in Disaster Management
2.3. Predicting Precipitation
2.4. Flood Risk Management Systems
- Delay in response to the event without attention to its threat level and real time (RT) notification. It is a major weakness in critical systems that are related to people’s lives, which are based on cloud computing and web services only.
- Most of the studies focused on the whole city in general instead of regions within the city. Flood effects may differ from one area to another according to the topology of each one.
- Papers that used the ML approach depended on the prediction the rainfall instead of RT classification for the current situation or were applied to a small dataset, which affects the reliability of results.
- Most of the studies depended on physical solutions based on hardware only, such as IoT devices. It is better to integrate both in addition to depending on more than one ML model, as we did in this research. This paper has addressed all the above issues as we explained and proved in the next section.
3. Methodology
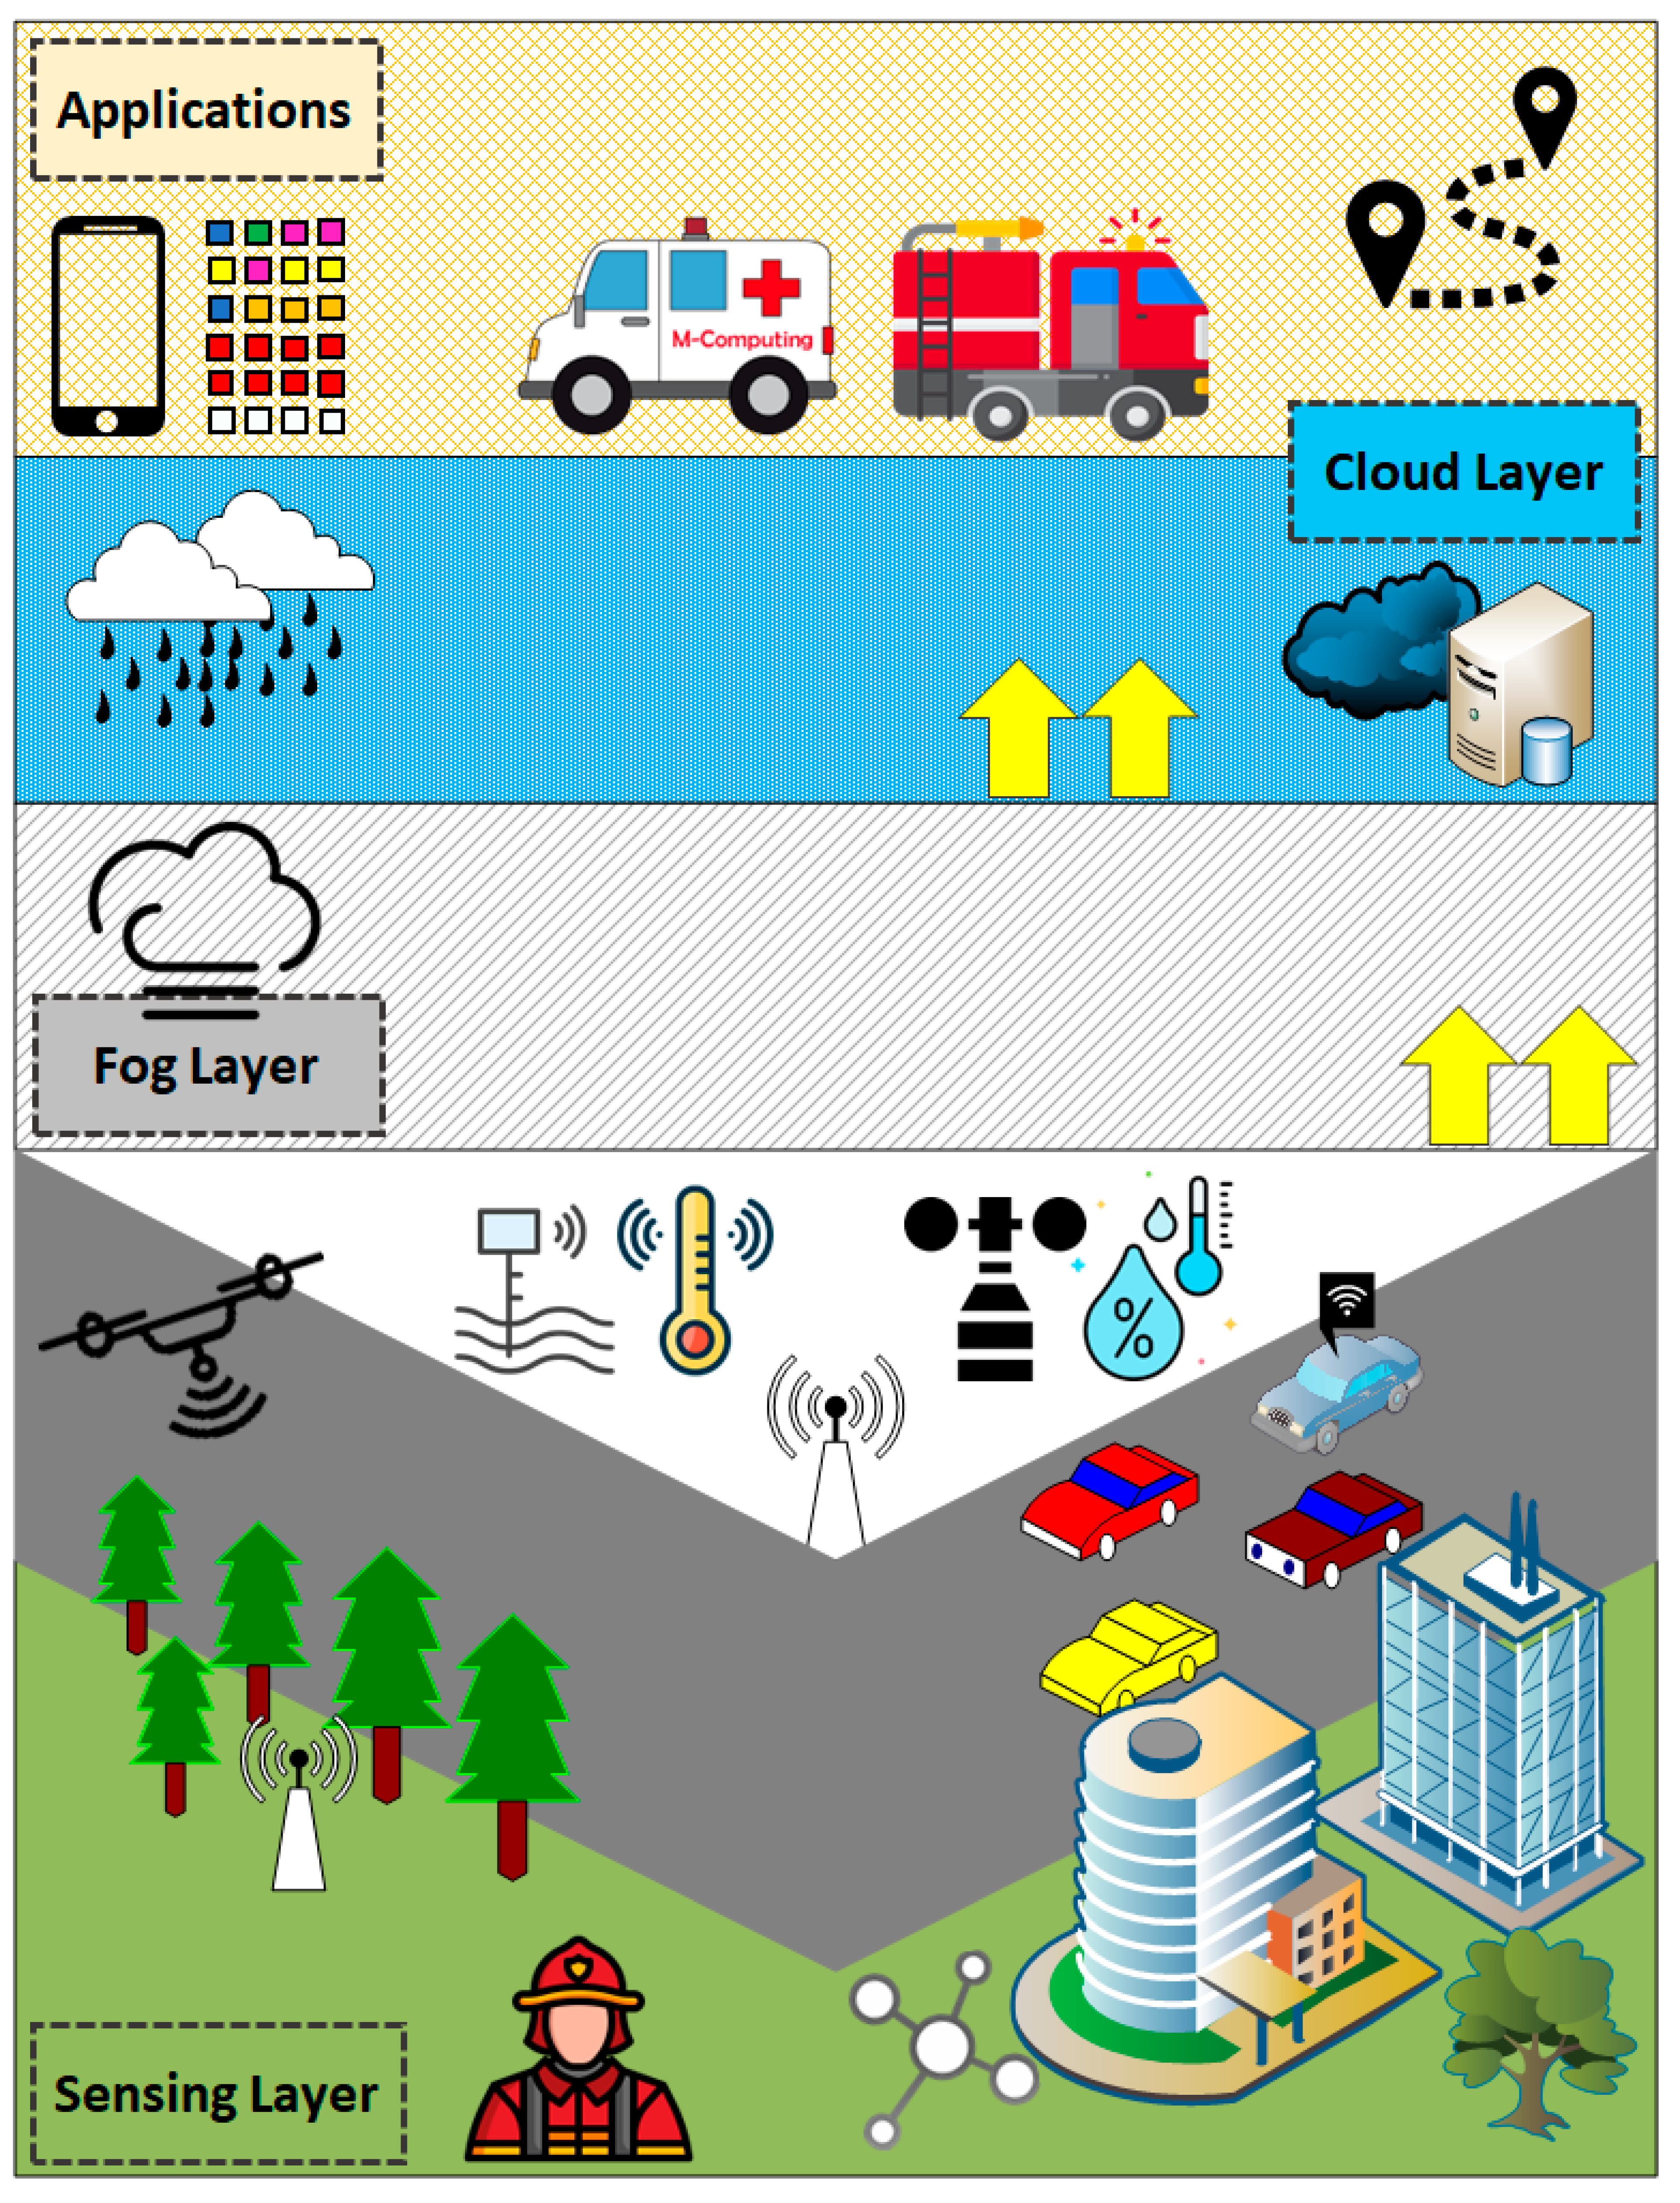
3.1. Proposed Framework
- Caching data;
- Detecting abnormal data or sensor;
- Calculating the average of captured data from many sensors to enhance reliability and reduce the number of connections to the cloud;
- Normalizing values and creating inputs of ML model;
- Appling the ML model to classify the inputs data;
- Sending notifications in real time if there is any threat;
- Sending feedback and forwarding summarized data to the cloud every few minutes.
- Alerts application, which sends an immediate alert to citizens of a specific area in case of danger;
- News application, which sends the update of trusted information about the weather conditions or the status of the regions in the city;
- Routing application, which helps drivers to choose the best and safest route during the bad weather;
- Navigation application helps the civil defense to reach the affected or threatened places quickly;
- First aid application, which is useful for volunteers to know the procedures that must be in emergency cases and circumstances to help others and the civil defense groups;
- Crowdsourcing application allows people to evaluate the current situation and thus improve the accuracy of estimation cases in addition to results of the proposed algorithm;
- Health application, which enables users in bad situations to request ambulance or request online medical consultations if the movement is danger and forbidden;
- Monitoring application is useful to monitor the level of citizens’ commitment to government instructions, especially in the cases of a high threat indicator.
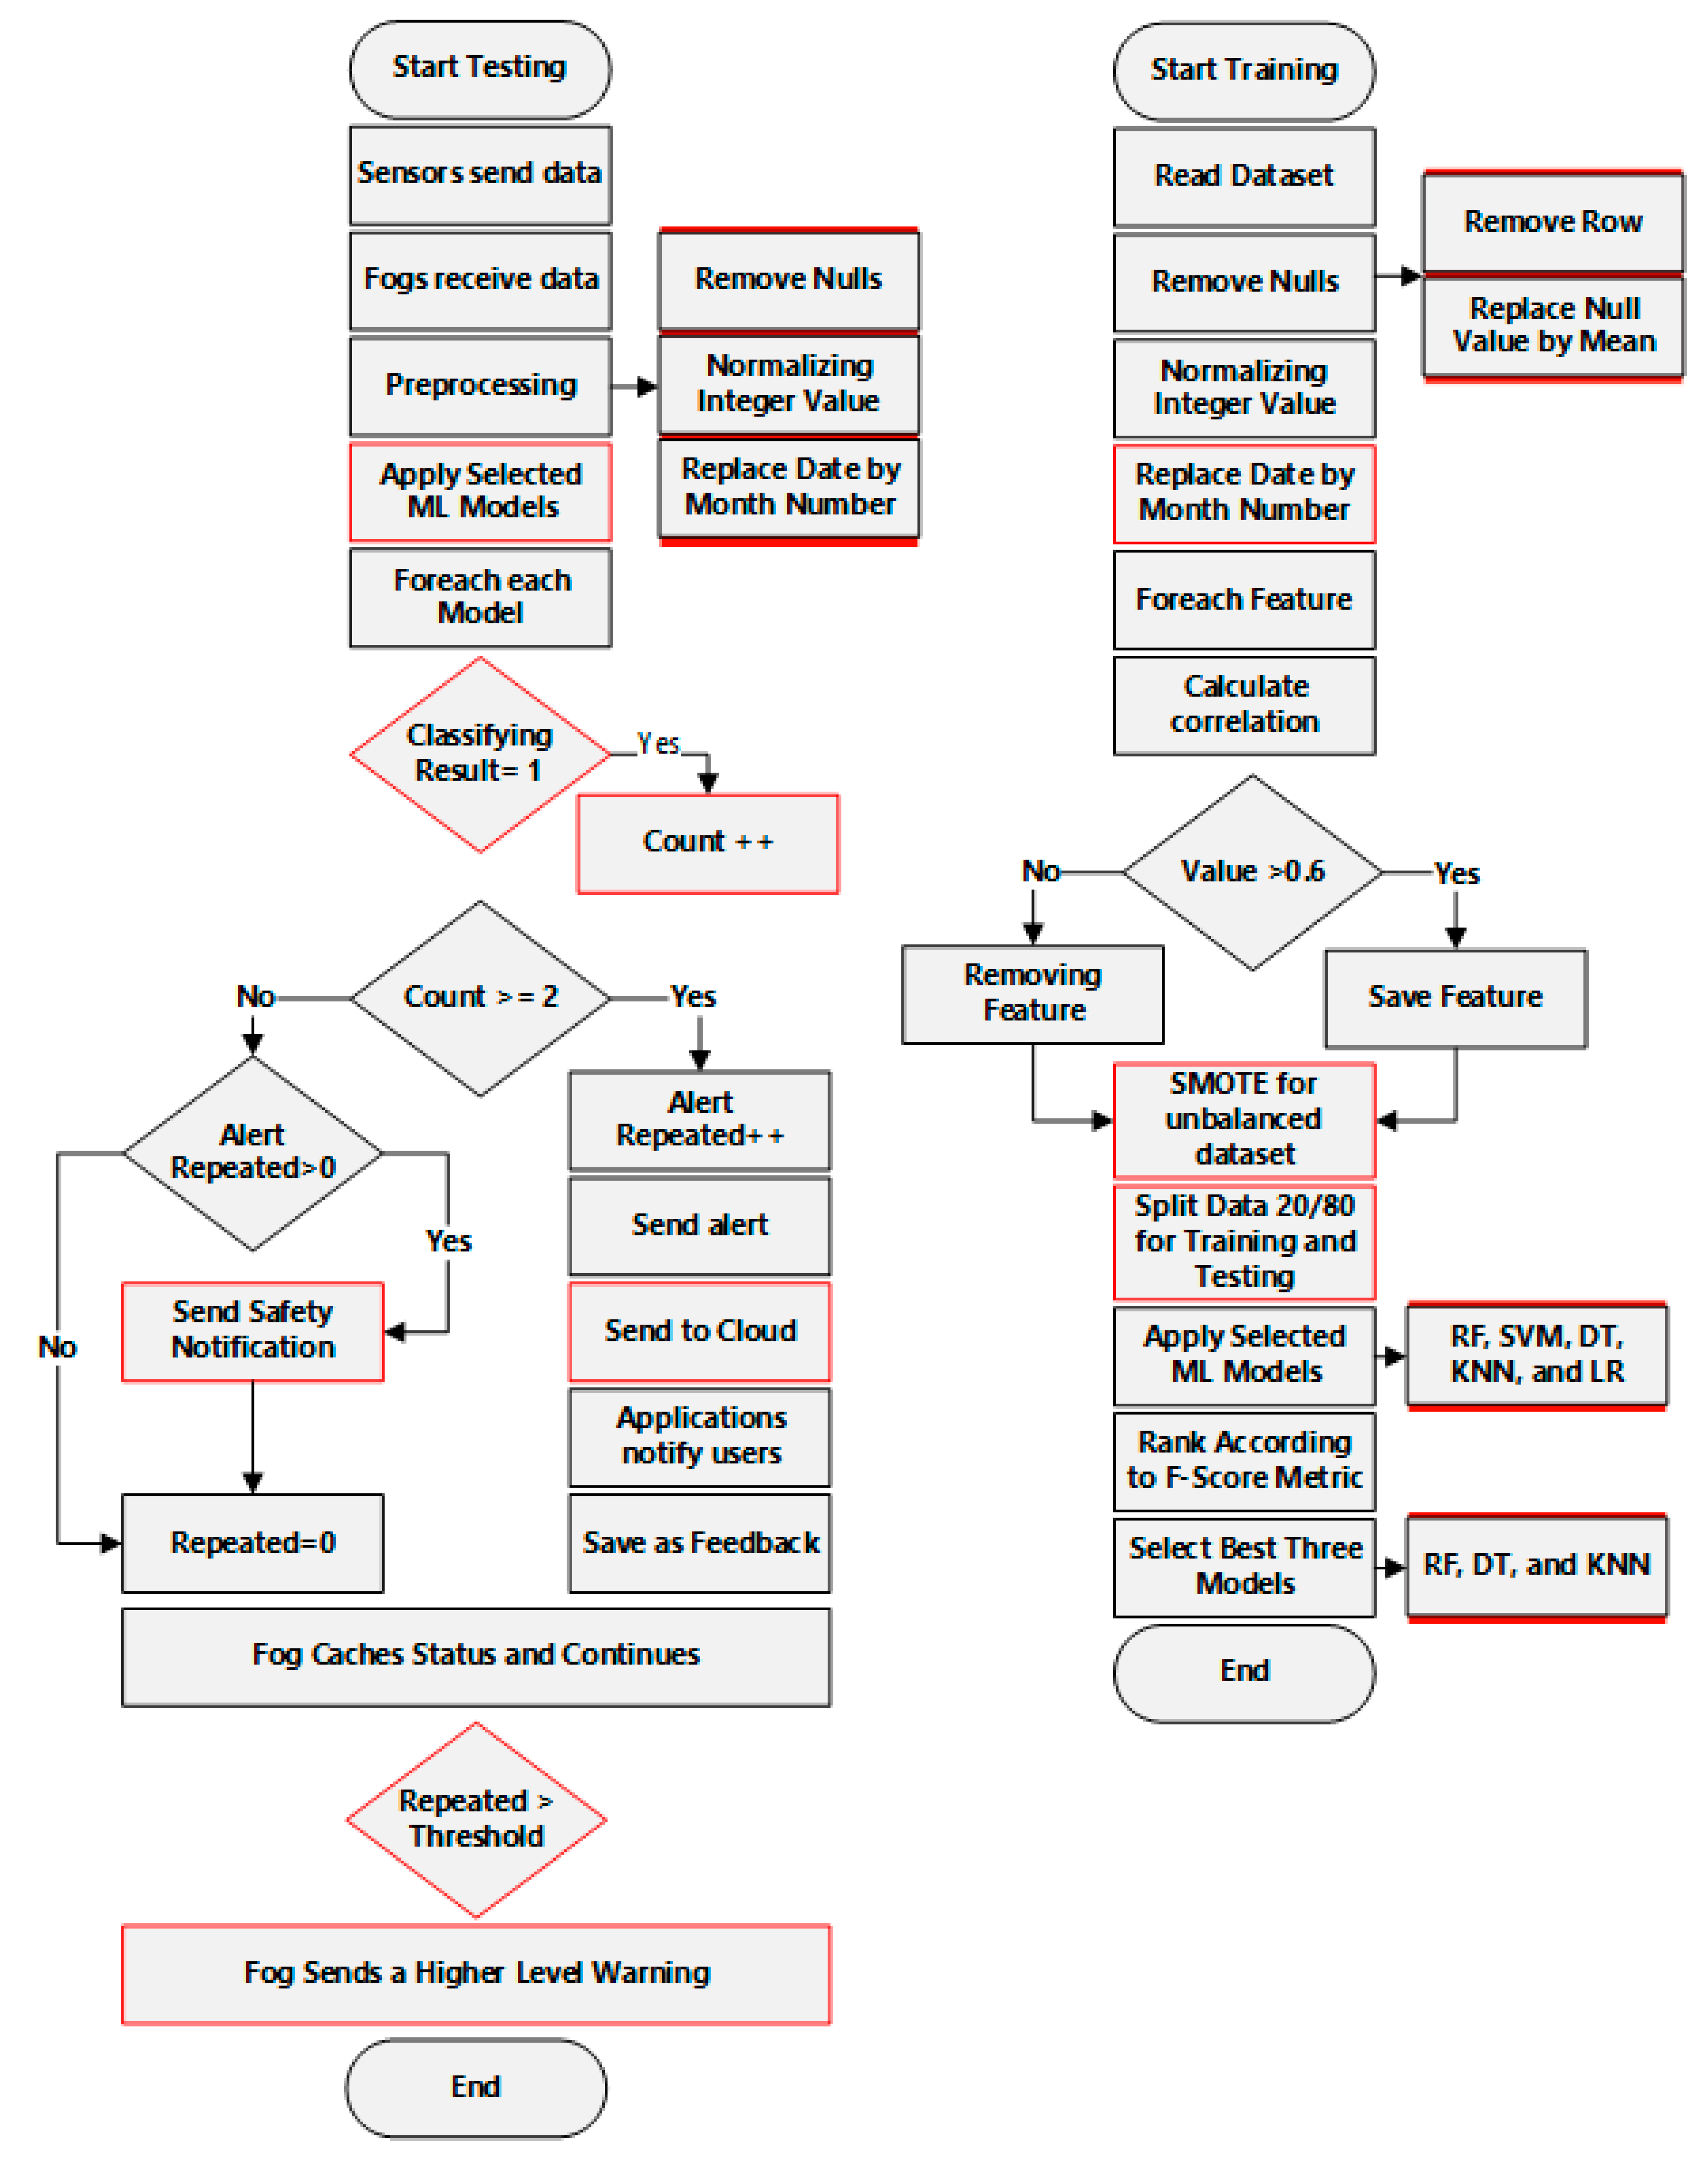
3.2. Proposed Algorithm
- # In the phase of training
- Reading dataset of historical data in cloud;
- Preprocessing data by filtering a nominal value;
- Removing the missing value or replaced by average value of the feature;
- Normalizing values of each feature;
- Converting the date value to month number;
- Selecting features depending on correlation value with threat column (Y);
- Applying SMOTE function to address the unbalanced data issue;
- Dividing data to training and testing (80, 20);
- Applying ML models (we selected five models RF, SVM, DT, KNN, and LR);
- Comparing results based on the confusion matrix;
- Selecting the best three models.
- # In the phase of testing
- Fog receives values from sensors;
- Fog preprocesses data and forms input of algorithm;
- Fog applies data on the proposed algorithm;
- Fog checks the majority of classification results for the best three models;
- In case of a threat, fog calculates time of continues threat to estimate the level of threat;
- Fog sends alert for people and teams of this area to take the precautions according to the threat level;
- Fog forwards data to the cloud to enable this data to services providers;
- Cloud creates complete imagination about the status of areas to support decisions of government.
3.3. Other Advantages of the Proposed Framework Are
- Considering the topology of regions (cell) according to fog node location;
- Reducing the overhead on the cloud significantly, thus improving system performance;
- Providing real-time response and tracking for the emergency’s cases;
- Detecting cases of outlier values of sensors by comparing their behavior with other;
- Depending on multi-models of ML to enhance the accuracy and reliability;
- Monitoring the level of threat depending on period of continuous and the rate of change;
- Suggesting most important services for dealing with the emergency situations.
3.4. Challenges of the Proposed Framework and Future Trend
- The cost of deploying wireless network sensors and providing fog nodes in all areas of the city, usually these things are available in smart cities;
- Interoperability between different kinds of sensors, companies, services, service providers, protocols, and data formats, which will affect the capability of integrating and processing. Thus, an effective solution has to be provided;
- Concern about preserving the privacy and security of users’ data who collaborate or use the suggested services in the framework;
- Utilize Blockchain as an important solution for providing trusted data and avoiding rumors during crises [38];
- Providing smarter services can be utilized in a disaster situation, such as support awareness, encouraging volunteers, supporting disabled users, etc.
4. Implementation and Results
- DT (Date);
- Temperature (Deg. c);
- Dry rate;
- Wet rate;
- Vapor rate;
- Humidity rate (%);
- Wind speed KTS/Deg;
- Pressure degree (hPa);
- Mean of sea level;
- Total rain amount (mm);
- Station level.
4.1. Data Preparation and Implementation
- Accuracy: is a popular machine learning model validation method used in evaluating classification problems and it is the rate of correct predictions over all test cases. For binary classification, as in our study, accuracy can also be calculated through pros and cons. However, when the class distribution is imbalanced, overall accuracy in machine learning classification models can be misleading, and correctly predicting the minority class is critical. In this case, the majority class may be correctly predicted, resulting in a high accuracy score, while the minority class is misclassified. This creates the false impression that the model is performing well when in fact it is not.
- Precision: It is called the Precision of Positive Observations because it represents the ratio of expected correct positive observations to expected total positive observations. It aids in measuring the model’s ability to classify positive samples. In terms of precision when calculating the precision of a model, we should take into account both positive and negative samples that are classified. A machine learning model’s precision is affected by both negative and positive samples.
- Recall (sensitivity): It is the ratio of correctly expected positive feedback to all actual observations (not just the positive). It allows us to determine how many positive samples the ML model correctly classified. When calculating a model’s recall, we only need all positive samples and ignore all negative samples. The recall is concerned with correctly categorizing all positive samples.
- F1-Score: It is the weighted average of precision and recall. Therefore, this result considers bogus pros and false cons and is better than the accuracy criterion when the distribution is unequal for the categories. It is also useful when false positives and false negatives have the same cost to the system. Otherwise, each criterion (precision and recall) is best viewed separately.
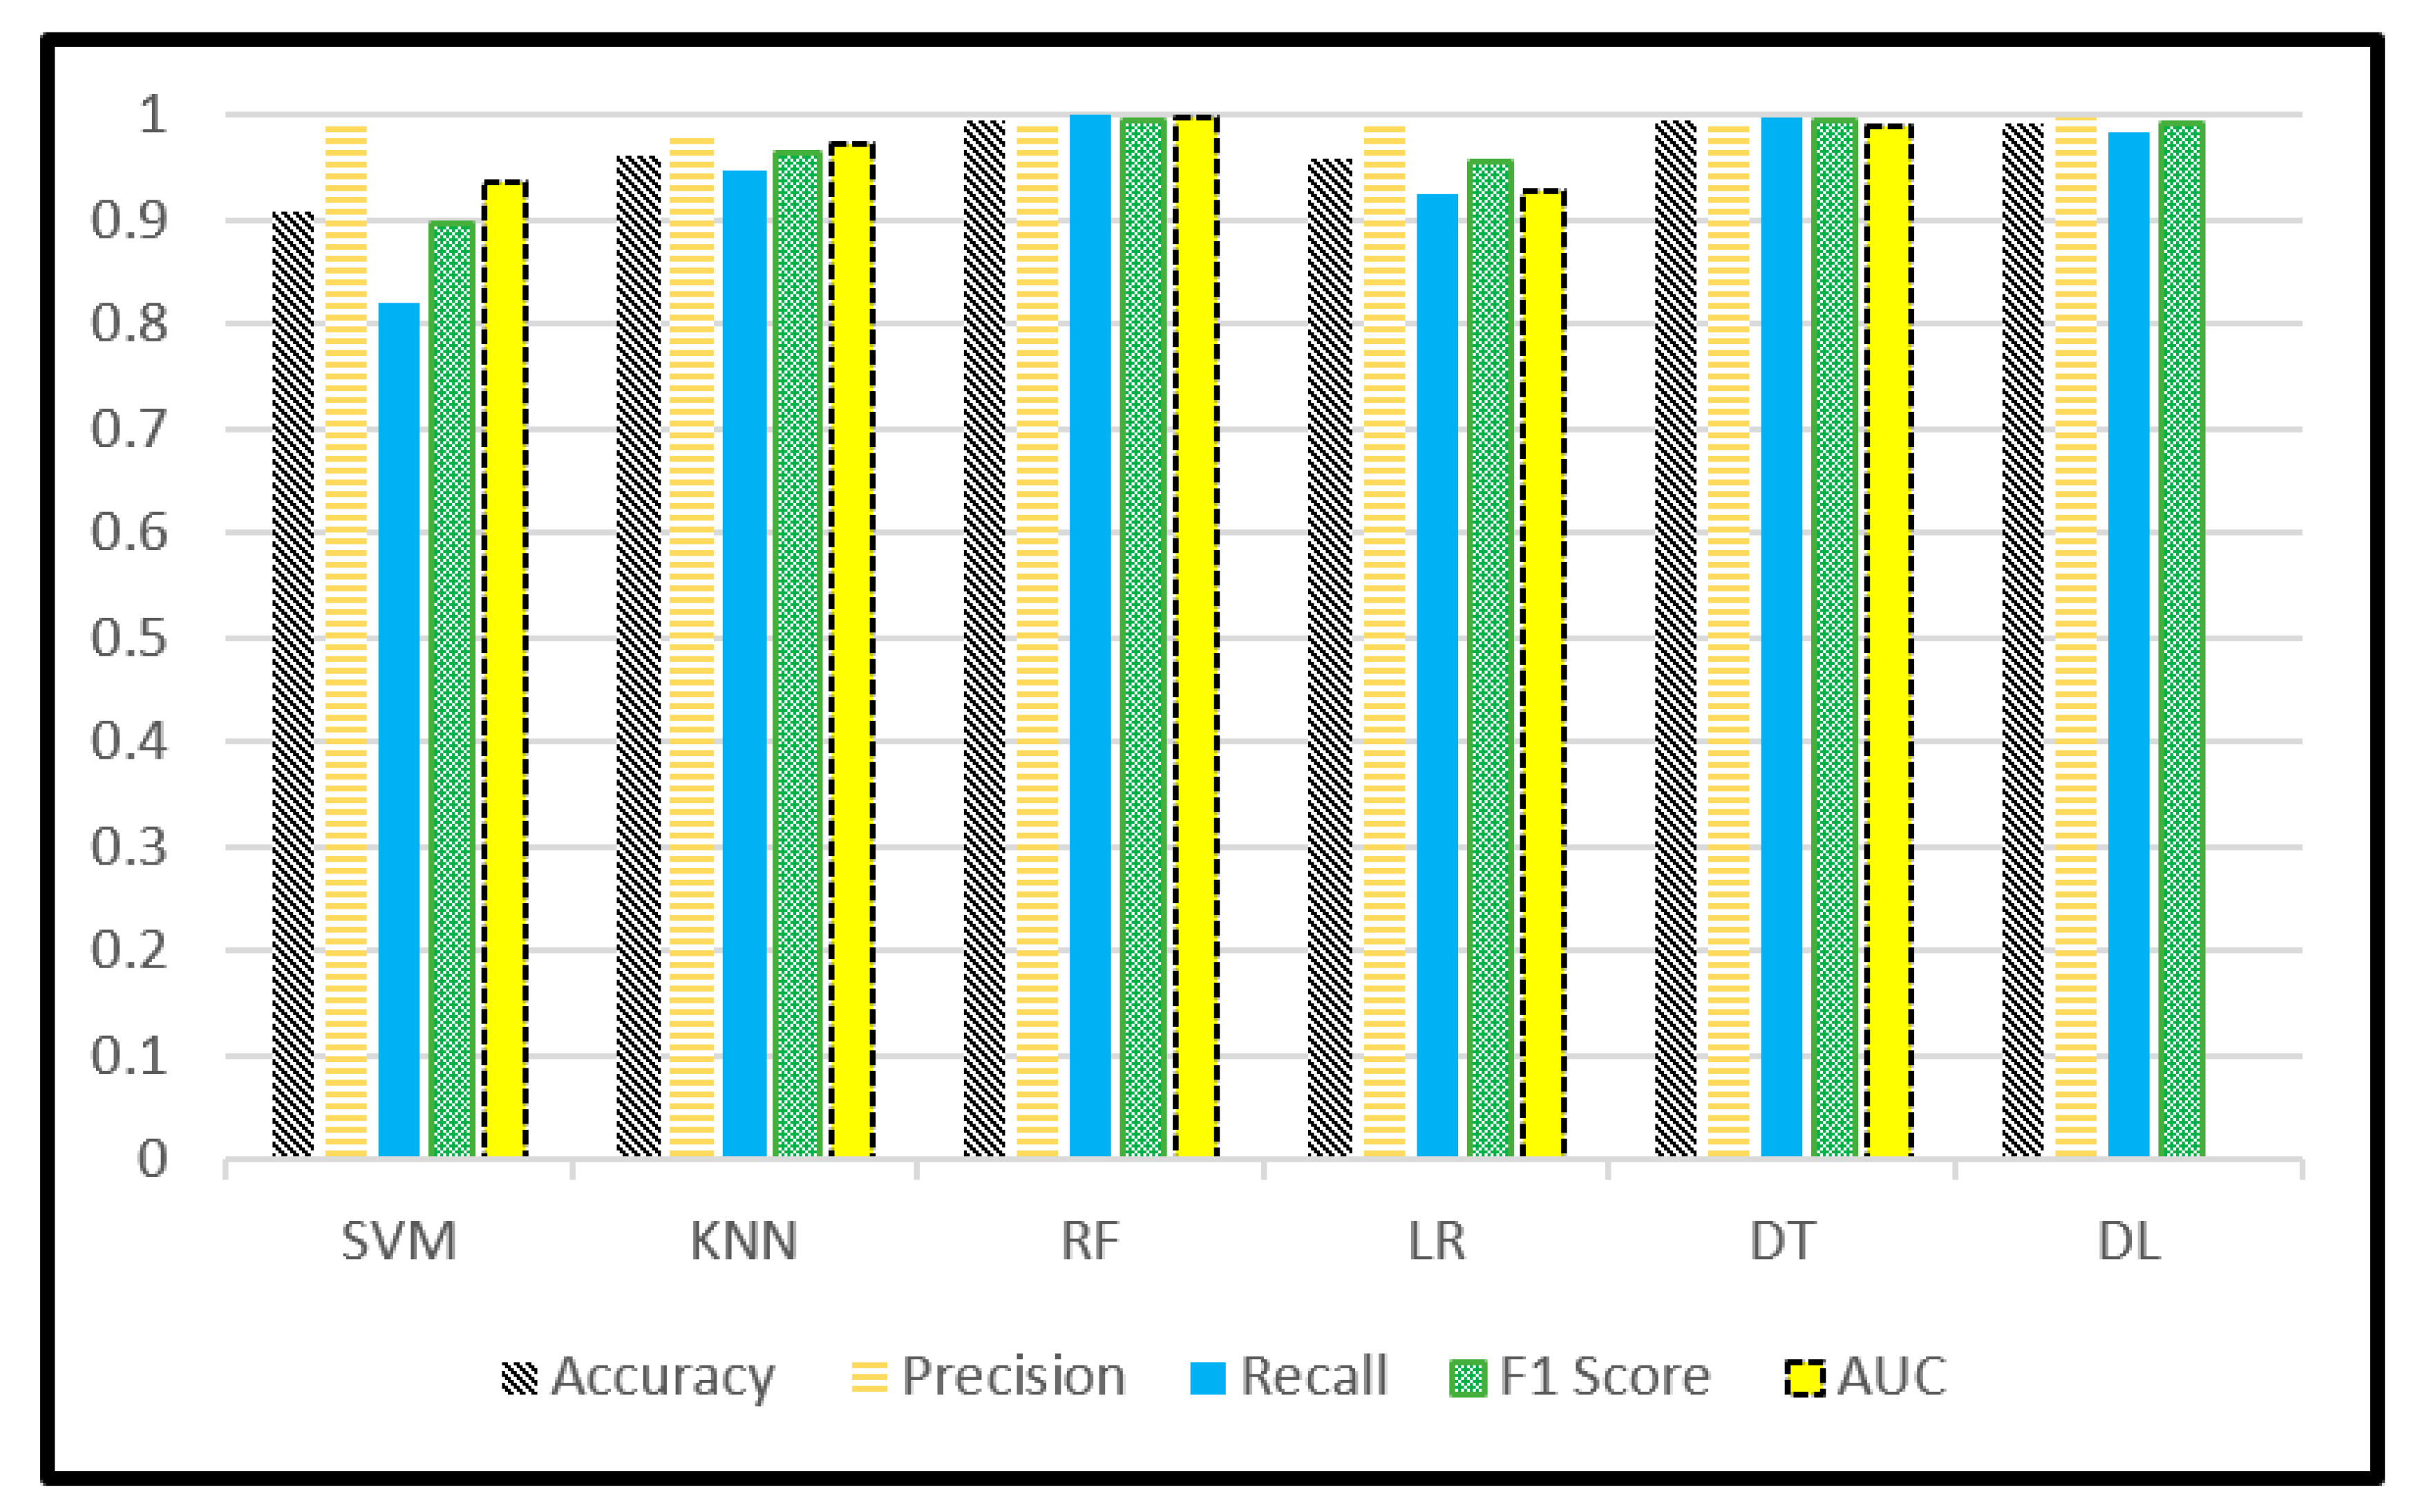
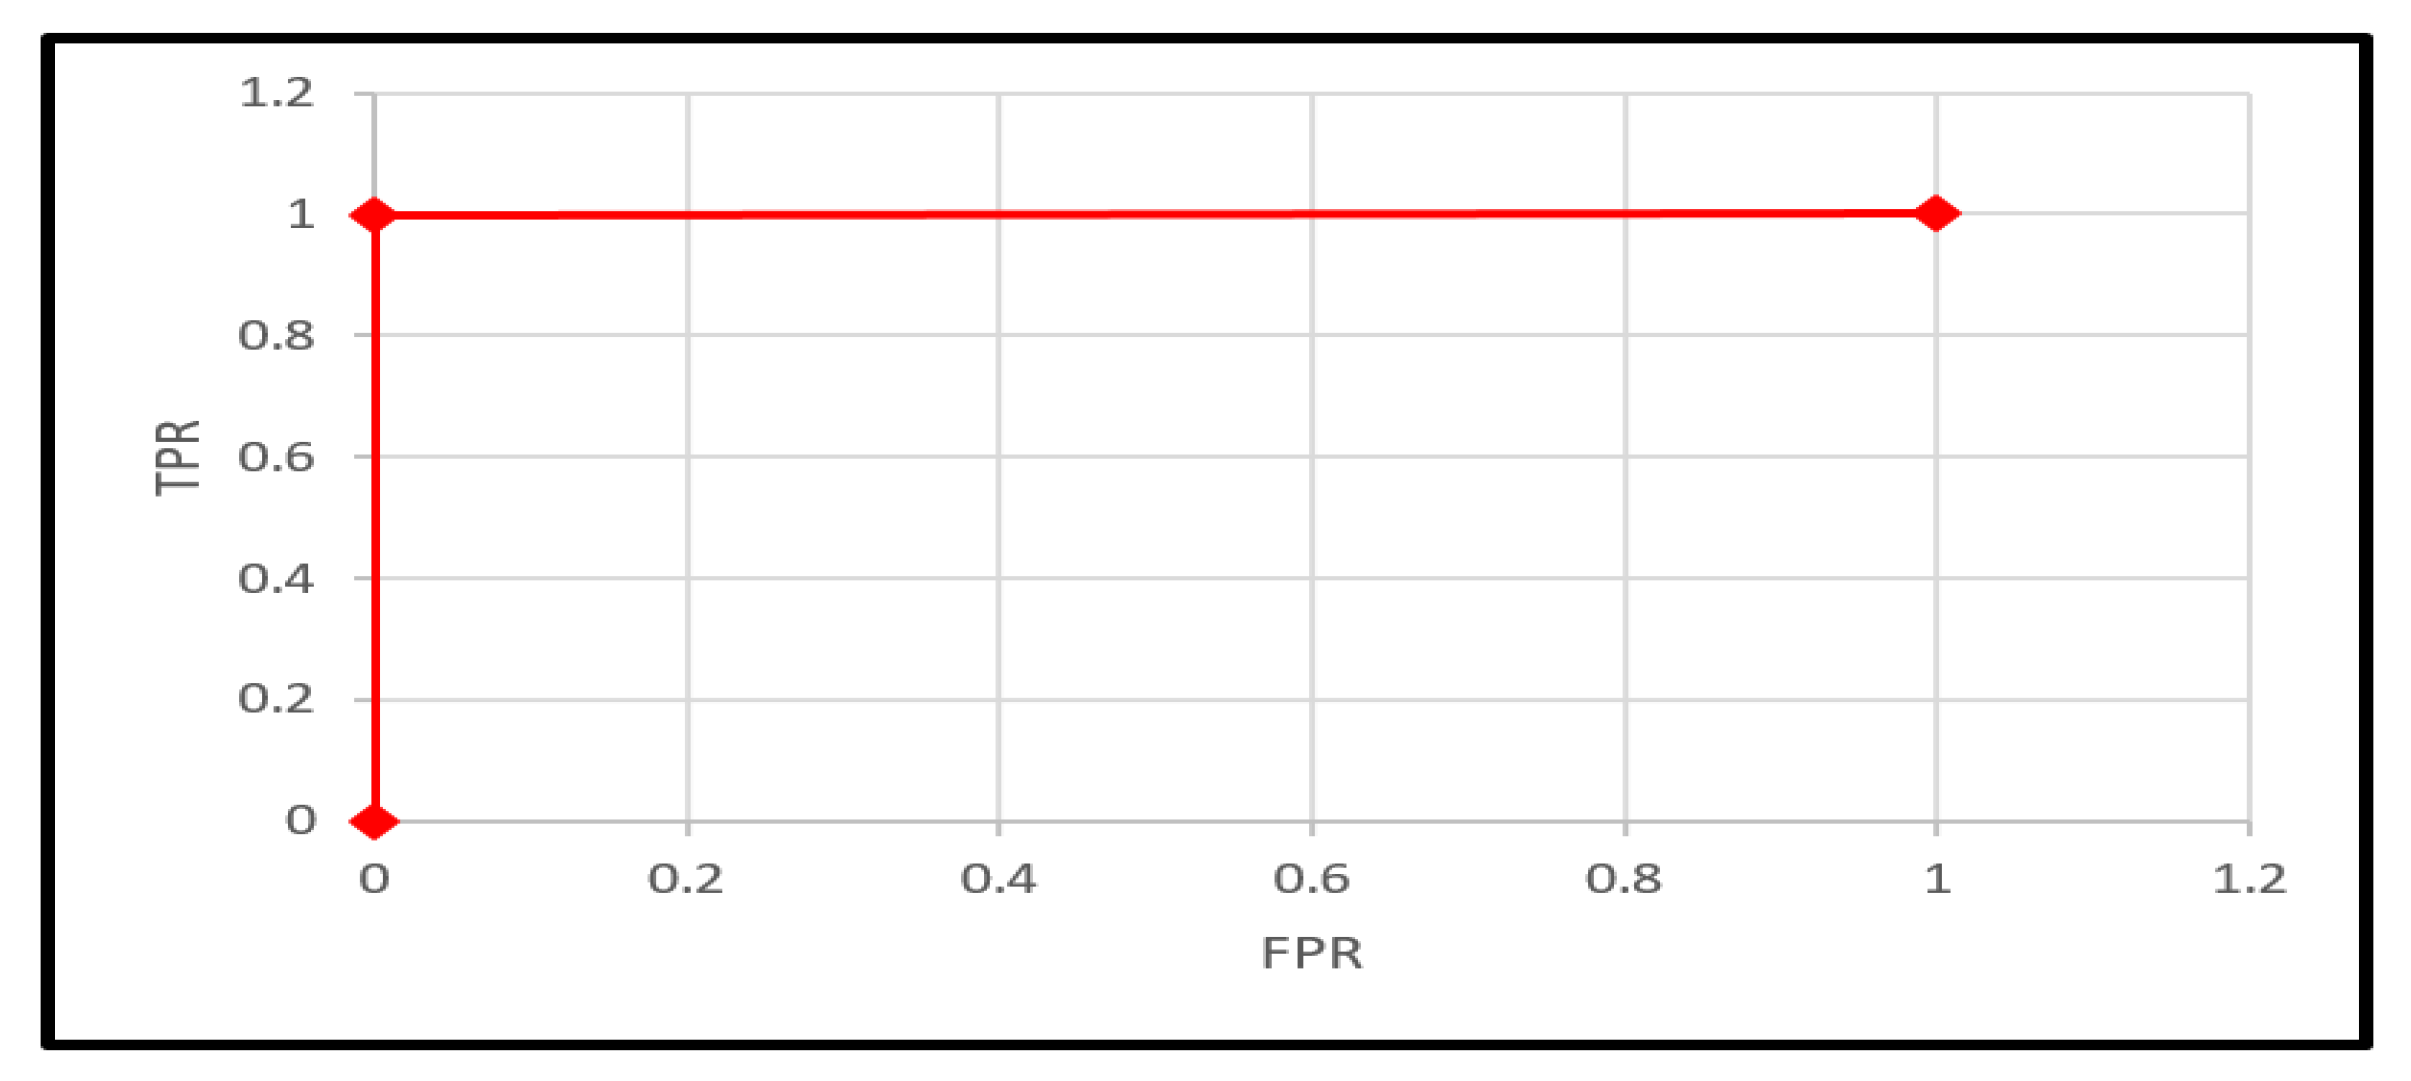
4.2. Results
5. Conclusions
Author Contributions
Funding
Institutional Review Board Statement
Informed Consent Statement
Data Availability Statement
Conflicts of Interest
References
- Al-Barazanchi, I.; Jaaz, Z.A.; Abbas, H.H.; Abdulshaheed, H.R. Practical application of IOT and its implications on the existing software. In Proceedings of the 2020 7th International Conference on Electrical Engineering, Computer Sciences and Informatics (EECSI), Yogyakarta, Indonesia, 1–2 October 2020; IEEE: New York, NY, USA, 2020; pp. 10–14. [Google Scholar]
- Mezzanotte, P.; Palazzi, V.; Alimenti, F.; Roselli, L. Innovative RFID sensors for internet of things applications. IEEE J. Microw. 2021, 1, 55–65. [Google Scholar] [CrossRef]
- Sen, A.A.A.; Eassa, F.A.; Jambi, K.; Yamin, M. Preserving privacy in internet of things: A survey. Int. J. Inf. Technol. 2018, 10, 189–200. [Google Scholar] [CrossRef]
- Bahbouh, N.; Basahel, A.; Sendra, S.; Sen, A.; Ahmed, A. Tokens shuffling approach for privacy, security, and reliability in IoHT under a pandemic. Appl. Sci. 2023, 13, 114. [Google Scholar] [CrossRef]
- Wang, Y.; Chen, X.; Wang, L.; Min, G. Effective IoT-facilitated storm surge flood modeling based on deep reinforcement learning. IEEE Internet Things J. 2020, 7, 6338–6347. [Google Scholar] [CrossRef]
- Huang, G.; Shen, Z.; Mardin, R. (Eds.) Overview of Urban Planning and Water-Related Disaster Management; Springer International Publishing: Cham, Switzerland, 2018. [Google Scholar] [CrossRef]
- Jung, D.; Tuan, V.T.; Tran, D.Q.; Park, M.; Park, S. Conceptual framework of an intelligent decision support system for smart city disaster management. Appl. Sci. 2020, 10, 666. [Google Scholar] [CrossRef]
- Nsabagwa, M.; Byamukama, M.; Kondela, E.; Otim, J.S. Towards a robust and affordable automatic weather station. Dev. Eng. 2018, 4, 100040. [Google Scholar] [CrossRef]
- Mahdavinejad, M.S.; Rezvan, M.; Barekatain, M.; Adibi, P.; Barnaghi, P.; Sheth, A.P. Machine learning for internet of things data analysis: A survey. Digit. Commun. Netw. 2018, 4, 161–175. [Google Scholar] [CrossRef]
- Khanh, Q.V.; Hoai, N.V.; Manh, L.D.; Le, A.N.; Jeon, G. Wireless communication technologies for IoT in 5G: Vision, applications, and challenges. Wirel. Commun. Mob. Comput. 2022, 2022, 1–12. [Google Scholar] [CrossRef]
- Puliafito, C.; Mingozzi, E.; Longo, F.; Puliafito, A.; Rana, O. Fog computing for the internet of things: A survey. ACM Trans. Internet Technol. (TOIT) 2019, 19, 1–41. [Google Scholar] [CrossRef]
- Sen, A.A.A.; Yamin, M. Advantages of using fog in IoT applications. Int. J. Inf. Technol. 2021, 13, 829–837. [Google Scholar] [CrossRef]
- Beltran, A., Jr.; Dizon, K.J.; Nones, K.; Salanguit, R.L.; Santos, J.B.; Santos, J.R. Arduino-based disaster management system. J. Robot. Control. (JRC) 2021, 2, 24–28. [Google Scholar] [CrossRef]
- Yamin, M.; Basahel, A.M.; Abi Sen, A.A. Managing crowds with wireless and mobile technologies. Wirel. Commun. Mob. Comput. 2018, 2018, 7361597. [Google Scholar] [CrossRef]
- Dano, U.L. Flash flood impact assessment in Jeddah City: An analytic hierarchy process approach. Hydrology 2020, 7, 10. [Google Scholar] [CrossRef]
- Adeel, A.; Gogate, M.; Farooq, S.; Ieracitano, C.; Dashtipour, K.; Larijani, H.; Hussain, A. A survey on the role of wireless sensor networks and IoT in disaster management. Geol. Disaster Monit. Based Sens. Netw. 2018, 3, 57–66. [Google Scholar] [CrossRef]
- Sciullo, L.; Trotta, A.; Di Felice, M. Design and performance evaluation of a LoRa-based mobile emergency management system (LOCATE). Ad Hoc Netw. 2020, 96, 101993. [Google Scholar] [CrossRef]
- Xu, J.; Ota, K.; Dong, M. Big data on the fly: UAV-mounted mobile edge computing for disaster management. IEEE Trans. Netw. Sci. Eng. 2020, 7, 2620–2630. [Google Scholar] [CrossRef]
- Ejaz, W.; Azam, M.A.; Saadat, S.; Iqbal, F.; Hanan, A. Unmanned aerial vehicles enabled IoT platform for disaster management. Energies 2019, 12, 2706. [Google Scholar] [CrossRef]
- Chamola, V.; Hassija, V.; Gupta, S.; Goyal, A.; Guizani, M.; Sikdar, B. Disaster and pandemic management using machine learning: A survey. IEEE Internet Things J. 2020, 8, 16047–16071. [Google Scholar] [CrossRef] [PubMed]
- Arinta, R.R.; Andi, E.W.R. Natural disaster application on big data and machine learning: A review. In Proceedings of the 2019 4th International Conference on Information Technology, Information Systems and Electrical Engineering (ICITISEE), Yogyakarta, Indonesia, 20–21 November 2019; Volume 6, pp. 249–254. [Google Scholar] [CrossRef]
- Ranasinghe, R.M.; Ilmini, W.M.K.S. Introducing a LSTM Based Flood Forecasting Model for the Nilwala River Basin with a Mobile Application—A Review. 2020. Available online: http://ir.kdu.ac.lk/handle/345/3039 (accessed on 1 January 2023).
- Widiasari, I.R.; Nugroho, L.E. Deep learning multilayer perceptron (MLP) for flood prediction model using wireless sensor network based hydrology time series data mining. In Proceedings of the 2017 International Conference on Innovative and Creative Information Technology (ICITech), Salatiga, Indonesia, 2–4 November 2017; IEEE: New York, NY, USA, 2017. [Google Scholar]
- Halgamuge, M.N.; Daminda, E.; Nirmalathas, A. Best optimizer selection for predicting bushfire occurrences using deep learning. Nat. Hazards 2020, 103, 845–860. [Google Scholar] [CrossRef]
- Martínez-Álvarez, F.; Morales-Esteban, A. Big data and natural disasters: New approaches for spatial and temporal massive data analysis. Comput. Geosci. 2019, 129, 38–39. [Google Scholar] [CrossRef]
- Nourani, V.; Uzelaltinbulat, S.; Sadikoglu, F.; Behfar, N. Artificial intelligence based ensemble modeling for multi-station prediction of precipitation. Atmosphere 2019, 10, 80. [Google Scholar] [CrossRef]
- Kang, J.; Wang, H.; Yuan, F.; Wang, Z.; Huang, J.; Qiu, T. Prediction of precipitation based on recurrent neural networks in Jingdezhen, Jiangxi Province, China. Atmosphere 2020, 11, 246. [Google Scholar] [CrossRef]
- Yao, C.; Ye, J.; He, Z.; Bastola, S.; Zhang, K.; Li, Z. Evaluation of flood prediction capability of the distributed Grid-Xinanjiang model driven by weather research and forecasting precipitation. J. Flood Risk Manag. 2019, 12, 12544. [Google Scholar] [CrossRef]
- Bukhari, A.H.; Sulaiman, M.; Islam, S.; Shoaib, M.; Kumam, P.; Raja, M.A.Z. Neuro-fuzzy modeling and prediction of summer precipitation with application to different meteorological stations. Alex. Eng. J. 2019, 59, 101–116. [Google Scholar] [CrossRef]
- Samikwa, E.; Thiemo, V.; Joakim, E. Flood Prediction Using IoT and Artificial Neural Networks with Edge Computing. In Proceedings of the 2020 International Conferences on Internet of Things (iThings) and IEEE Green Computing and Communications (GreenCom) and IEEE Cyber, Physical and Social Computing (CPSCom) and IEEE Smart Data (SmartData) and IEEE Congress on Cybermatics (Cybermatics), Rhodes, Greece, 2–6 November 2020; IEEE: New York, NY, USA, 2020. [Google Scholar]
- Hassan, W.H.W.; Jidin, A.Z.; Aziz, S.A.C.; Rahim, N. Flood disaster indicator of water level monitoring system. Int. J. Electr. Comput. Eng. 2019, 9, 1694. [Google Scholar] [CrossRef]
- Esposito, M.; Palma, L.; Belli, A.; Sabbatini, L.; Pierleoni, P. Recent advances in internet of things solutions for early warning systems: A review. Sensors 2022, 22, 2124. [Google Scholar] [CrossRef]
- Acosta-Coll, M.; Solano-Escorcia, A.; Ortega-Gonzalez, L.; Zamora-Musa, R. Forecasting and communication key elements for low-cost fluvial flooding early warning system in urban areas. Int. J. Electr. Comput. Eng. (IJECE) 2021, 11, 4143–4156. [Google Scholar] [CrossRef]
- Sankaranarayanan, S.; Prabhakar, M.; Satish, S.; Jain, P.; Ramprasad, A.; Krishnan, A. Flood prediction based on weather parameters using deep learning. J. Water Clim. Chang. 2019, 11, 1766–1783. [Google Scholar] [CrossRef]
- Ighile, E.H.; Shirakawa, H.; Tanikawa, H. Application of GIS and machine learning to predict flood areas in Nigeria. Sustainability 2022, 14, 5039. [Google Scholar] [CrossRef]
- El-Haddad, B.A.; Youssef, A.M.; Pourghasemi, H.R.; Pradhan, B.; El-Shater, A.H.; El-Khashab, M.H. Flood susceptibility prediction using four machine learning techniques and comparison of their performance at Wadi Qena Basin, Egypt. Nat. Hazards 2021, 105, 83–114. [Google Scholar] [CrossRef]
- Ke, Q.; Tian, X.; Bricker, J.; Tian, Z.; Guan, G.; Cai, H.; Huang, X.; Yang, H.; Liu, J. Urban pluvial flooding prediction by machine learning approaches—A case study of Shenzhen city, China. Adv. Water Resour. 2020, 145, 103719. [Google Scholar] [CrossRef]
- Waseem, M.; Khan, M.A.; Goudarzi, A.; Fahad, S.; Sajjad, I.A.; Siano, P. Incorporation of blockchain technology for different smart grid applications: Architecture, prospects, and challenges. Energies 2023, 16, 820. [Google Scholar] [CrossRef]
- Ali, H.; Salleh, M.N.M.; Saedudin, R.; Hussain, K.; Mushtaq, M.F. Imbalance class problems in data mining: A review. Indones. J. Electr. Eng. Comput. Sci. 2019, 14, 1560–1571. [Google Scholar] [CrossRef]


| Research | The Objectives | Used Model | Result | Limitation |
|---|---|---|---|---|
| [13] | To create a system that alerts users of possible disasters. | Arduino coupled with GSM and ZigBee | The developed system alerts users of possible disasters via messages. | The solution does not involve artificial intelligence and smart technologies. |
| [16] | To survey the role of roles of IoT and wireless Sensor Networks in disaster management. | IoT and Wireless Sensor Networks. | A comprehensive study detailing the application of IoT and WSN in disaster management is developed. | The systems discussed that utilize 4G suffer high packet loss. The systems using Lora WAN lacks robust fair data rate allocation and power control methods to address existing |
| [17] | To deploy next-generation phone-based ECS by using the LoRA technology for long-range, multi-hop communication among people involved in the emergency and rescue teams. | LoRa | A platform named LOCATE is developed for the purpose of deploying phone-based ECS. LOCATE is a self-localization algorithm implementing a trilateration technique, and a multi-hop dissemination scheme which combines probabilistic DTN and biased-contention mechanisms. | The LoRa communication model applied is characterized by huge delays thus the platform cannot support real-time requirements. |
| [18] | To develop a system that can collect and data while a in the air by means of aerial vehicles and long-distance transmission to offer new technical support for disaster management. | UAV Technology and mobile edge computing. | The study discovers the potential to combine UAV technology and Lora WAN communication into the implementation of MEC services for disaster management. | The UAVs have a higher energy consumption rate thus lower flying time. LoRa technology applied has delays thus may affect real time data relay and processing |
| [20] | The main objective of the paper is to provide a literature review of state-of-the-art machine learning algorithms for disaster and pandemic management | N/A | The study gets to discuss various ML algorithms, and models that can be used in different phases of disaster management to construct deployable models. | N/A |
| [22] | To review and choose a suitable model among different machine learning methods and algorithms, including artificial neural networks (ANN), support vector machine (SVM), multilayer perception (MLP), and long short-term memory (LSTM) which are used to forecast floods | Long short-term memory model of recurrent neural networks. | The study establishes that long short-term memory networks are better than ANN, MLP, and SVM because long short-term memory models can learn long-term patterns better | Lack of big data limits experimenting further on the model. |
| [23] | To compare neural network models used in hydrology data processing in flood prediction systems. | Multilayer perceptron (MLP) model | The research establishes that when compared to the multiple regression linier, MLP has better results in forecasting using hydrology data. | Lack of big data limits experimenting further on the model |
| [24] | To propose new approaches for spatial and temporal massive data analysis regarding natural disasters. | Neural network optimizers. | The resulting work provides a data collection model for disaster prediction, which could be utilized to collect climatic characteristics and topographical characteristics in with larger samples. | The model is unsuitable for less data. |
| [25] | To analyze new approaches for spatial and temporal massive data analysis with regards to natural disasters. | N/A | The paper proposes new approaches for data handling related to natural disasters | N/A |
| [28] | To apply a one-way coupled hydrometeorological modelling approach by using the WRF precipitation to drive a distributed hydrological model for flood simulation and forecasting. | Weather research and forecast model, Grid-Xinanjiang model | The study demonstrates the importance of temporal and spatial patterns in predicting the timing and magnitude of incoming floods | The uncertainties of coupled flood forecasting approach based on the GXM model and WRF forecasts remain unestablished. |
| [27] | To construct a LSTM model used in prediction of precipitation. | LSTM model | The recurrent neural network models, combined with meteorological variables, could predict the precipitation accurately in Jingdezhen City and provide sufficient time to prepare strategies against potential related disasters. | The developed model only works with large data thus unsuitable for less data. |
| [29] | To analyze the nonlinear autoregressive network with exogenous inputs (NARX) model for a time series to evaluate the pattern of precipitation | Nonlinear NARX network model | The research concludes that the performance of the NARX model is viable to capture nonlinear behavior with a high value of correlation | The implemented NARX model needs further improvements by accommodating evolutionary and fractional metaheuristic algorithm. |
| [34] | Verification of SVM, KNN, Bayes, and deep neural networks for flood prediction accuracy and error rate. | SVM, KNN, and Naïve Bayes | The deep neural network can be used efficiently and accurately for flood prediction based on monsoon parameters only prior to flood occurrence | The dataset used in research considered old data, dating back to 1990 to 2002 |
| [35] | Proving that machine learning techniques can accurately map and predict flood-prone areas and can be used to develop flood mitigation policies and plans | ANN and LR | We can quickly identify areas with high flood susceptibility using machine learning techniques and promote the development of policies and infrastructure that can reduce the potential effects of flooding. | The problem of availability of data between locations where flood historical, environmental, and hydrological data are scarce |
| [36] | Creating flood susceptibility maps by using ML models | RT, FDA, GLM, and MDA | Flood susceptibility areas have been identified in the study area | The model does not include the Internet of Things (IoT) to send early alerts. |
| [37] | ML models can predict the occurrence of urban pluvial flooding | ML models | Based on machine learning (ML) approaches, use a rainfall threshold to classify flood vs. non-flood events. | The model lacks using some techniques such as the Internet of Things for risk classification and sending early alerts to users and rescue teams |
| Date | Month (No) | Temperature (Deg. C) (M) | Humidity (%) (M) | Wind Speed KTS/Deg (M) | Sea Level Mean | Rain-Total Amount. (mm) | Class (Y) |
|---|---|---|---|---|---|---|---|
| 25 November 2009 | 11 | 25.5 | 84 | 7 | 1010.8 | 70.000 | 1 |
| 25 December 2010 | 12 | 25.0 | 53 | 6 | 1013.8 | 33.000 | 1 |
| 18 July 2011 | 7 | 34.4 | 57 | 7 | 1002.4 | 0.001 | 0 |
| 3 November 2012 | 11 | 29.5 | 62 | 4 | 1010.4 | 34.200 | 1 |
| 23 February 2013 | 2 | 25.3 | 65 | 4 | 1011.5 | 0.001 | 0 |
| 17 April 2018 | 4 | 29.8 | 61 | 5 | 1008.2 | 38.000 | 1 |
| 8 May 2019 | 5 | 30.0 | 58 | 8 | 1006.8 | 0.001 | 0 |
| 3 June 2020 | 6 | 30.3 | 59 | 9 | 1005.2 | 0.001 | 0 |
| 3 July 2021 | 7 | 42 | 70 | 16 | 1001.1 | 0.001 | 0 |
| 3 August 2022 | 8 | 46 | 65 | 9 | 1000.6 | 0.001 | 0 |
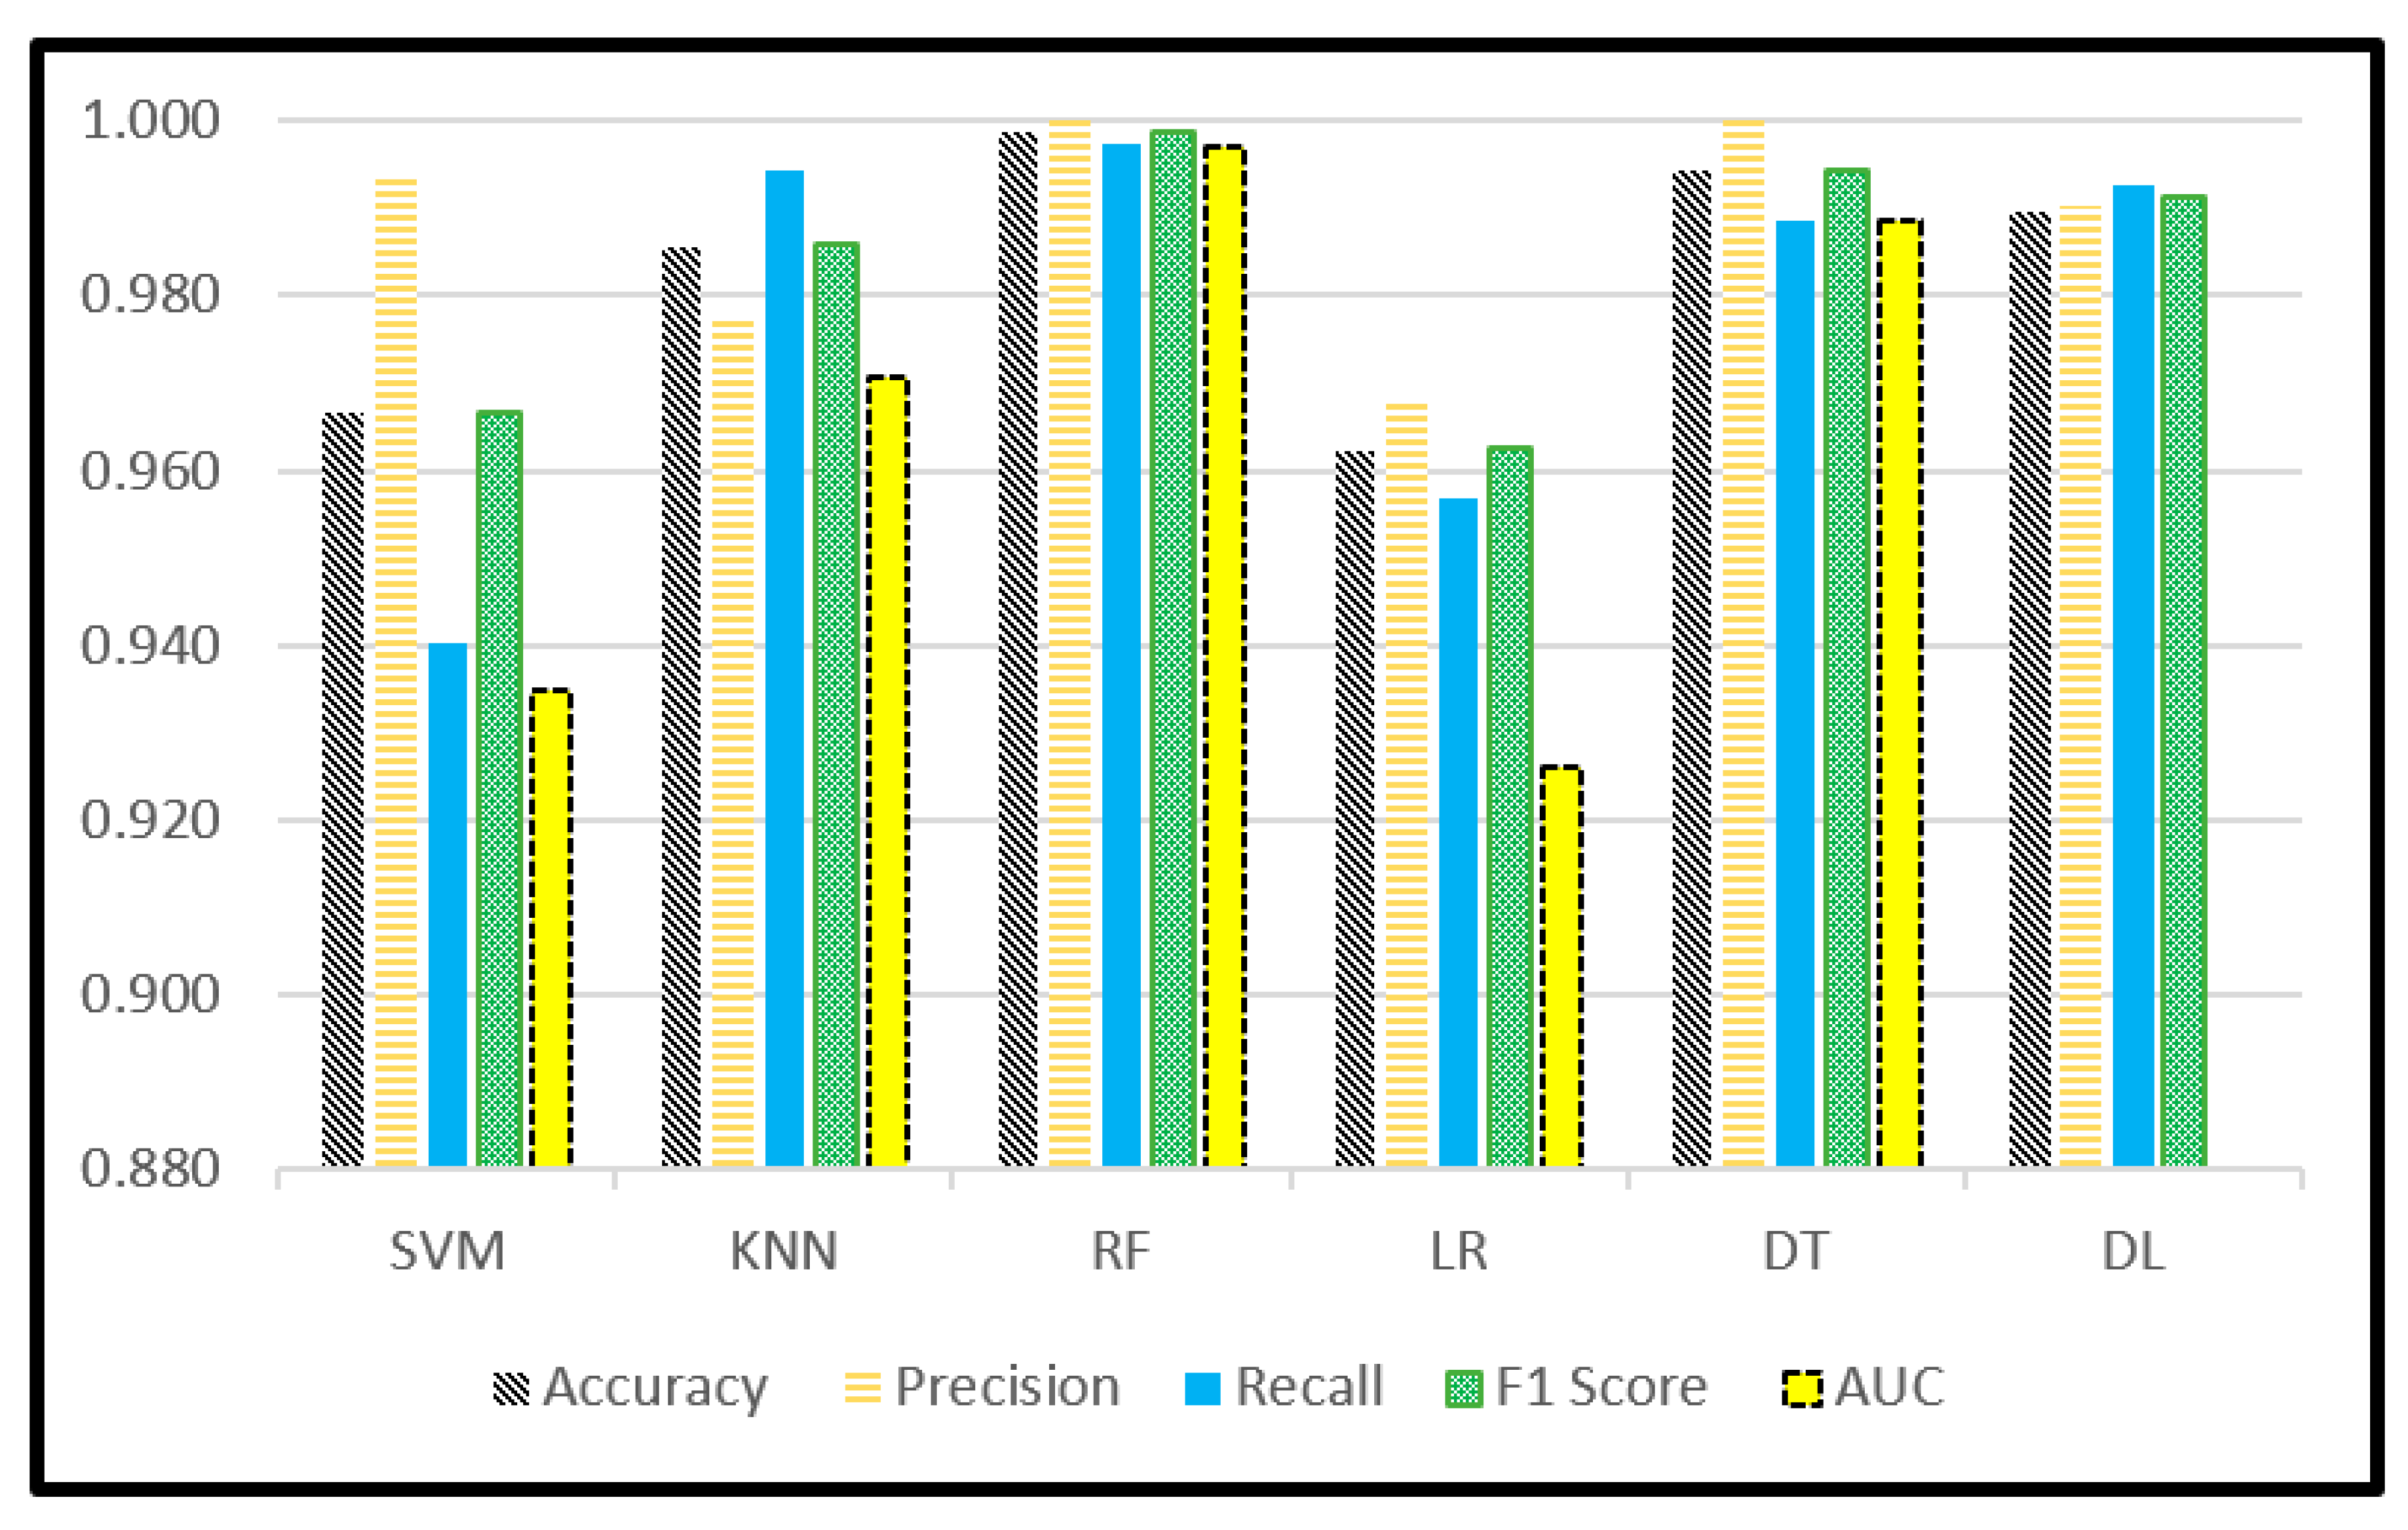
| ML Models | TP | TN | FP | FN | Accuracy | Precision | Recall | F1-Score | Time |
|---|---|---|---|---|---|---|---|---|---|
| SVM | 331 | 334 | 2 | 21 | 0.967 | 0.994 | 0.940 | 0.966 | >1 s |
| KNN | 350 | 328 | 8 | 2 | 0.985 | 0.978 | 0.994 | 0.986 | >1 s |
| RF | 352 | 335 | 0 | 1 | 0.999 | 1.000 | 0.997 | 0.999 | >1 s |
| LR | 333 | 329 | 11 | 15 | 0.962 | 0.968 | 0.957 | 0.962 | >1 s |
| DT | 348 | 336 | 0 | 4 | 0.994 | 1.000 | 0.989 | 0.994 | >1 s |
| DL | 2699 | 1690 | 27 | 20 | 0.989 | 0.990 | 0.993 | 0.991 | 42 s |
| ML Models | TP | TN | FP | FN | Accuracy | Precision | Recall | F1-Score | Time |
|---|---|---|---|---|---|---|---|---|---|
| SVM | 565 | 697 | 6 | 125 | 0.906 | 0.989 | 0.819 | 0.896 | >1 s |
| KNN | 675 | 666 | 16 | 37 | 0.962 | 0.977 | 0.948 | 0.962 | >1 s |
| RF | 691 | 697 | 6 | 0 | 0.996 | 0.991 | 1.000 | 0.996 | >1 s |
| LR | 638 | 697 | 6 | 53 | 0.958 | 0.991 | 0.923 | 0.956 | >1 s |
| DT | 689 | 698 | 5 | 2 | 0.995 | 0.993 | 0.997 | 0.995 | >1 s |
| DL | 3450 | 3457 | 6 | 55 | 0.991 | 0.998 | 0.984 | 0.991 | 160 s |
Disclaimer/Publisher’s Note: The statements, opinions and data contained in all publications are solely those of the individual author(s) and contributor(s) and not of MDPI and/or the editor(s). MDPI and/or the editor(s) disclaim responsibility for any injury to people or property resulting from any ideas, methods, instructions or products referred to in the content. |
© 2023 by the authors. Licensee MDPI, Basel, Switzerland. This article is an open access article distributed under the terms and conditions of the Creative Commons Attribution (CC BY) license (https://creativecommons.org/licenses/by/4.0/).
Share and Cite
Aljohani, F.H.; Abi Sen, A.A.; Ramazan, M.S.; Alzahrani, B.; Bahbouh, N.M. A Smart Framework for Managing Natural Disasters Based on the IoT and ML. Appl. Sci. 2023, 13, 3888. https://doi.org/10.3390/app13063888
Aljohani FH, Abi Sen AA, Ramazan MS, Alzahrani B, Bahbouh NM. A Smart Framework for Managing Natural Disasters Based on the IoT and ML. Applied Sciences. 2023; 13(6):3888. https://doi.org/10.3390/app13063888
Chicago/Turabian StyleAljohani, Fares Hamad, Adnan Ahmed Abi Sen, Muhammad Sher Ramazan, Bander Alzahrani, and Nour Mahmoud Bahbouh. 2023. "A Smart Framework for Managing Natural Disasters Based on the IoT and ML" Applied Sciences 13, no. 6: 3888. https://doi.org/10.3390/app13063888
APA StyleAljohani, F. H., Abi Sen, A. A., Ramazan, M. S., Alzahrani, B., & Bahbouh, N. M. (2023). A Smart Framework for Managing Natural Disasters Based on the IoT and ML. Applied Sciences, 13(6), 3888. https://doi.org/10.3390/app13063888