Abstract
Land degradation (LD) is a global issue that affects sustainability and livelihoods of approximately 1.5 billion people, especially in arid/semi-arid regions. Hence, identifying and assessing LD and its driving forces (natural and anthropogenic) is important in order to design and adopt appropriate sustainable land management interventions. Therefore, using vegetation as a proxy for LD, this study aimed to distinguish anthropogenic from rainfall-driven LD in the Greater Sekhukhune District Municipality from 1990 to 2019. It is widely established that rainfall highly correlates with vegetation productivity. A linear regression was performed between the Normalized Difference Vegetation Index (NDVI) and rainfall. The human-induced LD was then distinguished from that of rainfall using the spatial residual trend (RESTREND) method and the Mann–Kendall (MK) trend. RESTREND results showed that 11.59% of the district was degraded due to human activities such as overgrazing and injudicious rangeland management. While about 41.41% was degraded due to seasonal rainfall variability and an increasing frequency of droughts. Climate variability affected vegetation cover and contributed to different forms of soil erosion and gully formation. These findings provide relevant spatial information on rainfall or human-induced LD, which is useful for policy formulation and the design of LD mitigation measures in semi-arid regions.
1. Introduction
Land degradation (LD) is one of the most serious global environmental issues affecting over one billion people [1,2]. LD has a broad range of definitions that essentially describe circumstances of reduced biological productivity of the land. According to Weldemariam [3], LD is the prolonged reduction of ecosystem function and vegetation productivity of the land from which the land cannot recover unaided. Land degradation is one of the most pressing environmental and socioeconomic problems in arid and semi-arid regions, a problem that is set to worsen due to the anticipated vulnerability of drylands to climate change [4]. Hence, distinguishing between human-induced LD and climate induced LD and assessing its effects in arid lands is crucial for identify appropriate interventions, land management and restoration.
As aforementioned, LD can be caused by both anthropogenic and climatic factors. Anthropogenic drivers of LD include unsustainable land use practices (e.g., overgrazing and deforestation/wood harvesting) and other socio-economic drivers (e.g., inappropriate development policies) [5]. Climatic factors leading to LD include extreme and periodic climatic variations, i.e., droughts, mainly induced by precipitation and temperature [6,7]. In Africa, vegetation production in arid and semi-arid regions is closely linked to long-term average precipitation and inter-annual rainfall variability [8]. Several studies for instance have revealed that desertification in the Sahel region is mainly due to rainfall variations rather than human-induced LD [9,10]. In South Africa, native ‘‘homelands’’, typified by communal land use, are characterised by extensive degraded rangelands and severe soil erosion due to unsustainable anthropogenic activities, mainly overgrazing [11]. The spatial development framework of the Greater Sekhukhune District Municipality (GSDM) for instance reports that inappropriate agricultural practices, overgrazing and overstocking, especially in communal areas, are the main drivers of environmental degradation in the district [12]. Drought associated with unsustainable land use practices in arid and semi-arid regions has been reported to promote bush encroachment into rangelands, particularly in the savannah ecosystem, further degrading the land [13,14,15,16]. For instance, bush encroachment and alien species invasion reduce productivity of the rangeland ecosystem, and lead to LD, which affects livelihoods [16]. Hence, early detection of dryland degradation increases the success of the proposed interventions.
The GSDM experiences high climatic variability and extremes that alter the environment, influence LD and threaten livelihoods [17]. Therefore, it is essential to assess the dynamics of land degradation in the area to distinguish between human and rainfall induced LD. To achieve this, spatial monitoring systems are required to apportion anthropogenic and rainfall variability impacts on vegetation production [18]. However, there is a lack of robust data and methods to monitor and assess LD at local and regional scales [19].
In arid and semi-arid areas, the Normalized Difference Vegetation Index (NDVI) has been used as a proxy for LD as it strongly correlates with aboveground net primary productivity (ANPP) [20]. Studies have shown that vegetation growth and distribution at various spatial and temporal scales have been significantly affected by climate variability [8,18,21,22,23]. In these studies, rainfall was identified as the crucial climatic factor influencing vegetation production and was closely correlated with NDVI’s seasonal variability [22]. Consequently, rainfall is a crucial predictor of vegetation production.
Different applications have been used to monitor vegetation dynamics based on multi-temporal Advanced Very High-Resolution Radiometer (AVHRR) data [8]. In the past few decades, the increasing availability of long-term satellite time-series data has significantly benefited landscape monitoring and LD research [24]. However, whereas the accessibility of NDVI data from among others, the National Oceanic and Atmospheric Administration—Advanced Very High Resolution Radiometer (NOAA-AVHRR), has enabled intensive research on LD [25], the results are often dominated by erratic rainfall, associated changes in seasonality and drastic land cover or land use changes [8], which makes human and rainfall induced LD indistinguishable.
The residual trends (RESTREND) method is widely used to distinguish human-induced from rainfall-induced LD [8,20,26,27,28]. The RESTREND method can be used to reveal the spatial patterns of LD drivers at cell resolution. The method is based on the premise that water is the most limiting factor to vegetation productivity and there is a strong correlation between vegetation productivity and climatic variables in arid and semi-arid ecosystems [8]. Since vegetation productivity in drylands peak in high rainfall years, it is possible to factor out the effects of rainfall to understand the impacts of human-induced activities on the overall vegetation condition [8]. The RESTREND model reveals that human-induced LD can be detected when the significant effects of climate are removed from the long-term NDVI trends [8].
Land Degradation affects food security, regional economic development, and resource conservation strategies, necessitating urgency for LD monitoring systems. Apportioning various types of factors affecting vegetation degradation is central to socio-economic and environmental research in drylands and management [8]. However, there is still a dearth in literature that distinguishes LD arising from anthropogenic and climatic drivers i.e., rainfall. It is also evident from various LD studies that there is no agreement on the existence, location and degree of LD [8]. Hence, studies often end discussing the degree or even the reality of degradation [9,29].
There is an urgent need for an objective, measurable, repetitive, systematicand spatially and temporally explicit assessments of LD [30]. The long-term temporal and spatial reduction of vegetation productivity trend in drylands is regarded as an effective indicator of LD [31]. Even though previous studies measured and quantified degradation in drylands and semi-arid regions using vegetation greenness, climate change concerns, and its complexities have increased. With vegetation growth depending on rainfall in these ecosystems [32], NDVI trends in these areas tend to have varieties in magnitude and direction. Therefore, for meaningful mapping of consistent permanent LD, precipitation contribution has to be distinguished from human drivers. Moreover, in South Africa, previous and current policies have resulted in complex driving forces of LD. In the former homelands of South Africa, rural communal districts are experiencing challenges regarding land use conflicts due to dual administration systems that is evident in GSDM [12]. Thus, this study contributes to building a measure and understanding of LD by: (1) apportioning human and anthropogenic drivers of LD, thus identifying priority areas for specific sustainable land management (SLM) interventions; (2) assessing LD in rural communal districts under traditional leadership, which have not been fully studied by analysing different LD for various LULC units that has not been detected in a systematic way on a long-term and landscape scale. The aim of this study is, therefore, to distinguish between human-induced and rainfall-induced LD using the RESTREND method in the GSDM.
2. Materials and Methods
2.1. Study Area
The Greater Sekhukhune District Municipality study area within the Limpopo province—24°5′10″ S, 25°21′27″ S and 29°3′40″ E, 30°44′30″ E—is located in the northern part of South Africa in the Limpopo province (Figure 1). The district consists of four local municipalities (Elias Motsoaledi, Ephraim Mogale, Makhuduthamaga and Tubatse Fetakgomo) with a combined area of about 1,352,800 hectares. The total population is approximately 1,169,762 inhabitants, the majority of whom live in rural communal areas [33].
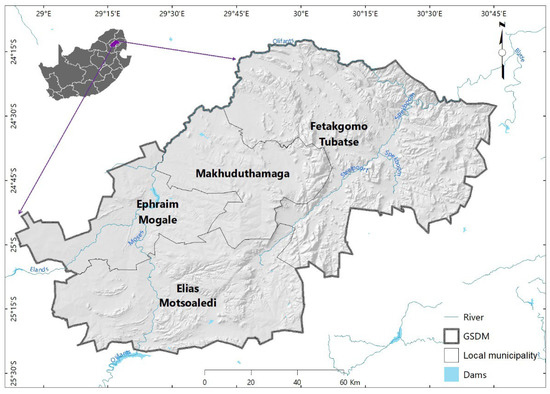
Figure 1.
The Greater Sekhukhune District Municipality (GSDM) and its four local municipalities.
The district is located in a semi-arid environment, with an average annual rainfall of 560 mm and moderate temperatures fluctuations with average summer temperatures of approximately 23 °C [34]. The ultramafic substrates (i.e., serpentine soils) of the Rustenburg geological formation dominate the area [35]. These soils are mainly characterised by low nutrient availability (e.g., nitrogen, potassium and phosphorus) and high concentrations of heavy metals (e.g., cadmium, zinc and nickel) [35]. The area is hilly to mountainous with an average altitude of 494 m above sea level [12]. Natural grassland, thicket, bushveld, bush clumps and high fynbos areas cover most of the district.
Agriculture dominates land use in the district, with commercial agriculture accounting for 7.7% of the district and subsistence farming 18.1% [36]. However, most cropland has been abandoned and water scarcity, land conflicts, a high number of land claims, and inappropriate infrastructure and services threaten future agricultural productivity in the area [12]. Unlimited access to communal grazing and a lack of fencing around fields exacerbate land degradation due to low herbaceous basal cover [37].
2.2. Data Collection
2.2.1. NDVI Dataset
The Normalized Difference Vegetation Index (NDVI) data obtained from satellite images is an important proxy to show the dynamics of vegetation production in response to climate variability and drought conditions [38]. NDVI data obtainable from NOAA-AVHRR sensors is used in various studies to analyse the dynamics and trends of vegetation production in different regions [10,39,40]. NDVI is computed using Near-InfraRed (NIR) and the visible RED spectral bands because healthy vegetation highly reflects in the NIR and absorbs in the RED bands, respectively [41].
The values range from −1 to +1, with high values representing healthy/active vegetation while non-vegetated surfaces such as water bodies, bare land/rocks are represented by negative NDVI values [8].
NDVI satellite data from the AVHRR NOAA weather satellites (https://www.ncei.noaa.gov/data/avhrr-land-normalized-difference-vegetation-index, accessed on 23 June 2021) were used in this study. The data contains gridded daily NDVI from the NOAA Climate Data Record (CDR) of AVHRR Surface Reflectance. While NDVI derived from the Global Inventory Monitoring and Mapping Studies (GIMMS) database is widely used [10], the NDVI derived from the NOAA CDR database was used due to limited access to the GIMMS dataset. Furthermore, NOAA CDR NDVI data has a 5 km spatial resolution unlike GIMMS, which has an 8 km spatial resolution. Moreover, the NOOA CDR dataset has better geolocation accuracy and use the centre of each grid as reference for consistency with other heritage records [42]. The study acquired NDVI data from 1990 to 2019 at 0.05 (5 km) spatial resolution, 1-day temporal resolution and projected on a 0.05-degree × 0.05-degree global grid [42]. NDVI from the growth season (October to April) was used in this study as it represents vegetation growth status and is highly correlated with the growing season rainfall [8,43,44]. The NDVI data was then weighted by number of days acquired for each growing season.
2.2.2. Rainfall Dataset
A satellite-based rainfall dataset from Precipitation Estimation of Remotely Sensed Information using Artificial Neural Networks—Climate Data Record (PERSIANN-CDR) [45] was acquired for the study. The data were developed by NOAA’s Centre for Hydrometeorology and Remote Sensing (CHRS) and includes daily precipitation estimates from geostationary satellites based on a neural network algorithm derived from daytime visible and infrared imagery [45]. PERSIANN-CDR dataset spatial resolution is 0.25° in latitude. Ashouri [45] compared PERSIANN-CDR with ancillary rain gauge data and concluded that the former dataset can be used to monitor rainfall and assess contributing factors to changes in the rainy season due to their good performance and long temporal coverage (more than 30 years). The mean rainy season rainfall data during the study period 1990–2019 for the GSDM was downloaded (https://chrsdata.eng.uci.edu/, accessed on 15 March 2022) and resampled to the spatial resolution of 0.05° of NDVI data using ArcGIS 10.7.
2.2.3. Land Use and Land Cover and Change Dataset
Land use and land cover (LULC) change is known to have a number of negative impacts on the environment [46] and vegetation dynamics are strongly influenced by anthropogenic land use and climate drivers [47]. Hence, LULC and land cover and change data were used to analyse trends in vegetation in response to different LULC classes and changes using LULC conversion data.
Given that long-term monitoring is required, good quality (less than 10% cloud cover) wet season Landsat satellite images with 30 m spatial resolution were obtained from the United States Geological Survey (USGS) Global Visualization Viewer (http://glovis.usgs.gov/, accessed on 18 January 2020) dataset for years 1990, 1995, 1999, 2005, 2010, 2015 and 2019. However, due to data availability, some years close to the study period were downloaded and only one image had cloud cover of 14%.
The South African national standard for Land Cover Classification System [48] was used to map the existing LULC in the study area (Table 1). The broad hierarchical level 1 was used on the Landsat images to identify the existing LULC. Since the study aims to investigate whether degradation in the district is induced by humans or rainfall, the level 2 and 3 classes were used to identify barren, cultivated and residential land for detailed mapping.

Table 1.
LULC classes and their descriptions (Department of Rural development and Land Reform, 2019).
The satellite images were pre-processed for radiometric and geometric anomalies and re-projected [49]. Landsat images were geo-referenced using the Georeferencing tool in ArcGIS 10.7 to correct false changes in the seasonal LULCC and images radiometrically corrected to improve image quality using histogram equalization. Colour balancing was applied using the colour corrector tool and balanced using the first order dodging method, while supervised classification was used to generate unique LULC classes. Classification accuracy was assessed based on a transition matrix.
2.3. Data Analysis
The RESTREND method assumes that vegetation production has a strong relationship with climate factors, mainly rainfall, hence it was applied to detect the natural impact on vegetation production over a period of time [8,26]. The RESTREND method is an effective tool to differentiate between the impacts of climate factors (rainfall) and anthropogenic activities on vegetation changes, where negative values represent degraded areas, while positive values mean vegetation improvement [27]. In the case of a significant decrease in residuals, the degradation of vegetation is human-induced [20], while an insignificant increase or no trend in residuals means that NDVI variations are due to climatic variables [28].
2.3.1. Regression Analysis
The regression analysis of NDVI against rainfall was preformed using a pixel-wise ordinary least square (OLS) regression model using the R-Studio statistical software package. The pixel-wise OLS model is a statistical method that models linear relationships between a response and one or more predictor variables. The OLS reduces the error/residual sum of the squares and is used in various environmental studies [50]. The RESTREND method measures the linear relationship between an independent variable (x) and a dependent variable (Y) and is represented by the equation:
where: Y represents the response variable (NDVI), m is the gradient (slope), x is the predictor variable (rainfall), c is the intercept. Per unit change of x, e represents the error for every change of x.
The widely used RESTREND method carries out the following steps: (1) modelling a pixel-wise OLS regression between the wet season observed NDVI and rainfall per pixel; (2) deriving the difference in residuals between the observed and predicted sum of NDVI (predicted by rainfall) from the linear model; and (3) running a new OLS regression to model the residuals against time, representing a residual trend (RESTREND). The residual trends represent changes in vegetation production that are not explained by rainfall and these are interpreted as a proxy for LD [51].
2.3.2. Mann–Kendall Non-Parametric Trend Analysis Applied on RESTREND
The Mann–Kendall (MK) trend, a robust non-parametric statistical method, was used to investigate RESTREND in the study area. The MK’s coefficient calculates the consistency of the increasing or decreasing trend and is often used in environmental studies [8]. MK trend analysis was applied to test the magnitude and significance of the slope to determine whether LD in the district was influenced by human activities or rainfall. Theli-Sen (Sen) slope estimates the magnitude of the residual trend and is insensitive to outliers [20]. The MK test is calculated with a statistic S formula:
where: N is the numerical data points, Xk and Xj are the values at time k and j (k > j), respectively, sgn represents sign [52].
The Sen’s slope estimator determined the magnitude of the trend in NDVI or rainfall data. The Sen’s slope test calculates the linear rate of change and the intercepts using the following formula:
where: ST = slope, m = median, n = number of data points and k, j = indices.
where: r = median STk (median from all slopes) with intercepts computed for every time steps t and p is the intercept.
Sen’s slope estimates the magnitude of increase or decrease in NDVI and rainfall per year. The MK significance test was used to test the statistical consistency of the Sen’s slope trend at a 95% confidence interval (p = 0.05) [20]. The MK trend test is widely used in the literature and is less sensitive to outliers, missing values and irregular data distribution [53].
3. Results
3.1. NDVI and Rainfall MK Trends
NDVI and rainfall trends were analysed using the MK test for the periods 1990–2019 to determine if the trend was significant, while the Theli-Sen (Sen’s slope) was used to determine the magnitude of the trend based on the positive or negative Sen’s slope estimator. The Sen’s slope was used because it is insensitive to small outliers and missing confounding values.
3.1.1. NDVI MK Trends
Figure 2 below shows the temporal NDVI MK trend of 30 years in GSDM computed for the wet season. The dots in the figure represent daily wet season NDVI values weighted by the number of days acquired, while the grey-shaded area represents the values that mainly contributed to this NDVI trend. The MK test shows that the NDVI in the GSDM decrease with a Kendall’s Tau (indicated as R) of 0.016 (Figure 2).
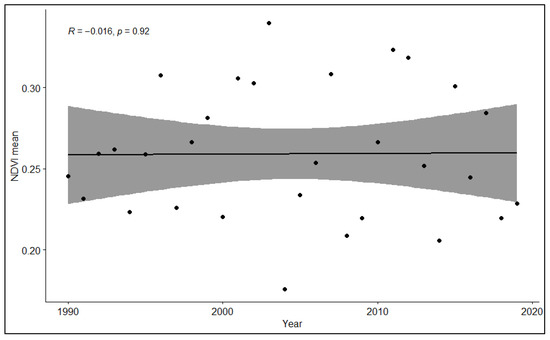
Figure 2.
Wet season NDVI trend magnitude (Sen’s Slope) between 1990–2019.
The Sen’s slope estimator indicates that the magnitude of NDVI for the whole district slightly decreased with a Sen’s slope of −0.0003. However, the decrease in NDVI is not significant as the p-value is above 0.05 (p-value = 0.92) (Figure 2). The trend shows that the lowest recorded NDVI occurred in 2000, 2004, 2008, 2009, 2014, 2008, 2009 and 2018 and that some of these NDVI decreases occurred during drought events in the district [17].
The spatial MK trend was performed to determine which areas experienced significant NDVI changes. The results are shown in Table 2 and these represent summary statistics of spatial the NDVI MK trend.
Table 2.
NDVI MK Spatial statistics on significance of magnitude MK.
Sen’s slope magnitude values reflect near constant vegetation changes (Table 2). The results show that 45.96% of the district experienced a decrease in vegetation cover (Figure 3a and Table 2). However, only 0.62% of the area has a significantly decreasing vegetation cover.
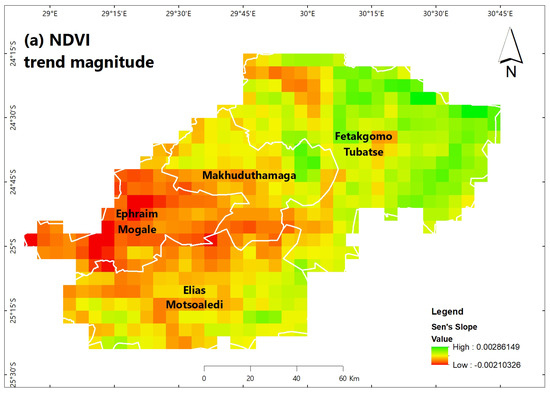
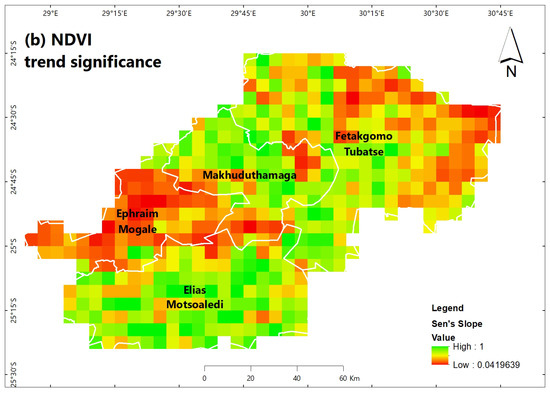
Figure 3.
NDVI MK test trend magnitude (Sen’s Slope) (a) and trend significance (p-value) (b) between 1990−2019.
The decreasing NDVI trend was particularly observed in the central to southwestern part of the district in Ephraim Mogale local municipality (Figure 3a) with a Sen’s slope of −0.001 and p value of 0.28. NDVI trend magnitude slightly increased, particularly in the northern to north-western part of the district (Figure 3a) in Fetakgomo Tubatse local municipality with Sen’s slope of 0.0008 and p value of 0.51.
Approximately 53.83% of the GSDM recorded slightly increasing NDVI trends and no area experienced significantly positive NDVI trends. These results show that the vegetation in Fetakgomo Tubatse local municipality slightly improved compared to other local municipalities, but the increase in vegetation production was not significant.
3.1.2. Rainfall MK Trends
Figure 4 below shows temporal MK trend for rainfall over the past 30 years. The dots shown in the figure represent rainfall values for wet season rainfall weighted by the number of days acquired, while the grey-shaded area represents the values that mainly contribute to the rainfall trend. Analysis of Sen’s rainfall trend shows an overall decrease of −3.083, Kendall’s Tau of −0.14 and an insignificant trend with a p-value of 0.27.
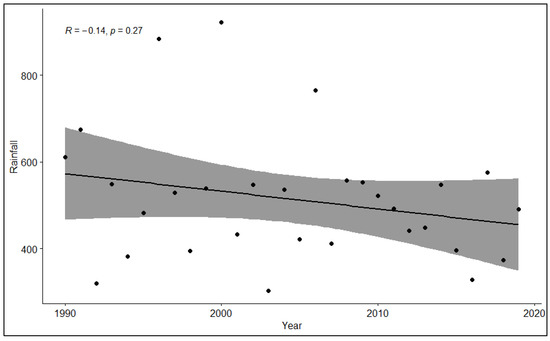
Figure 4.
Wet season Rainfall trend magnitude (Sen’s Slope) between 1990–2019.
The rainfall trend shows that rainfall in the district varied greatly due to periods of high and low rainfall, hence the p-values are not significant.
The spatial MK test and Sen’s slope show that rainfall is decreasing in the whole district as all the Sen’s slope values are negative (Figure 5a). The declining magnitude of the rainfall was much higher than that of vegetation, which indicates that rainfall has decreased more than vegetation in the district. This could mean that there are indigenous vegetation species resistant to drought or the growth of alien invasive species that cause bush encroachment. However, the decrease in rainfall is not significant as the p-values are above 0.05 (Figure 5b).
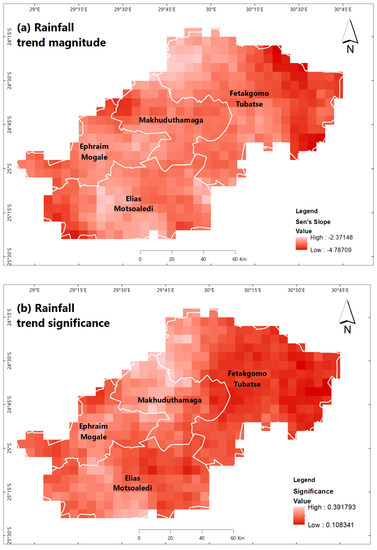
Figure 5.
Rainfall MK test trend magnitude (Sen’s Slope) (a) and trend significance (p-value) (b) between 1990–2019.
The spatial Mann–Kendall trend shows that the north-eastern part of the district (Fetakgomo Tubatse local municipality with a record of −3.61 Sen’s slope) has the largest share of the decrease in rainfall, including the south-western part of the district. The north-western and southern parts of the district also show that rainfall is decreasing but the magnitude is lower than in the north-eastern and south-western parts of the district (Figure 5a).
3.2. Land Use and Land Cover NDVI MK Trends
The MK trend was computed for the LULC types found in the district, as significant changes in NDVI are often due to a change in land cover [46]. The NDVI MK trend results computed for each LULC class are presented in Table 3. MK results show a non-significant trend as the p-values are above 0.05. This could be attributed to extreme climatic events, high climatic variability and change, particularly rainfall variability, which contributed to the insignificant increase in NDVI Sen’s slope (Table 3). Wet season NDVI shows a downward trend in commercial cultivation, shrub/grassland and subsistence cultivation, residential area and industrial land as Sen’s slope is negative.
Table 3.
NDVI MK Trend Test per Land Use and Land Cover type.
These decreasing trends are indications of a degrading landscape as this was also detected in the 14 most common LULC conversions computed (Table 4). The conversions (Table 4) were computed by classifying wet and dry LULC on Landsat images over five-year intervals and conversions derived using change detection and transition matrix. Shrub/grassland areas show a strong loss of vegetative biomass, and these areas are converted to bare soil, eroded land or residential area. Bare/exposed rock, eroded land, subsistence cultivation, thicket/dense bush and industrial land recorded a slightly increasing trend with positive Sen’s Slope.
Table 4.
The 14 most common LULC conversions, periods, and seasons.
3.3. RESTREND Analysis
The RESTREND of the NDVI time series was modelled by determining the difference between the observed NDVI and the NDVI predicted by rainfall. The dots in the figure represent NDVI residuals against rainfall, values mainly contributed to the trend are reflected in the grey-shaded area. The RESTREND analysis was performed by firstly running the linear regression models of NDVI against rainfall and then analysing the residual NDVI trend over time (Figure 6).
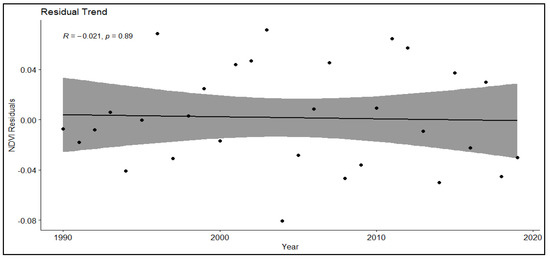
Figure 6.
Temporal trend of NDVI residuals between 1990–2019 averaged over all the pixels in the district, adjusted for rainfall.
The results show that the negative residual trend R-value of −0.021 with a Sen’s slope of −0.00018 (Figure 6) and indicates degradation of the GSDM vegetation. The p-value of 0.89 obtained in the residual trend means that LD in the district is due to rainfall. A strong negative decline in NDVI residuals, for instance, in 1994, 2004, 2008, 2014, and 2018, could indicate human-induced degradation. On the other hand, the strong positive spike of NDVI, in 1996, 2003 and 2007 could be due rainfall variability in the area.
The RESTREND was spatially analysed to show areas with significant positive or negative trends in residual NDVI using the MK trend. These areas show vegetation change dynamics caused by factors other than rainfall variability i.e., human activities, through an overlay process of negative residual NDVI that is significant. The summary statistics of residual trend of NDVI against rainfall are presented in Table 5.
Table 5.
Statistics of MK NDVI RESTREND analysis.
Areas with an insignificant residual trend or no trend are explained by rainfall changes, while the significant negative (degraded) and positive (improved) vegetation production changes reflect changes induced by anthropogenic activities. Figure 5 represents spatial NDVI RESTREND Spatial RESTREND analysis which revealed that the NDVI residual trend magnitude decreased mostly in the central to the western part of the district by 53%, then increased in the north to the western part of the district by 40.99% (Figure 7 and Table 4). This shows that more than half of the district is experiencing forms of vegetation degradation.
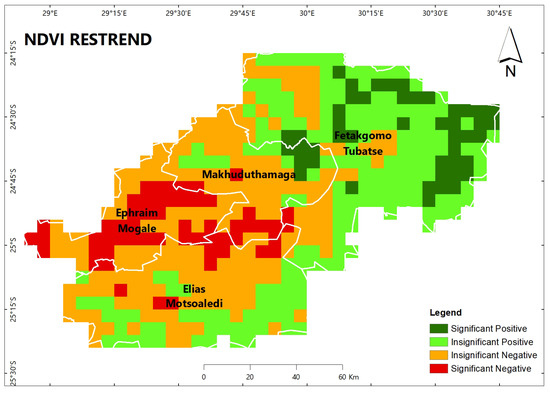
Figure 7.
Spatial NDVI RESTREND pattern.
Areas that experienced significant a decrease of NDVI RESTREND are in the central to western part of the district (Ephraim Mogale and Makhuduthamaga local municipalities) by 11.59%. In the northern to eastern part of the district, in the Fetakgomo Tubatse local municipality, a significant increase of 9.52% was recorded, implying that vegetation has improved due to other reasons besides rainfall. Most of the degradation in the district is due to rainfall.
4. Discussion
The aim of this study was to apportion human- and rainfall-induced LD in the GSDM using the RESTREND method. To achieve this, the study assessed vegetation growing season trends in NDVI and rainfall to ascertain LD and analysed NDVI trends in different LULC classes to describe and explain the changing spatial and temporal patterns of vegetation. The study then distinguished between human-induced and rainfall-induced LD within the study area.
4.1. Trends of Vegetation Production and Rainfall
A non-parametric method, the MK test, was applied to understand vegetation trends in the GSDM. There has been an overall decline in vegetation cover in most areas over the last 30 years, indicating that the district is facing degradation. There were negative NDVI trends in most parts of the district (about 45%), although only 0.65% were significant. Vegetation change is considered an indicator of environmental changes that have serious ecological consequences for the district and thus have negative impacts on ecosystem functioning, energy balance, biodiversity and land–atmosphere interactions [54]. A positive NDVI trend indicates that the ecology and ecosystem conditions have improved. The study found that productivity is increasing in other parts of the district (about 53%), but the trends are not significant.
The district experienced decreasing rainfall over the 30-year period, however these trends were not significant. The Fetakgomo Tubatse local municipality and some parts of Elias Motsoaledi local municipality recorded the greatest decrease in rainfall, while vegetation production showed improvements. This could be due to bush encroachment and alien invader plants observed during field visits that might contribute to the increase in NDVI, in low rainfall areas [13,55]. Bush encroachment affects agricultural activities and savannah ecosystems and as such it is important to understand the reasons for bush encroachment under decreasing rainfall in these areas to improve vegetation production conditions by identifying appropriate SLM measures [56].
4.2. Vegetation Trends on LULC Classes and Impacts of LULC Changes on Vegetation
Information on LULC changes is important to understand the reasons for changes in vegetation biomass [46]. The declining vegetative biomass observed in commercial cultivation, shrub/grassland and subsistence cultivation and residential areas suggests several reasons for the changes in vegetative biomass in the district. The decline in NDVI in commercial cultivation could be due to land tenure conflicts following the land redistribution programme in the GDSM [12], which has resulted in land lying fallow. The vegetation decline in subsistence cultivation is due to the declining rainfall. Mpandeli et al. [17] noted that smallholder farmers in the GSDM district find it difficult to achieve high crop yields due to unreliable rainfall. Subsistence farming areas are most affected by drought, so more fields have been abandoned [12,17,57].
The highest conversion in the district over the past 30 years is shrub/grassland to bare/exposed rock and eroded land (fifth common conversion), which occurred due to recurrent drought and extreme weather events such as flash floods [17]. These factors, together with dispersive soils [35] predispose the district to soil and water erosion. The increase in vegetation production in bare, eroded land, subsistence cultivation and thicket/dense bush may be due to bush encroachment. The overgrazing that occurred in abandoned cropping fields in communal land (subsistence cultivation) has led to bare soil and erosion. Since this has encouraged bush encroachment, an increase in NDVI was recorded [12,15]. The increase in NDVI in mines/quarries was due to vegetation development when most operational mines declined, as a result of declined commodity demand and a lack of water [36].
4.3. Land Degradation Due to Human Activities or Effects of Rainfall: RESTREND Method
The RESTREND of the NDVI revealed that LD in the GSDM was mainly due to rainfall. Herrmann, Anyamba and Tucker [29] identified the RESTREND method as an effective technique for determining the drivers of vegetation degradation. The result of this study agrees with other studies that report that vegetation dynamics in arid or semi-arid regions are very sensitive to changes in rainfall [27,58]. Furthermore, the district was affected by severe droughts in 2002–2004, 1992, and 2015 [59,60], making rainfall the key climate variable affecting vegetation productivity.
The areas where the RESTREND recorded a significant decline are in the central to western parts of the district (Ephraim Mogale and Makhuduthamaga local municipalities). This implies that the degradation process that occurred mainly in Ephraim Mogale and Makhuduthamaga local municipalities is the result of human activities, as described in the GSDM Integrated Development Plan [12]; such as livestock overgrazing, rural settlement, agriculture, unsustainable fuel wood harvesting and land tenure conflicts. The RESTREND magnitude showed a significant increase of 9.52% in the northern to eastern part of the district in the Fetakgomo Tubatse local municipality, implying that vegetation has improved for other reasons besides rainfall.
Insignificant positive RESTREND values in Fetakgomo Tubatse local municipality and some southern parts of Elias Motsoaledi local municipality mean that vegetation production in these areas is improving due to rainfall. Although rainfall has declined in these areas, the reason for the improvement in vegetation can be attributed to bush encroachment and alien invasive species, which are indicators of LD [13,55]. When Graw et al. [15] analysed the occurrence of bush encroachment in South Africa, increasing significant NDVI trends were observed. Graw et al. [15] showed that rainfall had the greatest influence on four of the significant variables (i.e., cattle density, carbon dioxide, soil moisture and fire occurrence) identified to explain bush encroachment in South Africa. Stephens et al. [14] also reported that communal rangelands experienced the greatest increase in bush encroachment, which doubled in low-rainfall areas.
The RESTREND results show that majority of the district (53%) is facing LD. However, the 41.41% of the district that had an insignificant negative RESTREND could mean that LD is due to a combination of human and climatic factors. Other studies have reported that the RESTREND method has shown that LD is the result of an equivalent combination of climate variability and human activities [61,62]. Therefore, it was important in the study to use a systems analysis to effectively identify the human and climatic factors driving LD and their interconnectedness, and to propose intervention measures.
5. Conclusions
By analysing the relationships between the climate factor (rainfall) and the NDVI time series over the 30 years, we used the RESTREND method to distinguish the areas of productivity change impacted by human activities from those affected by climate dynamics. The results indicated that LD in the GSDM is mostly influenced by climatic drivers (41.41%), rainfall in this case, and less so by anthropogenic ones (11.59%). With about 50% of the district dominated by pastoralism and grazing, 50% of the district can be addressed by controlling over grazing. Other interventions include home gardens, cross-slope measures, minimal soil disturbance, area closure, etc. SLM technologies and approaches such as technical and material support and stakeholder engagements have to be implemented to address LD. The increase in vegetation biomass (9.52%) in other parts of the district could be due to bush encroachment caused by rainfall and/or human activities. Bush encroachment is a challenging factor as it can be attributed to a range of factors. It is recommended that further studies on bush encroachment be conducted to curb land degradation as it affects livestock grazing and thus livelihoods and has negative impacts on the ecosystem. Providing spatial data on how vegetation has changed over the last 30 years and spatial information on where LD is occurring using RESTREND, particularly due to human activities, is critical. This is important because it serves as the basis for district-level policy decisions that help identify SLM practices best suited to rehabilitate the landscape and address LD in a semi-arid region.
Author Contributions
M.J.K.: drafting the article and revising, conception and design, acquisition of data, analysis and interpretation of data; A.R., J.O., J.-M.M.K. and A.S.: substantial contributions to revising the draft of the article, concept design, analysis and interpretation of data, revising the article critically for crucial intellectual content. All authors have read and agreed to the published version of the manuscript.
Funding
This study was co-funded by the Global Environment Facility (with the Grant number 00088758) and Department of Science and Innovation, Republic of South Africa (with the Grant number P1AHS00).
Institutional Review Board Statement
Ethics approval was obtained from the Council for Scientific and Industrial Research (CSIR) Ethics Committee. The declaration and procedures used in this study were adhered to.
Informed Consent Statement
Informed consent was obtained from all individual participants included in the study.
Data Availability Statement
Data available upon request from the corresponding author. The data are not available publicly as a result of privacy or ethical considerations.
Acknowledgments
This research was made possible by the UNDP-GEF5 Sustainable Land Management Project through the CSIR and the CSIR Parliamentary Grant. Further acknowledgments go to the local community and the officials of the Limpopo Department of Rural and Agriculture Development (LDARD).
Conflicts of Interest
The authors declare no conflict of interest.
References
- Neil Adger, W. Scales of Governance and Environmental Justice for Adaptation and Mitigation of Climate Change. J. Int. Dev. 2001, 13, 921–931. [Google Scholar] [CrossRef]
- Le, Q.B.; Tamene, L.; Vlek, P.L.G. Multi-Pronged Assessment of Land Degradation in West Africa to Assess the Importance of Atmospheric Fertilization in Masking the Processes Involved. Glob. Planet. Chang. 2012, 92–93, 71–81. [Google Scholar] [CrossRef]
- Weldemariam, G.S. Application of DPSIR Framework for Assessment ofLand Degradation: A Review. Approaches Poult. Dairy Vet. Sci. 2017, 1, 88–94. [Google Scholar] [CrossRef]
- Reynolds, J.F.; Maestre, F.T.; Kemp, P.R.; Stafford-Smith, D.M.; Lambin, E. Natural and Human Dimensions of Land Degradation in Drylands: Causes and Consequences. In Terrestrial Ecosystems in a Changing World; Canadell, J.G., Pataki, D.E., Pitelka, L.F., Eds.; Springer: Berlin/Heidelberg, Germany, 2007; pp. 247–257. [Google Scholar] [CrossRef]
- Duan, H.; Yan, C.; Tsunekawa, A.; Song, X.; Li, S.; Xie, J. Assessing Vegetation Dynamics in the Three-North Shelter Forest Region of China Using AVHRR NDVI Data. Environ. Earth Sci. 2011, 64, 1011–1020. [Google Scholar] [CrossRef]
- Yu, Q.Y.; Wu, W.B.; Liu, Z.H.; Verburg, P.H.; Xia, T.; Yang, P.; Lu, Z.J.; You, L.Z.; Tang, H.J. Interpretation of Climate Change and Agricultural Adaptations by Local Household Farmers: A Case Study at Bin County, Northeast China. J. Integr. Agric. 2014, 13, 1599–1608. [Google Scholar] [CrossRef]
- Mbow, C.; Smith, P.; Skole, D.; Duguma, L.; Bustamante, M. Achieving Mitigation and Adaptation to Climate Change through Sustainable Agroforestry Practices in Africa. Curr. Opin. Environ. Sustain. 2014, 6, 8–14. [Google Scholar] [CrossRef]
- Wessels, K.J.; Prince, S.D.; Malherbe, J.; Small, J.; Frost, P.E.; VanZyl, D. Can Human-Induced Land Degradation Be Distinguished from the Effects of Rainfall Variability? A Case Study in South Africa. J. Arid Environ. 2007, 68, 271–297. [Google Scholar] [CrossRef]
- Prince, S.D.; Brown De Colstoun, E.; Kravitz, L.L. Evidence from Rain-Use Efficiencies Does Not Indicate Extensive Sahelian Desertification. Glob. Chang. Biol. 1998, 4, 359–374. [Google Scholar] [CrossRef]
- Anyamba, A.; Tucker, C.J. Analysis of Sahelian Vegetation Dynamics Using NOAA-AVHRR NDVI Data from 1981–2003. J. Arid Environ. 2005, 63, 596–614. [Google Scholar] [CrossRef]
- Hoffman, T.M.; Todd, S. A National Review of Land Degradation in South Africa: The Influence of Biophysical and Socio-Economic Factors. J. South Afr. Stud. 2000, 26, 743–758. [Google Scholar] [CrossRef]
- The Greater Sekhukhune District. FINAL IDP 2016–2021 01-07-2016; 2019. Available online: http://www.sekhukhunedistrict.gov.za/?q=idp_budget (accessed on 3 February 2020).
- Ward, D.; Timm Hoffman, M.; Collocott, S.J. A Century of Woody Plant Encroachment in the Dry Kimberley Savanna of South Africa. Afr. J. Range Forage Sci. 2014, 31, 107–121. [Google Scholar] [CrossRef]
- Stephens, G.J.; Johnston, D.B.; Jonas, J.L.; Paschke, M.W. Understory Responses to Mechanical Treatment of Pinyon-Juniper in Northwestern Colorado. Rangel. Ecol. Manag. 2016, 69, 351–359. [Google Scholar] [CrossRef]
- Graw, V.; Oldenburg, C.; Dubovyk, O. Bush Encroachment Mapping for Africa: Multi-Scale Analysis with Remote Sensing and GIS, ZEF-Discussion Papers on Development Policy No. 218. ZEF-Center for Development Research, University of Bonn: Bonn, Germany, 2016; Available online: https://papers.ssrn.com/sol3/papers.cfm?abstract_id=2807811 (accessed on 20 February 2022).
- Ramoelo, A.; Stolter, C.; Joubert, D.; Cho, M.A.; Groengroeft, A.; Madibela, O.R.; Zimmermann, I.; Pringle, H. Rangeland Monitoring and Assessment: A Review. Biodivers. Ecol. 2018, 6, 170–176. [Google Scholar] [CrossRef]
- Mpandeli, S.; Nesamvuni, E.; Maponya, P. Adapting to the Impacts of Drought by Smallholder Farmers in Sekhukhune District in Limpopo Province, South Africa. J. Agric. Sci. 2015, 7, 115–124. [Google Scholar] [CrossRef]
- Caturegli, L.; Gaetani, M.; Volterrani, M.; Magni, S.; Minelli, A.; Baldi, A.; Brandani, G.; Mancini, M.; Lenzi, A.; Orlandini, S.; et al. Normalized Difference Vegetation Index versus Dark Green Colour Index to Estimate Nitrogen Status on Bermudagrass Hybrid and Tall Fescue. Int. J. Remote Sens. 2020, 41, 455–470. [Google Scholar] [CrossRef]
- de Jong, R.; de Bruin, S.; Schaepman, M.; Dent, D. Quantitative Mapping of Global Land Degradation Using Earth Observations. Int. J. Remote Sens. 2011, 32, 6823–6853. [Google Scholar] [CrossRef]
- Huang, S.; Kong, J. Assessing Land Degradation Dynamics and Distinguishing Human-Induced Changes from Climate Factors in the Three-North Shelter Forest Region of China. ISPRS Int. J. Geo-Inf. 2016, 5, 158. [Google Scholar] [CrossRef]
- Huber, S.; Fensholt, R.; Rasmussen, K. Water Availability as the Driver of Vegetation Dynamics in the African Sahel from 1982 to 2007. Glob. Planet. Chang. 2011, 76, 186–195. [Google Scholar] [CrossRef]
- Martiny, N.; Camberlin, P.; Richard, Y.; Philippon, N. Compared Regimes of NDVI and Rainfall in Semi-Arid Regions of Africa. Int. J. Remote Sens. 2006, 27, 5201–5223. [Google Scholar] [CrossRef]
- Zhang, L.; Yan, H.; Qiu, L.; Cao, S.; He, Y.; Pang, G. Spatial and Temporal Analyses of Vegetation Changes at Multiple Time Scales in the Qilian Mountains. Remote Sens. 2021, 13, 5046. [Google Scholar] [CrossRef]
- Ibrahim, H.; Elfaig, A.; Mokhtar, J.; Egemi, O.; Abdelkreim, M. Land Use/Land Cover Change Detection In Semi-Arid Lands: A Study From Sudan-Ghubaysh Area: A GIS And Remote Sensing Perspective. Int. J. Sci. Technol. Res. 2015, 4, 5. [Google Scholar]
- Lupo, F.; Reginster, I.; Lambin, E.F. Monitoring Land-Cover Changes in West Africa with Spot Vegetation: Impact of Natural Disasters in 1998-1999. Int. J. Remote Sens. 2001, 22, 2633–2639. [Google Scholar] [CrossRef]
- Wang, X.M.; Zhang, C.X.; Hasi, E.; Dong, Z.B. Has the Three Norths Forest Shelterbelt Program Solved the Desertification and Dust Storm Problems in Arid and Semiarid China? J. Arid Environ. 2010, 74, 13–22. [Google Scholar] [CrossRef]
- Li, A.; Wu, J.; Huang, J. Distinguishing between Human-Induced and Climate-Driven Vegetation Changes: A Critical Application of RESTREND in Inner Mongolia. Landsc. Ecol. 2012, 27, 969–982. [Google Scholar] [CrossRef]
- Chu, H.; Venevsky, S.; Wu, C.; Wang, M. NDVI-Based Vegetation Dynamics and Its Response to Climate Changes at Amur-Heilongjiang River Basin from 1982 to 2015. Sci. Total Environ. 2019, 650, 2051–2062. [Google Scholar] [CrossRef]
- Herrmann, S.M.; Anyamba, A.; Tucker, C.J. Recent Trends in Vegetation Dynamics in the African Sahel and Their Relationship to Climate. Glob. Environ. Chang. 2005, 15, 394–404. [Google Scholar] [CrossRef]
- Berdimbetov, T.; Ma, Z.G.; Shelton, S.; Ilyas, S.; Nietullaeva, S. Identifying Land Degradation and Its Driving Factors in the Aral Sea Basin From 1982 to 2015. Front. Earth Sci. 2021, 9, 1–20. [Google Scholar] [CrossRef]
- Helldén, U.; Tottrup, C. Regional Desertification: A Global Synthesis. Glob. Planet. Chang. 2008, 64, 169–176. [Google Scholar] [CrossRef]
- Evans, J.; Geerken, R. Discrimination between Climate and Human-Induced Dryland Degradation. J. Arid Environ. 2004, 57, 535–554. [Google Scholar] [CrossRef]
- Statistics South Africa, (STATS SA), Community Survery 2016 Provincial Profile: Limpopo, 2016. Statistics South Africa. Available online: http://cs2016.statssa.gov.za/?portfolio_page=community-survey-2016-provincial-profile-limpopo-2016 (accessed on 7 April 2021).
- Stronkhorst, J.; Levering, A.; Hendriksen, G.; Rangel-Buitrago, N.; Appelquist, L.R. Regional Coastal Erosion Assessment Based on Global Open Access Data: A Case Study for Colombia. J. Coast. Conserv. 2018, 22, 787–798. [Google Scholar] [CrossRef]
- Gourmelon, V.; Maggia, L.; Powell, J.R.; Gigante, S.; Hortal, S.; Gueunier, C.; Letellier, K.; Carriconde, F. Environmental and Geographical Factors Structure Soil Microbial Diversity in New Caledonian Ultramafic Substrates: A Metagenomic Approach. PLoS ONE 2016, 11, e0167405. [Google Scholar] [CrossRef]
- The Greater Sekhukhune District Municipality. Final 2021–2026 IDP SC03-05-21 10 June 2021. 2020. Available online: https://www.sekhukhunedistrict.gov.za/?q=idp_budget (accessed on 3 February 2020).
- Mucina, L.; Hoffman, T.; Ashwell, A. Book Review. South Afr. J. Bot. 2003, 69, 116. [Google Scholar] [CrossRef]
- Kalisa, W.; Igbawua, T.; Henchiri, M.; Ali, S.; Zhang, S.; Bai, Y.; Zhang, J. Assessment of Climate Impact on Vegetation Dynamics over East Africa from 1982 to 2015. Sci. Rep. 2019, 9, 1–20. [Google Scholar] [CrossRef]
- Bao, G.; Qin, Z.; Bao, Y.; Zhou, Y.; Li, W.; Sanjjav, A. NDVI-Based Long-Term Vegetation Dynamics and Its Response to Climatic Change in the Mongolian Plateau. Remote Sens. 2014, 6, 8337–8358. [Google Scholar] [CrossRef]
- Salim, H.A.; XiaoLing, C.; JianYa, G. Analysis of Sudan Vegetation Dynamics Using NOAA-AVHRR NDVI Data from 1982-1993. Asian J. Earth Sci. 2009, 2, 71–85. [Google Scholar] [CrossRef]
- Muavhi, N.; Woyessa, Y. A Simple Approach for Monitoring Vegetation Change Using Time Series Remote Sensing Analysis: A Case Study from the Thathe Vondo Area in Limpopo Province, South Africa. S. Afr. J. Sci. 2021, 117, 1–9. [Google Scholar] [CrossRef] [PubMed]
- Franch, B.; Vermote, E.F.; Roger, J.C.; Murphy, E.; Becker-reshef, I.; Justice, C.; Claverie, M.; Nagol, J.; Csiszar, I.; Meyer, D.; et al. A 30+ Year AVHRR Land Surface Reflectance Climate Data Record and Its Application to Wheat Yield Monitoring. Remote Sens. 2017, 9, 296. [Google Scholar] [CrossRef] [PubMed]
- Archer, E.R.M. Beyond the “Climate versus Grazing” Impasse: Using Remote Sensing to Investigate the Effects of Grazing System Choice on Vegetation Cover in the Eastern Karoo. J. Arid Environ. 2004, 57, 381–408. [Google Scholar] [CrossRef]
- Pei, Z.; Fang, S.; Yang, W.; Wang, L.; Wu, M.; Zhang, Q.; Han, W.; Khoi, D.N. The Relationship between NDVI and Climate Factors at Different Monthly Time Scales: A Case Study of Grasslands in Inner Mongolia, China (1982–2015). Sustainability 2019, 11, 7243. [Google Scholar] [CrossRef]
- Ashouri, H.; Hsu, K.L.; Sorooshian, S.; Braithwaite, D.K.; Knapp, K.R.; Cecil, L.D.; Nelson, B.R.; Prat, O.P. PERSIANN-CDR: Daily Precipitation Climate Data Record from Multisatellite Observations for Hydrological and Climate Studies. Bull. Am. Meteorol. Soc. 2015, 96, 69–83. [Google Scholar] [CrossRef]
- Rahman, A.; Aggarwal, S.P.; Netzband, M.; Fazal, S. Monitoring Urban Sprawl Using Remote Sensing and GIS Techniques of a Fast Growing Urban Centre, India. IEEE J. Sel. Top. Appl. Earth Obs. Remote Sens. 2011, 4, 56–64. [Google Scholar] [CrossRef]
- Sarti, M.; Vaccari, F.P.; Calfapietra, C.; Brugnoli, E.; Scartazza, A. A Statistical Approach to Detect Land Cover Changes in Mediterranean Ecosystems Using Multi-Temporal Landsat Data: The Case Study of Pianosa Island, Italy. Forests 2020, 11, 334. [Google Scholar] [CrossRef]
- Department of Rural Development and Land Reform (DRDLR). Standard_for_the_ Land_Cover_Mapping_ QLAS_SD. 19(V2); 2019. Available online: http://www.ngi.gov.za/index.php/technical-information/standards-menu?download=4:standard-for-the-land-cover-mapping (accessed on 20 January 2020).
- Ganasri, B.P.; Dwarakish, G.S. Study of Land Use/Land Cover Dynamics through Classification Algorithms for Harangi Catchment Area, Karnataka State, INDIA. Aquat. Procedia 2015, 4, 1413–1420. [Google Scholar] [CrossRef]
- Foody, G.M. Spatial Nonstationarity and Scale-Dependency in the Relationship between Species Richness and Environmental Determinants for the Sub-Saharan Endemic Avifauna. Glob. Ecol. Biogeogr. 2004, 13, 315–320. [Google Scholar] [CrossRef]
- Montfort, F.; Bégué, A.; Leroux, L.; Blanc, L.; Gond, V.; Cambule, A.H.; Remane, I.A.D.; Grinand, C. From Land Productivity Trends to Land Degradation Assessment in Mozambique: Effects of Climate, Human Activities and Stakeholder Definitions. L. Degrad. Dev. 2021, 32, 49–65. [Google Scholar] [CrossRef]
- Adarsh, S.; Janga Reddy, M. Trend Analysis of Rainfall in Four Meteorological Subdivisions of Southern India Using Nonparametric Methods and Discrete Wavelet Transforms. Int. J. Climatol. 2015, 35, 1107–1124. [Google Scholar] [CrossRef]
- Udelhoven, T.; Stellmes, M.; del Barrio, G.; Hill, J. Assessment of Rainfall and NDVI Anomalies in Spain (1989–1999) Using Distributed Lag Models. Int. J. Remote Sens. 2009, 30, 1961–1976. [Google Scholar] [CrossRef]
- Baniya, B.; Tang, Q.; Huang, Z.; Sun, S.; Techato, K. Spatial and Temporal Variation of NDVI in Response to Climate Change and the Implication for Carbon Dynamics in Nepal. Forests 2018, 9, 329. [Google Scholar] [CrossRef]
- Saha, M.V.; Scanlon, T.M.; Odorico, P.D. Examining the Linkage between Shrub Encroachment and Recent Greening in Water-Limited Southern Africa. Ecosphere 2015, 6, 1–16. [Google Scholar] [CrossRef]
- Wigley, B.J.; Bond, W.J.; Hoffman, M.T. Bush Encroachment under Three Contrasting Land-Use Practices in a Mesic South African Savanna. Afr. J. Ecol. 2009, 47 (Suppl. S1), 62–70. [Google Scholar] [CrossRef]
- Mukwada, G.; Mazibuko, S.M.; Moeletsi, M.; Robinson, G.M. Can Famine Be Averted? A Spatiotemporal Assessment of the Impact of Climate Change on Food Security in the Luvuvhu River Catchment of South Africa. Land 2021, 10, 527. [Google Scholar] [CrossRef]
- Chen, X.; Vierling, L.; Deering, D. A Simple and Effective Radiometric Correction Method to Improve Landscape Change Detection across Sensors and across Time. Remote Sens. Environ. 2005, 98, 63–79. [Google Scholar] [CrossRef]
- Mpandeli, S.; Maponya, P. Constraints and Challenges Facing the Small Scale Farmers in Limpopo Province, South Africa. J. Agric. Sci. 2014, 6, 135. [Google Scholar] [CrossRef]
- Vogel, C.; Van Zyl, K. Drought: In Search of Sustainable Solutions to a Persistent, ‘Wicked’ Problem in South Africa. In Climate Change Adaptation Strategies—An Upstream-Downstream Perspective; Springer: Cham, Switzerland, 2016; pp. 195–211. [Google Scholar] [CrossRef]
- Dagnachew, M.; Kebede, A.; Moges, A.; Abebe, A. Effects of Climate Variability on Normalized Difference Vegetation Index (NDVI) in the Gojeb River Catchment, Omo-Gibe Basin, Ethiopia. Adv. Meteorol. 2020, 2020, 8263246. [Google Scholar] [CrossRef]
- He, C.; Tian, J.; Gao, B.; Zhao, Y. Differentiating Climate- and Human-Induced Drivers of Grassland Degradation in the Liao River Basin, China. Environ. Monit. Assess. 2015, 187, 4199. [Google Scholar] [CrossRef] [PubMed]
Disclaimer/Publisher’s Note: The statements, opinions and data contained in all publications are solely those of the individual author(s) and contributor(s) and not of MDPI and/or the editor(s). MDPI and/or the editor(s) disclaim responsibility for any injury to people or property resulting from any ideas, methods, instructions or products referred to in the content. |
© 2023 by the authors. Licensee MDPI, Basel, Switzerland. This article is an open access article distributed under the terms and conditions of the Creative Commons Attribution (CC BY) license (https://creativecommons.org/licenses/by/4.0/).