Abstract
Pedestrians who suddenly cross the street from within the blind spot of a vehicle’s field of view can pose a significant threat to traffic safety. The dangerous pedestrian crossing intentions in view-obscured scenarios have not received as much attention as the prediction of pedestrian crossing intentions. In this paper, we present a method for recognizing and predicting the dangerous crossing intention of pedestrians in a view-obscured region based on the interference, pose, velocity observation–long short-term memory (IPVO-LSTM) algorithm from a road-based view. In the first step, the road-based camera captures the pedestrian’s image. Then, we construct a pedestrian interference state feature module, pedestrian three-dimensional pose feature module, pedestrian velocity feature module, and pedestrian blind observation state feature module and extract the corresponding features of the studied pedestrians. Finally, the pedestrian hazard crossing intention prediction module based on a feature-fused LSTM (ff-LSTM) and attention mechanism is used to fuse and process the above features in a cell state process to recognize and predict the pedestrian hazard crossing intention in the blind visual area. Experiments are compared with current common algorithms in terms of the input parameter selection, intention recognition algorithm, and intention prediction time range, and the experimental results validate our state-of-the-art method.
1. Introduction
Accidental crossing of pedestrians is one of the causes of pedestrian-related traffic accidents [1]. In an area with an open field of view, pedestrians, drivers, or autonomous vehicles can effectively sense each other’s movements and thus make effective decisions to avoid accidents. In contrast, in an area with an obstructed field of view, avoiding accidents caused by the sudden appearance of pedestrians in a vehicle’s driving area relies mainly on the defensive driving awareness of the driver or autonomous driving system, as well as the pedestrian’s specific observation pose, e.g., pedestrians lean out at the edge of the visual occlusion to observe the road traffic.
Pedestrian negligence in observing traffic conditions in their blind spots can lead to hazardous crossing intentions, which in turn can lead to intrusion into the vehicle’s driving area, posing a considerable challenge for drivers or automated driving systems to perform reasonable and practical avoidance actions in a brief period.
As shown in Figure 1, the views of both the pedestrian marked in gold and the vehicle marked in red are blocked by other vehicles parked at the edge of the road (marked in blue). In our study, we define such a crossing intention of a pedestrian who does not sufficiently observe the traffic conditions in the view-obscured area and ventures to cross the road as a hazardous crossing intention of the pedestrian in the view-obscured area. This issue poses a significant challenge for improving vehicles’ active safety and largely limits the comprehensive commercial application of self-driving vehicles in complex urban road environments [2]. Although there has been a large amount of research on predicting pedestrian crossing intentions or trajectories, there has been little research on pedestrian crossing intentions in view-obscured scenarios. Although this problem occurs in a more specific traffic situation, the solution is significant for improving active vehicle safety and fully promoting the commercial application of L5-level autonomous driving systems. In this paper, based on a depth camera, pose estimation technique, and spatial–temporal graph convolutional networks (ST-GCN), we first obtain pedestrian three-dimensional (3D) pose feature points and pedestrian action types, and we then construct a pedestrian interference state feature module, pedestrian 3D pose feature module, pedestrian speed feature module, and pedestrian blind observation state feature module. We extract the pedestrian features based on these modules. These features are concatenated in the cell state process of our constructed ff-LSTM, and the pedestrian hazard crossing intention in the blind area of the visual field is finally recognized and predicted by the pedestrian hazardous crossing intention prediction module.
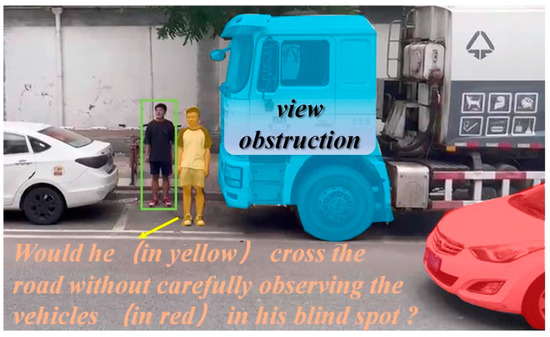
Figure 1.
Schematic diagram of hazardous crossing intentions for pedestrians in view-obscured areas.
With the popularization and development of infrastructure-to-vehicle (I2V) communication, the model proposed in this paper can compensate for the lack of perception ability of autonomous driving systems and conventional vehicles in view-obscured environments to improve the decision reliability and safety of autonomous driving systems and drivers. Our contributions are summarized as follows:
- For the issue of recognizing and predicting pedestrians’ hazardous crossing intentions in view-obscured areas, we present the interference, pose, velocity observation–long short-term memory (IPVO-LSTM) algorithm based on the road-based view.
- When selecting the input parameters for the pedestrian hazardous crossing intention recognition and prediction, we added interference features between pedestrians and blind observation degree features to the pedestrian pose features and historical trajectory features and constructed an ff-LSTM for fusing the above features.
- When performing interference judgment of pedestrians, we added the pedestrian action type and body pose features to the pedestrian spatial location features.
- In extracting the pedestrian blind observation degree features, we proposed a method to determine the pedestrian blind observation status based on the pedestrian head pose angle, torso forward angle, shoulder pose angle, and K-Means++ algorithm.
The remainder of this paper is organized as follows. Section 2 reviews the related work. Section 3 presents our proposed method to recognize pedestrians’ hazardous intentions and introduces the experimental procedure. Section 4 details the experiments and results. Section 5 summarizes the current work and possible work.
2. Related Work
Since this study utilized cameras as sensors, and pedestrian crossing intention recognition or prediction is usually performed in the same environment as pedestrian trajectory prediction [3], we collated related studies on pedestrian crossing intention prediction (recognition) based on vision sensors and trajectory prediction, as discussed below.
2.1. Observational Perspective for Pedestrian Crossing Intentions Prediction
By watching a large number of road traffic accident videos, we found that when pedestrians’ vision is obstructed, pedestrians do not always effectively observe the road conditions in the blind spot before crossing the street, often looking in the wrong direction. Failure to observe the road conditions can lead to pedestrians directly entering the vehicle driving area, causing accidents. As shown in Table 1, the previous research on vision-based pedestrian intention or trajectory prediction was mainly from two observation perspectives: on-board and road-based vision sensors.

Table 1.
Literature on pedestrian intention prediction.
Most studies based on on-board vision sensors have focused on pedestrians directly in front of the sensor’s field of view. For example, Quan et al. [7] predicted the pedestrian trajectory ahead of the vehicle based on the image information captured by on-board vision sensors and an improved LSTM model. Fang et al. [4] implemented cyclist and pedestrian intention prediction in front of the field of view based on image information captured by on-board vision sensors and a convolutional neural network (CNN) + RF model. However, it is clear that the on-board sensor-based approach cannot overcome the critical problem of field of view occlusion and cannot meet the needs of the pedestrian intention or trajectory prediction in an area where the field of view is occluded.
In fact, self-vehicle-sensor field-of-view occlusion is also an important cause of difficulties for autonomous driving systems to make safe decisions and produce human-like driving behavior in dynamic and uncertain environments [19].
Compared to on-board vision sensors, a road-based sensor-based view can provide a complete field of view. Zhang et al. [6] captured videos of pedestrians crossing a road through a road-based camera and analyzed the intentions of pedestrians running red lights to cross the road at traffic light intersections based on information such as pedestrian two-dimensional (2D) skeletal points. Zhao et al. [20] developed a human-in-the-loop system based on lidar mounted on the roadside to bring pedestrians into the connected environment and predict pedestrian crossing intentions using an improved Naive Bayes method. However, regrettably, as shown in Table 1, although there have been many studies on pedestrian crossing intention or trajectory prediction using road-based approaches, the problem of pedestrian crossing intention or trajectory prediction in view-obscured scenarios has not received sufficient attention. This particular scenario is of great significance for improving active vehicle safety and advancing commercial applications for autonomous driving.
2.2. Common Research Methods for Pedestrian Crossing Intentions
As shown in Table 1, there are three main types of models: parametric models (e.g., Kalman filter (KF)) and various custom models, machine learning models (e.g., support vector machine (SVM)), and deep learning models (e.g., LSTM and CNN models). Deep-learning-based approaches have become more popular in recent years compared to other models [6]. Among the many studies based on deep learning, methods based on LSTM or its variant Bi-LSTM are more widely used. For example, Alexandre et al. [8] proposed the Social LSTM method to learn general human movements and predict their future trajectories. Xue et al. [5] employed LSTM to encode pedestrian trajectory information, grid map information, and image convolution information and then decoded the encoded results with an LSTM to obtain the predicted trajectories of pedestrians. Chen et al. [13] used CNN and graph convolutional network (GCN) modules to encode pedestrian information and used LSTM to decode it to finally obtain pedestrian crossing intention predictions. Given the good results already achieved by LSTM methods for pedestrian intention or trajectory prediction, the same LSTM-based approach was used in our study.
2.3. Common Input Parameters for Pedestrian Crossing Intention Prediction
When predicting pedestrian crossing intentions, traditional methods mainly use pedestrian trajectories to predict the future state of pedestrians [21]. However, subsequent studies have found that it is not sufficient to predict the future state of pedestrians by using their locations or trajectories alone [22]. Therefore, as shown in Table 1, the pedestrian’s pose also becomes an indispensable factor in pedestrian intention or trajectory prediction [4]. Moreover, in recent studies, pedestrian pose is increasingly used as an input factor for predicting pedestrian intentions or trajectories [23].
Furthermore, through the observation and analysis of a large number of pedestrian collision videos, we found that when the pedestrian’s field of view is obscured, the pedestrian’s observation level (including the observation angle and observation time) of the traffic conditions in the obscured area also affects a pedestrian’s intention to cross. This is because the wrong observation direction or an insufficient observation time can cause pedestrians to have hazardous crossing intentions in view-obscured conditions.
Additionally, interference behaviors between pedestrians (e.g., talking and chasing) can distract pedestrians crossing the street, which can affect their final intention. The distance between pedestrians has traditionally been used as a primary criterion for evaluating pedestrian interference. For example, Alexandre et al. [8] analyzed the inter-pedestrian interference problem using pedestrian spacing as an influencing factor. They performed pedestrian trajectory prediction on the ETH dataset by constructing a Social-LSTM network. However, using only the pedestrian-to-pedestrian distance as the interference judgment condition is not realistic [11] because the relationship between shorter pedestrian distances and the behavior interference between pedestrians is not a sufficient but a necessary relationship.
2.4. Pedestrian Crossing Intention Prediction Dataset
In Table 2, we compiled the datasets used for pedestrian intent or trajectory prediction in the last decade containing 3D information for pedestrians based on different camera perspectives. We found that only the Ko-PER dataset contained both 3D and bird’s-eye view information from a roadside camera. Because the data were obtained for a limited duration, with only 38 pedestrians and a few scenes involving field-of-view occlusion, this dataset did not meet the needs of this study. Therefore, we constructed a dataset for this study by acquiring road videos.
Table 2.
Pedestrian intention prediction datasets.
3. Methodology
3.1. Overview and Preliminary Information
3.1.1. Model Overview
To predict pedestrian hazardous crossing intentions in areas with obscured fields of view, we constructed the IPVO-LSTM algorithm, as shown in Figure 2.
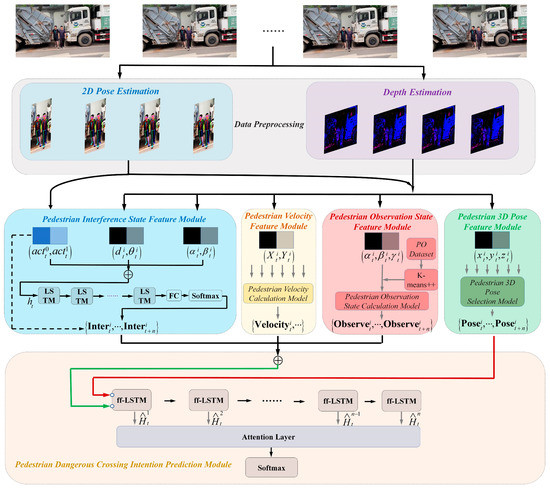
Figure 2.
Schematic diagram of IPVO-LSTM structure, where “” denotes concatenation. The PO Dataset is the body pose dataset of pedestrians when they observe the blind area. The pedestrian three-dimensional (3D) pose selection method is adopted to select the pedestrian closer to the center of the road at time t and retain their 3D pose information. The pedestrian observation state calculation method is mainly used to calculate the observation state of the studied pedestrians in the blind area at time t.
First, 2D pose estimates of pedestrians were obtained by collecting videos of pedestrians crossing the street through a depth camera mounted on the roadside, and 3D pose estimates and action classifications of pedestrians were obtained by combining an image depth estimation technique and a pedestrian pose estimation technique, respectively.
Second, the different 3D pose coordinates of pedestrians and the results of the action classification were then used separately in the pedestrian interference state feature module, pedestrian 3D pose feature module, pedestrian velocity feature module, and pedestrian observation state feature module to obtain different features of the pedestrians: the interference state features between pedestrians closer to the camera and other pedestrians, the 3D pose features of pedestrians closer to the camera, the velocity features of pedestrians closer to the camera, and the observation state features for describing the traffic conditions in the blind zone of pedestrians closer to the camera.
Finally, the above features were fused in our constructed ff-LSTM, and the pedestrian hazard crossing intention prediction module was used to determine whether the traveler had a hazardous crossing intention.
3.1.2. Long Short-Term Memory (LSTM) Basics
In the basic LSTM network, the final output state can be obtained using the following equation based on a given sequence :
where is the weight matrix, is the bias vector, and are the hidden states. The hidden states in the LSTM cell are mainly determined by the input gate , forget gate , output gate , and cell state , which can be expressed as follows:
where denotes the element-wise product, denotes the cell state update value, , , , and denote the different weight matrices, denotes the sigmoid activation function, and , , , and denote the different bias vectors [40].
3.2. Data Preprocessing
In the study of pedestrian crossing intention or trajectory recognition and prediction based on an on-board view, the 2D pose point coordinate values of pedestrians can often be obtained by calculating the body pose angles. However, some body pose angles, e.g., the forward tilt angle of the pedestrian torso, cannot be obtained if only 2D pose coordinate values of pedestrians are used in the pedestrian pose calculation based on a road-based view. To solve this problem, we obtain the depth information of pedestrian skeletal points by acquiring the image depth to determine the 3D coordinates of the pedestrian pose points. In the actual data acquisition process, a Kinect camera can obtain the scene depth of field through infrared and using its computing platform to collect the real-time 3D coordinates of skeletal points. However, the process of outdoor data acquisition will be disturbed by lighting and other conditions, resulting in poor recovery of the depth of field. Moreover, since binocular stereo vision is less affected by lighting but is more computationally intensive in the later data processing, we adopt a combination of both methods for the acquisition of data (for more detailed information, refer to Experimental Procedure (2)).
The 3D feature point calculation of the pedestrian pose based on a ZED binocular RGB camera is described as follows. First, we obtained the coordinates of any skeletal 2D feature point of the pedestrian in the left and right-side cameras based on OpenPose, and obtained the following:
where and denote the horizontal coordinate values of the 25 skeletal points in OpenPose in the left and right cameras, respectively (for more detailed information. Then, the parallax matrix D is obtained:
With the camera focal length f and baseline b, the depth matrix Z of each skeletal feature point can be obtained:
where denotes the depth values of each of the 25 skeletal points in OpenPose, i.e., the distance of each skeletal point from the camera. From this, we can obtain the 3D feature point coordinate matrix of any skeleton of pedestrian j at moment t.
3.3. Pedestrian Feature Modules
3.3.1. Pedestrian Interference State Feature Module
As is well known, interactions between pedestrians, e.g., talking and chasing, can affect pedestrians’ observations of road conditions and lead to incorrect crossing decisions. Although this problem has received particular attention in pedestrian intention recognition or prediction, in general, existing studies have mainly focused on the interactions between pedestrians by using the distance between them [15], which cannot meet the requirements of all realistic situations, especially when two pedestrians are moving side-by-side in a narrow view-obscured area. Even though they have a small distance between them, an interactive relationship between them cannot be guaranteed. In fact, not only does the distance between pedestrians have an impact on the evaluation of pedestrian interactions but also other factors, such as the azimuth angle between pedestrians, the body pose angle of pedestrians, and the type of pedestrian movement have significant impacts on the determination of pedestrian interactions. There are four aspects to be considered when modeling the pedestrians’ interactions, which are described as follows.
- Distance and azimuth between pedestrians
The azimuthal angle between pedestrians also affects the judgment of the interactions between pedestrians. For example, when the angle between A and B is 0°, and both of them walk at a slower speed, there is often no interaction between them. Let the mid-hip coordinates of the studied pedestrian be and the mid-hip coordinates of the other pedestrian be . The distance and the angle between the other pedestrians and the studied pedestrian i at moment t are expressed as follows:
The orientation relationship between the two is shown in Figure 3.
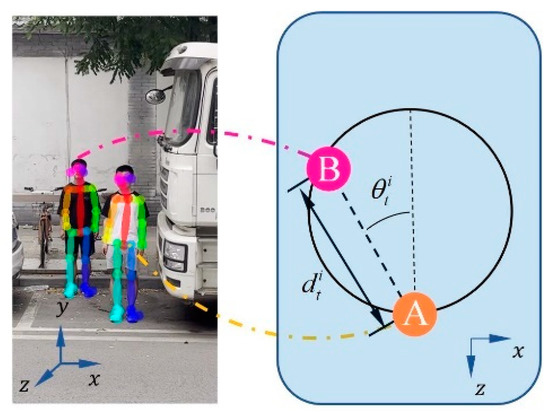
Figure 3.
Schematic diagram of pedestrian distance and azimuth. On the XOZ plane, Points A and B represent the projections of pedestrians A and B, respectively.
- 2.
- Pedestrian head observation angle
As is well known, humans tend to point their eyes at each other during conversation or other interactions to ensure that the interaction is carried out properly. This is also true for pedestrians. Thus, we take the pedestrian head steering angle α and shoulder steering angle β into account when performing pedestrian interaction evaluation. Figure 4 shows the definitions of these two angles and the pedestrian torso forward angle γ used later.
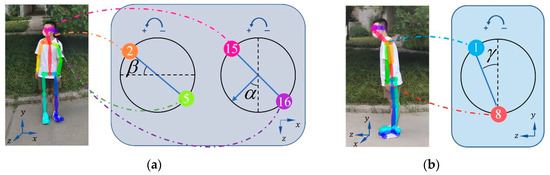
Figure 4.
Schematic diagram of pedestrian head turning angle, shoulder turning angle, and torso forward tilt angle. (a) Projection diagrams of points 2 and 5 and points 15 and 16 in the XOZ plane when the pedestrian turns their head and shoulders between turns, respectively, and (b) shows the projection diagrams of points 1 and 8 in the YOZ plane when the pedestrian torso tilts forward; “1” indicates the neck point, “8” indicates the midpoint of the left hip and right hip line, “2” indicates the right shoulder point, “5” denotes the left shoulder point, “15” denotes the right eye point, and “16” denotes the left eye point. We set the pedestrian’s forward tilting direction as the Z-axis, the direction of the pedestrian height as the Y-axis, and the direction of the pedestrian parallel to the camera lens as the X-axis. The head and shoulders turning to the left was defined as the positive direction.
The head steering angle and shoulder steering angle for any pedestrian i at moment t are calculated by
where , and . , , , are the horizontal coordinates of the projection of the right eye, left eye, right shoulder, and left shoulder skeletal points of pedestrian i in the XOZ plane, respectively; and are the corresponding vertical coordinates.
- Action classification
During particular interaction behaviors, such as chasing, the pedestrians’ heads are not facing the same direction, and the pedestrian spacing may increase over time. We classify the behavior of the resulting skeletal points based on an ST-GCN and improve the reliability of the pedestrian interaction judgment by combining the resulting pedestrian action type features.
As shown in Figure 5, first, parameters such as the 2D coordinates of the pedestrian skeletal points obtained from OpenPose are normalized, and then the temporal and spatial dimensions are transformed by the ST-GCN unit, alternately using a GCN and a temporal convolutional network (TCN). Finally, average pooling, a fully connected layer, and a softmax layer are used to achieve the action classification of the pedestrian actions. In addition, we use the attention mechanism (ATT) module used in the Yan model [25], considering the different levels of importance of different torso positions in judging the actions of pedestrians when crossing the street [41]. To facilitate subsequent LSTM calculations, we use one-hot encoding to label the behavior types of pedestrians crossing the street at time period t, where pedestrian i shows crossing behavior during time period t [42]. Of these, eight common behaviors were selected in our study: talking on phone, playing with a cell phone, greeting, walking, running, holding hands, eating/drinking, and smoking.
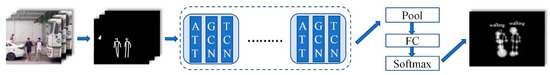
Figure 5.
Schematic diagram of pedestrian action classification.
- 2.
- Classification of pedestrian interaction features
This part finally uses a fusion layer by combining the above features , the pedestrian interaction feature can be obtained as follows:
where the tandem state consists of the pedestrian distance and azimuth angle of pedestrian i, pedestrian head observation angle, pedestrian action type classification information, and time point t. The final interference state (0 or 1) is then obtained by taking the pedestrian interaction feature as the input and passing through an LSTM layer, fully connected layer, and softmax layer, as follows:
where and denote different weight matrices, and denotes the bias vector.
In addition, when there is only one pedestrian in the image at time t, although the pedestrian is in a non-interference state with other pedestrians, if the pedestrian exhibits a behavior such as playing with a cell phone with their head down, they may still have a dangerous intention to cross the street due to the distraction. In order to avoid the impact of this problem, we keep the behavioral feature and fuse it with the pedestrian interference state feature calculated by the pedestrian interference state feature module, as shown by the dashed line in Figure 2. Then, we obtain the pedestrian interference feature .
3.3.2. Pedestrian Velocity Feature Module
Although the behavior in the pedestrian interference state feature module is able to determine whether the traveler is running or walking, there is also a difference in the degree of observation of the road conditions between slow-running (walking) and fast-running (walking) pedestrians, so we keep the pedestrian speed feature.
When setting up the pedestrian speed calculation module in Figure 2, we first select pedestrian i, who is closer to the center of the road, as the object of focus. Then, by using the Z-coordinate values of the midpoints of the left and right hip lines (i.e., point 8 in Figure 6a) at moments t and t + 1, we can obtain the velocity feature of pedestrian i as follows:
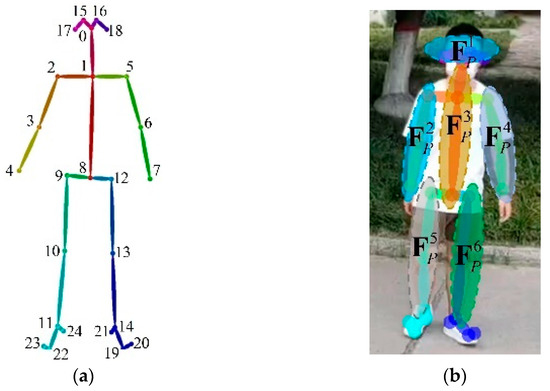
Figure 6.
Schematic diagram of pedestrian 3D pose feature selection: (a) Openpose-Body25 model and (b) body joint classification methods.
3.3.3. Pedestrian Observation State Feature Module
When the pedestrian view is obscured, the pedestrian’s observation level (including the observation direction and duration) of the traffic condition in the blind area directly affects the pedestrian’s final crossing intention decision. In order to observe the environment in the obstructed field of view, pedestrians not only need to turn their heads and shoulders but also sometimes need to add a forward tilt of the limb trunk to complete the observation. Thus, we also added the forward tilt angle γ of the limb trunk, as shown in Figure 4b.
Let the point be the coordinates of the midpoint of the line connecting the left hip and the right hip at the moment t (mid-hip point). Based on the side view of the human skeletal points in Figure 4b, the forward tilt angle γt of the trunk at the moment t is
Let the pedestrian blind zone observation vector at time t be , where αt, βt, and γt are the head steering angle, shoulder steering angle, and torso forward angle of the pedestrian at time t. After obtaining the pedestrian blind zone observation vector, in order to be able to judge whether the pedestrian is observing the road condition in the blind zone at moment t based on the pedestrian blind zone observation vector at moment t, we designed a pedestrian blind zone observation experiment (for more detailed information, refer to Experimental Procedure (1)).
First, by collecting the head steering angle, shoulder steering angle, and torso forward angle from different experimenters while observing the road in a blind area, we constructed a pedestrian blind area observation degree body pose dataset, the PO Dataset, .
Then, the K-means++ algorithm was used to obtain the pose clustering centroids when the pedestrian was not observing the road conditions and the pose clustering centroids and when the pedestrian was observing the left and right sides within the blind area of the visual field, respectively [43].
Finally, for a new image, the observation state was determined based on the cluster that it was closest to. This was determined by the minimum Euclidean distance, , where . and were calculated similarly.
The observation result was set as , which took values of 0, 1, or 2, corresponding to correctly observed, unobserved (forward observation), and incorrectly observed (according to Chinese traffic regulations, vehicles drive on the right side of the road and the direction of incoming traffic is to the left of the pedestrian; thus, a pedestrian who only observes to the right is defined as incorrectly observed), respectively.
3.3.4. Pedestrian 3D Pose Feature Module
The Pedestrian 3D pose feature obtained after 3D pose estimation had dimensions of , refer to Figure 6a, which would reduce the effectiveness of the LSTM network if it were used as direct input.
To address this problem, Shahroudy et al. [44] grouped the body joints into five groups: torso, two hands, and two legs, and used each of them as input features. Inspired by this, combined with the Openpose-Body25 model we used, we grouped the body joints into six part groups: torso (), two arms ( and ), two legs ( and ), and head (), as shown in Figure 6, where points 19 to 24 were not included because these points were the toes and heels, which were not used in our study.
In addition, considering that there may be more than one pedestrian in the image at moment t, we choose pedestrian A, whose position is close to the center of the road (e.g., the pedestrian marked in gold in Figure 1). Pedestrian B, who is farther from the center of the road (e.g., the pedestrian in the green box in Figure 1), is able to rely on the pose and response of pedestrian A, who is close to the center of the road when making a crossing intention decision. Therefore, we construct the pedestrian 3D pose selection method shown in Figure 2 by comparing the z-coordinates of different pedestrian mid-hip points at the same moment, approximating the distance of the pedestrian from the camera, and selecting the pose value of pedestrian i with the smaller mid-hip z-value as the input to the pedestrian hazardous crossing intention prediction module. To facilitate the batch processing of data, the 2D coordinates captured in the left camera, combined with the depth values of skeletal points, are used to construct 3D feature point coordinates of pedestrian skeletons.
3.4. Pedestrian Dangerous Crossing Intention Prediction Module
3.4.1. Feature-Fusion LSTM
As shown in Figure 7a, a naive way to combine the , , , and features is to concatenate them in the feature level and feed them to the corresponding LSTM unit as the network’s input data. However, the dimension of the , , and features are very low intrinsically, while the features often have relatively higher dimensions. As a result of this inconsistency, concatenating these two types of features in the input stage of the network would degrade the overall performance. In [45], different body parts were fed into the Part-Aware LSTM separately and then assembled inside the LSTM unit. Inspired by this work, we propose to fuse the (, , ) and () features inside the feature-fusion LSTM unit, rather than simply concatenating them at the input level, as shown in Figure 7b.
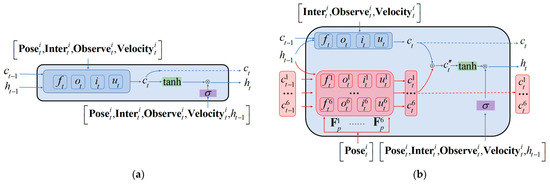
Figure 7.
Schematic diagram of LSTM unit and feature-fusion LSTM unit: (a) LSTM unit and (b) feature-fusion LSTM unit.
Since the dimensionalities of the , , and features were low, they could be spliced in the network input stage to obtain the (, , ) vectors, which were combined with the six vectors , , , , and of , respectively, by Equations (2), (3), (5), (6), and (4) to obtain the corresponding input gate values (,, …, ), forget gate values (,, …, ), output gates (,, …, ), cell state values (, , …, ), and cell state update values ().
Then, the pedestrian crossing intention hidden state was obtained:
where denotes the weight matrices, and denotes the bias vector.
The intermediate hidden state vector was obtained after the feature-fusion LSTM layer, where l is the number of hidden units (set to 100 in our network).
3.4.2. Pedestrian Dangerous Crossing Intention Prediction
To prevent overfitting, we perform dropout processing before performing the full connection process, setting to follow a Bernoulli distribution, i.e., :
where is the Bernoulli function, which is used to generate a vector of random numbers between 0 and 1 with probability . In our study, . The result of this step is passed through the fully connected attention layer:
where and are the attention scoring function, and
The attention distribution result is fully connected, and a softmax function is used to finally obtain the pedestrian’s crossing intention prediction . Our final intention result is 0 or 1, indicating crossing and not crossing, respectively:
where , , and denote the different weight matrices, indicates the bias vector, and q is a learnable parameter.
3.5. Experimental Procedure
In our study, we designed two corresponding data collection methods to construct the PO dataset to study the degree of pedestrian blindness observations and a dataset to study pedestrian hazard crossing intention recognition, prediction, and pedestrian interference status. The analysis and validation methods for the two were slightly different.
3.5.1. PO Dataset Acquisition
In order to obtain the pose clustering centroids when pedestrians were not observing the road condition and the pose clustering centroids and within the blind areas of pedestrian’s left and right fields of view, respectively, we first conducted an experiment to obtain the PO Dataset with the pedestrian blind observation features shown in Figure 8.
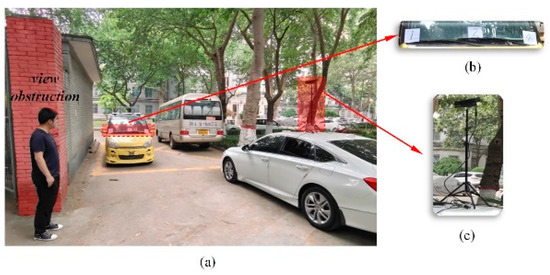
Figure 8.
Schematic diagram of the experimental data collection for the pedestrian blind spot observation status. (a) Schematic diagram of the experimental site. (b) Observed vehicle and information panels. (c) Camera used in the experiment.
Since the head steering angle, shoulder steering angle, and torso forward angle of the pedestrians were not related to the height of the camera and the distance between them, we chose an area where the field of view was blocked by buildings, as shown in red in Figure 8a, to conduct the experiment. First, the experimenters (15 people) were asked to stand in the field of view occlusion area. Furthermore, different pedestrians may have different body poses due to their different observation habits when observing traffic conditions in the blind zone. Therefore, in order to restore the observation habits of different types of pedestrians and obtain the corresponding body pose with a small number of experimenters, we randomly placed information panels showing the numbers 1–10 on the left, middle, and right parts of the front windshield of the yellow test vehicle, as shown in Figure 8b. We asked each experimenter to read the corresponding position in the field of view blocked by the wall and to maintain a pose such that they could read the panel for 3 s for later data extraction. Meanwhile, the corresponding pose information was captured and recorded by the depth camera, as shown in Figure 8c.
3.5.2. Other Data Acquisition
The camera shown in Figure 9a used infrared to acquire depth information without calculations during the data processing. It exported the data to the supporting software. Therefore, the software parameters are not noted separately here.
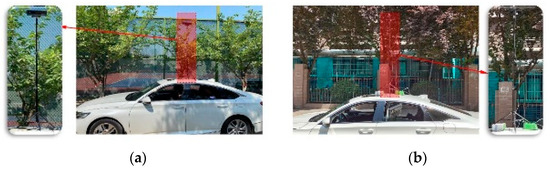
Figure 9.
Schematic diagram of the data acquisition device. In (a), an infrared-based method was used to acquire the image depth. In (b), the image depth was acquired based on the binocular vision imaging method.
The internal parameters of the depth camera used in Figure 9b are shown in Table 3, where fx and fy are the focal lengths of the left and right-side cameras, respectively, and b is the baseline length between the left and right-side cameras.
Table 3.
Parameters of the binocular camera.
In addition, during the actual data collection process, we needed to alert pedestrians to avoid accidents when vehicles were in their blind spots and they had hazardous crossing intentions. It was assumed that the experimental equipment would distract the pedestrians, resulting in changes in the crossing pose. Thus, we watched videos of traffic accidents caused by obstructed vision, and the experimenters imitated the behaviors of pedestrians in the videos when the road conditions were safe and the corresponding data were collected.
4. Experiments
4.1. Evaluation Indicators
Considering that the pedestrian interference and blindness observation degree involved in the study were different from those of the traditional methods, the experimental investigation was divided into three experiments: a pedestrian interference experiment, pedestrian blindness observation degree experiment, and pedestrian crossing intention experiment. The evaluation criteria used in the pedestrian interference experiment and the pedestrian crossing intention experiment were Precision, Recall, F1-score, and Accuracy, which were calculated as follows:
Precision refers to the proportion of correctly classified positive samples among all the classified positive samples, Recall refers to the number of correctly predicted data among the true positive samples, F1-score is the weighted average of the Precision and Recall, and Accuracy is the proportion of correctly classified samples among all the samples, TP and FP refer to the correctly classified positive samples and incorrectly classified negative samples, respectively, and FN and TN refer to incorrectly classified positive samples and correctly classified negative samples, respectively.
4.2. Pedestrian Interference Recognition Experiment
To illustrate the effectiveness of selecting the pedestrian distance, azimuth angle, head observation angle, and action type classification as the input variables for interference analysis, we used the distance between pedestrians, as presented by Alahi et al., to evaluate the pedestrian interference as a comparison input variable [8]. We also selected the distance and angle between the pedestrians, as proposed by Xue et al., to evaluate the pedestrian interference as a comparison [5]. The calculations were performed with the network used in the pedestrian interaction evaluation feature module described above. To account for the influence of the dropout layer on the final results, we repeated the training and testing 50 times during each experiment and finally recorded the maximum, minimum, and average values of the Precision, Recall, F1-score, and Accuracy. The results are shown in Table 4.
Table 4.
Comparison results of input parameters for pedestrian interference recognition. Recognition Accuracy (Acc.), Recall (Rec.), F1-score (F1.), Precision (Pre.). Min, Max, and Average (Ave.) results.
The recognition results with only the distance between pedestrians as the input variable had the lowest values of all four evaluation indicators. In comparison, the recognition results with the pedestrian distances plus the angle between the two significantly improved the evaluation indicators. Compared to the above methods, the recognition results for our proposed method were significantly better than the results of the other two methods. Some of the experimental results are shown in Figure 10.
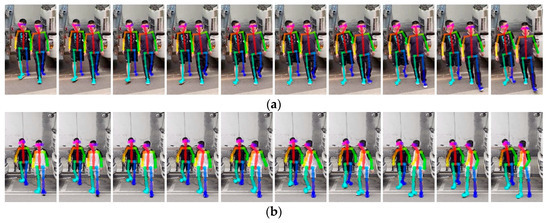
Figure 10.
Pedestrian interference recognition experiments: (a) calculated result had no behavioral interference between the two people, and (b) calculated result had behavioral interference between the two people.
4.3. Blind Observation State Classification Experiment
We used the K-means++ algorithm to cluster the PO data. The results are shown in Figure 11, from which we obtained the coordinates of the center point of the gesture cluster c1 when the pedestrian was not observing the road condition (i.e., looking forward) and the coordinates of the center point of the gesture clusters c2 and c3 when the pedestrian was observing the left and right sides within the blind area of the visual field, respectively. We defined the pose of each pedestrian using a triplet of angles (i.e., α, β, γ), where α was positive when the pedestrian’s head turned to the left, β was positive when the shoulder turned to the left, and γ was positive when the body leaned forward.
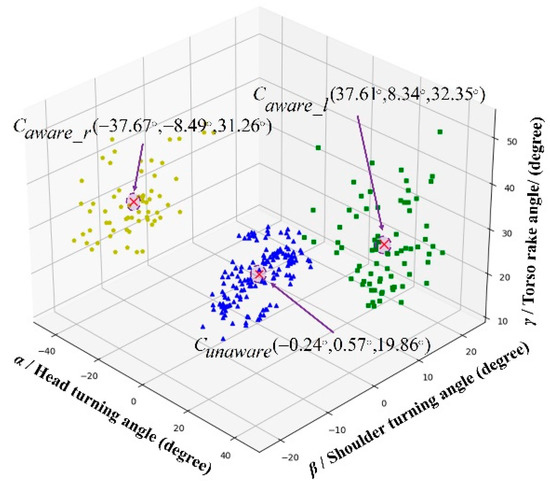
Figure 11.
Classification results of pedestrian blindness observation degree characteristics.
In addition, we constructed a test set from the pedestrian pose data collected under other view-obscuring scenarios to verify the classification effect of the obtained clustering centroids. The results showed that the above-mentioned clustering centroids provided a good classification benchmark for the pedestrian blindness observation degree states. Some of the experimental classification results are shown in Figure 12.
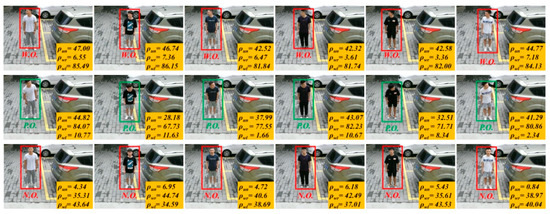
Figure 12.
Schematic diagram of pedestrian blind spot observation status classification. N.O. denotes “No Observation”, meaning the pedestrian did not observe the traffic condition in the blind zone. P.O. denotes “Proper Observation”, meaning the pedestrian observed the traffic condition in the blind zone, and W.O. denotes “Wrong Observation”, meaning the pedestrian’s observation direction was opposite to the position of the blind zone.
4.4. Pedestrian Hazardous Crossing Intention Recognition and Prediction Experiment
First, in terms of the types of pedestrian crossing intention recognition or prediction input variables, as shown in Table 5, we chose three control groups to be classified using our network separately to illustrate the validity of our selected input parameters. For the first control group, we compared the results for the proposed input variables with the results obtained with the input used by Goldhammer et al.—only the historical location of the pedestrian—for performing pedestrian trajectory prediction [8]. For the second control group, we compared results for the proposed input variables with the results obtained with the inputs used by Fang et al.—the historical location of the pedestrian and the 2D pose estimate—for performing pedestrian intention recognition [4]. For the third control group, we compared the results for the proposed input variables with the results obtained with the inputs used by Zhong et al.—the trajectory prediction using the pedestrian’s historical position and the 3D pose estimate—as input variables for comparison [46].
Table 5.
Comparison of results for various input parameters when predicting pedestrian hazardous crossing intention. Recognition Accuracy (Acc.), Recall (Rec.), F1-score (F1.), Precision (Pre.). Min, Max, and Average (Ave.) results.
Finally, we selected the 3D pose features, interference state features, pedestrian blind observation state features, and pedestrian speed features as input variables for comparison. The computational results with our selected input parameters were improved for all evaluation metrics compared to the input variables used for the control groups. Second, in terms of the pedestrian crossing intention recognition computational methods, considering that the pedestrian hazardous crossing intention prediction module was obtained based on an LSTM improvement in this paper, we choose an LSTM and its improved Bi-LSTM as two algorithms for comparison. In addition, Zhang et al. [6] used the SVM, RF, gradient boosting machine (GBM), and extreme gradient boosting machine (XGBM) for pedestrian crossing intention recognition in their study, and the accuracy of the RF algorithm was higher than those of the other algorithms. Therefore, we chose the RF algorithm as another algorithm control group. As shown in Table 6, our constructed IPVO-LSTM algorithm outperformed the other two algorithms overall in all evaluation metrics for pedestrian hazardous crossing intention recognition in view-obscured areas (in our study, the parameters of the RF were chosen as follows: the number of classifiers was 10, and the maximum depth of the decision tree was 15; the parameters of the LSTM and Bi-LSTM were selected as follows: the number of hidden units was set to 100, and the dropout rate was set to 0.5).
Table 6.
Comparison of results for various pedestrian hazardous crossing intention recognition algorithms. Recognition Accuracy (Acc.), Recall (Rec.), F1-score (F1.), Precision (Pre.). Min, Max, and Average (Ave.) results.
Second, in terms of the pedestrian crossing intention recognition computational methods, considering that the pedestrian hazardous crossing intention prediction module was obtained based on an LSTM improvement in this paper, we choose an LSTM and its improved Bi-LSTM as two algorithms for comparison. In addition, Zhang et al. [6] used the SVM, RF, gradient boosting machine (GBM), and extreme gradient boosting machine (XGBM) for pedestrian crossing intention recognition in their study, and the accuracy of the RF algorithm was higher than those of the other algorithms. Therefore, we choose the RF algorithm as another algorithm control group. As shown in Table 6, our constructed IPVO-LSTM algorithm outperformed the other two algorithms overall in all evaluation metrics for pedestrian hazardous crossing intention recognition in view-obscured areas (in our study, the parameters of the RF were chosen as follows: the number of classifiers was 10, and the maximum depth of the decision tree was 15; the parameters of the LSTM and Bi-LSTM were selected as follows: the number of hidden units was set to 100, and the dropout rate was set to 0.5).
Finally, in terms of intention prediction time range, according to vehicle dynamics, if the hazardous crossing intentions of pedestrians could be predicted appropriately in advance, a greater reaction time could be provided to the driver or the automated driving system. According to a study by Mercedes-Benz, Germany, it was found that if the driver could be warned 0.5 s earlier, 60% of traffic accidents could be effectively avoided [47]. Therefore, to ensure safety, we advanced the prediction time to 1 s to verify the intention prediction effectiveness of our method at 0.1, 0.5, and 1 s before the pedestrians crossed the street (this was achieved by adopting Zhang’s method of independent variable advancement [6]). The calculation results are shown in Table 7. With the increase in the time range, although the evaluation indices all decreased, even in the case of 1 s advance, the indices were still able to be maintained above 0.88. In addition, some of the experimental results are shown in Figure 13.
Table 7.
Prediction results for different time horizons. Prediction Accuracy (Acc.), Recall (Rec.), F1-score (F1.), Precision (Pre.). Min, Max, and Average (Ave.) results.
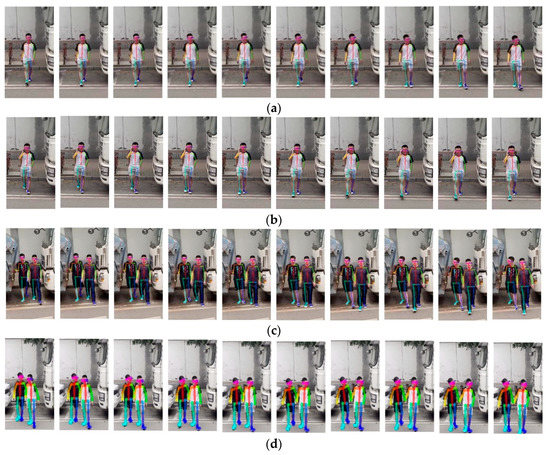
Figure 13.
Pedestrian hazardous crossing intention prediction experiment: (a) single person does not have a hazardous crossing intention, (b) single person has hazardous crossing intention, (c) pedestrians have hazardous crossing intention, and (d) pedestrians do not have hazardous crossing intention.
5. Conclusions
In this study, we used pedestrian interaction state features, pedestrian 3D pose features, pedestrian velocity features, and pedestrian blind observation state features as input data and constructed an ff-LSTM to fuse the above features, providing a method for recognizing and predicting pedestrian crossing intentions when views are obstructed. We also verified the effectiveness of our given pedestrian interference judgment method by comparison experiments. In the experimental section, the advancement of our method was verified from three perspectives: input parameter selection, intention recognition algorithm, and intention prediction time range. In the input parameter selection and intention recognition algorithm experiments, the mean values of our method’s four evaluation metrics (Recognition Accuracy, Recall rate, F1-score, and Precision) were 0.974, 0.975, 0.978, and 0.976, which are higher than other commonly used methods. In the intention prediction time range experiment, our method achieved 0.889, 0.888, 0.898, and 0.911 for the four evaluation metrics, even though 1 s advanced the independent variable. The limitations of our study are mainly the following:
- As the system relies on vision sensors, we may not be able to make accurate decisions at night, in bad weather, fog, dust, or when the pedestrian is far from the camera.
- Only the case between two pedestrians is considered in the pedestrian interaction module, and the case of three or more people is not covered.
- We did not consider hazardous crossing intentions caused by the irrational behavior of pedestrians, e.g., when pedestrians intentionally cross the street with the intention of blackmailing or killing themselves after spotting vehicles in the blind spot.
To address the above problems, subsequent studies can consider adding sensors such as radar, improving the model accordingly to reduce the impact of ambient lighting and camera hardware limitations on the recognition and prediction, and adding the group activity recognition (GAR) algorithm to achieve pedestrian behavior recognition for more than two people [48].
As for the hazardous crossing problem caused by the irrational behavior of pedestrians, we can consider introducing the quantum-mechanics-based irrational driving behavior decision method in our previous study [49].
Author Contributions
Conceptualization, J.Z.; methodology, J.Z.; software, J.Z., X.B. and W.H.; validation, J.Z., X.B. and W.H.; formal analysis, J.Z.; investigation, J.Z.; data curation, J.Z. and W.H.; writing—original draft preparation, J.Z.; writing—review and editing, J.Z.; visualization, J.Z., X.B.; supervision, J.Z.; project administration, J.Z.; funding acquisition, J.Z. All authors have read and agreed to the published version of the manuscript.
Funding
This research was funded by [National Natural Science Foundation of China] grant number [52202501], [Natural Science Foundation of Shaanxi Province] grant number [2022JQ-546] and [Research Initiation Fund of Xi’an University of Technology] grant number [118-451119003].
Institutional Review Board Statement
Not applicable.
Informed Consent Statement
Not applicable.
Data Availability Statement
Research data can be obtained by contacting us at our emails.
Conflicts of Interest
The authors declare no conflict of interest.
References
- WHO. Global Status Report on Road Safety 2018 (World Health Organization (WHO). 2018. Available online: http://www.who.int/violence_injury_prevention/road_safety_status/2018/en/ (accessed on 24 December 2021).
- Bahram, M.; Lawitzky, A.; Friedrichs, J.; Aeberhard, M.; Wollherr, D. A Game-Theoretic Approach to Replanning-Aware Interactive Scene Prediction and Planning. IEEE Trans. Veh. Technol. 2016, 65, 3981–3992. [Google Scholar] [CrossRef]
- Sighencea, B.I.; Stanciu, R.I.; Căleanu, C.D. A Review of Deep Learning-Based Methods for Pedestrian Trajectory Prediction. Sensors 2021, 21, 7543. [Google Scholar] [CrossRef] [PubMed]
- Fang, Z.; Lopez, A.M. Intention Recognition of Pedestrians and Cyclists by 2D Pose Estimation. IEEE Trans. Intell. Transp. Syst. 2019, 21, 4773–4783. [Google Scholar] [CrossRef]
- Xue, H.; Huynh, D.Q.; Reynolds, M. SS-LSTM: A Hierarchical LSTM Model for Pedestrian Trajectory Prediction. In Proceedings of the 2018 IEEE Winter Conference on Applications of Computer Vision (WACV), Lake Tahoe, NV, USA, 12–15 March 2018; pp. 1186–1194. [Google Scholar] [CrossRef]
- Zhang, S.; Abdel-Aty, M.; Wu, Y.; Zheng, O. Pedestrian Crossing Intention Prediction at Red-Light Using Pose Estimation. IEEE Trans. Intell. Transp. Syst. 2021, 23, 2331–2339. [Google Scholar] [CrossRef]
- Quan, R.; Zhu, L.; Wu, Y.; Yang, Y. Holistic LSTM for Pedestrian Trajectory Prediction. IEEE Trans. Image Process. 2021, 30, 3229–3239. [Google Scholar] [CrossRef]
- Alahi, A.; Goel, K.; Ramanathan, V.; Robicquet, A.; Fei-Fei, L.; Savarese, S. Social LSTM: Human Trajectory Prediction in Crowded Spaces. In Proceedings of the 29th IEEE Conference on Computer Vision and Pattern Recognition, Las Vegas, NV, USA, 26 June–1 July 2016; pp. 961–971. [Google Scholar] [CrossRef]
- Abughalieh, K.M.; Alawneh, S.G. Predicting Pedestrian Intention to Cross the Road. IEEE Access 2020, 8, 72558–72569. [Google Scholar] [CrossRef]
- Wu, Y.; Chen, G.; Li, Z.; Zhang, L.; Xiong, L.; Liu, Z.; Knoll, A. HSTA: A Hierarchical Spatio-Temporal Attention Model for Trajectory Prediction. IEEE Trans. Veh. Technol. 2021, 70, 11295–11307. [Google Scholar] [CrossRef]
- Kothari, P.; Kreiss, S.; Alahi, A. Human Trajectory Forecasting in Crowds: A Deep Learning Perspective. IEEE Trans. Intell. Transp. Syst. 2021, 23, 7386–7400. [Google Scholar] [CrossRef]
- Razali, H.; Mordan, T.; Alahi, A. Pedestrian intention prediction: A convolutional bottom-up multi-task approach. Transp. Res. Part C Emerg. Technol. 2021, 130, 103259. [Google Scholar] [CrossRef]
- Chen, T.; Tian, R.; Ding, Z. Visual Reasoning using Graph Convolutional Networks for Predicting Pedestrian Crossing Intention. In Proceedings of the IEEE/CVF International Conference on Computer Vision, Montreal, BC, Canada, 11–17 October 2021; pp. 3096–3102. [Google Scholar] [CrossRef]
- Yau, T.; Malekmohammadi, S.; Rasouli, A.; Lakner, P.; Rohani, M.; Luo, J. Graph-SIM: A Graph-based Spatiotemporal Interaction Modelling for Pedestrian Action Prediction. In Proceedings of the 2021 IEEE International Conference on Robotics and Automation, Xi’an, China, 30 May–5 June 2021; pp. 8580–8586. [Google Scholar] [CrossRef]
- Sun, J.; Jiang, Q.; Lu, C. Recursive Social Behavior Graph for Trajectory Prediction. In Proceedings of the IEEE/CVF Conference on Computer Vision and Pattern Recognition, Seattle, WA, USA, 14–19 June 2020; pp. 657–666. [Google Scholar] [CrossRef]
- Ma, W.-C.; Huang, D.-A.; Lee, N.; Kitani, K.M. Forecasting Interactive Dynamics of Pedestrians with Fictitious Play. In Proceedings of the IEEE Conference on Computer Vision and Pattern Recognition, Venice, Italy, 21–26 July 2017; pp. 4636–4644. [Google Scholar] [CrossRef]
- Saleh, K.; Hossny, M.; Nahavandi, S. Real-time Intent Prediction of Pedestrians for Autonomous Ground Vehicles via Spatio-Temporal DenseNet. In Proceedings of the 2019 International Conference on Robotics and Automation, Montreal, QC, Canada, 20–24 May 2019. [Google Scholar] [CrossRef]
- Goldhammer, M.; Kohler, S.; Zernetsch, S.; Doll, K.; Sick, B.; Dietmayer, K. Intentions of Vulnerable Road Users—Detection and Forecasting by Means of Machine Learning. IEEE Trans. Intell. Transp. Syst. 2019, 21, 3035–3045. [Google Scholar] [CrossRef]
- Guo, C.; Kidono, K.; Terashima, R.; Kojima, Y. Humanlike Behavior Generation in Urban Environment Based on Learning-Based Potentials with a Low-Cost Lane Graph. IEEE Trans. Intell. Veh. 2017, 3, 46–60. [Google Scholar] [CrossRef]
- Zhao, J.; Li, Y.; Xu, H.; Liu, H. Probabilistic Prediction of Pedestrian Crossing Intention Using Roadside LiDAR Data. IEEE Access 2019, 7, 93781–93790. [Google Scholar] [CrossRef]
- Scholler, C.; Aravantinos, V.; Lay, F.; Knoll, A. What the Constant Velocity Model Can Teach Us About Pedestrian Motion Prediction. IEEE Robot. Autom. Lett. 2020, 5, 1696–1703. [Google Scholar] [CrossRef]
- Li, P.; Abdel-Aty, M.; Cai, Q.; Islam, Z. A Deep Learning Approach to Detect Real-Time Vehicle Maneuvers Based on Smartphone Sensors. IEEE Trans. Intell. Transp. Syst. 2020, 23, 3148–3157. [Google Scholar] [CrossRef]
- Konrad, S.G.; Shan, M.; Masson, F.R.; Worrall, S.; Nebot, E. Pedestrian Dynamic and Kinematic Information Obtained from Vision Sensors. In Proceedings of the 2018 IEEE Intelligent Vehicles Symposium (IV), Changshu, China, 26–30 June 2018; pp. 1299–1305. [Google Scholar] [CrossRef]
- Yan, Z.; Duckett, T.; Bellotto, N. Online learning for human classification in 3D LiDAR-based tracking. In Proceedings of the 2017 IEEE/RSJ International Conference on Intelligent Robots and Systems (IROS), Vancouver, BC, Canada, 24–28 September 2017; pp. 864–871. [Google Scholar] [CrossRef]
- Rasouli, A.; Kotseruba, I.; Kunic, T.; Tsotsos, J. PIE: A Large-Scale Dataset and Models for Pedestrian Intention Estimation and Trajectory Prediction. In Proceedings of the IEEE/CVF International Conference on Computer Vision, Seoul, Korea, 27 October–2 November 2019. [Google Scholar] [CrossRef]
- Kotseruba, I.; Rasouli, A.; Tsotsos, J.K. Joint attention in autonomous driving (JAAD). arXiv 2016, arXiv:1609.04741. [Google Scholar]
- Geiger, A.; Lenz, P.; Urtasun, R. Are we ready for autonomous driving? The KITTI vision benchmark suite. In Proceedings of the 2012 IEEE Conference on Computer Vision and Pattern Recognition (CVPR), Providence, RI, USA, 16–21 June 2012; pp. 3354–3361. [Google Scholar] [CrossRef]
- Brscic, D.; Kanda, T.; Ikeda, T.; Miyashita, T. Person Tracking in Large Public Spaces Using 3-D Range Sensors. IEEE Trans. Human-Machine Syst. 2013, 43, 522–534. [Google Scholar] [CrossRef]
- Strigel, E.; Meissner, D.; Seeliger, F.; Wilking, B.; Dietmayer, K. The Ko-PER intersection laserscanner and video dataset. In Proceedings of the 17th International IEEE Conference on Intelligent Transportation Systems (ITSC), Qingdao, China, 8–11 October 2014; pp. 1900–1901. [Google Scholar] [CrossRef]
- Robicquet, A.; Sadeghian, A.; Alahi, A.; Savarese, S. Learning Social Etiquette: Human Trajectory Understanding in Crowded Scenes. In Proceedings of the Computer Vision–ECCV 2016: 14th European Conference, Amsterdam, The Netherlands, 11–14 October 2016; pp. 549–565. [Google Scholar] [CrossRef]
- Cordts, M.; Omran, M.; Ramos, S.; Rehfeld, T.; Enzweiler, M.; Benenson, R.; Franke, U.; Roth, S.; Schiele, B. The Cityscapes Dataset for Semantic Urban Scene Understanding. In Proceedings of the 2016 IEEE Conference on Computer Vision and Pattern Recognition (CVPR), Las Vegas, NV, USA, 27–30 June 2016; pp. 3213–3223. [Google Scholar] [CrossRef]
- Awad, G.; Butt, A.A.; Curtis, K.; Lee, Y.; Fiscus, J.; Godil, A.; Blasi, S. Trecvid 2018: Benchmarking video activity detection, video captioning and matching, video storytelling linking and video search. Proceedings of TRECVID, Gaithersburg, MD, USA, 27 November 2018; pp. 1–37. [Google Scholar]
- Huang, X.; Wang, P.; Cheng, X.; Zhou, D.; Geng, Q.; Yang, R. The ApolloScape Open Dataset for Autonomous Driving and Its Application. IEEE Trans. Pattern Anal. Mach. Intell. 2019, 42, 2702–2719. [Google Scholar] [CrossRef]
- Bock, J.; Krajewski, R.; Moers, T.; Runde, S.; Vater, L.; Eckstein, L. The inD Dataset: A Drone Dataset of Naturalistic Road User Trajectories at German Intersections. In Proceedings of the 2020 IEEE Intelligent Vehicles Symposium (IV), Las Vegas, NV, USA, 19 October–13 November 2020; pp. 1929–1934. [Google Scholar] [CrossRef]
- Chang, M.-F.; Ramanan, D.; Hays, J.; Lambert, J.; Sangkloy, P.; Singh, J.; Bak, S.; Hartnett, A.; Wang, D.; Carr, P.; et al. Argoverse: 3D Tracking and Forecasting with Rich Maps. In Proceedings of the IEEE/CVF Conference on Computer Vision and Pattern Recognition, Long Beach, CA, USA, 15–20 June 2019; pp. 8740–8749. [Google Scholar] [CrossRef]
- Caesar, H.; Bankiti, V.; Lang, A.H.; Vora, S.; Liong, V.E.; Xu, Q.; Krishnan, A.; Pan, Y.; Baldan, G.; Beijbom, O. nuScenes: A Multimodal Dataset for Autonomous Driving. In Proceedings of the IEEE/CVF Conference on Computer Vision and Pattern Recognition, Seattle, WA, USA, 13–19 June 2020; pp. 11618–11628. [Google Scholar] [CrossRef]
- Kesten, R.; Usman, M.; Houston, J.; Pandya, T.; Nadhamuni, K.; Ferreira, A.; Yuan, M.; Low, B.; Jain, A.; Ondruska, S.; et al. Lyft Level 5 av Dataset. 2019. Available online: https://level5.lyft.com/dataset (accessed on 1 September 2019).
- Sun, P.; Kretzschmar, H.; Dotiwalla, X.; Chouard, A.; Patnaik, V.; Tsui, P.; Guo, J.; Zhou, Y.; Chai, Y.; Caine, B.; et al. Scalability in Perception for Autonomous Driving: Waymo Open Dataset. In Proceedings of the IEEE Conference on Computer Vision and Pattern Recognition (CVPR), Seattle, WA, USA, 14–19 June 2020; pp. 2446–2454. [Google Scholar]
- Patil, A.; Malla, S.; Gang, H.; Chen, Y.-T. The H3D Dataset for Full-Surround 3D Multi-Object Detection and Tracking in Crowded Urban Scenes. In Proceedings of the 2019 International Conference on Robotics and Automation (ICRA), Montreal, QC, Canada, 20–24 May 2019. [Google Scholar] [CrossRef]
- Hochreiter, S.; Schmidhuber, J. Long short-term memory. Neural Comput. 1997, 9, 1735–1780. [Google Scholar] [CrossRef]
- Li, Y.; He, Z.; Ye, X.; He, Z.; Han, K. Spatial temporal graph convolutional networks for skeleton-based dynamic hand gesture recognition. EURASIP J. Image Video Process. 2019, 2019, 78. [Google Scholar] [CrossRef]
- Harris, D.; Harris, S. Digital Design and Computer Architecture, 2nd ed.; Morgan Kaufmann: San Francisco, CA, USA, 2015; p. 129. ISBN 978-0-12-394424-5. [Google Scholar]
- Arthur, D.; Vassilvitskii, S. K-Means++: The Advantages of Careful Seeding; Stanford University: Stanford, CA, USA, 2007; pp. 1027–1035. [Google Scholar]
- Shahroudy, A.; Liu, J.; Ng, T.T.; Wang, G. NTU RGB+D: A Large Scale Dataset for 3D Human Activity Analysis. In Proceedings of the 2016 IEEE Conference on Computer Vision and Pattern Recognition (CVPR), Las Vegas, NV, USA, 27–30 June 2016; pp. 1010–1019. [Google Scholar]
- Liu, J.; Shahroudy, A.; Xu, D.; Kot, A.C.; Wang, G. Skeleton-Based Action Recognition Using Spatio-Temporal LSTM Network with Trust Gates. IEEE Trans. Pattern Anal. Mach. Intell. 2017, 40, 3007–3021. [Google Scholar] [CrossRef]
- Zhong, J.; Sun, H.; Cao, W.; He, Z. Pedestrian Motion Trajectory Prediction with Stereo-Based 3D Deep Pose Estimation and Trajectory Learning. IEEE Access 2020, 8, 23480–23486. [Google Scholar] [CrossRef]
- Zhang, Y.; Li, W.; Wang, X.; Zhao, J.; Yuan, Y. General design of vehicle safety assistant system based on machine vision and electronic control steering. In Proceedings of the 2010 International Conference on Computer Design and Applications, Qinhuangdao, China, 25–27 June 2010; pp. V3-20–V3-23. [Google Scholar] [CrossRef]
- Han, M.; Zhang, D.J.; Wang, Y.; Yan, R.; Yao, L.; Chang, X.; Qiao, Y. Dual-AI: Dual-path Actor Interaction Learning for Group Activity Recognition. In Proceedings of the IEEE/CVF Conference on Computer Vision and Pattern Recognition, New Orleans, LA, USA, 18–24 June 2022; pp. 2980–2989. [Google Scholar] [CrossRef]
- Song, Q.; Fu, W.; Wang, W.; Sun, Y.; Wang, D.; Zhou, J. Quantum decision making in automatic driving. Sci. Rep. 2022, 12, 11042. [Google Scholar] [CrossRef] [PubMed]


Disclaimer/Publisher’s Note: The statements, opinions and data contained in all publications are solely those of the individual author(s) and contributor(s) and not of MDPI and/or the editor(s). MDPI and/or the editor(s) disclaim responsibility for any injury to people or property resulting from any ideas, methods, instructions or products referred to in the content. |
© 2023 by the authors. Licensee MDPI, Basel, Switzerland. This article is an open access article distributed under the terms and conditions of the Creative Commons Attribution (CC BY) license (https://creativecommons.org/licenses/by/4.0/).