Abstract
Analyzing the condition and function of the heart is very important because cardiovascular diseases (CVDs) are responsible for high mortality rates worldwide and can lead to strokes and heart attacks; thus, early diagnosis and treatment are important. Phonocardiogram (PCG) signals can be used to analyze heart rate characteristics to detect heart health and detect heart-related diseases. In this paper, we propose a method for designing using wavelet analysis techniques and an ensemble of deep learning models from phonocardiogram (PCG) for heart sound classification. For this purpose, we use wavelet scattering transform (WST) and continuous wavelet transform (CWT) as the wavelet analysis approaches for 1D-convolutional neural network (CNN) and 2D-CNN modeling, respectively. These features are insensitive to translations of the input on an invariance scale and are continuous with respect to deformations. Furthermore, the ensemble model is combined with 1D-CNN and 2D-CNN. The proposed method consists of four stages: a preprocessing stage for dividing signals at regular intervals, a feature extraction stage through wavelet scattering transform (WST) and continuous wavelet transform (CWT), a design stage of individual 1D-CNN and 2D-CNN, and a classification stage of heart sound by the ensemble model. The datasets used for the experiment were the PhysioNet/CinC 2016 challenge dataset and the PASCAL classifying heart sounds challenge dataset. The performance evaluation is performed by precision, recall, F1-score, sensitivity, and specificity. The experimental results revealed that the proposed method showed good performance on two datasets in comparison to the previous methods. The ensemble method of the proposed deep learning model surpasses the performance of recent studies and is suitable for predicting and diagnosing heart-related diseases by classifying heart sounds through phonocardiogram (PCG) signals.
1. Introduction
From various physiological signals in the human body, important functions and the health status of the body can be indicated through phonocardiogram (PCG), electrocardiography (ECG), electroencephalography (EEG), electromyography (EMG), etc. [1]. PCG and ECG can diagnose heart-related diseases and diseases, EEG can diagnose brain-related diseases and diseases such as Epilepsy and Brain Tumors, and EMG can diagnose problems such as muscle diseases and nerve damage. According to statistics from the World Health Organization (WHO), Cardiovascular Diseases (CVDs) cause high mortality worldwide, and the current mortality rate is steadily increasing [2]. Early diagnosis and treatment are important because the symptoms of cardiovascular diseases include stroke and heart attack. To diagnose and predict cardiovascular disease, an analysis is possible using one-dimensional physiological signals, such as PCG and ECG, and images obtained through cardiac MRI, CT, ultrasound, etc. Among them, PCG refers to the recording of sounds generated by heart valves, atria, and blood flow during the heartbeat, and is a signal that can be identified when there is an abnormality in heart function or condition [3]. In addition, the PCG measurement method is noninvasive because it records heart sounds through a sensor and stethoscope, and can be measured in a simple and low-cost manner compared to other biological signal measurements. Because the heart plays essential roles and functions in survival, such as temperature control, nutrient delivery, blood pressure maintenance, and oxygen supply, information on the condition and function of the heart can be obtained through this organ, making it possible to diagnose cardiovascular diseases [4]. It is important to analyze PCG signals for early diagnosis and treatment of cardiovascular diseases. The PCG signal consisted of S1 (1st heart sound), S2 (2nd heart sound), S3 (3rd heart sound), and S4 (4th heart sound). S1 is the first heart sound during a heartbeat and is a signal produced when the mitral and tricuspid valves close when ventricular contraction begins. S2 is the second heart sound during the heartbeat and represents the signal that occurs when the ventricle ends systole and begins to relax, whereas S3 and S4 are low-frequency sounds that represent signals that appear in patients with cardiovascular disease [5,6]. In this way, we aimed to achieve a more accurate diagnosis using deep learning models to analyze and diagnose cardiac function from normal and abnormal cardiac signals.
PCG signals, which are biological signals, can be used to detect and classify heart diseases and abnormalities using machine and deep learning methods [7]. PCG sounds can be classified using machine learning classifiers such as the Support Vector Machine (SVM) and K-Nearest Neighbor (KNN) [8,9]. An SVM is an algorithm that classifies classes by determining the optimal decision boundary for class classification. If the input data are nonlinear, they can be classified by converting them into a high-dimensional feature space using a kernel trick [10,11]. KNN is an algorithm that classifies the k-closest classes of new data from training data using a distance metric [12].
Meanwhile, deep learning is a deep neural network comprising multiple hidden layers, and various network models can be used depending on the complexity and availability of the data. Deep learning is an artificial intelligence technology that is being actively researched in various fields, such as medicine, agriculture, robots, and self-driving cars. As it can automatically extract features and patterns from physiological signals and images, such as PCG, PCG, and EEG, it is suitable for processing data for disease classification, diagnosis, and lesion segmentation in the medical field. The Mel-Frequency Cepstral Coefficient (MFCC), which is widely used for PCG signal analysis, can effectively extract voice and audio signals by retaining important information and reducing dimensionality; however, since MFCC is weak in robustness to noise, it can affect various noises included in PCG acquisition [13]. Variable PCG signals contain various features depending on heart disease and appear in irregular patterns [14]. Due to this, there is a limitation that it is difficult to extract important information and characteristics. In addition, when using a single feature extraction method on PCG signals, considering the possibility of losing information owing to time changes, information, and features in various frequency domains, two types of analyses are possible: using wavelet analysis technology to extract features and classifying them using 1D-(Convolutional Neural Network) CNN and 2D-CNN.
The wavelet scattering transformation method and continuous wavelet transformation method, which can extract information and characteristics about transformation invariance and put limitations in PCG signals, can be used to extract characteristics from information such as the period, intensity, and frequency of the heartbeat. In addition, through the 1D-CNN model, it is possible to learn the temporal and spatial features of the signal, and hierarchical feature learning that allows pattern analysis by layer, making it possible to analyze heartbeat patterns and analyze the health status of the heart. Not only can the time and frequency domain characteristics be analyzed through the 2D-CNN model using the image converted from the 1D PCG signal to the 2D time-frequency domain, but also a multi-resolution analysis is possible; thus, the abnormal parts of the signal can be analyzed. Since each model represents different characteristics, combining the predicted values of the two models allows you to analyze your heart health with accurate and reliable results.
We propose a method for classifying heart sounds by the ensemble of the two classified models. The dataset used was the PhysioNet/CinC 2016 Challenge Dataset and the PASCAL Classifying Heart Sounds Challenge Dataset. Because the PCG signal appears differently for each person depending on the measurement method and the shape, size, and location of the heart and heart valves, the signal was divided at regular intervals to extract features. By extracting signal features from the segmented PCG signal through a Wavelet Scattering Transform (WST), a 1D-CNN suitable for the two datasets was designed. In addition, one-dimensional PCG signals are converted into two-dimensional images through CWT (Continuous Wavelet Transform), and among CNN’s transfer learning models, GoogleNet, ResNet50, and ResNet101 are used. The performance evaluation method is performed by the precision, recall, F1-score, sensitivity, and specificity. It was confirmed that the ensemble method of 1D-CNN and 2D-CNN using two wavelet analysis techniques improved the heart sound classification performance compared to the single feature extraction method.
The remainder of this paper is organized as follows. Section 2 describes heart sound classification as related research, and Section 3 describes the dataset, preprocessing method, feature extraction method, deep learning model, and proposed ensemble method as experimental methods. Section 4 describes the performance evaluation method and experimental results, and Section 5 concludes the paper.
2. Related Work
Research using deep learning is actively underway in various fields, but especially in the medical field, which has been attracting attention in recent years, lesion segmentation through biosignals such as PCG, ECG, EMG, and medical images such as MRI, CT scan, and ultrasound, and research on disease prediction and diagnosis is in progress.
Yaseen [15] extracted features from a PCG signal through the Mel Frequency Cepstral Coefficient (MFCC) and Discrete Wavelets Transform (DWT) and fused the two features. The performance results were analyzed using SVM, KNN, and a Deep Neural Network (DNN) for model learning and classification. M. Guven [8] divided the entire PCG signal into short time periods and merged the features extracted through high-order statistics, energy, frequency domain, and Mel Coefficients. Classification performance was evaluated using specific algorithms of the Decision Tree, Naive Bayes (NB), Fine Gaussian, KNN, and Ensemble Method models. S. K. Ghosh [9] extracted features from a time–frequency matrix based on the Fourier-based Synchrosqueezing Transform (FSST) to classify normal and abnormal PCG. The performance was evaluated using an SVM classifier to classify normal and pathological signals. M. Yildirim’s [16] proposed model consists of five stages. The first obtained a spectrogram through Mel-spectrogram from the audio signal, and the second used interpolation to generate new data. Third, the feature maps of the data were extracted through the Darknet53 architecture, fourth, the extracted feature maps were optimized using Relief as a feature selection method, and fifth, the obtained feature maps were classified using KNN, SVM, NB, Logistic Regression (LR), Random Forest (RF), Gradient Boosting Classifier (GBC), XGBoost, Light Gradient Boosting Machine (LGBM), and CatBoost model.
T. Alafif [17] extracted features using MFCC from PCG signals to automate the recognition of normal and abnormal heart rates and used transfer learning Inception-ResNet-v2 as a CNN model. N. Mei [18] proposed a PCG classification method based on WST and quality assessment. For feature extraction through WST, classification was conducted using an SVM classifier, and quality evaluation and normal and abnormal PCG were classified using the Root Mean Square of Successive Difference (RMSSD) and Ratio of Zero Crossing (RZC). D. S. Park [19] proposed three steps for heart sound classification: signal preprocessing, feature extraction, and classification. During preprocessing, noise was removed using a Band Pass Filter, and the length of all signals was set to the same 7 s. MFCC was used in the feature extraction process, and a CNN-based lightweight model with an Inverted Residual structure was used for heart sound classification. Y. Al-Issa [20] used the PhysioNet/CinC 2016 Challenge dataset and the publicly available open heartsounds dataset. The publicly available open heartsounds dataset includes five classes: normal, aortic stenosis, mitral stenosis, mitral regurgitation, and mitral valve prolapse. To develop a cardiac diagnostic system, they proposed a hybrid model that combined the components of a CNN and LSTM. F. Li [4] used the MFCC algorithm to extract features from PCG signals by fusing the PhysioNet/CinC 2016 Challenge dataset, the PASCAL Classifying Heart Sounds Challenge dataset, and the Yassen dataset. The extracted features are classified as Normal, Noise, and Abnormal using a deep residual network. S. K. Ghosh [21] proposed a Time-Frequency Domain DNN method to detect FHS Activity (FHSA) in PCG signals. The proposed method consists of a preprocessing step, Modified Gaussian Window-based Stockwell Transform (MGWST) step for time-frequency matrix evaluation, using the Shannon–Teager–Kaiser Energy (STKE) envelope, smoothing, and thresholding techniques to assess heart sound boundaries, TFD Shannon entropy (TFDSE) feature extraction step calculated through signal segmented components, and FHS component recognition step through a Stacked Autoencoder (SAE)-DNN model. S. Chowdhury [22] proposed the SpectroCardioNet deep learning network that can detect heart diseases using triple spectrograms of PCG signals. The triple spectrogram is a time-frequency domain representation generated through a spectrogram, a delta spectrogram, and a double delta spectrogram. SpectroCardioNet extracts important information from the frequency domain of a spectrogram and consists of a sequential feature extractor designed based on a Spectral Attention Block (SAB), Spectral Pattern Detectors (SpPDs), and 1D convolution to extract features from temporal and spatial information. D. Kinha [23] performed a preprocessing process to convert one-dimensional phonocardiogram signals into two-dimensional spectrograms for disease detection using phonocardiograms based on deep learning. The CNN model used for classification was a neural network expanded by adding a Shuffle Attention layer to ResNet18 and ResNet50. The shuffle Attention consists of squeeze-excite blocks and a channel shuffle layer.
3. Proposed Method
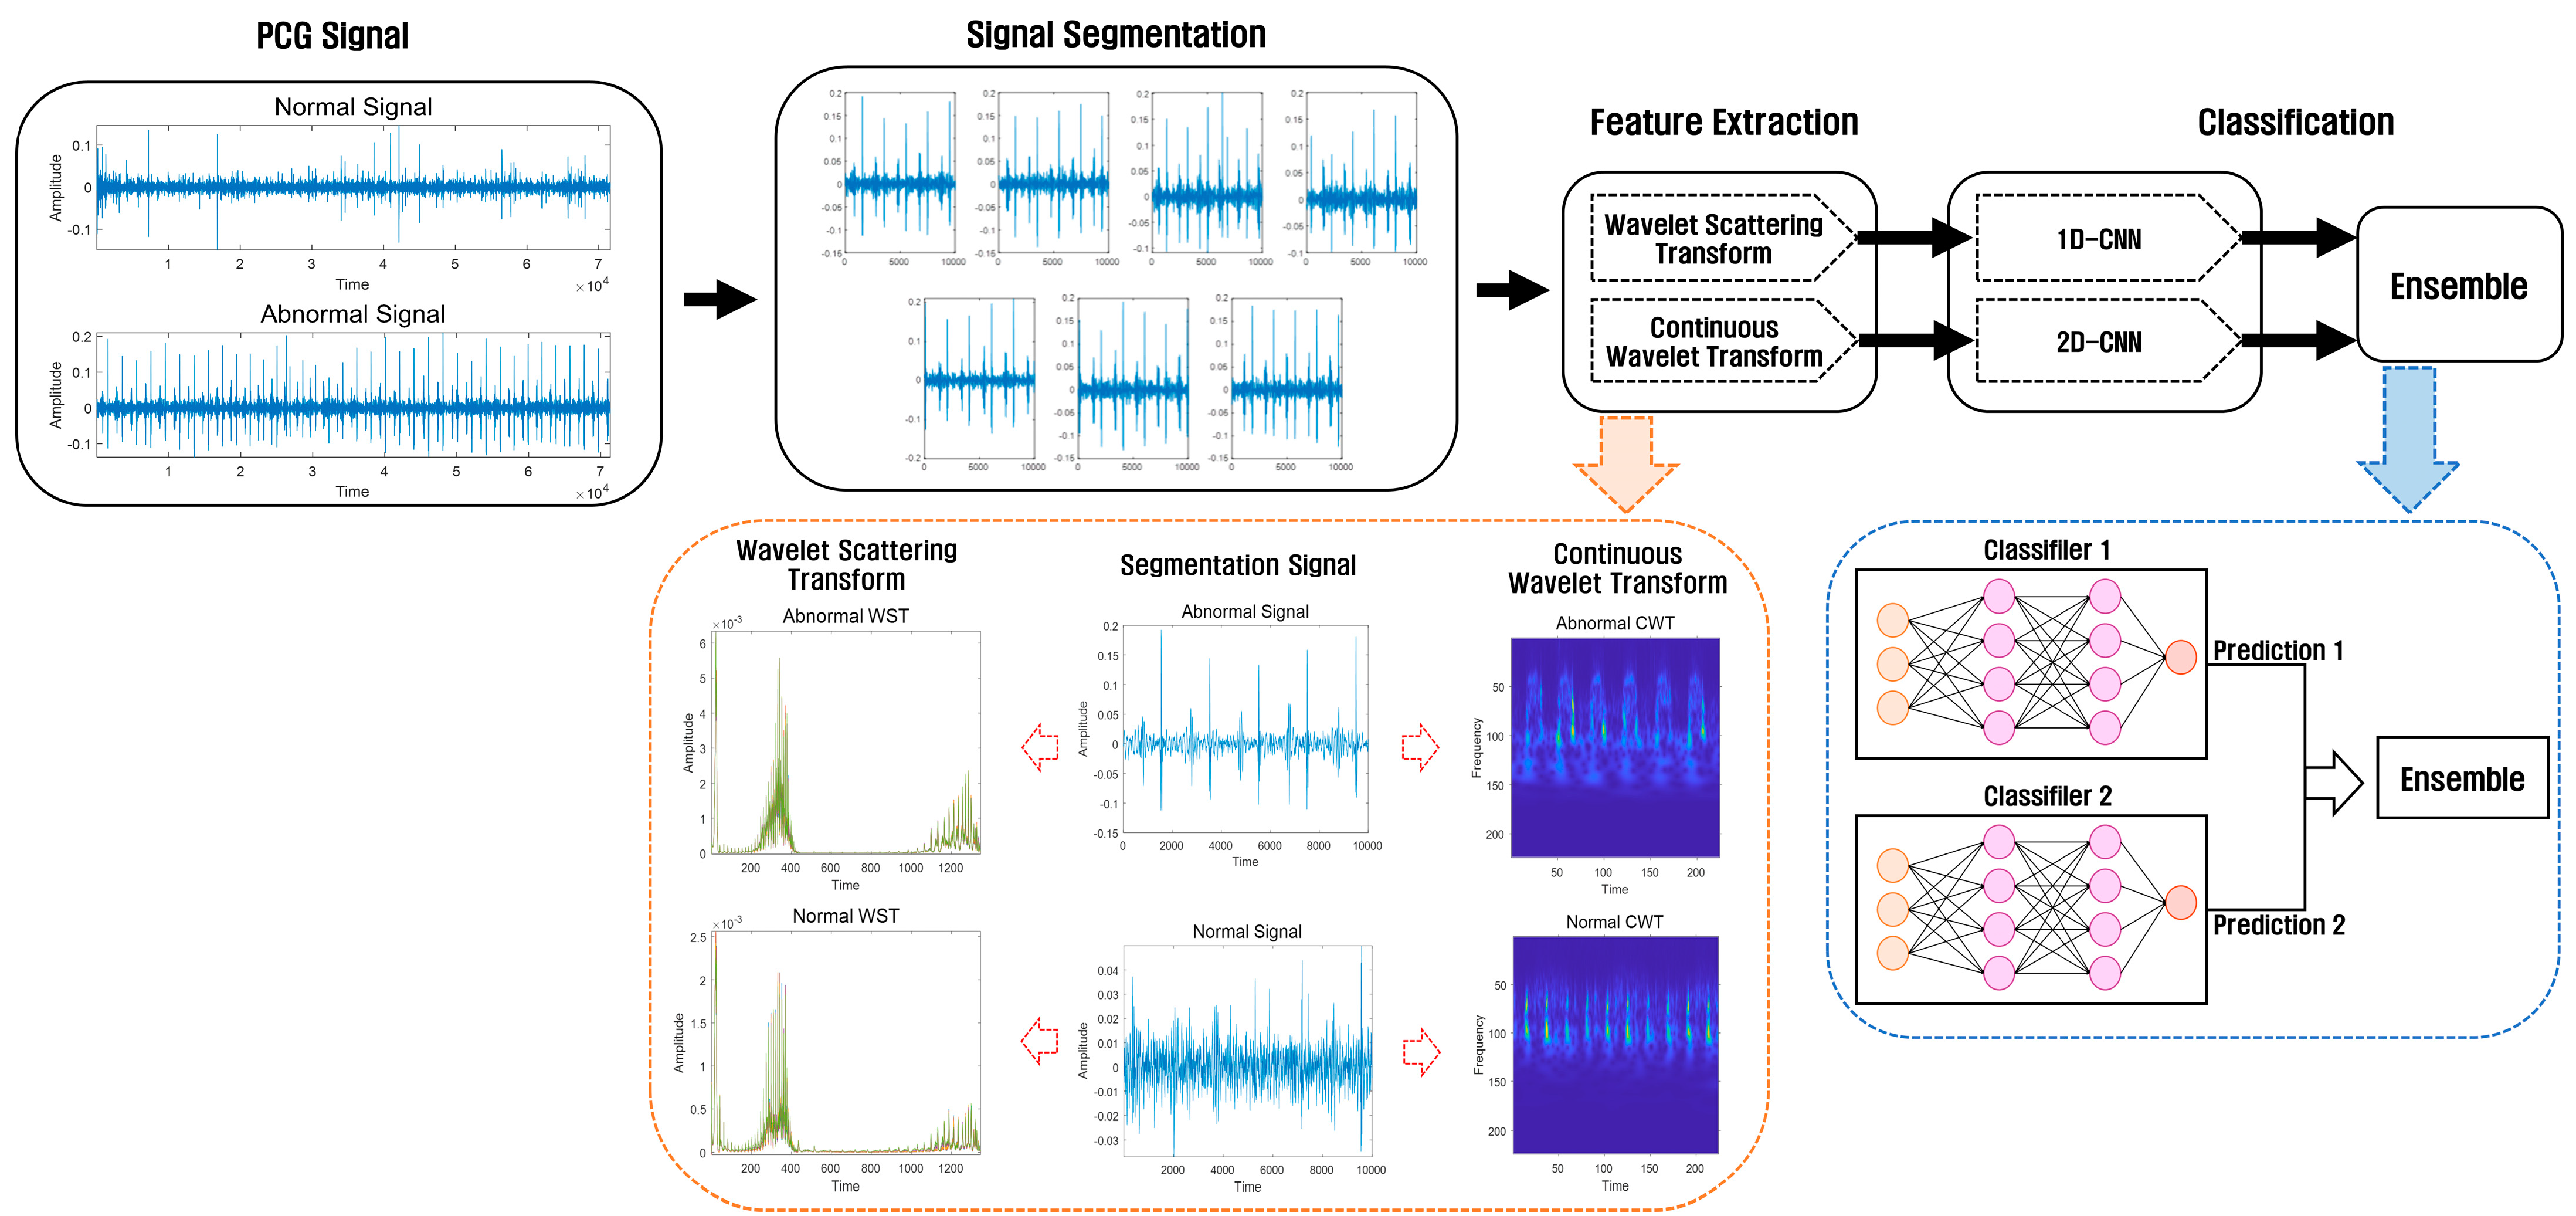
This study consisted of a preprocessing stage using a PCG dataset for heart sound classification, a feature extraction stage using Wavelet Scattering Transform and Continuous Wavelet Transform at regular intervals, a classification stage using 1D-CNN and 2D-CNN, and an ensemble stage combining the prediction values of the two models. After extracting features using the Wavelet Scattering Transform method and Continuous Wavelet Transform method, the features extracted using Wavelet Scattering Transform are classified using 1D-CNN, and the features extracted using Continuous Wavelet Transform are classified using 2D-CNN. We then use an ensemble method that combines the predicted values in the two models. Figure 1 shows the architecture of the ensemble method using a deep learning model based on the proposed wavelet analysis technology.

Figure 1.
Heart sound classification architecture using wavelet analysis technology and an ensemble of deep learning models.
3.1. Signal Segmentation
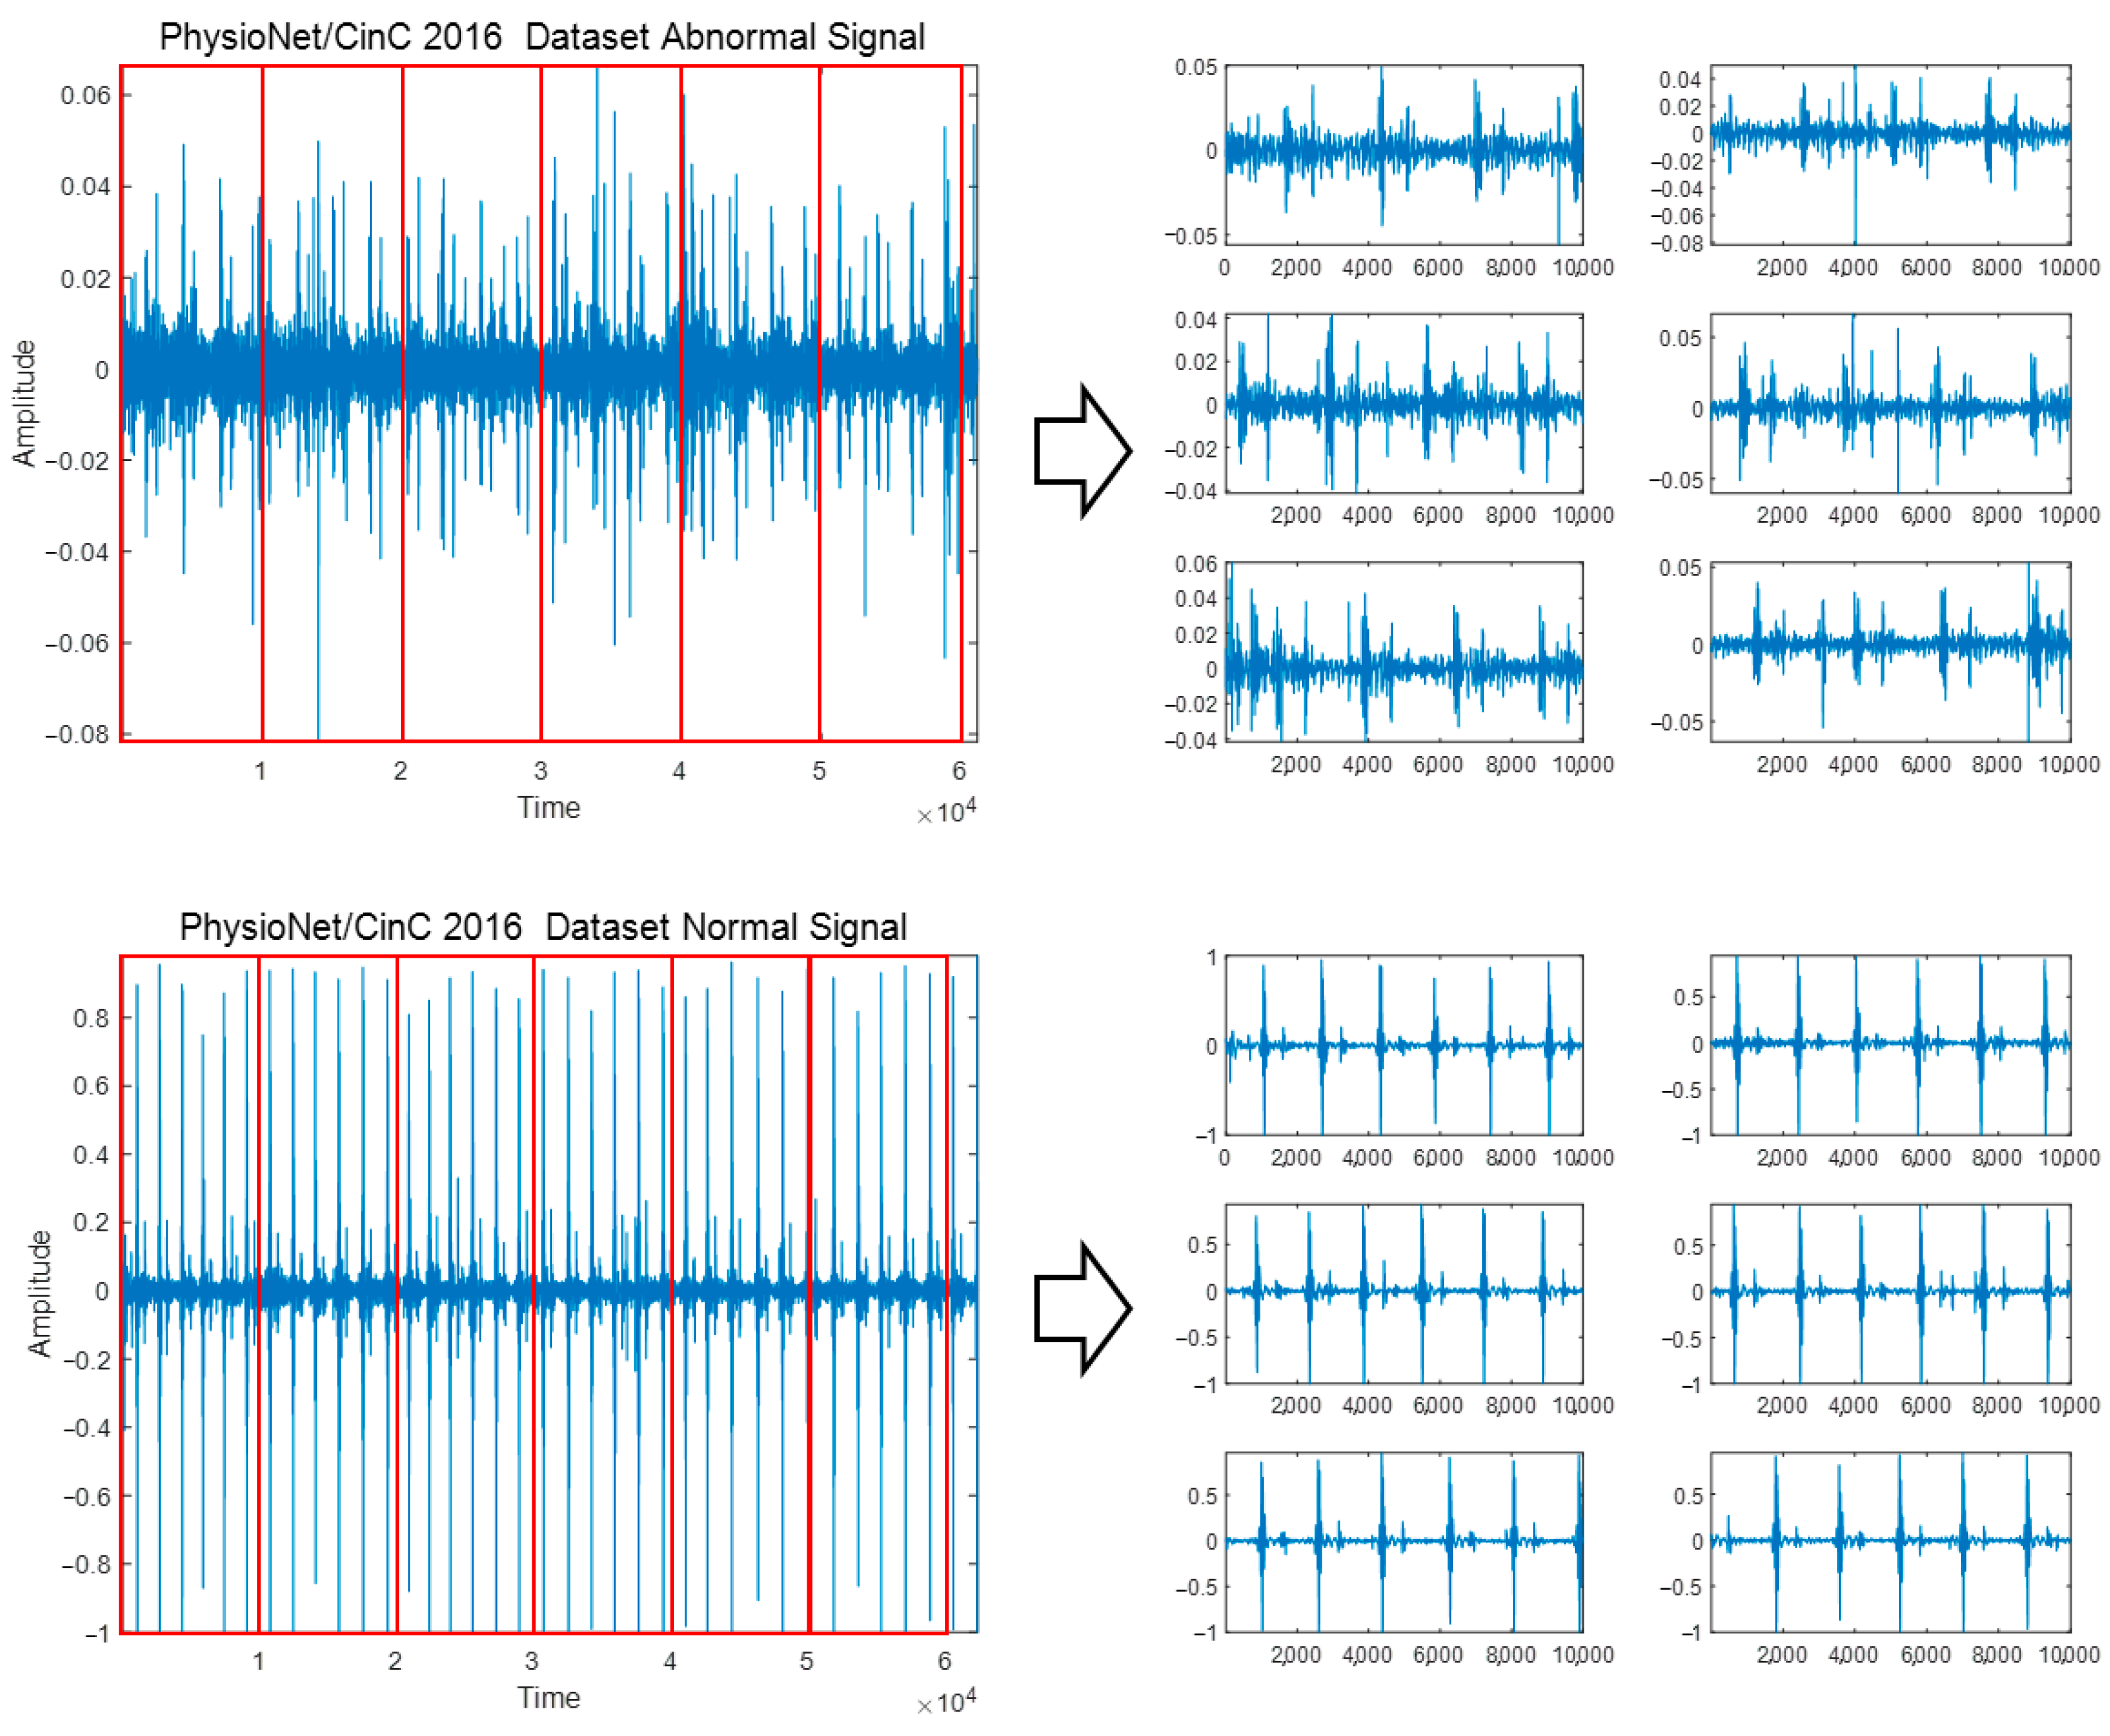
To classify diseases and heart sounds using PCG signals, preprocessing was performed to adjust the original signals containing various signal lengths to the same signal length. Additionally, because PCG signals occur differently for each person depending on the location, shape, size, and health status of the heart and heart valves, features in specific areas can be extracted in more detail through signal segmentation [24]. PCG signals are composed of various signal lengths, and by adjusting the original signal length to a constant length, important features in the signal can be confirmed. Information loss can occur in the process of cropping a long signal to fit a short signal or increasing a short time to a long signal. In addition, if a long signal is used as is without dividing it, important features and patterns that appear minutely in the S3 and S4 sections of the PCG signal, which may indicate heart-related diseases, may be missed; thus, a segmentation process is performed for accurate analysis and diagnosis results. To perform signal segmentation, each dataset is read, the division time interval of the original PCG signal is set, and the division is automatically performed using MATLAB’s ‘for’ loop so that the divided signals do not overlap. The signal divided from the original PCG signal corresponding to each class is saved as a new WAV file for that class, and the signal’s label is designated as the label belonging to each class. The minimum signal of the PhysioNet/CinC 2016 Challenge Dataset was 5.31 s, cut into 5-s segments and stored, and signals shorter than 5 s were not used. When dividing the PASCAL Classifying Heart Sounds Challenge Dataset A and Dataset B into 1 s, which is the minimum time, a signal that does not include the components S1, S2, S3, and S4 cycles of the PCG signal was included; therefore, it was divided into 3 s intervals. Figure 2 shows the signal segmentation process for the Abnormal and Normal classes of the PhysioNet/CinC 2016 Challenge Dataset.
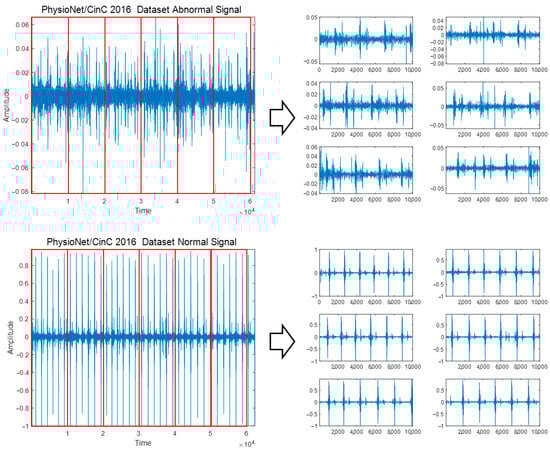
Figure 2.
Signal segmentation process for Abnormal and Normal classes of PhysioNet/CinC 2016 Challenge Dataset.
3.2. Feature Extraction
Wavelets are capable of analyzing signals in various time and frequency domains from time series, biological signals, audio signals, and images and are capable of multi-resolution analysis, allowing the extraction of fine features. In this study, wavelet scattering and continuous wavelet transforms were used based on wavelet analysis technology to extract features.
3.2.1. Wavelet Scattering Transform
Wavelet scattering transform is a method for analyzing multiple scales and frequencies, and can analyze signals through filler modulus, which can extract information and features about transform invariance [25,26]. In this way, it is possible to remove the characteristic information such as the period, frequency, and intensity of the heartbeat at various positions in the PCG signal, the noise of the measurement equipment generated during acquisition, and the noise generated in the surrounding environment. Therefore, important characteristic information in the signal can be extracted to analyze the heart health information and diagnose the heart related disease. Wavelet scattering transformation analyzes signals through a hierarchical method of wavelet analysis using a wavelet filter, calculation using the filtered modulus, and averaging, in which features are extracted through a scale filter. Features are extracted repeatedly such that the first output becomes the second input, and wavelet scattering is composed of a tree structure algorithm, as shown in Figure 3 [18].
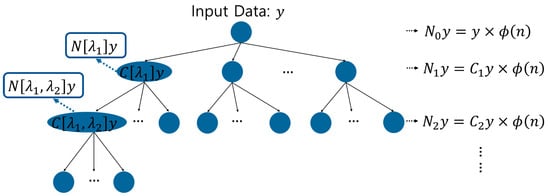
Figure 3.
Structural algorithm of wavelet scattering.
[Step 1] The 0 order scattering coefficient of the wavelet scattering transform is calculated through a convolution operation with the input data signal and is defined by Equation (1). represents the scale function. The scale function allows a hierarchical analysis of signals and is used for feature extraction.
[Step 2] For the 1st order scattering coefficient, the modulus calculation is obtained using the complex wavelet , as shown in Equation (2), and the 1st order scattering coefficient is obtained through averaging in Equation (3).
[Step 3] For the 1st order scattering coefficient, the modulus calculation is obtained using the complex. The 2nd order scattering coefficient repeats the step of generating the 1st order scattering coefficient to calculate the second modulus, as shown in Equation (4), and generates the second scattering coefficient through Equation (5).
[Step 4] The N-th order scattering coefficient can be generated by repeating the steps for generating the 1st order and 2nd order scattering coefficients.
Figure 4 shows some signals from which features were extracted using the WST for the Normal, Murmur, Extrahls Heart Sound, and Artifact classes of the PASCAL Classifying Heart Sounds Challenge Dataset A.
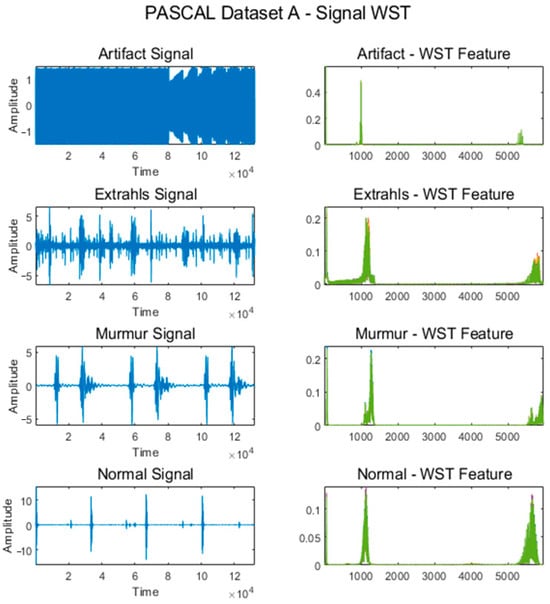
Figure 4.
WST for classes from PASCAL Classifying Heart Sounds Challenge Dataset A.
3.2.2. Continuous Wavelet Transform
The existing Fourier Transform does not consider the time domain of the signal, can only analyze the frequency domain, and has the limitation of being able to analyze only a fixed domain. To complement this, the wavelet transform can analyze signals that change over time, and because it enables a multi-resolution analysis through various scales, it can effectively extract changes over time and features from PCG signals that occur at various frequencies [27]. CWT is expressed as Equation (6), where is the input signal, and is the transformation parameter, which means that the signal is analyzed according to the wavelet function position or time change. is the wavelet function, and p is the scale parameter, which controls the compression and expansion of the wavelet function. In the case of a low scale, narrow resolution in the time domain and high resolution in the frequency domain are possible; therefore, detailed feature analysis of PCG signal problems, such as diseases and abnormalities, can be analyzed. Additionally, in the case of a high scale, the overall state of the signal can be analyzed with a wide resolution in the time domain and a low resolution in the frequency domain.
Figure 5 shows some signals from which features were extracted using CWT for the Normal, Murmur, Extrahls, and Artifact classes of the PASCAL Classifying Heart Sounds Challenge Dataset A.
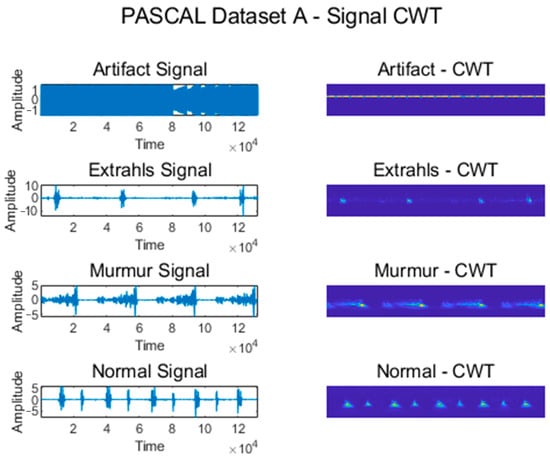
Figure 5.
CWT for classes from PASCAL Classifying Heart Sounds Challenge Dataset A.
3.3. Deep Learning Model
3.3.1. 1D-CNN
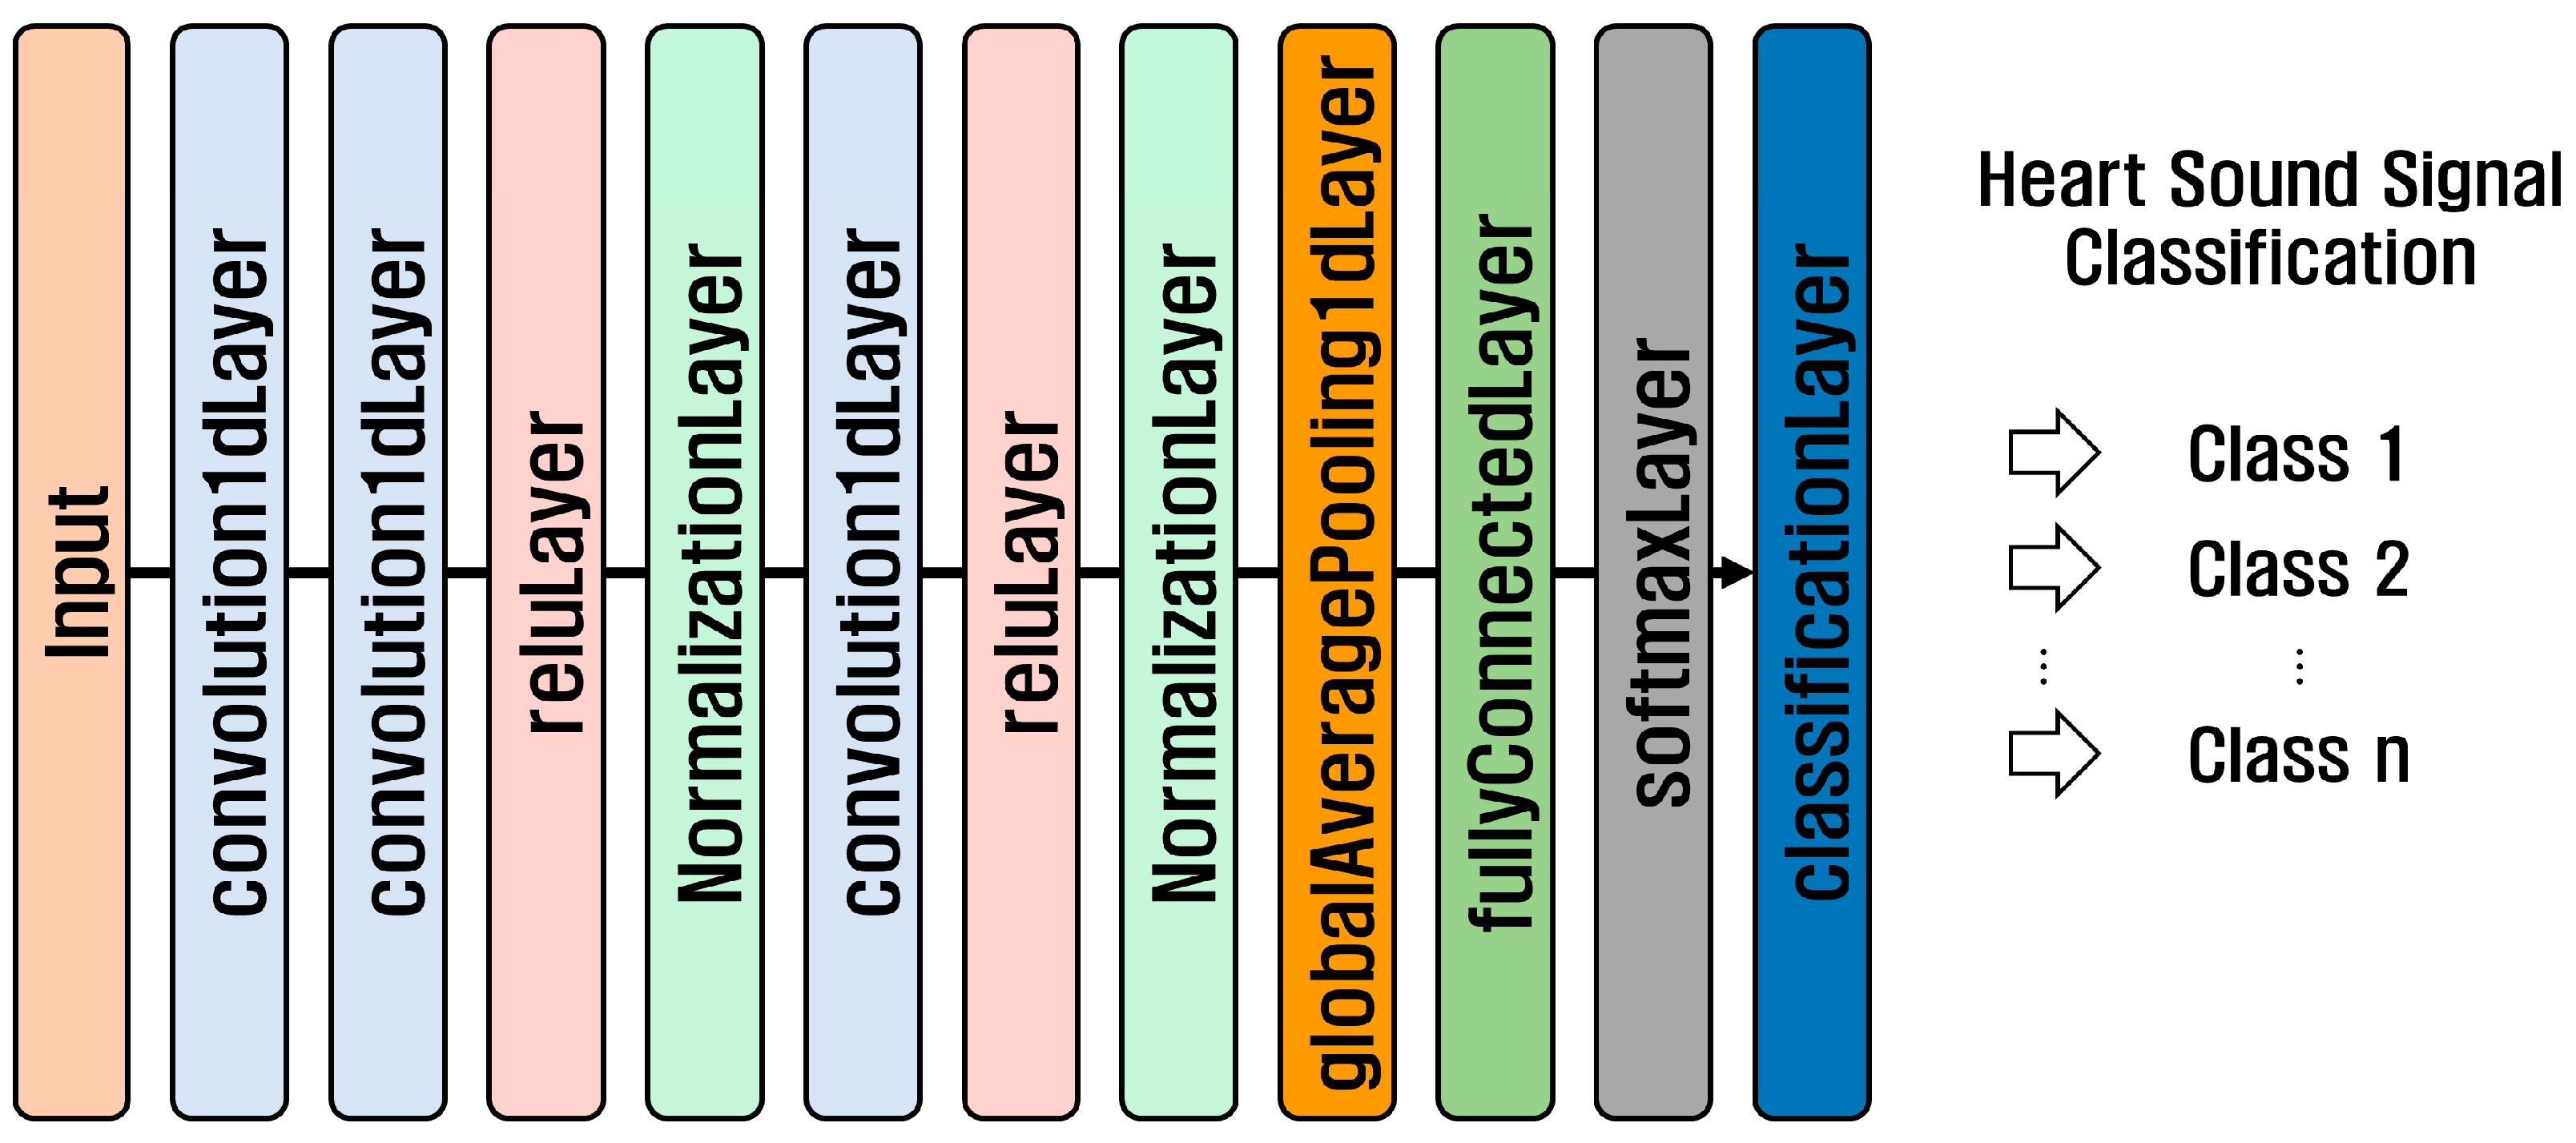
1D-CNN is a neural network used for the analysis of one-dimensional time series and sequence data. It is suitable for analyzing time-series data recorded as signals that change over time, such as biological signals, voices, and machine vibration signals, and sequence data arranged in order, such as sentences. The structure of a 1D-CNN consists of an input layer, convolution layer, activation function, pooling layer, flatten layer, fully connected layer, and output layer. Figure 6 shows the structure of the 1D-CNN model used in the PhysioNet/CinC 2016 Challenge Dataset and the PASCAL Classifying Heart Sounds Challenge Dataset.
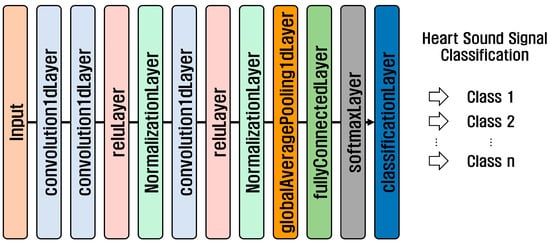
Figure 6.
1D-CNN structure.
3.3.2. 2D-CNN
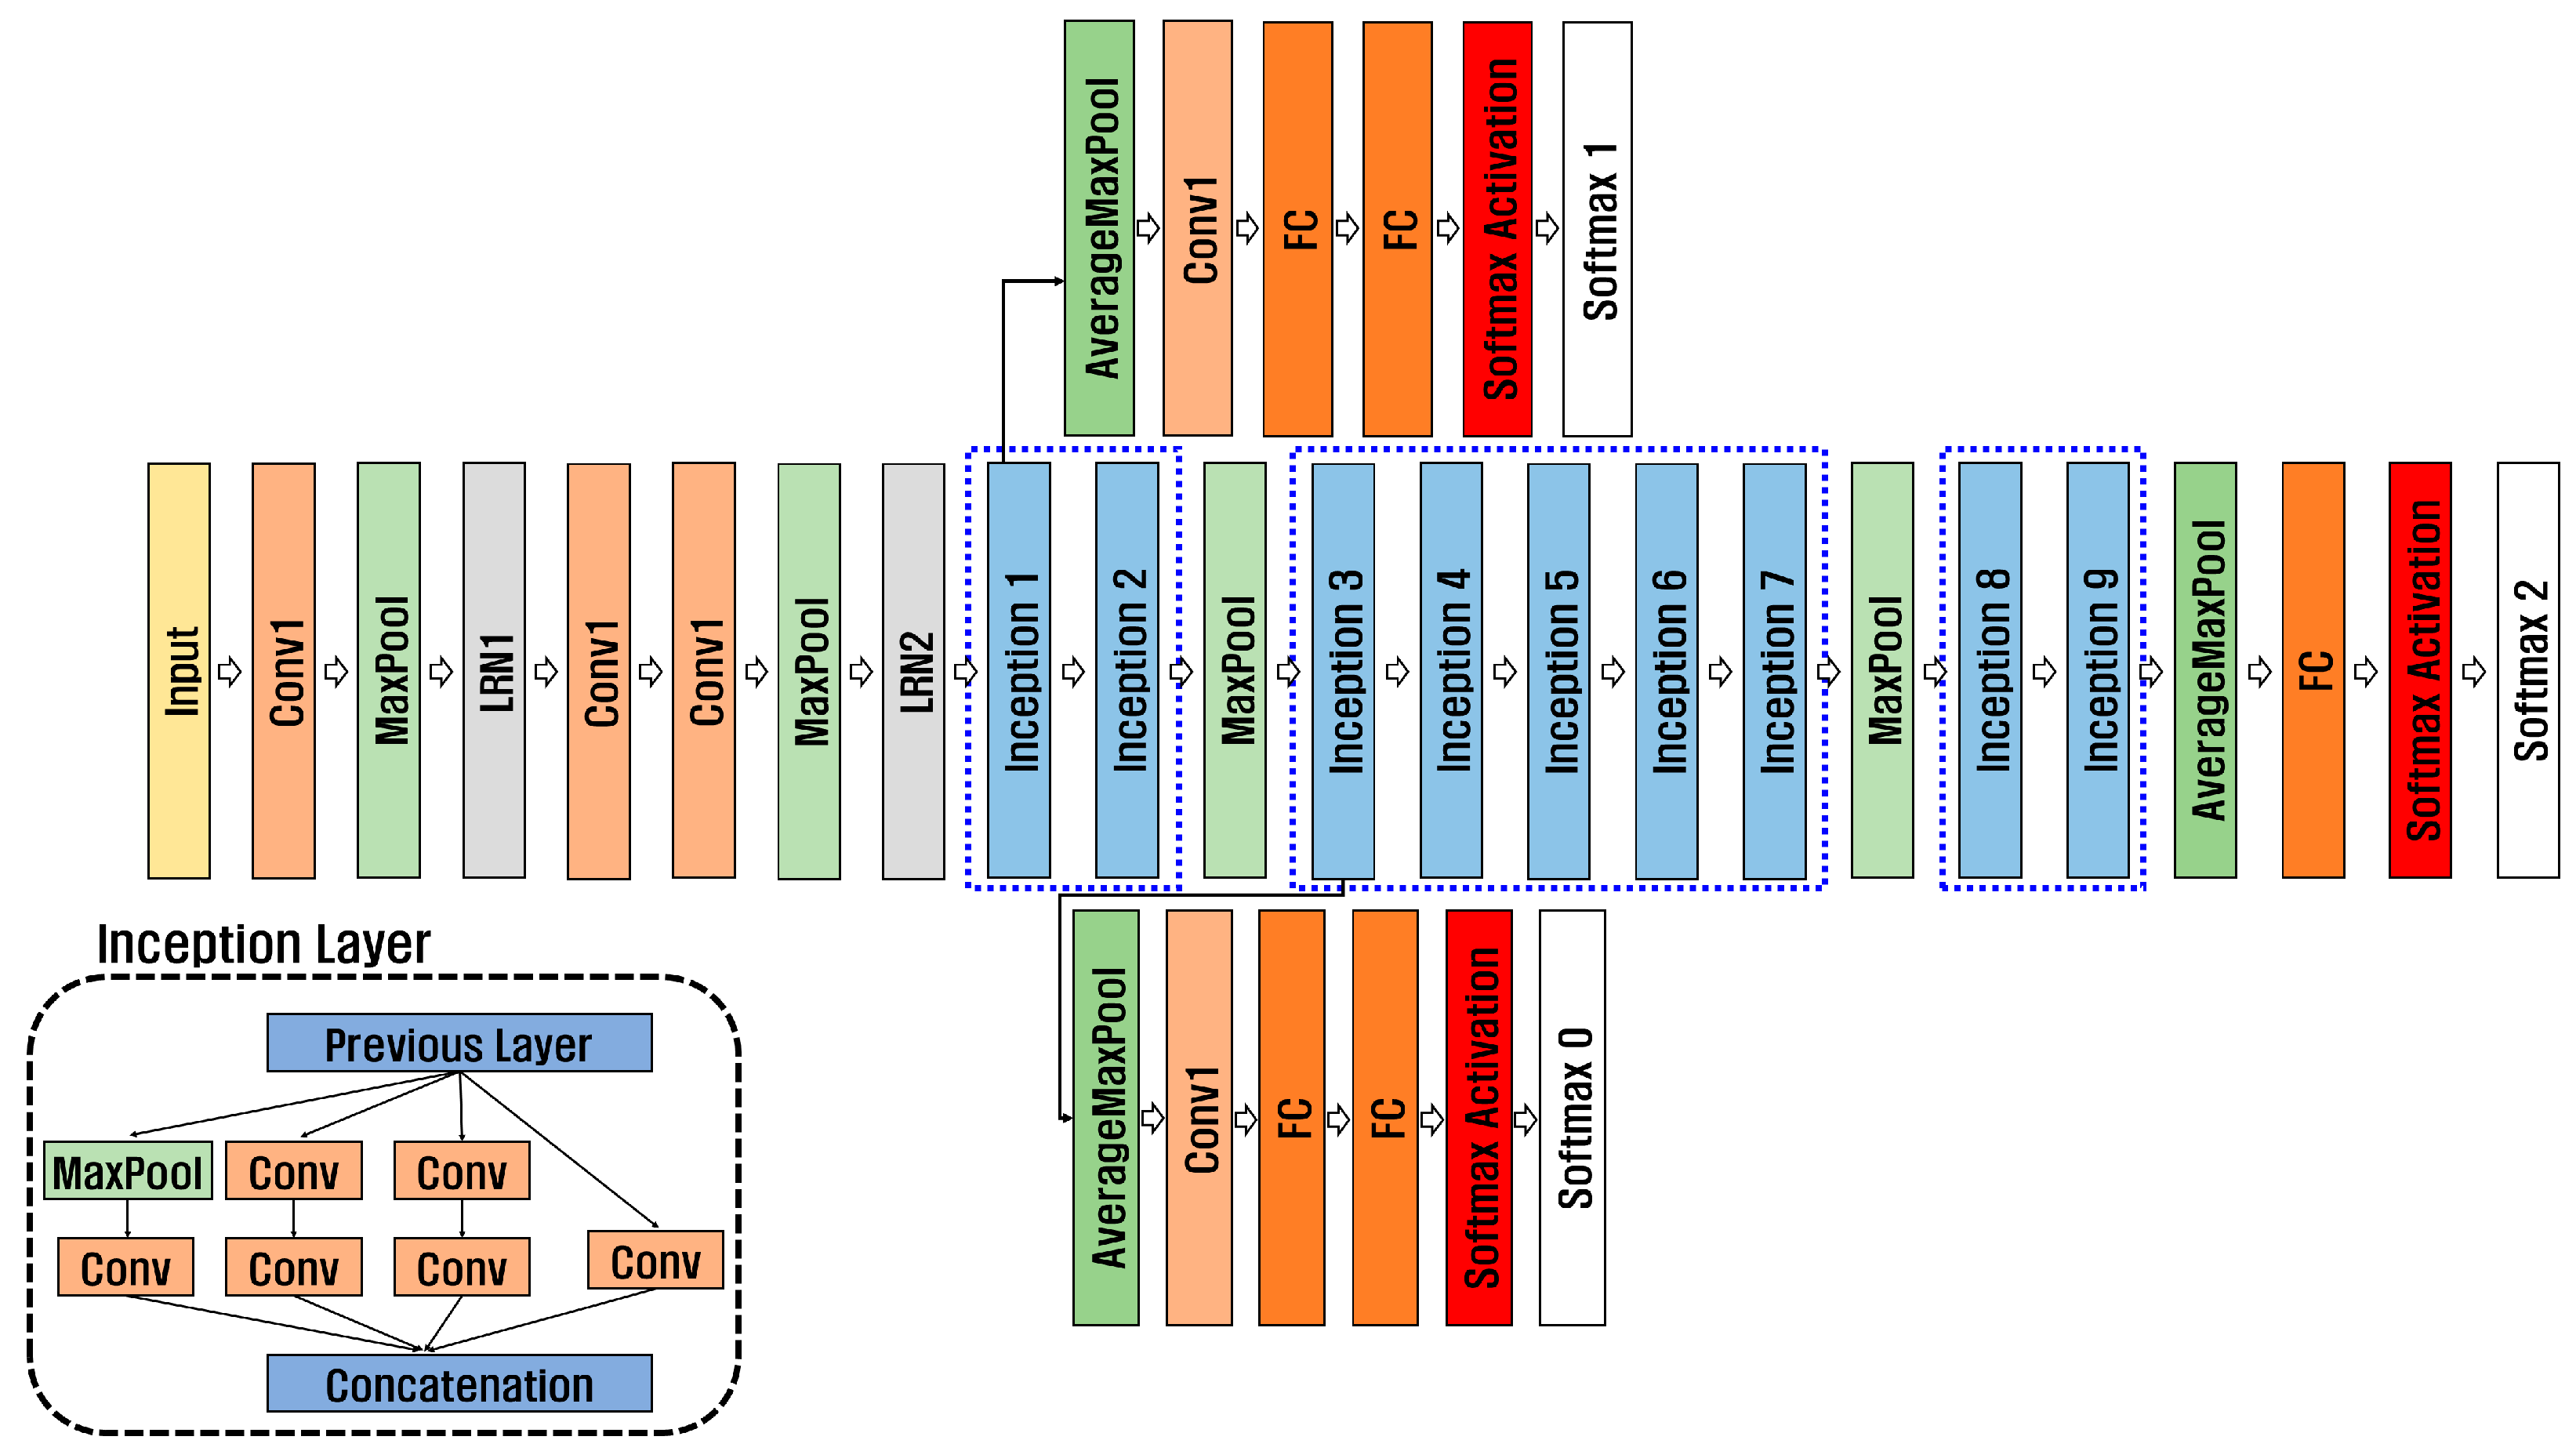
2D-CNN is a neural network designed to process image data. It can analyze hierarchical features within images, making it suitable for extracting detailed features from medical images and biosignals for disease prediction and diagnosis. In addition, a pre-trained model can use a small amount of data, save time, and effectively extract features. Classification performance can be improved through transfer learning models using datasets with insufficient amounts of data, such as those that need to be kept confidential for personal information protection, for example, biosignals and medical images necessary for disease prediction and accurate diagnosis. Pre-trained models include GoogleNet, ResNet, and SqueezeNet, and this paper used GoogleNet, ResNet50, and ResNet101. As shown in Figure 7, GoogleNet [28] has nine inception layers consisting of 1 × 1 convolution, 3 × 3 convolution, 5 × 5 convolution, and max pooling. To solve gradient vanishing, it consists of 22 deep networks, including an auxiliary classifier consisting of Global Average Pooling, Fully Connected 1, Fully Connected 2, and Softmax.

Figure 7.
Structure of GoogleNet.
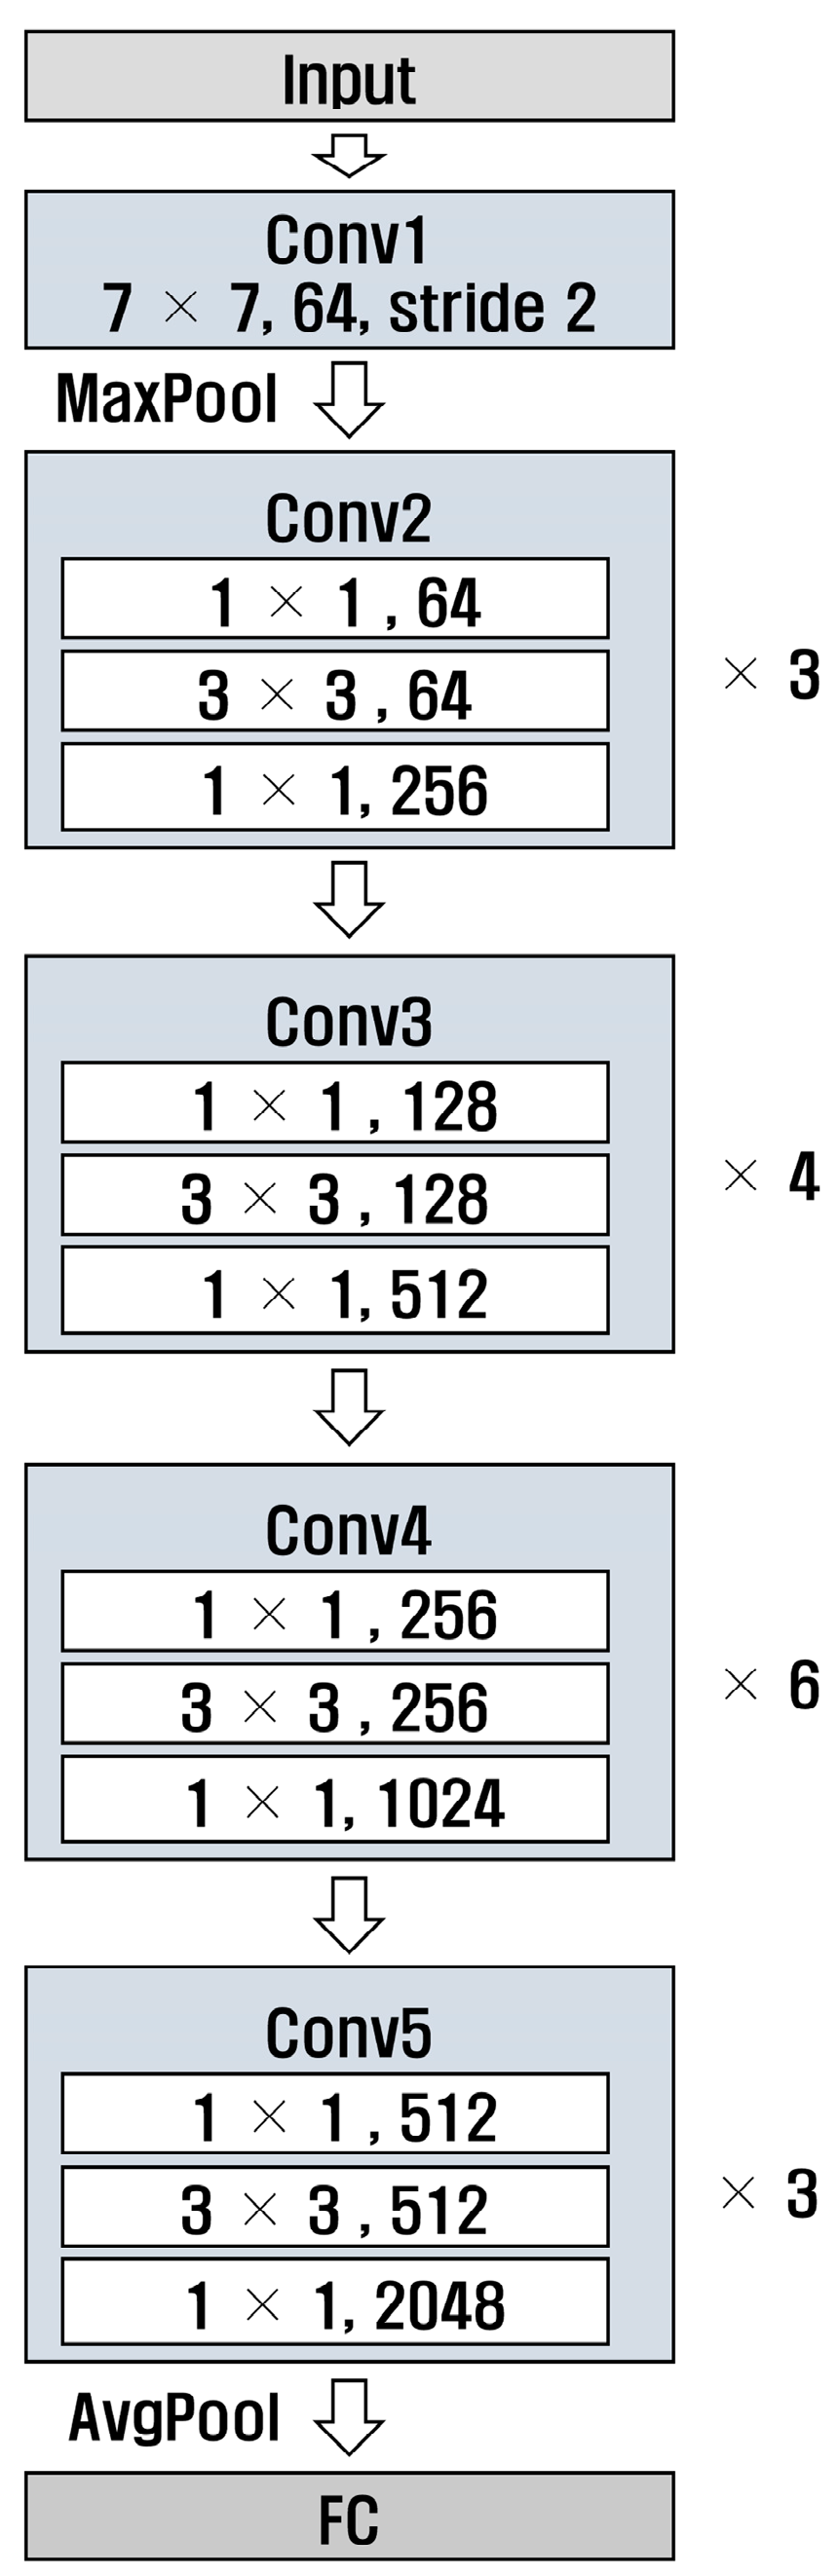
ResNet [29] is a deep neural network designed to solve gradient vanishing; the numbers 50 and 101 in ResNet refer to the number of layers in the model. Additionally, ResNet has a structure that uses residual connections, allowing it to learn complex patterns. Figure 8 and Figure 9 show the structures of ResNet50 and ResNet101, respectively. It can be observed that the number of layers in Conv4 was different.

Figure 8.
Structure of ResNet 50.
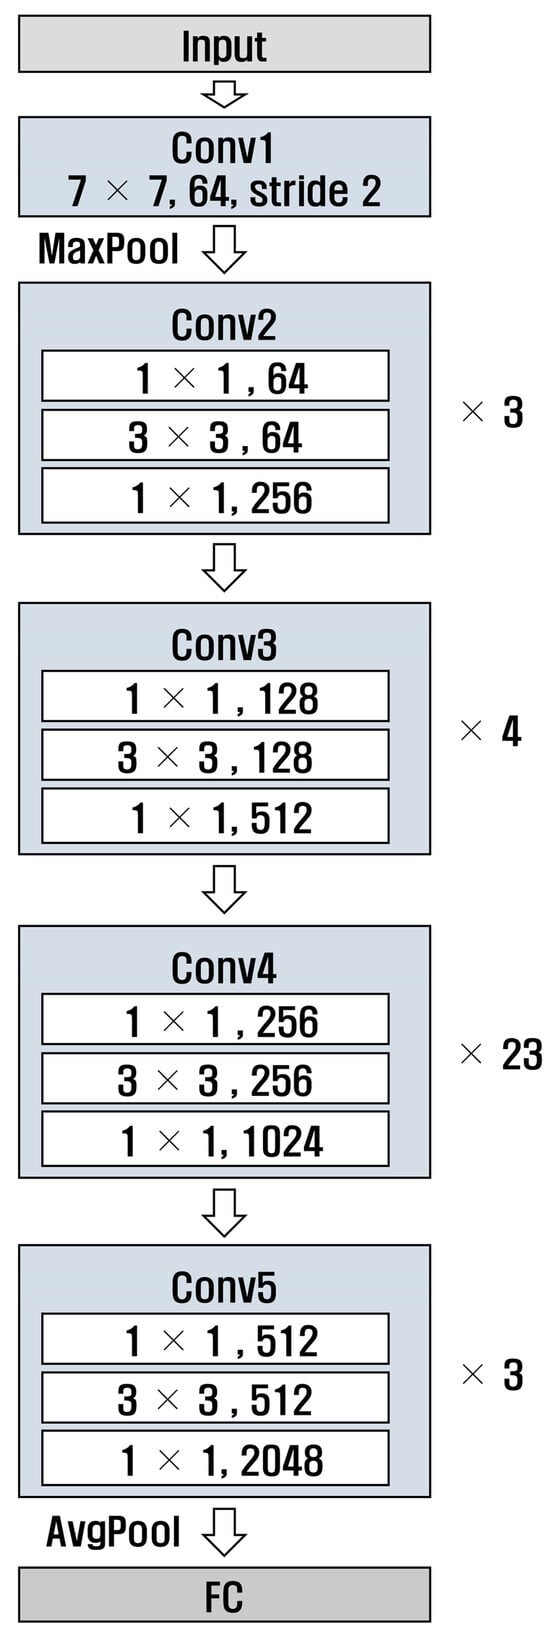
Figure 9.
Structure of ResNet 101.
3.4. Ensemble of Proposed CNN Model Based on Wavelet Analysis Technology
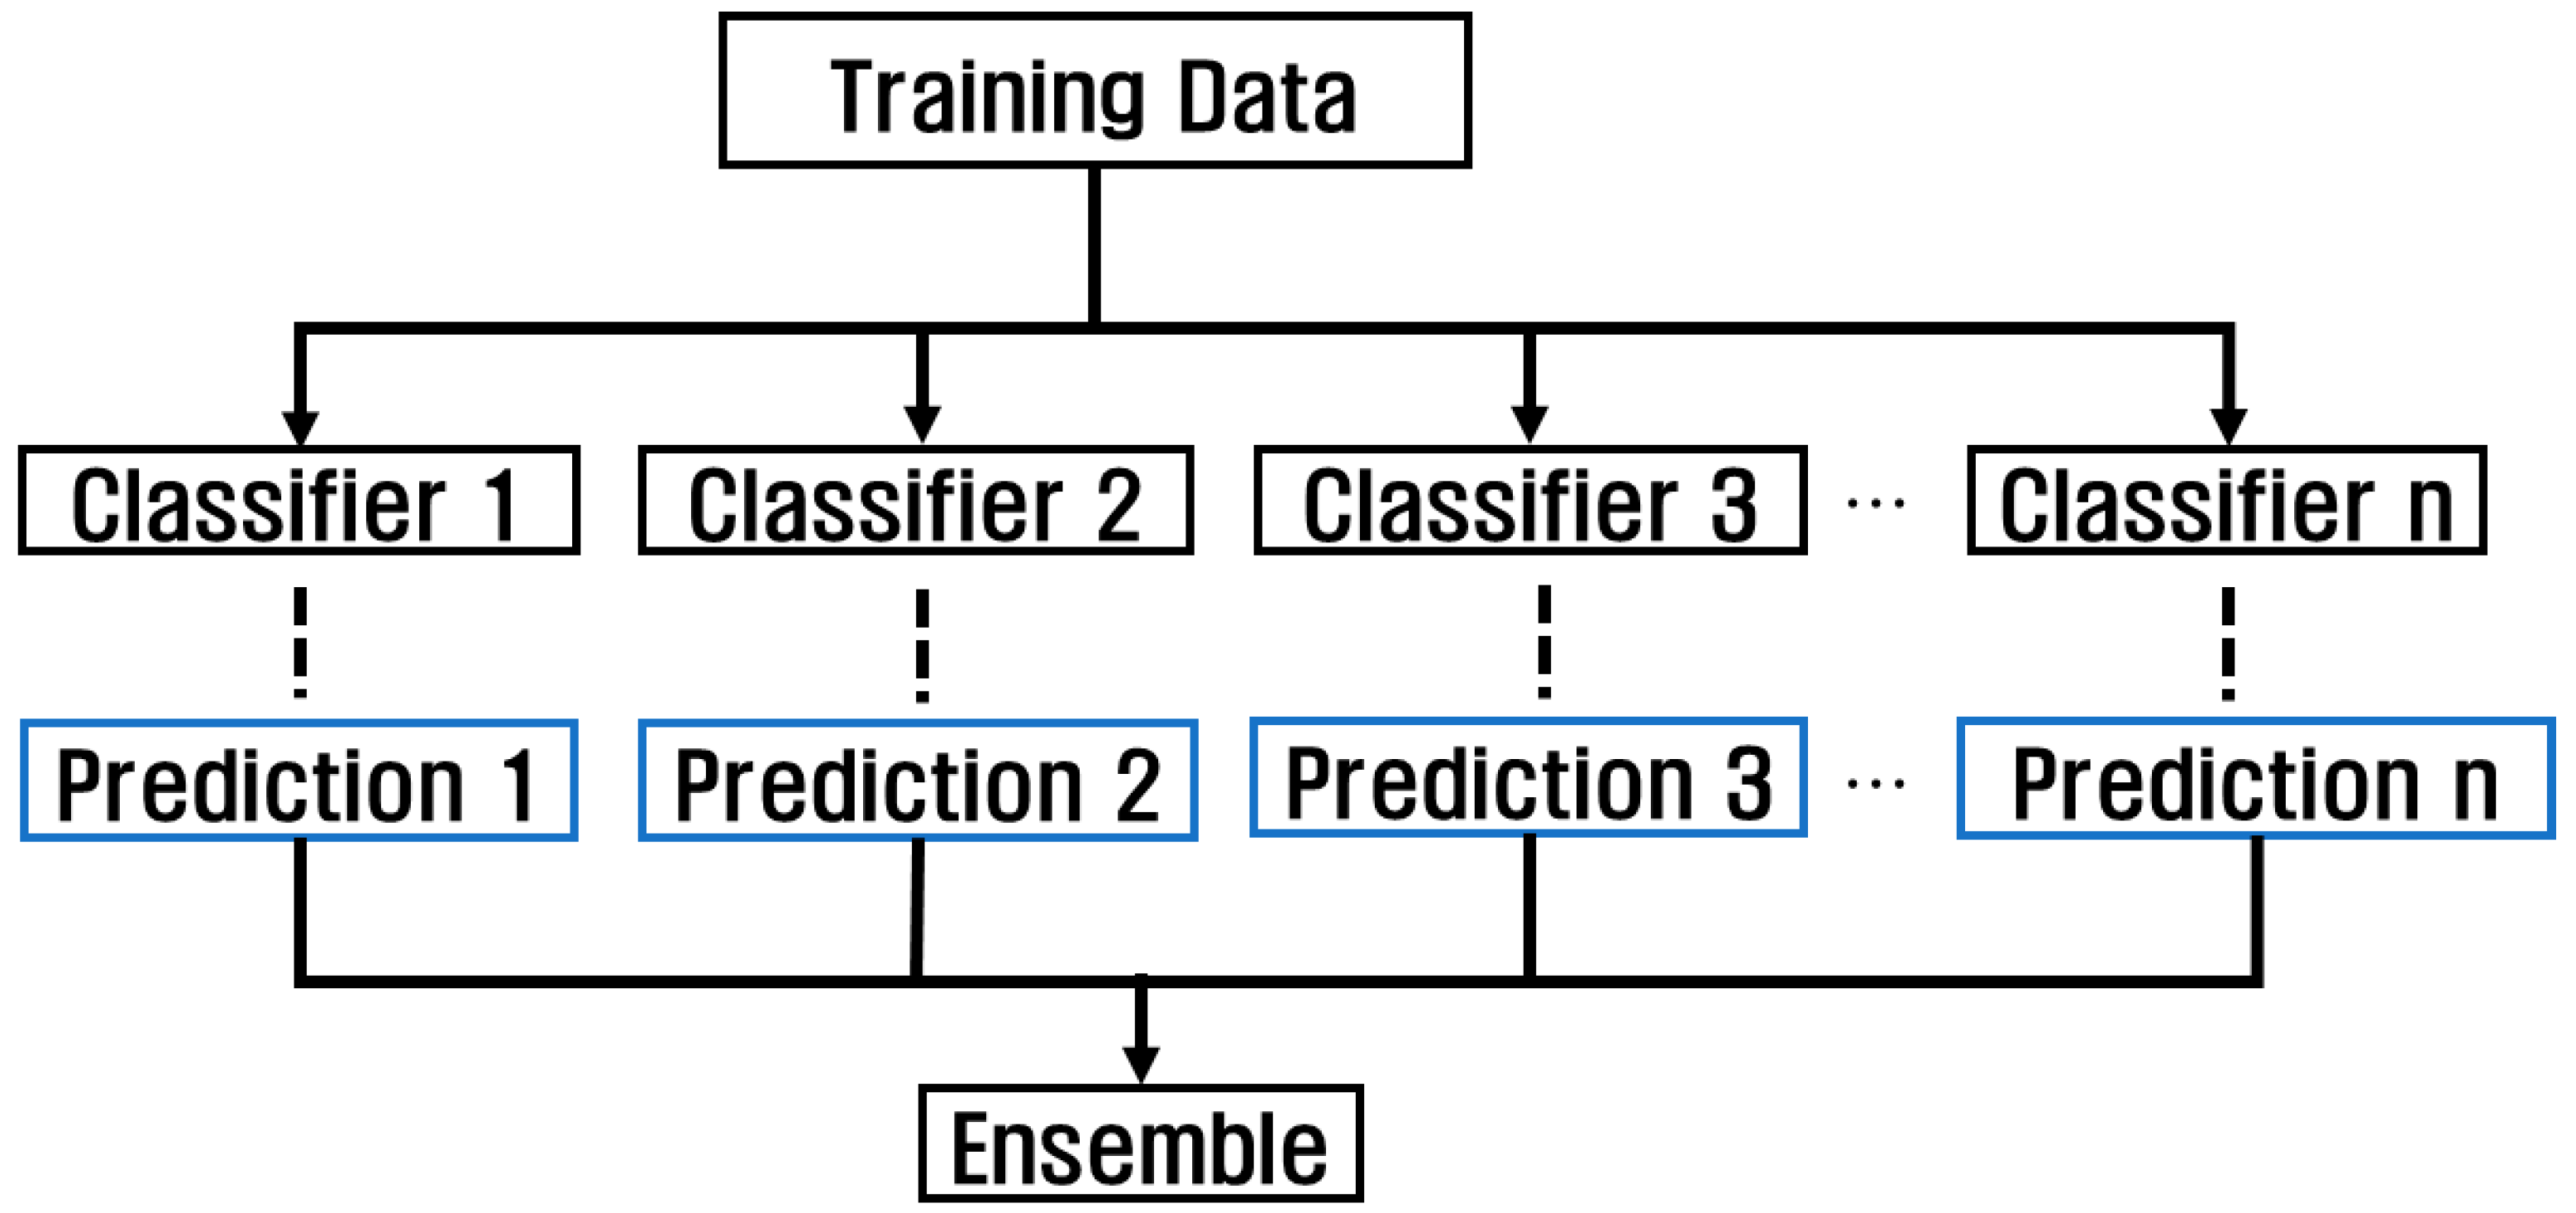
Using various models and checking the performance using the model with the highest performance has the advantage of simplicity, but errors can occur due to overfitting and abnormal patterns. However, when using an ensemble, accuracy can be improved and data patterns can be reliably classified by combining the features extracted from each model through various models. Ensemble can be used in a variety of ways, including methods using voting, boosting, bagging, and stacking, and is a technique used to achieve high accuracy by combining forecasts from multiple models, as shown in Figure 10. Because this affects the classification accuracy depending on the dataset used and the structure of each model, the overall accuracy can be improved by combining various models based on their strengths.
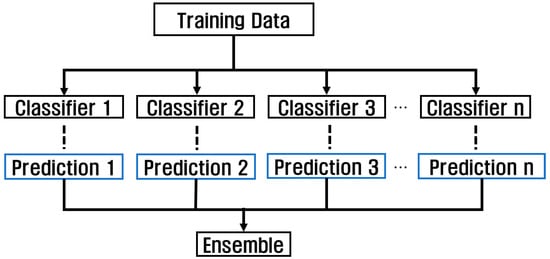
Figure 10.
Classification algorithm through ensemble technique.
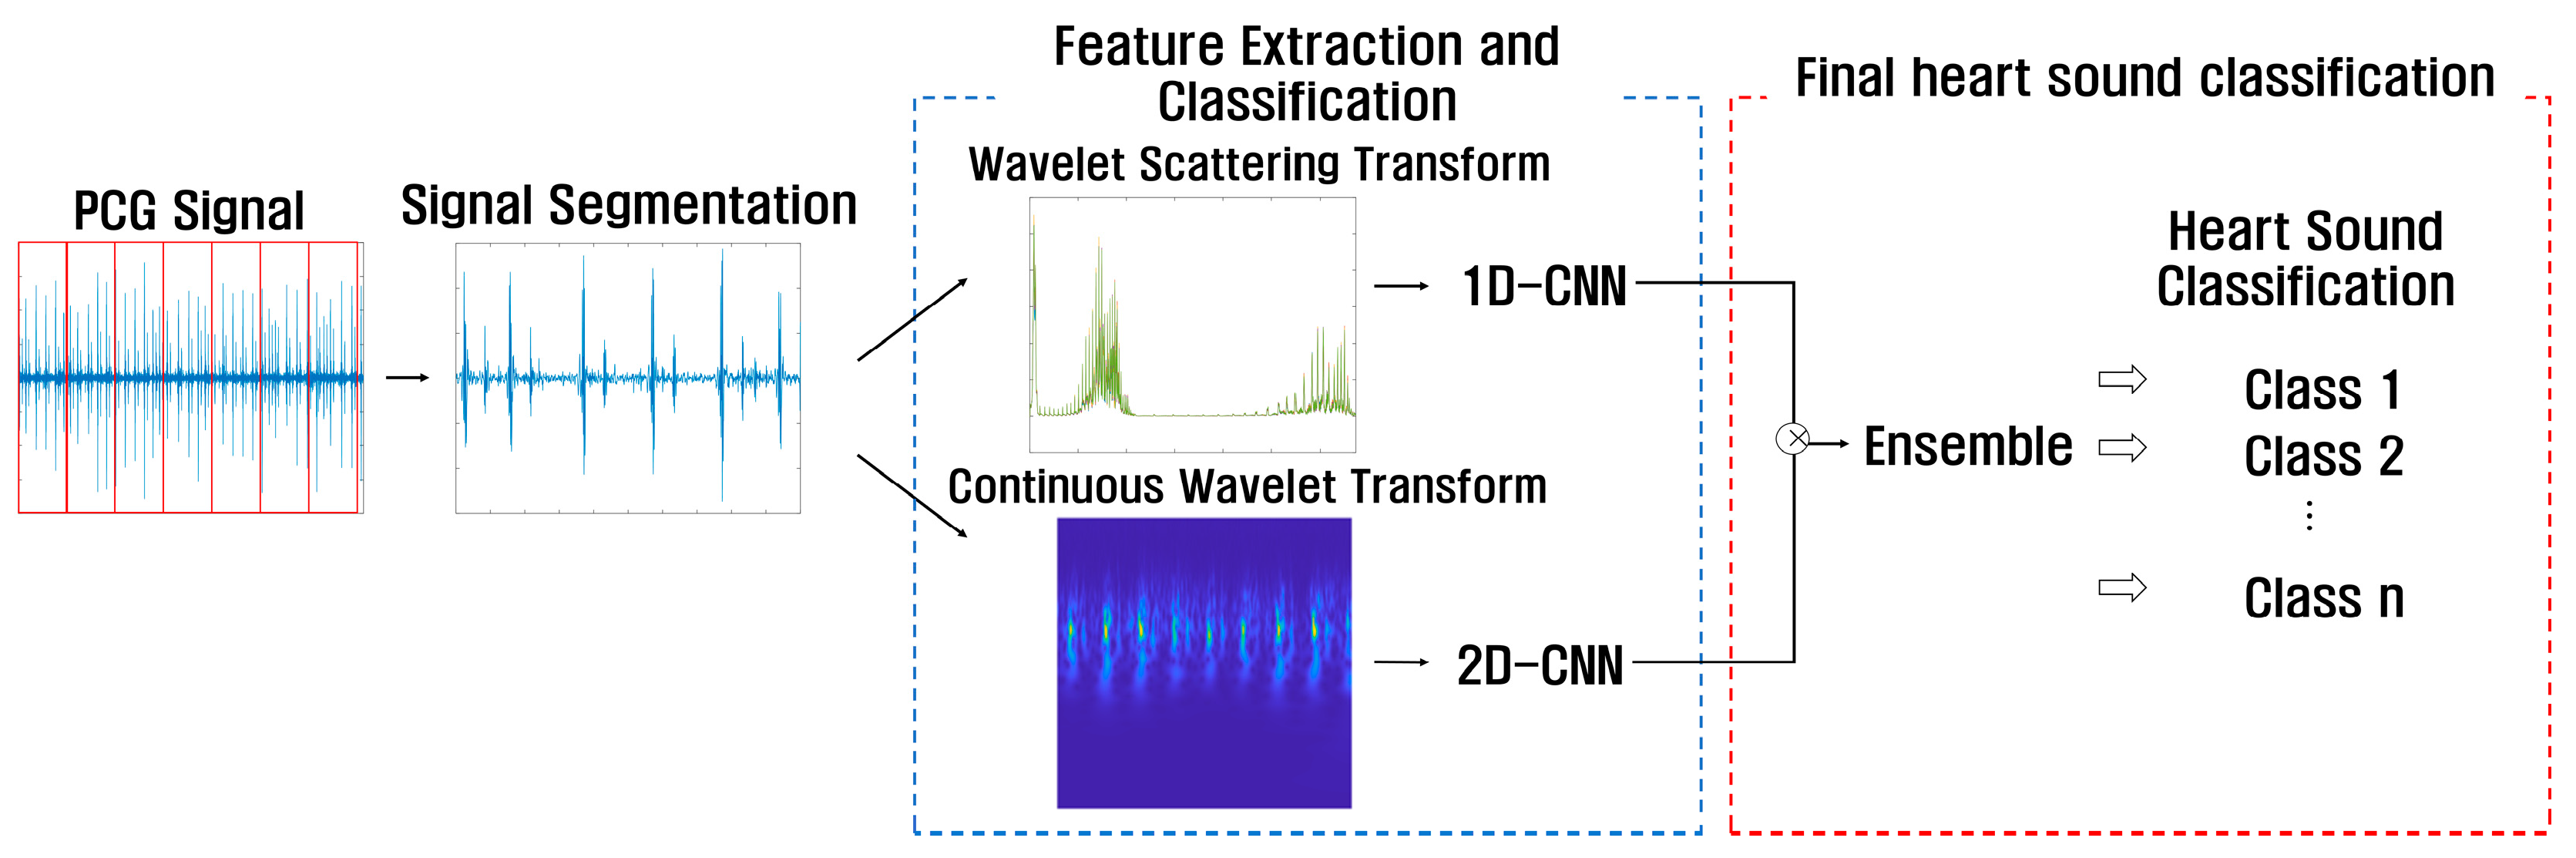
This paper proposes a method to use a feature-based 1D-CNN model extracted through WST, which can analyze features of various frequencies, and a feature-based 2D-CNN model extracted through CWT, which can extract features for time-frequency in detail. To classify heart sounds using PCG signals, the process can be divided into signal segmentation, feature extraction and classification, and final heart sound classification by using an ensemble, as shown in Figure 11.
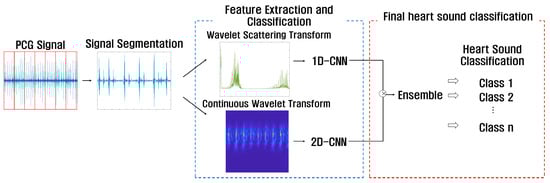
Figure 11.
Flow chart of proposed ensemble-based heart sound classification.
In the first signal segmentation process, the PCG signal was divided into 5 s considering the minimum time of 5 s for the PhysioNet/CinC 2016 Challenge Dataset according to the dataset. The PASCAL Classifying Heart Sounds Challenge Dataset had a minimum time of less than 1 s; thus, performance was checked by dividing it into 2 s and 3 s. It was confirmed that the performance was higher when divided into 3 s; thus, it was used by dividing it into 3 s.
Second, in the feature extraction and classification stage, features are extracted from various frequency domains through WST, and the characteristics of the time and frequency domains are analyzed to represent the features one dimensionally, so that periodic patterns and changes in the PCG can be identified. Since PCG signals can be used to analyze signals of heart disease, a 1D-CNN model is used to use these signals. 1D-CNN is a model that can be designed according to each dataset, and is capable of learning the temporal and spatial characteristics of signals as well as hierarchical characteristic; thus, it can analyze heart rate patterns in PCG signals, cycles, and intensity and determine the state of heart health. By converting a one-dimensional PCG signal into a two-dimensional image through CWT, a time-frequency domain, and using 2D-CNN, spatial and temporal features, visual features, and multi-resolution analysis of the two-dimensional image are possible. This allows the time and frequency domain characteristics of the PCG signal to be analyzed, allowing the analysis of signals that change over time, detecting abnormalities. The 2D-converted image is used as a 2D-CNN transfer learning model, GoogleNet, ResNet 50, and 101.
Finally, we use an ensemble that combines multiple models for more accurate and improved performance of a single model. Although the performance of 1D-CNN and 2D-CNN can be checked as a single model, the characteristics of the PCG signal extracted from each model appear differently; thus, high reliability and stable performance can be confirmed by ensembling the two models. The performance of the final heart sound classification is confirmed by multiplying the values predicted through 1D-CNN and 2D-CNN in the feature extraction and classification stages. This ensemble multi-scale analysis allows for a more accurate classification of subtle signals and features for the diagnosis of specific heart diseases in the PCG signals.
4. Experimental Result
For heart sound classification based on the proposed wavelet analysis technique in this study, we evaluated the performance using the Accuracy, Precision, Recall, F1-Score, Sensitivity, and Specificity of the PhysioNet/CinC 2016 Challenge Dataset and the PASCAL Classifying Heart Sounds Challenge Dataset.
4.1. Dataset
4.1.1. The PhysioNet/CinC 2016 Challenge Dataset
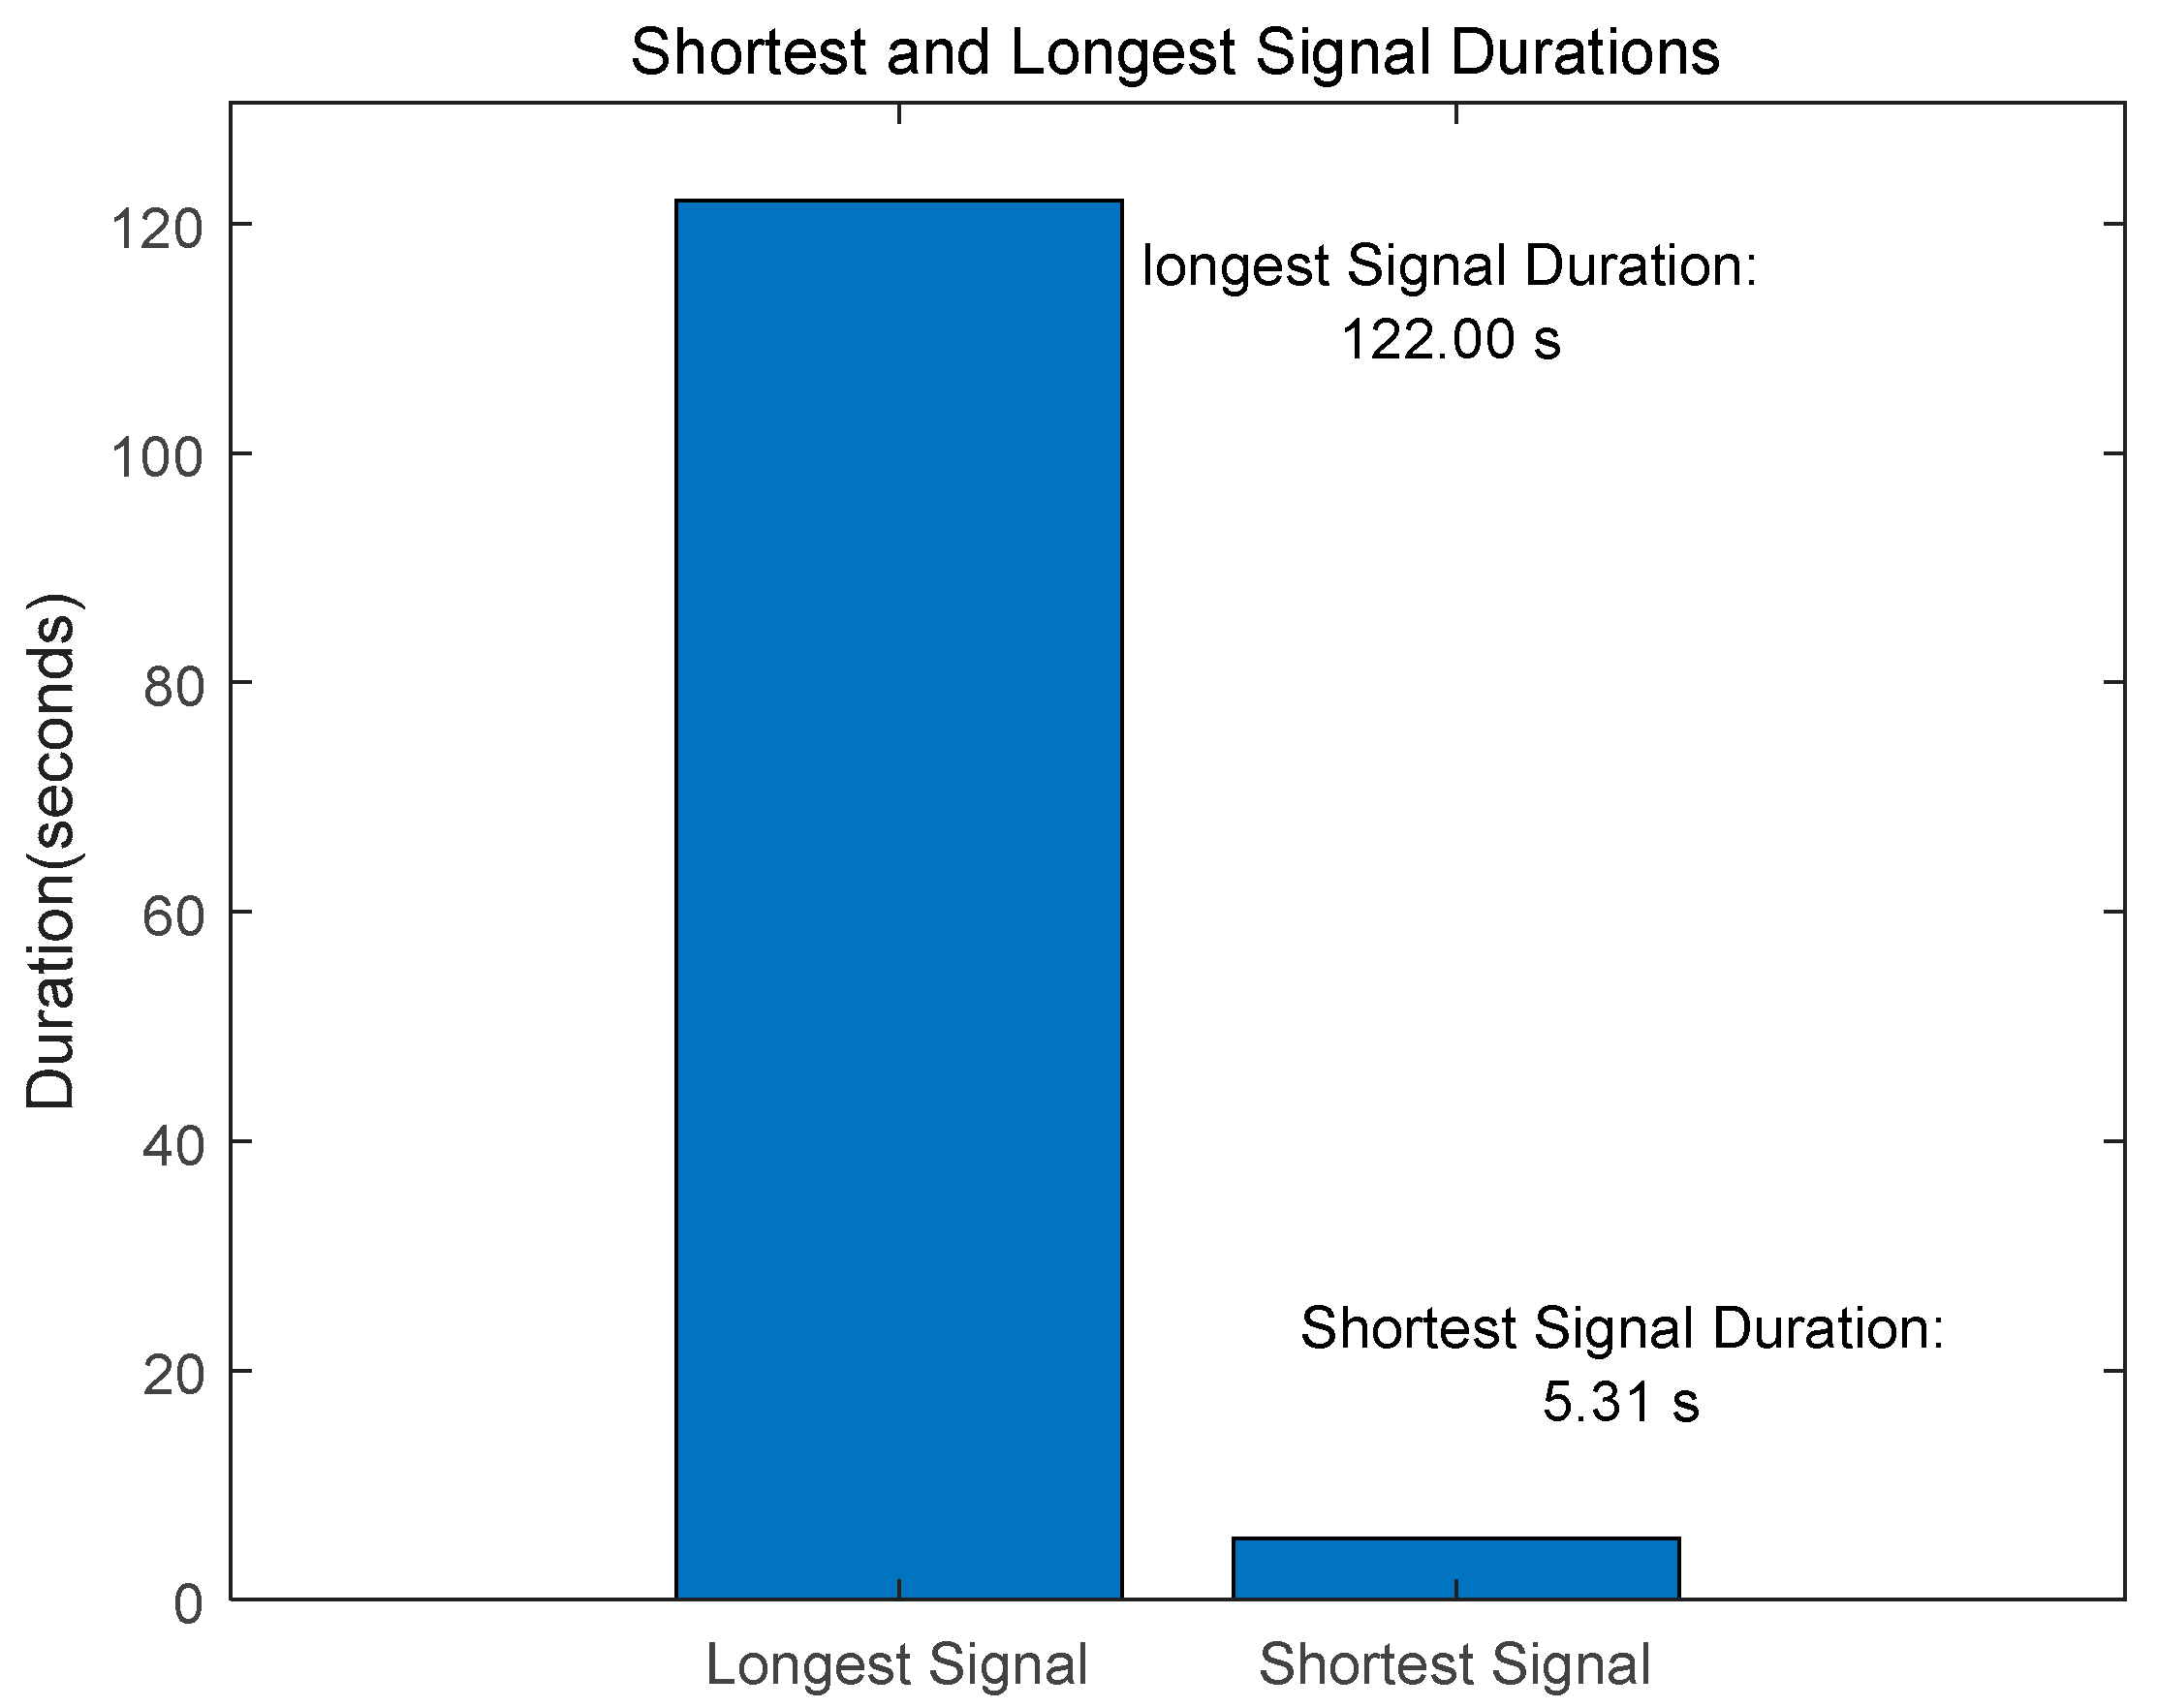
The PhysioNet/CinC 2016 Challenge [30] Dataset is composed of training-a, training-b, training-c, training-d, training-e, and training-f as shown in Table 1. The data collected from healthy subjects, including children and adults, as well as patients with heart disease, included 3240 data, including 2575 normal and 665 abnormal data. The length of the signal consisted of data from a minimum of 5.31 s to a maximum of 122 s, as shown in Figure 12, and was resampled at 2000 Hz.

Table 1.
Composition of the PhysioNet/CinC 2016 Challenge Dataset.
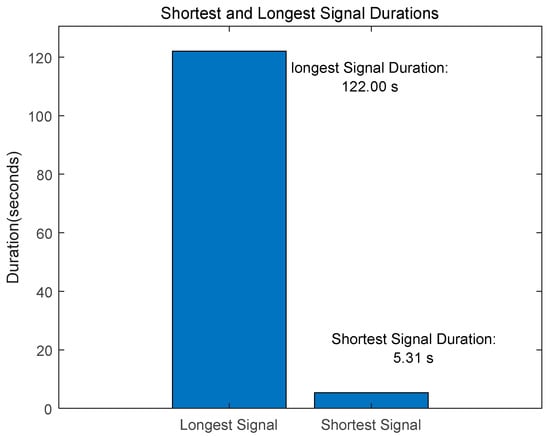
Figure 12.
PhysioNet/CinC 2016 Challenge Dataset-Shortest and Longest Signal Duration.
Table 2 shows the number of signals divided into 5 s for each class of the PhysioNet/CinC 2016 Challenge Dataset, and the number of divided signals can be constant or increase depending on the length of the original signal. Since the PhysioNet/CinC 2016 Challenge Dataset was divided into 5 s, which is the minimum length, and signals shorter than 5 s were not used, the number of split signals remained constant for signals shorter than 10 s, and the number of split signals increased for signals longer than 10 s.
Table 2.
Number of segmented signals of the PhysioNet/CinC 2016 Challenge Dataset.
4.1.2. PASCAL Classifying Heart Sounds Challenge Dataset
The PASCAL Classifying Heart Sounds Challenge [31] dataset was collected in two ways: Dataset A was recorded using the iStethscope Pro iPhone app for the general public and included four classes: Normal, Murmur, Extrahls Heart Sound, and Artifact. Dataset B was collected using the DigiScope digital stethoscope and had three classes: Normal, Murmur, and Extrasystole. The classes of Datasets A and B are composed as shown in Table 3. The length of the signal shown in Figure 13 consists of signals recorded from a minimum of 0.94 s to a maximum of 9 s for Dataset A and from a minimum of 0.76 s to a maximum of 25 s for Dataset B.
Table 3.
Composition of the PASCAL Classifying Heart Sounds Challenge Dataset.
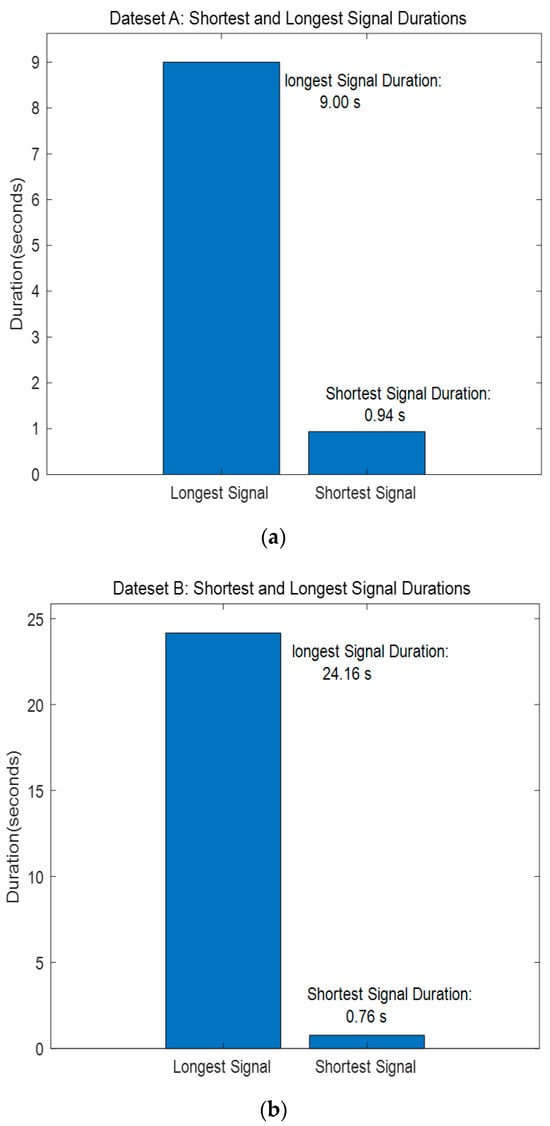
Figure 13.
PASCAL Classifying Heart Sounds Challenge Dataset A, B—Shortest and Longest Signal Duration. (a) Dataset A. (b) Dataset B.
Table 4 shows the number of signals segmented into 3 s for each class in the PASCAL Classifying Heart Sounds Challenge Dataset, and the number of segmented signals can increase depending on the length of the original signal or decrease due to signals that are less than 3 s long.
Table 4.
Number of segmented signals of the PASCAL Classifying Heart Sounds Challenge Dataset.
4.2. Performance Evaluation Method
Accuracy, Precision, Recall, F1-Score, Sensitivity, and Specificity were used as evaluation index methods to classify normal phonocardiograms from phonocardiogram signals and those of patients with heart disease. Used to evaluate the model’s performance using actual and predicted labels, True Positives (TP) refer to instances where the model correctly predicts the positive class and True Negatives (TN) refer to instances when the model correctly predicts the negative class. False Positives (FP) refer to instances where the model predicts a negative class as a positive class, and False Negatives (FN) refer to instances where the model predicts a positive class as a negative class.
Accuracy is a method of checking whether the model correctly predicts the positive and true negative classes and is measured by adding TP and TN, which represent correctly classified instances, from the total number of instances, as shown in Equation (7).
Precision is a method used to calculate the accuracy with which the model correctly classifies instances predicted as positive. As shown in Equation (8), the instance is calculated by dividing the number of correctly predicted TPs by the sum of TP + FP.
Recall is calculated using Equation (9) and is a method to check whether instances belonging to the positive class are correctly classified as the positive class.
The F1-Score is obtained by combining Precision and Recall, as shown in Equation (10), to evaluate the performance of a balanced model considering FP and FN.
F1-Score = 2 × Precision × Recall/Precision + Recall
Sensitivity is a performance evaluation method used to measure whether the model correctly classifies instances of the positive class as positive classes using Equation (11).
Specificity is a performance evaluation method used to measure whether an instance of a negative class is correctly classified as a negative class using Equation (12).
4.3. Experiment Result
In this study, we used the open datasets PhysioNet/CinC 2016 Challenge Dataset and PASCAL Classifying Heart Sounds Challenge Dataset for PCG heart sound classification. For feature extraction, WST and CWT were used based on wavelet analysis technology. The features extracted by WST were used to design a 1D-CNN model and a deep learning model suitable for the two datasets, and the images converted to time-frequency expression through CWT are using the 2D-CNN model. Classification performance was checked using Accuracy, Precision, Recall, F1-Score, Sensitivity, and Specificity. Table 5 shows the performance results of classifying the features extracted based on the WST into the 1D-CNN model using the PhysioNet/CinC 2016 Challenge Dataset and PASCAL Classifying Heart Sounds Challenge Dataset. The PhysioNet/CinC 2016 Challenge Dataset divided the data into 70% training and 30% testing and showed the highest accuracy when split with the following settings: QualityFactors of Waveletscattering [4 2 1], Filter size 5, number of filters 32, InitialLearnRate 0.001, MaxEpochs 200, and MiniBatchSize 64. Dataset A of the PASCAL Classifying Heart Sounds Challenge Dataset split the data into 80% training data and 20% test data and showed the highest accuracy when split with the following settings: QualityFactors of Waveletscattering [4 2 1], Filter size 9, Number of filters 64, InitialLearnRate 0.0001, MaxEpochs 300, and MiniBatchSize 128. Dataset B of the PASCAL Classifying Heart Sounds Challenge Dataset splits the data into 90% training data and 10% test data and showed the highest accuracy when split with the following settings: QualityFactors of Waveletscattering [4 2 1], Filter size 4, Number of filters 128, InitialLearnRate 0.0001, MaxEpochs 200, and MiniBatchSize 32.
Table 5.
Performance results of WST-based 1D-CNN Model for each dataset.
Table 6 shows the performance results of classifying the features extracted based on CWT into a 2D-CNN model using the PhysioNet/CinC 2016 Challenge Dataset and PASCAL Classifying Heart Sounds Challenge Dataset. The three datasets used the 2D-CNN transfer learning models GoogleNet, ResNet50, and ResNet101; when the results were confirmed, the model with the highest accuracy was used. The PhysioNet/CinC 2016 Challenge Dataset split the data into 70% training data and 30% test data, similar to the 1D-CNN, and confirmed that the ResNet50 model, which was set to MiniBatchSize 64, MaxEpochs 30, and Validation Frequency 10, had the highest accuracy. Dataset A of the PASCAL Classifying Heart Sounds Challenge Dataset split the data into 80% training and 20% testing and confirmed that the GoogleNet model set to InitialLearnRate 0.0001, MiniBatchSize 64, MaxEpochs 30, and Validation Frequency 50 had the highest accuracy. Dataset B of the PASCAL Classifying Heart Sounds Challenge Dataset was divided into 90% training data and 10% test data, and it was confirmed that the GoogleNet model set to MiniBatchSize 64, MaxEpochs 20, and Validation Frequency 50 had the highest accuracy.
Table 6.
Performance results of CWT-based 2D-CNN model for each dataset.
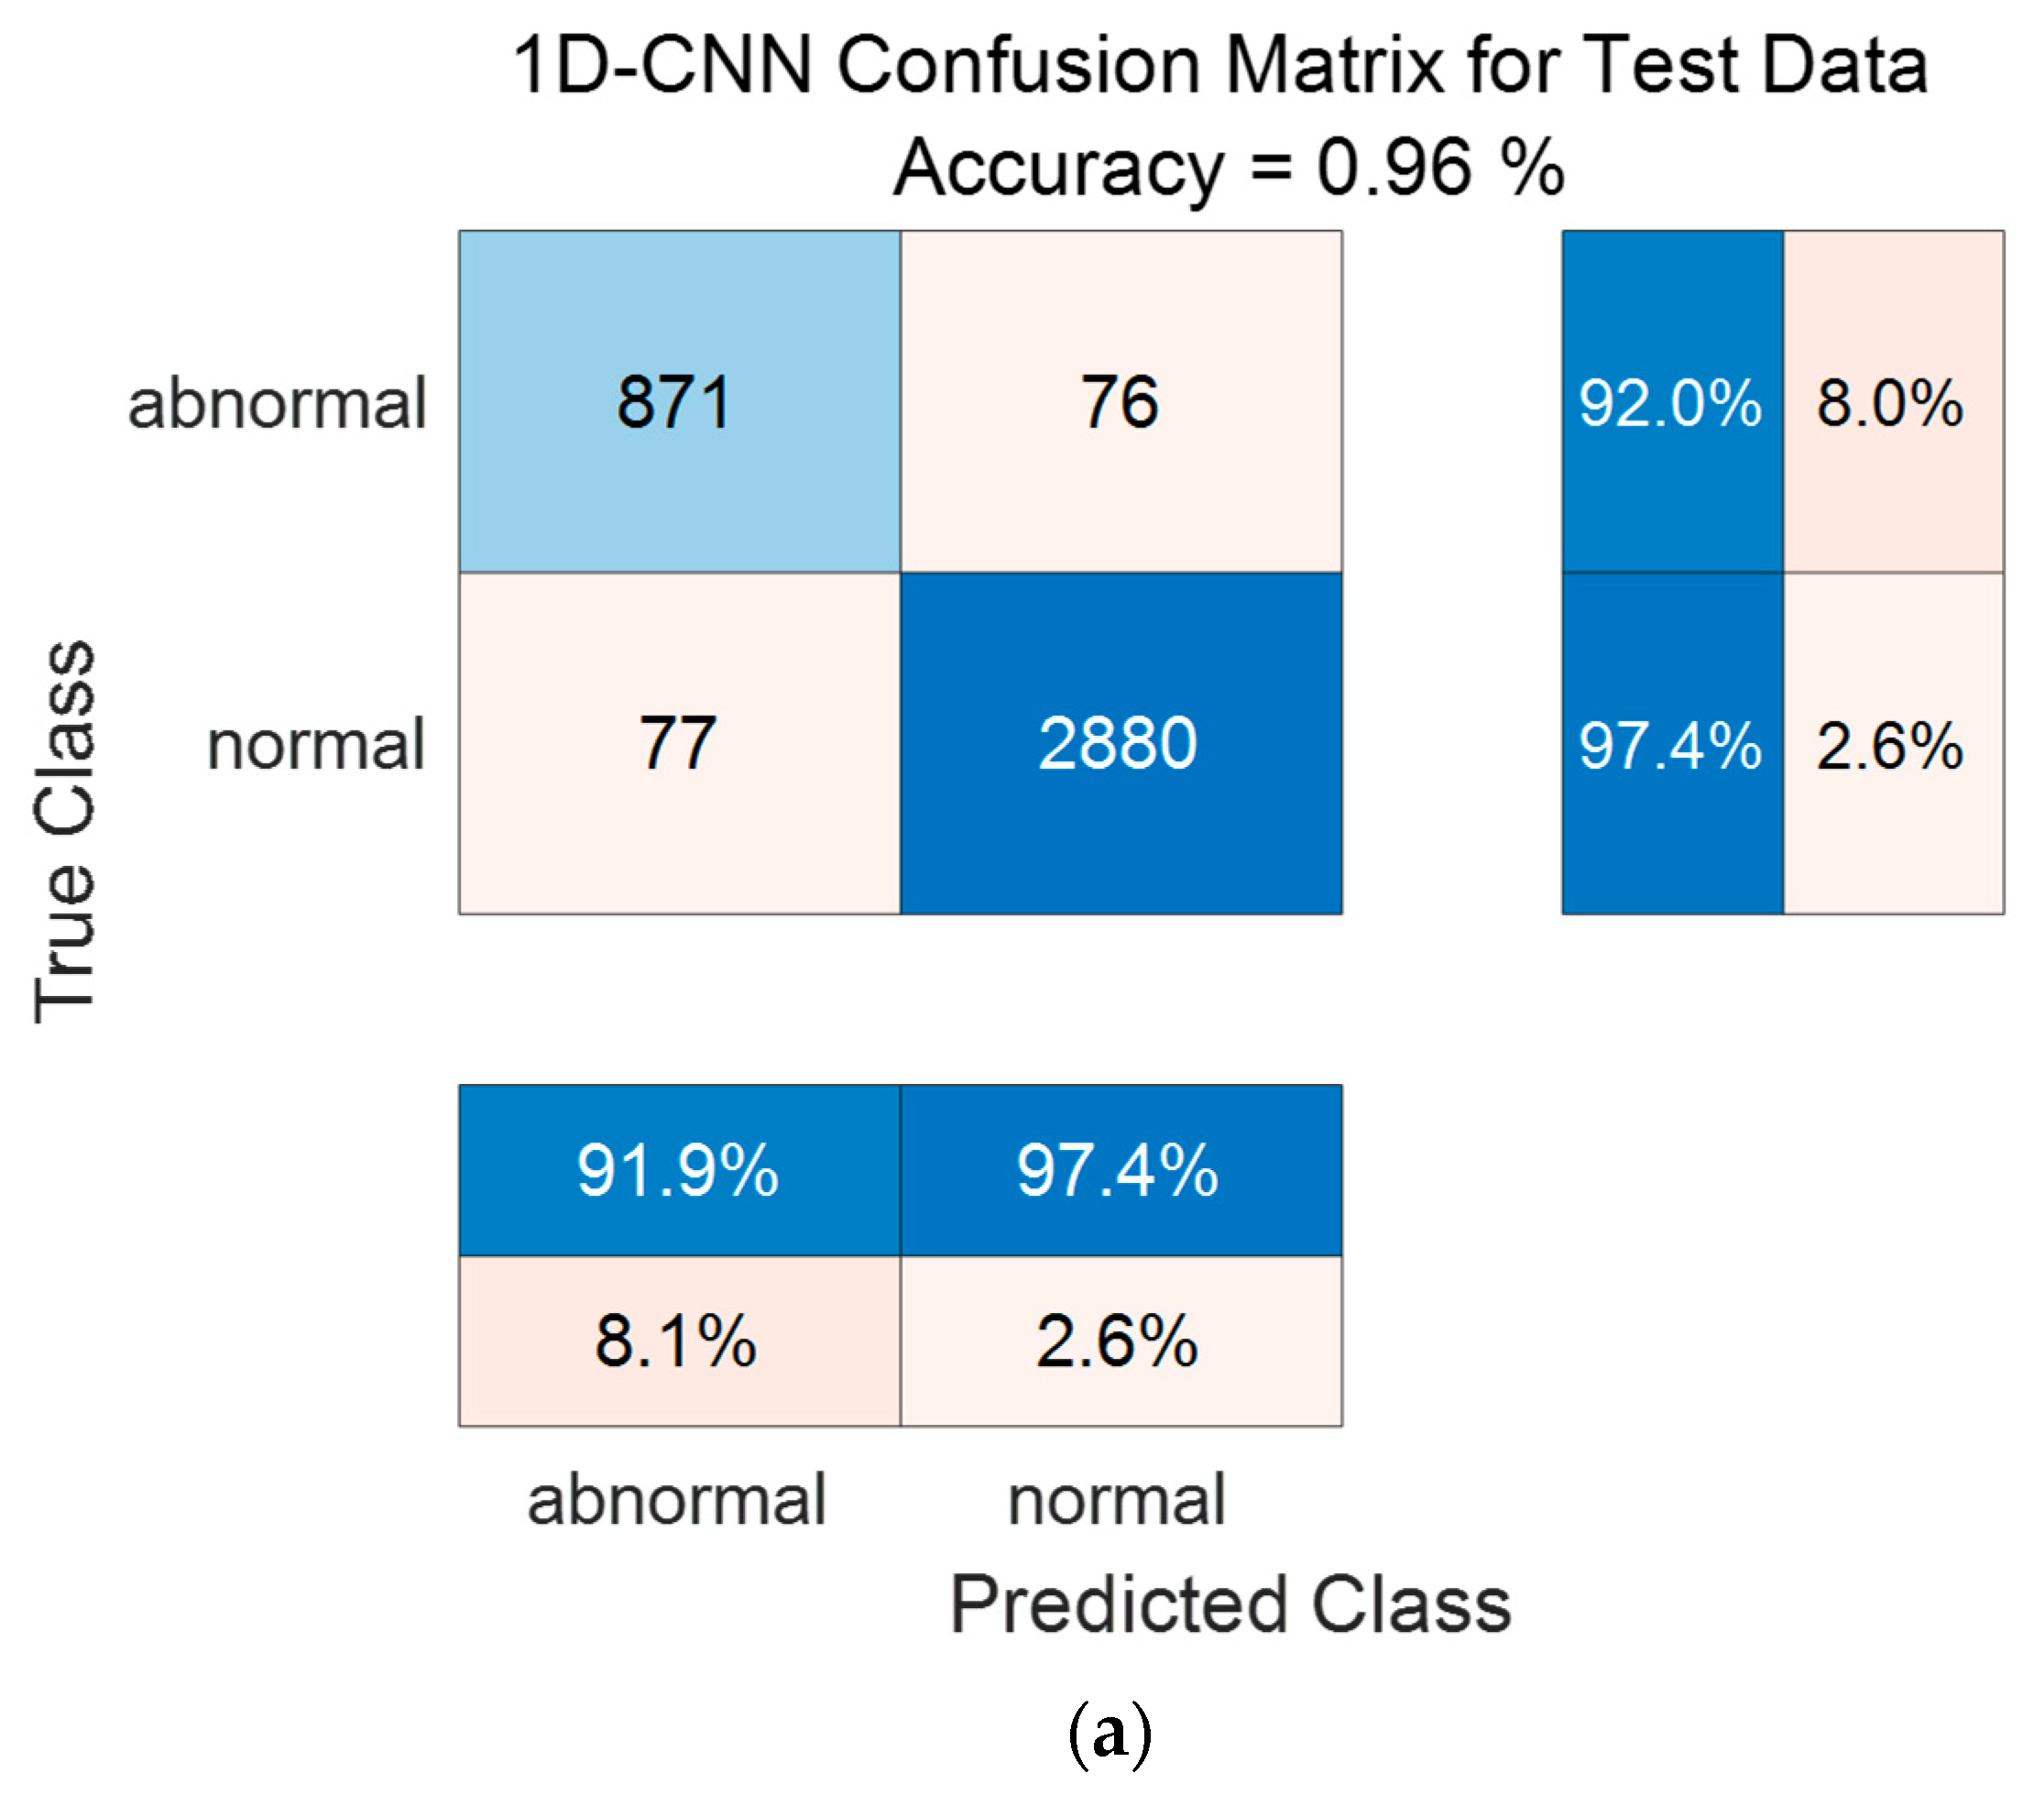
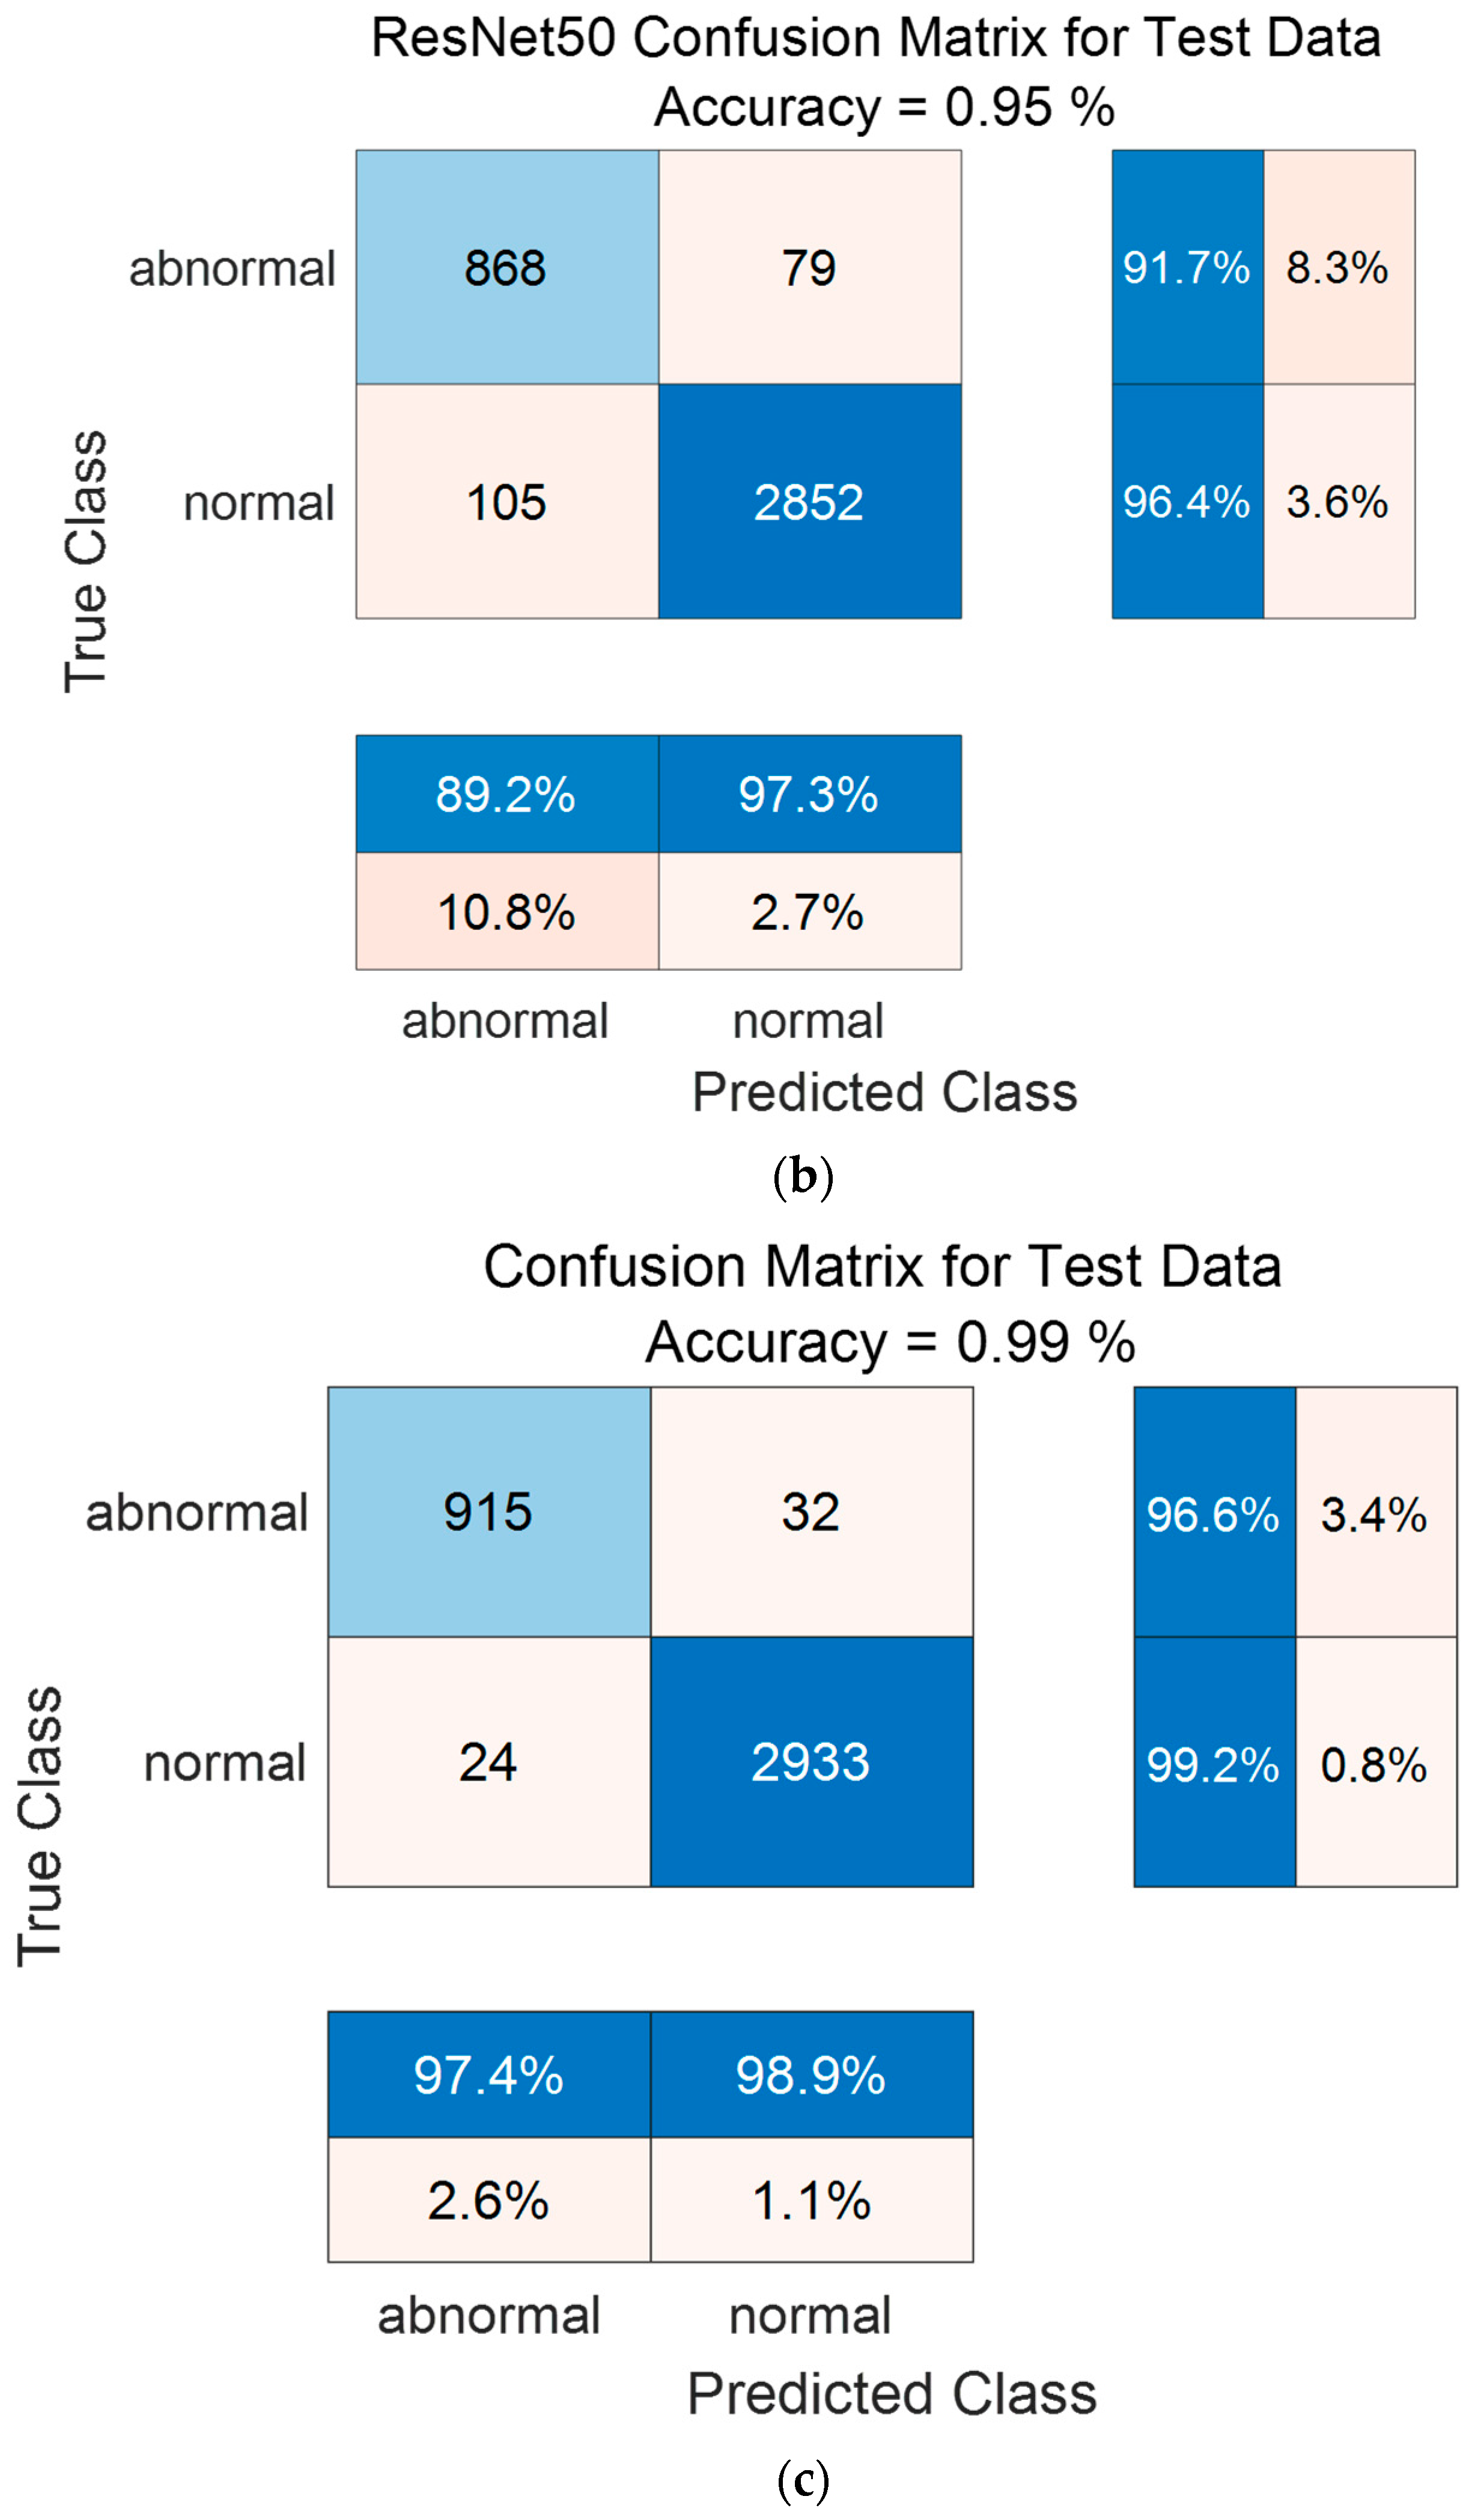
Figure 14 shows the confusion matrix results using the PhysioNet/CinC 2016 Challenge Dataset. Figure 14a shows the confusion matrix of 1D-CNN, Figure 14b shows the confusion matrix of 2D-CNN, and Figure 14c shows the confusion matrix of the Ensemble. The confusion matrix can visualize the actual and predicted values to observe the accurately classified predicted values for each class; the rows of the confusion matrix represent the actual values and the columns represent the predicted values. As a result of dividing the entire data of the PhysioNet/CinC 2016 Challenge Dataset into 70% training data and 30% test data, the test data used for classification included 947 in the abnormal class and 2957 in the normal class. As a result of visualization using a confusion matrix to analyze the number of classified for each class, 1D-CNN classified 871 for the Abnormal classes and 2880 for the Normal classes, and 2D-CNN classified 868 for the Abnormal classes and 2852 for the Normal classes were classified. The result of ensemble of the two models is 915 for the Abnormal classes and 2933 for the Normal classes, which shows that the number of classified classes for each class has improved compared to a single model.

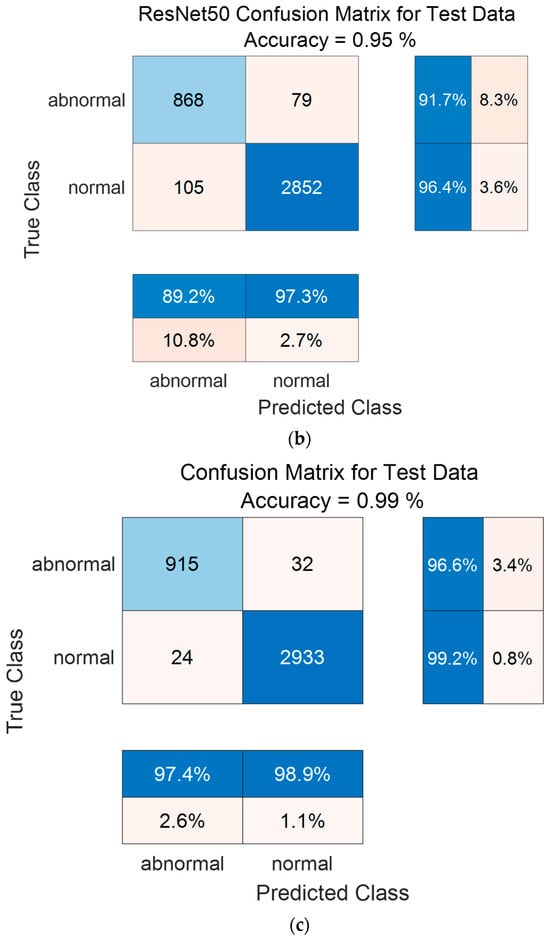
Figure 14.
1D-CNN, 2D-CNN, and ensemble confusion matrix results for PhysioNet/CinC 2016 Challenge Dataset. (a) the confusion matrix of 1D-CNN, (b) the confusion matrix of 2D-CNN, and (c) the confusion matrix of the Ensemble.
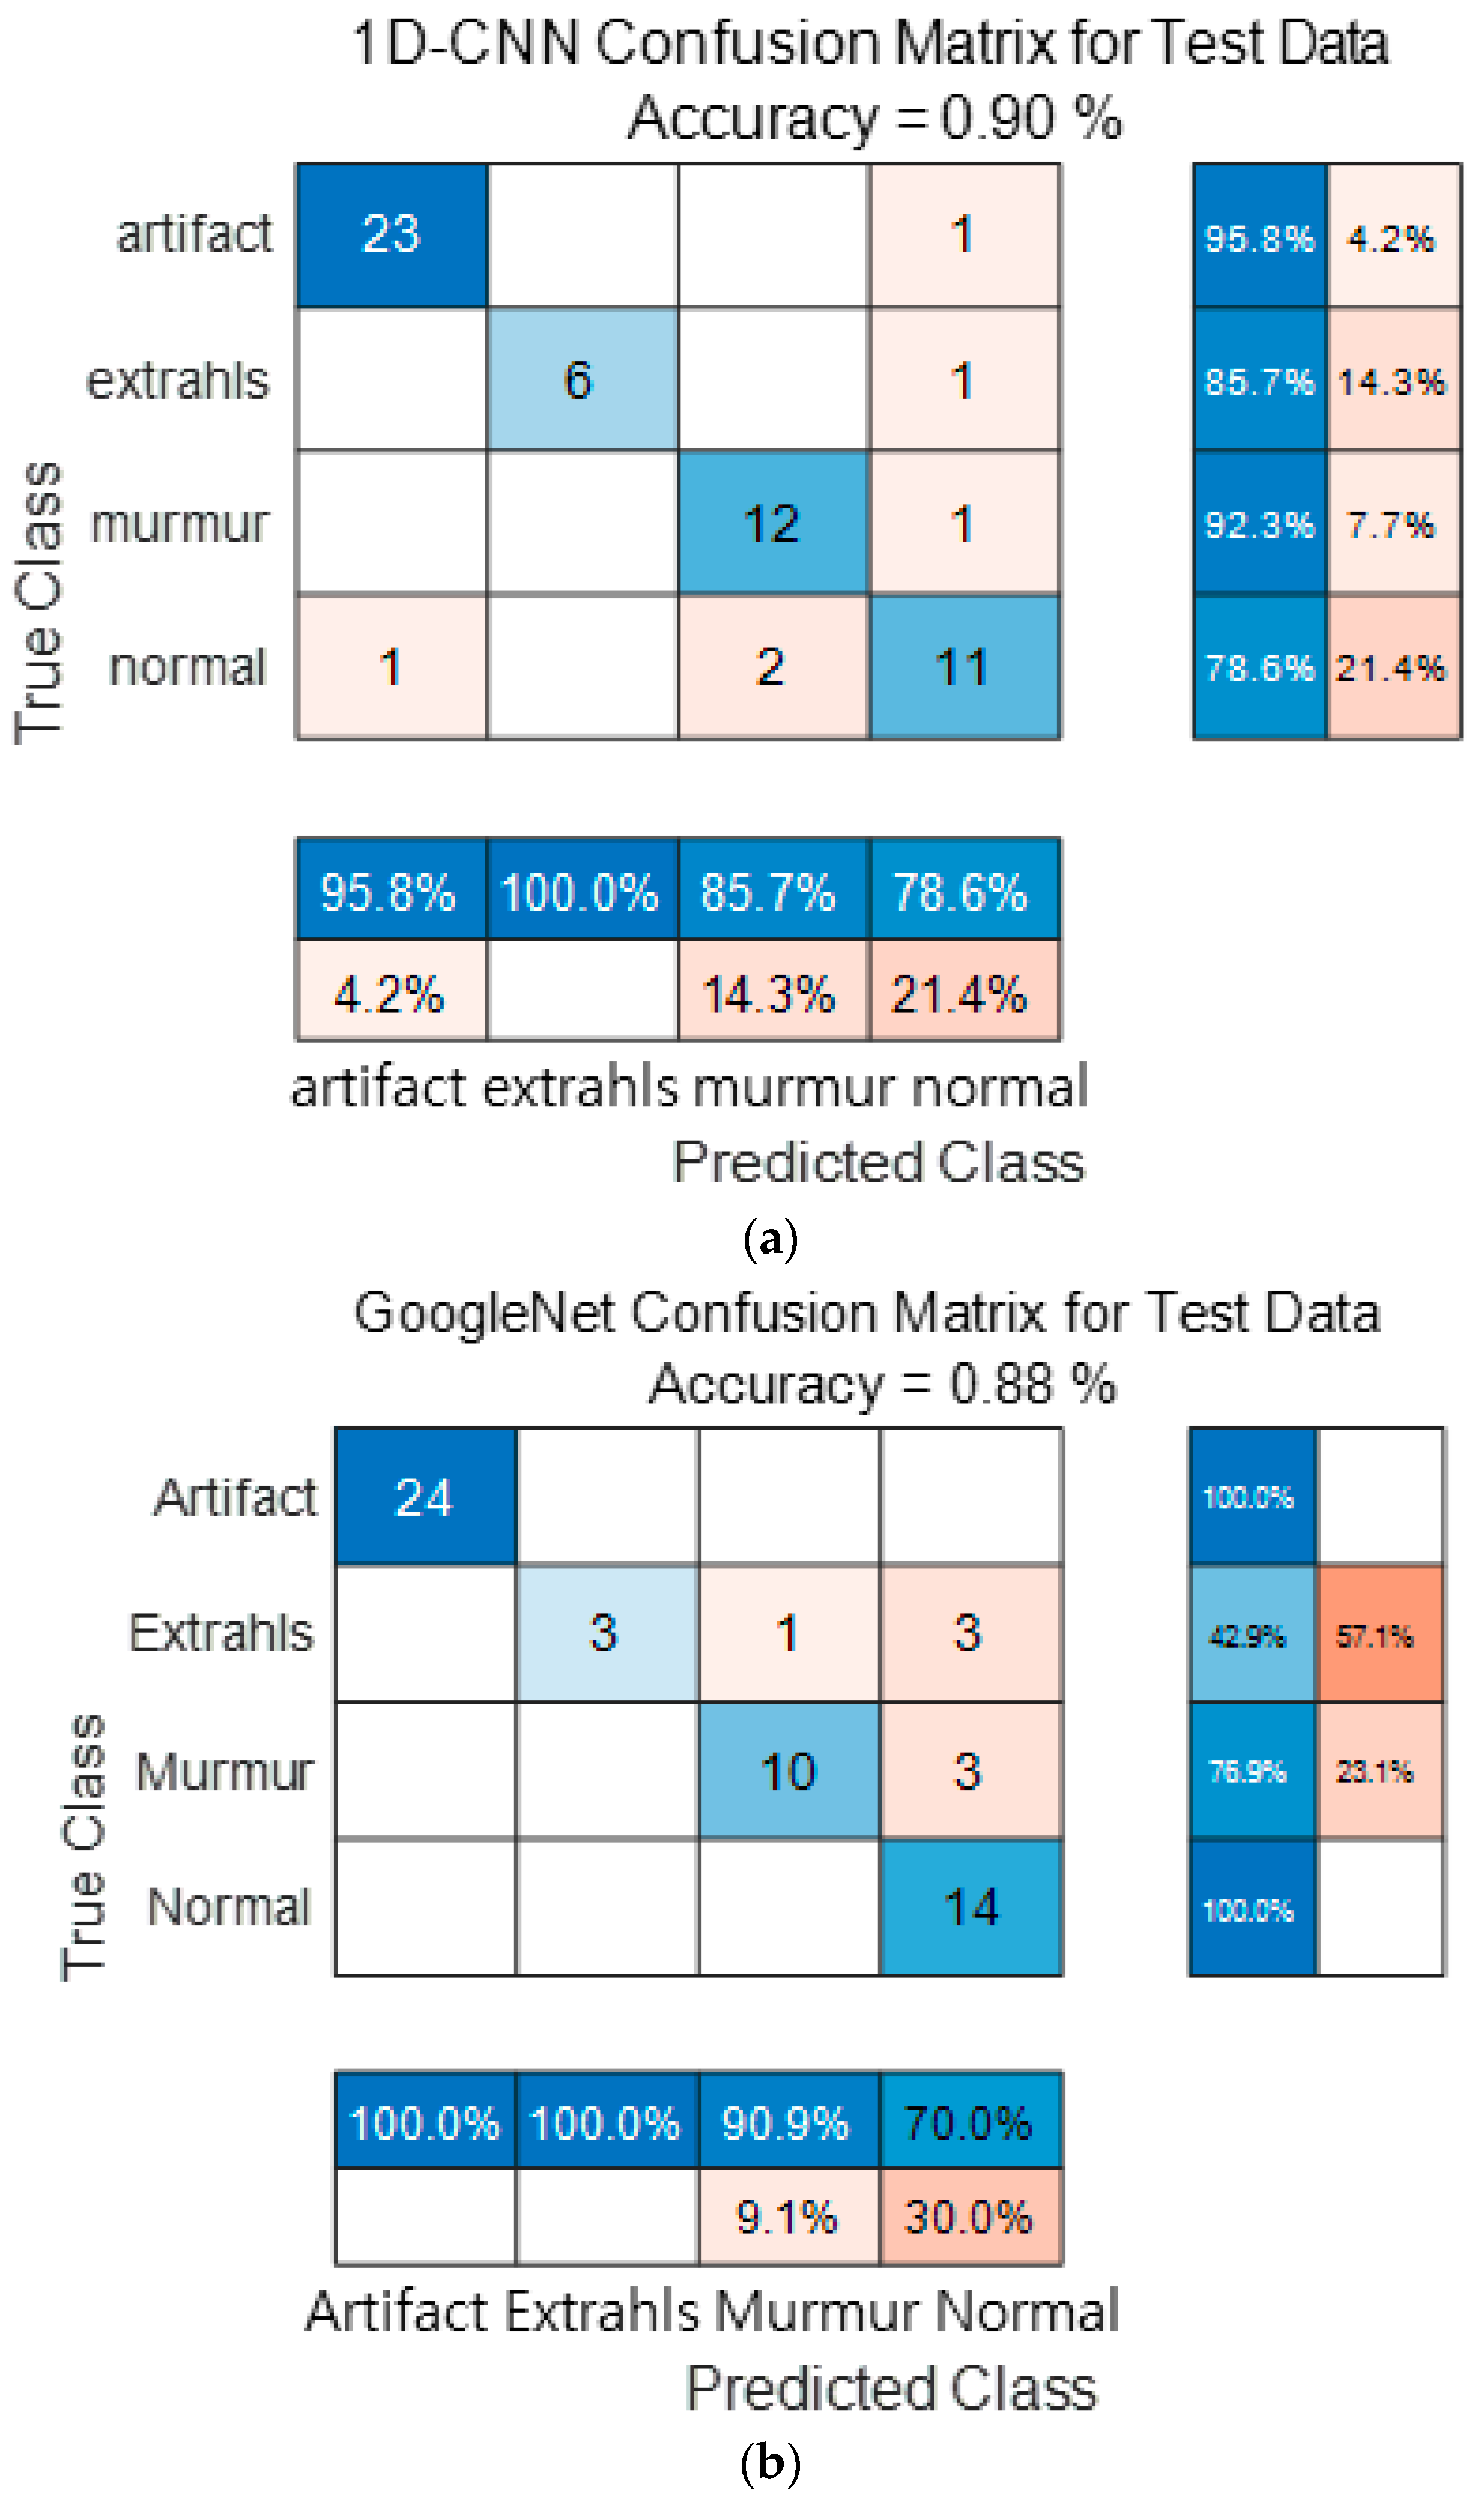
Figure 15 show the confusion matrix results using Dataset A from the PASCAL Classifying Heart Sounds Challenge data set. Figure 15a Shows the confusion matrix of 1D-CNN, Figure 15b shows the confusion matrix of 2D-CNN, and Figure 15c shows the confusion matrix of the ensemble. As a result of dividing the entire data of the PASCAL Classifying Heart Sounds Challenge Dataset A into 80% training data and 20% test data, the test data used for classification included 24 in the Artifact class, 7 in the Extrahls class, 13 in the Murmur class, and 14 in the Normal class. As a result of visualization using a confusion matrix to analyze the number of classified for each class, 1D-CNN classified 23 for the Artifact class, 6 for the Extrahls class, 12 for the Murmur class and 11 for the Normal class.
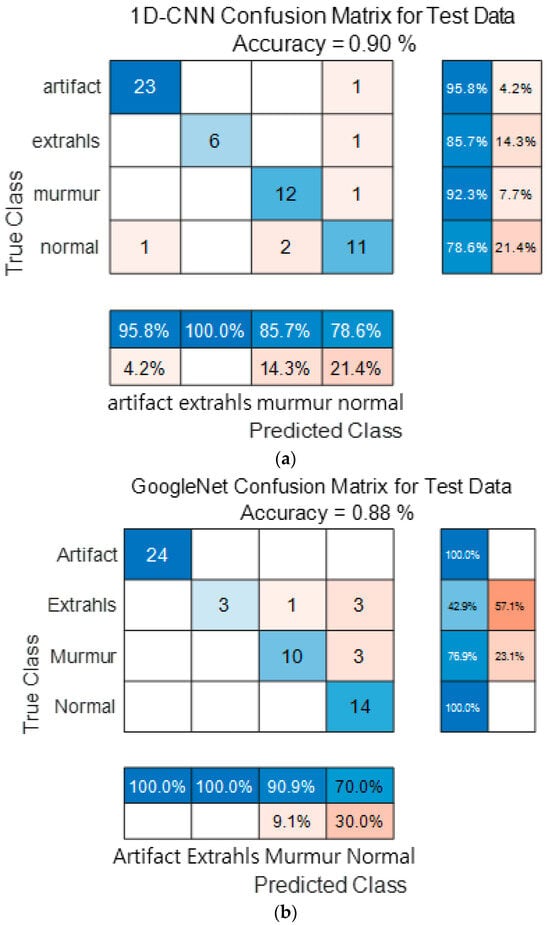
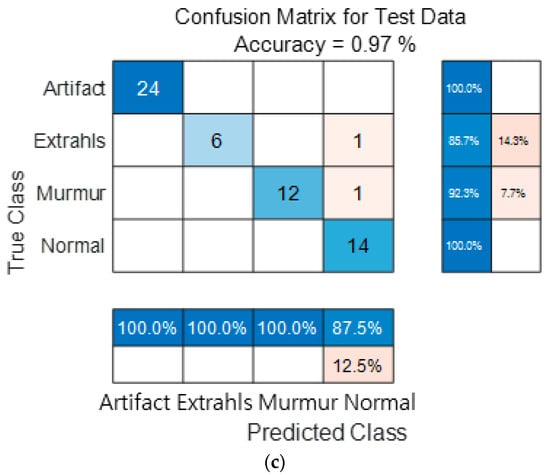
Figure 15.
1D-CNN, 2D-CNN, and ensemble confusion matrix results for PASCAL Classifying Heart Sounds Challenge Dataset: Dataset A. (a) the confusion matrix of 1D-CNN, (b) the confusion matrix of 2D-CNN, and (c) the confusion matrix of the ensemble.
2D-CNN classified 24 for the Artifact class, 3 for the Extrahls class, 10 for the Murmur class and 14 for the Normal class. The result of ensemble of the two models is 24 for the Artifact class, 6 for the Extrahls class, 12 for the Murmur class and 14 for the Normal class, which shows that the number of classified classes for each class has improved compared to a single model.
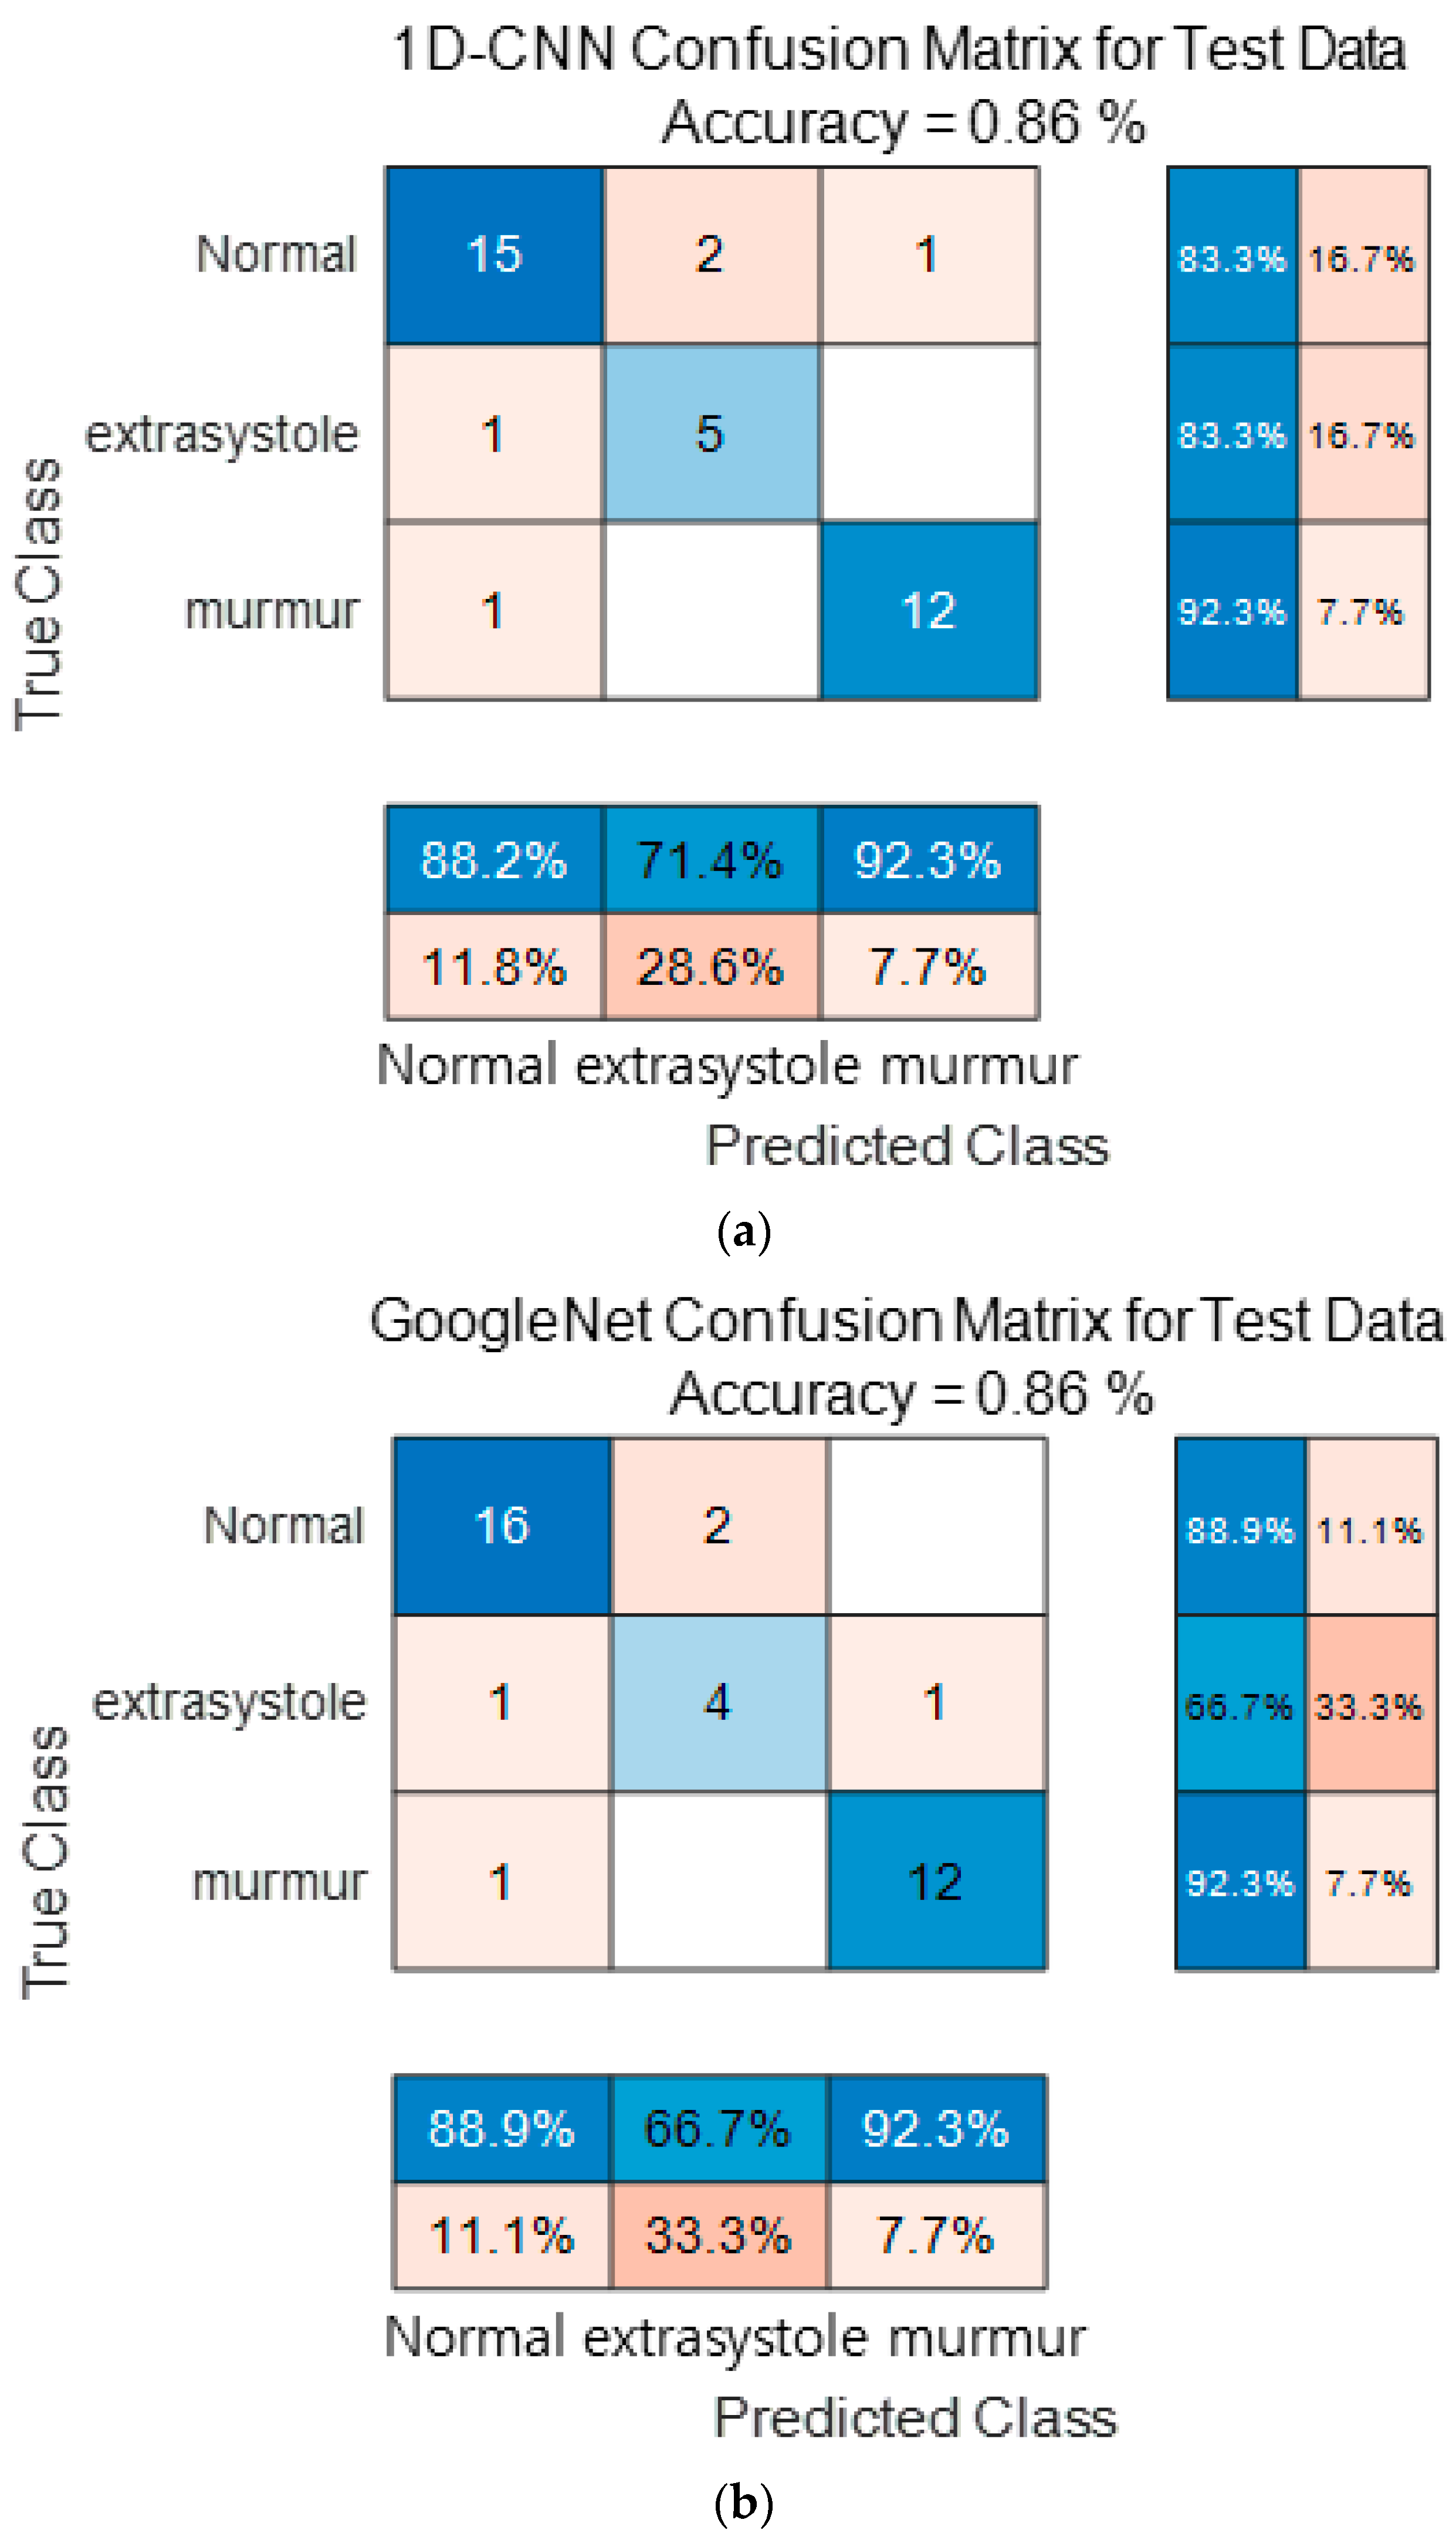
Figure 16 show the confusion matrix results using Dataset B from the PASCAL Classifying Heart Sounds Challenge data set. Figure 16a Shows the confusion matrix of 1D-CNN, Figure 16b shows the confusion matrix of 2D-CNN, and Figure 16c shows the confusion matrix of the ensemble. As a result of dividing the entire data of the PASCAL Classifying Heart Sounds Challenge Dataset B into 80% training data and 20% test data, the test data used for classification included 18 in the Normal class, 6 in the Extrasystole class and 13 in the Murmur class. As a result of visualization using a confusion matrix to analyze the number of classified for each class, 1D-CNN classified 15 for the Normal class, 5 for the Extrasystole class and 12 for the Murmur class. 2D-CNN classified 16 for the Normal class, 4 for the Extrasystole class and 12 for the Murmur class. The result of ensemble of the two models is 15 for the Normal class, 5 for the Extrasystole class and 13 for the Murmur class, which shows that the number of classified classes for each class has improved compared to a single model. It can be observed that the ensemble classification performance is overall improved over the single model classification performance for the classes of each dataset. It can be observed that the ensemble classification performance is overall improved over the single model classification performance for the classes of each dataset.

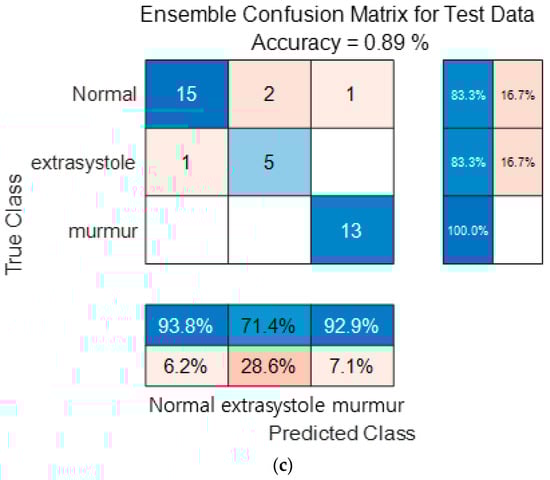
Figure 16.
1D-CNN, 2D-CNN, and ensemble confusion matrix results for PASCAL Classifying Heart Sounds Challenge Dataset: Dataset B. (a) the confusion matrix of 1D-CNN, (b) the confusion matrix of 2D-CNN, and (c) the confusion matrix of the ensemble.
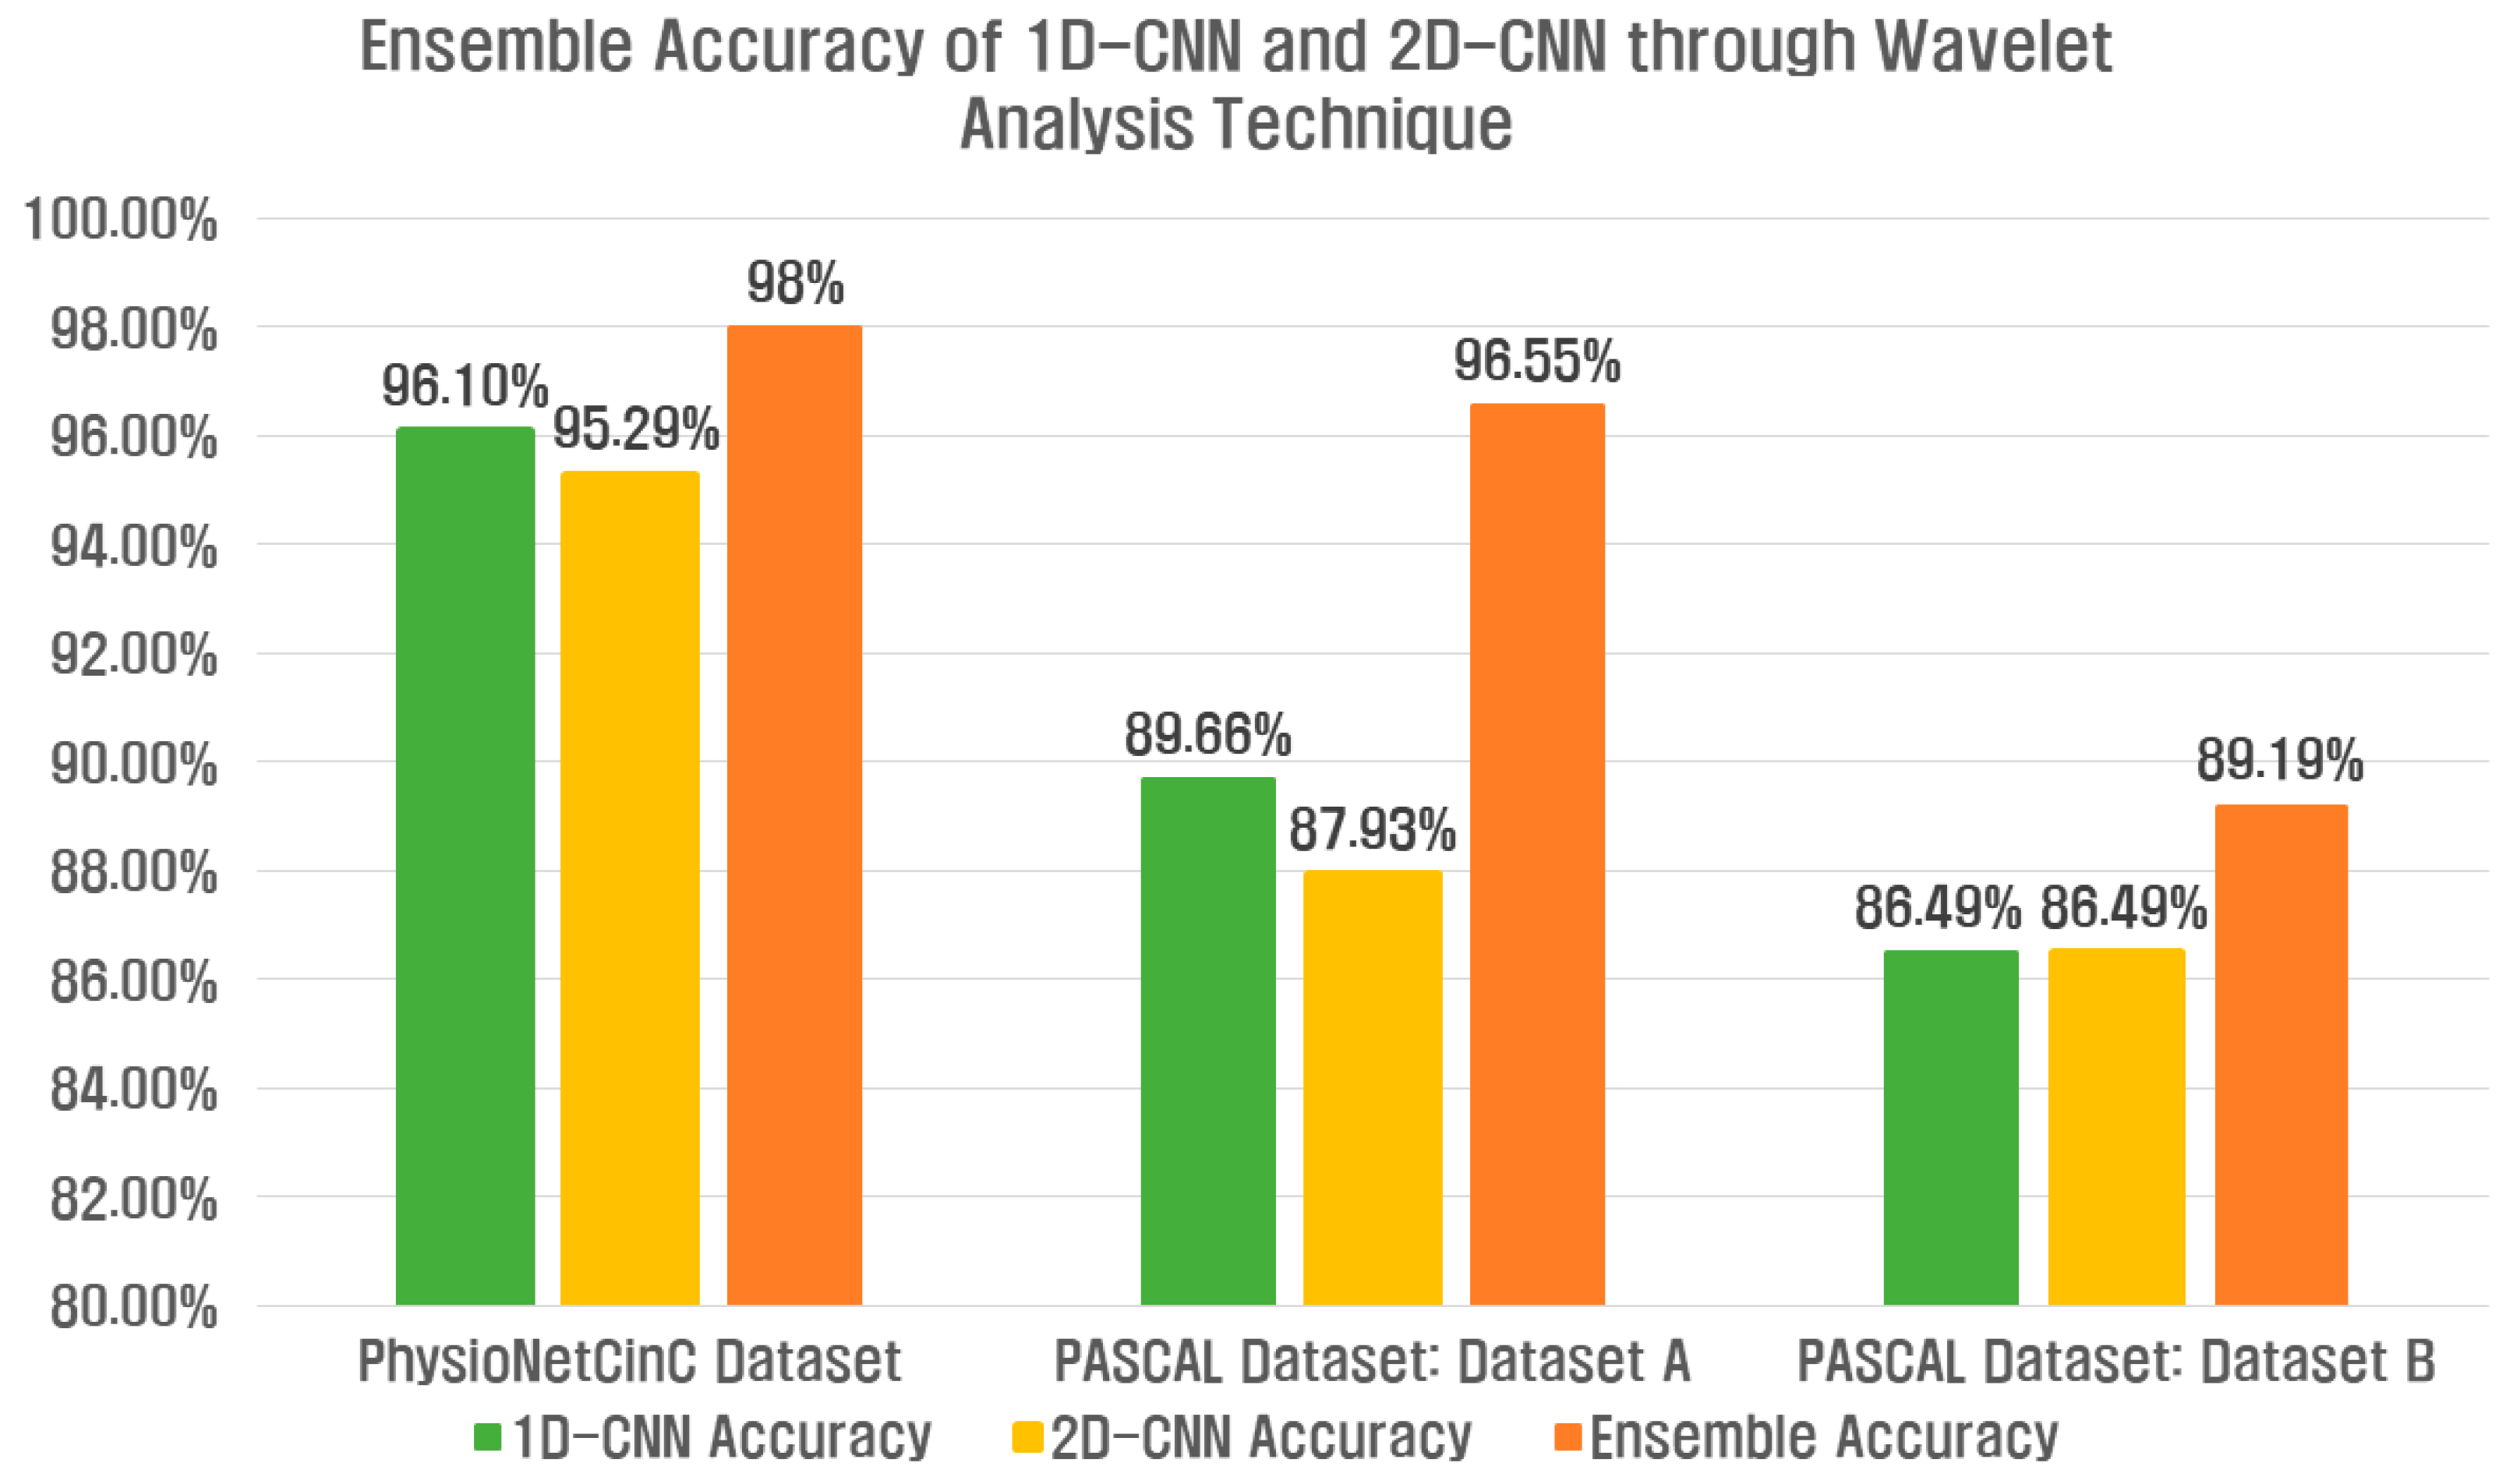
Table 7 shows the ensemble results of the 1D-CNN and 2D-CNN for Datasets A and B of the PhysioNet/CinC 2016 Challenge Dataset and the PASCAL Classifying Heart Sounds Challenge Dataset. Accuracy, Precision, Recall, F1-Score, Sensitivity, and Specificity for each class indicate the average value. The PhysioNet/CinC 2016 Challenge Dataset used two wavelet-based analysis techniques, and the ensemble accuracy of the deep learning model was improved by 1.9% compared to the single feature extraction method. In the PASCAL Classifying Heart Sounds Challenge Dataset, Dataset A improved by 6.89%, and Dataset B improved by 2.7%.
Table 7.
The final result of an ensemble of 1D-CNN and 2D-CNN using wavelet analysis technique.
Figure 17 shows the accuracy results of the ensemble 1D-CNN and 2D-CNN, and the classification performance is overall improved in terms of ensemble accuracy compared to the single model classification performance.
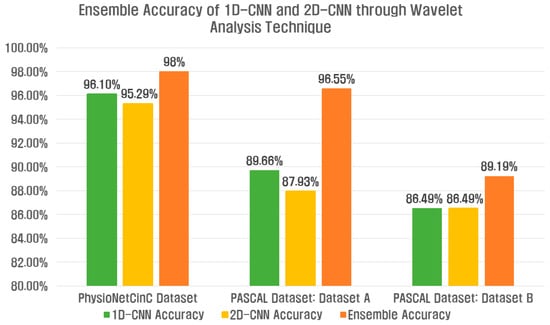
Figure 17.
Ensemble accuracy of 1D-CNN and 2D-CNN through wavelet analysis technique for three datasets.
Table 8 shows the results of comparing the existing feature extraction method and deep learning model-based heart sound classification for the PhysioNet/CinC 2016 Challenge Dataset and the PASCAL Classifying Heart Sounds Challenge Dataset and heart sound classification using the proposed ensemble. By extracting features through the two proposed wavelet analysis techniques, the ensemble accuracy of 1D-CNN and 2D-CNN is improved over the accuracy of existing feature extraction methods and deep learning-based heart sound classification.
Table 8.
Performance comparison for existing heart sound classification.
5. Conclusions
In this study, we propose a method to extract features using the WST and CWT methods based on wavelet analysis technology, classify cardiac abnormalities and heart sounds using a deep learning model, and ensemble the two models. In the medical field, accurate diagnosis and results must be derived, so the ensemble of deep learning models is used to improve accuracy by combining the powerful features of different models, and to reduce overfitting and improve reliability through results from various models. Because the PCG appears differently depending on the structure, size, and location of the heart as well as its physiological characteristics, PCG signal analysis is necessary for a detailed and accurate diagnosis. For cardiac function analysis in PCG signals, early prediction and diagnosis of heart-related diseases can be made through the information on transformation invariance and the features of S1, S2, S3, and S4 of PCG. The features extracted through the WST design a 1D-CNN suitable for the dataset and check the classification performance. The features extracted through CWT were converted into time-frequency expressions, and the classification performance was checked using the transfer learning model GoogleNet and ResNet50 models, which are 2D-CNN models. Precision, Recall, F1-Score, Sensitivity, and Specificity were used to evaluate classification performance. The ensemble results of the predicted values classified through each model confirmed that the PhysioNet/CinC 2016 Challenge Dataset improved by 1.9%, Dataset A of the PASCAL Classifying Heart Sounds Challenge Dataset improved by 6.89%, and Dataset B improved by 2.7%.
Author Contributions
Conceptualization, J.-A.L. and K.-C.K.; Methodology, J.-A.L. and K.-C.K.; Software, J.-A.L. and K.-C.K.; Validation, J.-A.L. and K.-C.K.; Formal Analysis, J.-A.L. and K.-C.K.; Investigation, J.-A.L. and K.-C.K.; Resources, K.-C.K.; Data Curation, J.-A.L.; Writing—Original Draft Preparation, J.-A.L.; Writing—Review and Editing, K.-C.K.; Visualization, J.-A.L. and K.-C.K.; Supervision, K.-C.K. All authors have read and agreed to the published version of the manuscript.
Funding
This research was supported by the Basic Science Research Program through the National Research Foundation of Korea (NRF), funded by the Ministry of Education (No. 2017R1A6A1A03015496).
Institutional Review Board Statement
Not applicable.
Informed Consent Statement
Not applicable.
Data Availability Statement
Not applicable.
Conflicts of Interest
The authors declare no conflict of interest.
References
- Abdelazez, M.; Rajan, S.; Chan, A.D.C. Automated Biosignal Quality Analysis of Electrocardiograms. IEEE Instrum. Meas. Mag. 2021, 24, 37–44. [Google Scholar] [CrossRef]
- WHO. World Statistics on Cardiovascular Diseases. Available online: https://www.who.int/en/news-room/fact-sheets/detail/cardiovascular-diseases-(CVDs) (accessed on 7 September 2023).
- Abdollahpur, M.; Ghaffari, A.; Ghiasi, S.; Mollakazemi, M.J. Detection of pathological heart sounds. Physiol. Meas. 2017, 38, 1616–1630. [Google Scholar] [CrossRef]
- Li, F.; Zhang, Z.; Wang, L.; Liu, W. Heart sound classification based on improved mel-frequency spectral coefficients and deep residual learning. Front. Physiol. 2022, 13, 1084420. [Google Scholar] [CrossRef]
- Choi, H.J. Evaluation and diagnostic approach for heart murmurs in children. J. Korean Med. Assoc. 2020, 63, 398–403. [Google Scholar] [CrossRef]
- Arslan, Ö.; Karhan, M. Effect of Hilbert-Huang transform on classification of PCG signals using machine learning. J. King Saud Univ.—Comput. Inf. Sci. 2022, 34, 9915–9925. [Google Scholar] [CrossRef]
- Chen, W.; Sun, Q.; Chen, X.; Xie, G.; Wu, H.; Xu, C. Deep Learning Methods for Heart Sounds Classification: A Systematic Review. Entropy 2021, 23, 667. [Google Scholar] [CrossRef]
- Guven, M.; Uysal, F. A New Method for Heart Disease Detection: Long Short-Term Feature Extraction from Heart Sound Data. Sensors 2023, 23, 5835. [Google Scholar] [CrossRef]
- Ghosh, S.K.; Tripathy, R.K.; Ponnalagu, R.N. Classification of PCG Signals using Fourier-based Synchrosqueezing Transform and Support Vector Machine. In Proceedings of the 2021 IEEE Sensors, Sydney, Australia, 31 October—3 November 2021; pp. 1–4. [Google Scholar]
- Cortes, C.; Vapnik, V. Support-vector networks. Mach. Learn. 1995, 20, 273–297. [Google Scholar] [CrossRef]
- Williams, P.; Li, S.; Feng, J.; Wu, S. A Geometrical Method to Improve Performance of the Support Vector Machine. IEEE Trans. Neural Networks 2007, 18, 942–947. [Google Scholar] [CrossRef]
- Cover, T.; Hart, P. Nearest neighbor pattern classification. IEEE Trans. Inf. Theory 1967, 13, 21–27. [Google Scholar] [CrossRef]
- Labied, M.; Belangour, A. Automatic Speech Recognition Features Extraction Techniques: A Multi-criteria Comparison. Int. J. Adv. Comput. Sci. Appl. 2021, 12. [Google Scholar] [CrossRef]
- Ismail, S.; Siddiqi, I.; Akram, U. Localization and classification of heart beats in phonocardiography signals—A comprehensive review. EURASIP J. Adv. Signal Process. 2018, 2018, 26. [Google Scholar] [CrossRef]
- Yaseen; Son, G.-Y.; Kwon, S. Classification of Heart Sound Signal Using Multiple Features. Appl. Sci. 2018, 8, 2344. [Google Scholar] [CrossRef]
- Yildirim, M. Diagnosis of Heart Diseases Using Heart Sound Signals with the Developed Interpolation, CNN, and Relief Based Model. Int. Inf. Eng. Technol. Assoc. (IIETA) 2022, 39, 907–914. [Google Scholar] [CrossRef]
- Alafif, T.; Boulares, M.; Barnawi, A.; Alafif, T.; Althobaiti, H.; Alferaidi, A. Normal and Abnormal Heart Rates Recognition Using Transfer Learning. In Proceedings of the 2020 12th International Conference on Knowledge and Systems Engineering (KSE), Can Tho, Vietnam, 12–14 November 2020; pp. 275–280. [Google Scholar]
- Mei, N.; Wang, H.; Zhang, Y.; Liu, F.; Jiang, X.; Wei, S. Classification of heart sounds based on quality assessment and wavelet scattering transform. Comput. Biol. Med. 2021, 137, 104814. [Google Scholar] [CrossRef]
- Park, D.S.; Lee, M.Y.; Kim, K.H.; Lee, H.C. A Lightweight Model for Heart Sound Classification Based on Inverted Residuals. J. Korean Inst. Ind. Eng. 2021, 47, 514–528. [Google Scholar] [CrossRef]
- Al-Issa, Y.; Alqudah, A.M. A lightweight hybrid deep learning system for cardiac valvular disease classification. Sci. Rep. 2022, 12, 14297. [Google Scholar] [CrossRef]
- Ghosh, S.K.; Ponnalagu, R.N.; Tripathy, R.K.; Panda, G.; Pachori, R.B. Automated Heart Sound Activity Detection from PCG Signal Using Time–Frequency-Domain Deep Neural Network. IEEE Trans. Instrum. Meas. 2022, 71, 1–10. [Google Scholar] [CrossRef]
- Chowdhury, S.; Morshed, M.; Fattah, S.A. SpectroCardioNet: An Attention-Based Deep Learning Network Using Triple-Spectrograms of PCG Signal for Heart Valve Disease Detection. IEEE Sens. J. 2022, 22, 22799–22807. [Google Scholar] [CrossRef]
- Kinha, D.; Gulati, G.; Baranwal, A.; Vishwakarma, D.K. Classifying Heart Sounds for Disease Detection Using Deep Learning Methods. In Proceedings of the 2023 4th International Conference for Emerging Technology (INCET), Belgaum, India, 26–28 May 2023; pp. 1–6. [Google Scholar]
- Movahedi, M.M.; Shakerpour, M.; Mousavi, S.; Nori, A.; Dehkordi, S.H.M.; Parsaei, H. A Hardware-Software System for Accurate Segmentation of Phonocardiogram Signal. J. Biomed. Phys. Eng. 2023, 13, 261–268. [Google Scholar]
- Toma, R.N.; Gao, Y.; Piltan, F.; Im, K.; Shon, D.; Yoon, T.H.; Yoo, D.; Kim, J. Wavelet Scattering Transform. Encyclopedia. Available online: https://encyclopedia.pub/entry/38420 (accessed on 17 October 2023).
- Shi, C.; Cheng, Y.; Zhang, C.; Yuan, J.; Wang, Y.; Jiang, X.; Zhu, C. Wavelet Scattering Convolution Network-Based Detection Algorithm on Nondestructive Microcrack Electrical Signals of Eggs. Agriculture 2023, 13, 730. [Google Scholar] [CrossRef]
- Bhardwaj, A.; Singh, S.; Joshi, D. Explainable Deep Convolutional Neural Network for Valvular Heart Diseases Classification Using PCG Signals. IEEE Trans. Instrum. Meas. 2023, 72, 1–15. [Google Scholar] [CrossRef]
- Szegedy, C.; Liu, W.; Jia, Y.; Sermanet, P.; Reed, S.; Anguelov, D.; Erhan, D.; Vanhoucke, V.; Rabinovich, A. Going Deeper with Convolutions. In Proceedings of the 2015 IEEE Conference on Computer Vision and Pattern Recognition (CVPR), Boston, MA, USA, 7–12 June 2015; pp. 1–9. [Google Scholar]
- He, K.; Zhang, X.; Ren, S.; Sun, J. Deep Residual Learning for Image Recognition. In Proceedings of the 2016 IEEE Conference on Computer Vision and Pattern Recognition (CVPR), Las Vegas, NV, USA, 27–30 June 2016; pp. 770–778. [Google Scholar]
- Liu, C.; Springer, D.; Li, Q.; Moody, B.; Juan, R.A.; Chorro, F.J.; Castells, F.; Roig, J.M.; Silva, I.; Johnson, A.E.W.; et al. An open access database for the evaluation of heart sound algorithms. Physiol. Meas. 2016, 37, 2181–2213. [Google Scholar] [CrossRef]
- Gomes, E.F.; Bentley, P.J.; Pereira, E.; Coimbra, M.T.; Deng, Y. Classifying Heart Sounds—Approaches to the PASCAL Challenge. Int. Conf. Health Inform. 2013, 337–340. [Google Scholar] [CrossRef]


Disclaimer/Publisher’s Note: The statements, opinions and data contained in all publications are solely those of the individual author(s) and contributor(s) and not of MDPI and/or the editor(s). MDPI and/or the editor(s) disclaim responsibility for any injury to people or property resulting from any ideas, methods, instructions or products referred to in the content. |
© 2023 by the authors. Licensee MDPI, Basel, Switzerland. This article is an open access article distributed under the terms and conditions of the Creative Commons Attribution (CC BY) license (https://creativecommons.org/licenses/by/4.0/).