Article

Data-Driven Semi-Empirical Model Approximation Method for Capacity Degradation of Retired Lithium-Ion Battery Considering SOC Range

1
State Key Laboratory of Power Transmission Equipment Technology, School of Electrical Engineering, Chongqing University, Chongqing 400044, China
2
Qianjiang Power Supply Branch of State Grid Chongqing Electric Power Company, Chongqing 409700, China
3
State Grid Chongqing Ultra High Voltage Company, Chongqing 400039, China
*
Author to whom correspondence should be addressed.
Appl. Sci. 2023, 13(21), 11943; https://doi.org/10.3390/app132111943
Submission received: 22 September 2023 / Revised: 23 October 2023 / Accepted: 25 October 2023 / Published: 31 October 2023
(This article belongs to the Special Issue Lithium-Ion Battery Health and Safety Estimation)

Abstract

:
The rapid development of the electric vehicle industry produces large amounts of retired power lithium-ion batteries, thus resulting in the echelon utilization technology of such retired batteries becoming a research hotspot in the field of renewable energy. The relationship between the cycle times and capacity decline of retired batteries performs as a fundamental guideline to determine the echelon utilization. The cycle conditions can influence the characteristics of the degradation of battery capacity; especially neglection of the SOC ranges of batteries leads to a large error in estimating the capacity degradation. Practically, the limited cycle test data of the SOC ranges of the retired battery cannot support a model to comprehensively describe the characteristics of the capacity decline. In this background, based on the limited cycle test data of SOC ranges, this paper studies and establishes a capacity degradation model of retired batteries that considers the factors affecting the battery cycle more comprehensively. In detail, based on the data-driven method and combined with the empirical model of retired battery capacity degradation, three semi-empirical modeling methods of retired battery capacity degradation based on limited test data of SOC ranges are proposed. The feasibility and accuracy of these methods are verified through the experimental data of retired battery cycling, and the conclusions are drawn to illustrate their respective scenarios of applicability.

1. Introduction

In the context of today’s increasing attention to sustainable development, renewable energy has become an important way to solve the energy crisis and environmental pollution. With the rapid development of the electric vehicle industry and electrochemical energy storage technology, lithium-ion batteries, as the main power source of electric vehicles, have entered the stage of large-scale retirement. According to the research of IDTechEx and TrendForce, by 2030, there will be over 6 million battery packs retiring from electric vehicles per year, and at the same time, the global power and energy storage battery recycling scale will exceed 1 TWh, of which the lithium iron phosphate battery recycling scale will account for more than 58% [1,2]. Large quantities of power batteries continue to retire, and improper recycling will lead to resource waste and a series of environmental problems, and hence the sustainable development of energy has brought great challenges. Thus, the question of the utilization and recovery of retired lithium-ion batteries has been paid more and more attention [3,4].
The average remaining capacity of such retired electric vehicle batteries is about 70–80% of their initial capacity, and although they are no longer suitable for high-power-demand scenarios such as electric vehicles, they still have a considerable energy storage capacity and good potential for reuse. After reasonable design and control, retired batteries can be used in other fields with good operating environments and relatively low battery performance requirements. From this point of view, compared with the new batteries, retired batteries have better environmental protection and economic value [5].
However, in the process of recycling, the battery will inevitably appear to have a performance decline and even unreliability and unsafety problems. Compared with new batteries, retired batteries have poor consistency, high performance dispersion, and a high security risk. In the process of layer-by-layer integration from battery cells, modules, and battery clusters to energy systems, the above problems will be superimposed and amplified, thus resulting in increased uncertainty in the overall performance of the system [6,7]. To realize the safe, reliable, large-scale, and multi-scenario echelon utilization of retired power batteries, it is necessary to accurately estimate the capacity degradation and life cycle of batteries. Therefore, it is of great significance to research the health decline law of retired batteries by studying suitable models and methods for the echelon utilization of retired batteries.
In the process of using retired power batteries, there are many factors that affect the decline in battery capacities, such as the number of battery charge/discharge cycles, operating temperature, depth of discharge (DOD), SOC range, charge, discharge current, etc. [8]. Most of the existing studies on the capacity degradation of lithium batteries are based on the accelerated aging test data, which can be mainly divided into three types: electrochemical mechanism model [9,10,11,12,13], empirical model [14,15,16,17,18,19,20], and data-driven model [21,22,23,24]. The method based on the electrochemical mechanism model involves the physical and chemical process of the battery and then researches the law of the influence of the aging process on state variables. This method can describe the aging process of the battery from the point of view of the essential mechanism, but many incentives affect the aging of the battery, so aging modeling is very difficult. Moreover, this model relies on the experimental data obtained under strict experimental conditions, which has a large gap with the actual operation of the battery, thus resulting in a significant error when applying such a model [25,26]. The basic idea of the method based on an empirical model is to use battery experimental data to summarize the law of battery parameter change and model the relationship between battery capacity degradation and battery cycle times or cumulative ampere-hours, ambient temperature, charge/discharge ratio, and DOD. The established model is tested under different decline conditions, the decline factor is used as the parameter of the model, and a large amount of test data are used to fit into the mathematical expression. Generally speaking, the more complex the expression, the more decline factors corresponding to the model and the higher the accuracy of the model. Such methods rely on a large number of offline experiments under different working conditions, hardly conduct in-depth research on the nature of battery capacity loss in charge/discharge cycles, and possess poor adaptability to working conditions that cannot be covered by experiments [20]. The method based on the data-driven model refers to the use of Gaussian process regression or machine learning methods to deeply explore the life decay behavior of the battery, by training the battery degradation data set, finding the battery aging factor as a performance index, and establishing the battery aging model. Although this method does not require analytical mathematical models, it conducts modeling based on a large amount of battery experimental test data, extracts external characteristic parameters, learns the degradation rule from historical information, and realizes the capacity degradation assessment and the prediction of batteries, which requires a high amount of experimental data [27].
In summary, the existing battery capacity degradation model and its research mainly suffer from the following three shortcomings:
  • Although existing battery capacity degradation models can consider many factors affecting capacity degradation, these models are mostly suitable for new batteries until the end of their life, that is, the capacity degradation to about 80%. The capacity degradation mechanism of new batteries and retired batteries is significantly different, so these capacity degradation models for new batteries cannot be used to simulate the capacity degradation of batteries directly. Because most of the model parameters are either fitted under laboratory conditions or provided by the manufacturer, the performance decline mode of the power battery is complicated, which leads to inaccurate estimates of the capacity of the retired battery.
  • Most of the existing models of retired battery capacity degradation only consider factors such as the number of battery charge/discharge cycles, operating temperature, DOD, charge/discharge rate, etc. Few models can consider the influence of the battery state of charge (SOC) range on capacity degradation, and hence the decline factors are not fully considered. In most practical applications, charge/discharge cycles are performed only in an SOC range. A DOD of the battery can correspond to multiple SOC ranges, the test results under a single DOD experimental condition are not suitable for all the SOC ranges, and the resulting capacity errors will be amplified in subsequent applications, thus hindering the research and analysis of retired battery echelon applications.
  • Most existing empirical models for capacity degradation of retired batteries only give the fitting model under specific battery operating conditions, and the model is not flexible. In the echelon utilization scenario of retired batteries, it is necessary to optimize and control their operating conditions reasonably, and a single operating parameter of the battery cannot fully meet the requirements of operation optimization.
Therefore, there is an urgent need for a model that can predict the capacity degradation of retired batteries under multiple operating conditions with different charge/discharge rates, temperatures, DODs, and SOC ranges to support the research on the echelon utilization of retired batteries. Modeling research cannot be separated from data support. After a large amount of research, it can be found that in the open-source data set of batteries, there are few test data involving SOC range changes, and the range of test changes is also very limited, not to mention the multi-range SOC test data for the retired batteries. Because the battery SOC range needs to be changed repeatedly to test its capacity attenuation, the detection time is long and the detection cost is high; so, the quite limited test data became a major constraint in this field of research.
Given the shortcomings of the existing research and related constraints, this paper focuses on how to use the limited SOC range of retired battery experimental data, fit a high-precision battery capacity degradation model that can cover different SOC ranges, and fully consider various operating conditions of batteries. Combining the methods of the empirical model and data-driven model, three semi-empirical modeling methods are proposed to obtain the law of retired battery capacity degradation. Firstly, the mathematical concept of interval number similarity is introduced into the battery capacity degradation model considering the SOC range. By making full use of the mathematical characteristics of known test data, the unknown SOC data can be obtained from the limited SOC data set. Two semi-empirical models of retired battery capacity degradation based on model interval number similarity and parameter interval number similarity are proposed. Secondly, based on the curve fitting method of the nonlinear least squares fitting, an improved semi-empirical model of retired battery capacity degradation is proposed. In this method, the SOC range of battery operation is involved in the semi-empirical capacity degradation model in terms of parameters, and a more perfect and realistic capacity degradation model of retired batteries can be established. Finally, the accuracy of these three methods is compared together, and the applicable scenarios are clarified.

2. Empirical Model of Retired Battery Capacity Degradation

The capacity loss of a battery is usually quantified by changes in the state of health (SOH) of the battery. The SOH of the retired battery can be used to quantify its capacity decay, that is, the ratio of the current maximum discharge capacity to the initial capacity of the retired battery [28], as shown in Equation (1):
S O H = C i C 0 × 100 %
where C i represents the maximum discharge capacity of the retired battery and C 0 denotes the initial capacity of the new battery, with their unit’s ampere-hours (Ah). SOH reflects the current aging degree of the battery. According to IEEE Standard 1188-1996 [29], when the initial capacity of the battery declines to 80%, the battery should be replaced. At the same time, the percentage of battery capacity loss can be defined as follows:
Q l o s s = ( 1 C i C 0 ) × 100 %
where Q loss denotes the percentage of capacity loss. The relationship between the Q loss and SOH is:
S O H + Q l o s s = 1
According to the survey report released by Trend Force, with the large-scale decommissioning of power and energy storage batteries in the future, it is expected that the global power and energy storage battery recycling scale will exceed 1 TWh by 2030, of which the lithium iron phosphate battery recycling scale will account for more than 58% [30]. The research on the echelon utilization of retired power batteries should focus on lithium iron phosphate batteries, and this paper will carry out a follow-up analysis of retired lithium iron phosphate power batteries.
Reference [31] researched the law of capacity degradation of LiFePO4 batteries caused by cycles through experiments and established an empirical model of battery cycle life under the influence of temperature, DOD, and charge/discharge ratio. The model uses a general equation to describe the battery capacity degradation under all conditions, and its specific function form is available as follows:
Q l o s s = δ · exp [ E a R · T ] ( A h ) z
A h = N · D O D · Q b
where δ is the pre-exponential factor; E a is the activation energy of the battery at the current temperature, and it defaults to a fixed value at the standard operating temperature; R is the molar gas coefficient and its value is 8.314 J/K·mol; T is the absolute temperature; and z is the power law factor. Ah is the Ah throughput, which is expressed as Equation (5), in which N is the cycle number of the retired batteries, and is the full cell capacity. The exponential term z indicates that the temperature obeys the Arrhenius Law.
However, this model is based on the capacity degradation stage of the new battery from the initial capacity to the battery’s retirement, and it may not be suitable for decommissioning batteries. Reference [32] conducted several sets of cyclic aging experiments on retired 18650 lithium iron phosphate power batteries and established a cycle life model of retired batteries related to battery charge/discharge rate, DOD, and ambient temperature based on the measured data. The form of the model is the same as Equation (4), which just verifies the feasibility and accuracy of Equation (4) for fitting the capacity degradation rule of a retired 18650 lithium iron phosphate power battery.
Reference [33] improved the empirical model to overcome the problem of poor fitting accuracy of the above-mentioned retired battery capacity degradation model because it did not involve the separate effects of charge/discharge rate and DOD. The inverse power law model is used to describe the separate effects of charge/discharge rate C R a t e and DOD on the cycle life of lithium-ion batteries. The specific expression is as follows:
Q l o s s C = α 1 · C R a t e β
Q l o s s D O D = α 2 · D O D γ
Finally, the comprehensive acceleration effect of the temperature, charge/discharge rate, and DOD on life decline can be expressed as:
Q l o s s = α · exp [ a · C R a t e + b R · T ] · C R a t e β · D O D γ ( N · D O D · Q b ) z
where α, β, γ, a , b , and z are all fitting parameters, and α =   α 1 · α 2 . Combined with Equation (3), the semi-empirical model of capacity degradation of retired batteries described by SOH can be obtained as:
S O H = 0.8 α · exp [ a · C R a t e + b R · T ] · C R a t e β · D O D γ ( N · D O D · Q b ) z
This model is the basis of the research work in this paper and can be used in the semi-empirical model of battery capacity degradation.

3. Semi-Empirical Model of Retired Battery Capacity Degradation Based on Interval Number Similarity

The state of charge (SOC) of the battery represents the ratio of the remaining capacity to the rated capacity of the battery, which reflects the remaining available capacity of the power battery and is one of the important indicators of the performance of the power battery. In most practical applications, the batteries only undergo charge/discharge cycles within a partial range of the full SOC range (0~100%), and the temperature, charge/discharge rate, and DOD of each cycle are not the same. To derive the retired battery capacity degradation model with multiple operating conditions in an SOC range from the data of the known SOC range, two semi-empirical models of the retired battery capacity degradation based on model interval number similarity and parameter interval number similarity are proposed in this paper. Note that the SOC range is defined as Δ SOC herein.

3.1. Interval Number Similarity Degree Computing Model

The Δ SOC is a concept of interval. To obtain the retired battery capacity degradation model of the required Δ SOC based on the test data of the limited Δ SOC , it is necessary to know the interval relationship between the Δ SOC and the known Δ SOC . For this reason, this paper introduces the concept of interval number similarity to describe the relationship between them [34]. Based on the concept of interval number similarity, the interval measurement model is established and applied to the empirical model of retired battery capacity degradation.
Let m = [ m , m + ] and n = [ n , n + ] , while p j ( j = 1 , 2 , 3 , 4 ) is the j-th largest in m , m + , n , and n + , and then the similarity between interval number m and n is defined as [35].
S m , n = ( p 2 p 3 ) [ 1 sgn ( n m + ) ] [ 1 sgn ( m n + ) ] / 4 ( p 1 p 4 ) ( p 2 p 3 ) | sgn ( n m + ) sgn ( m n + ) | / 2
sgn ( x ) = { 1 , 0 , 1 , x > 0 x = 0 x < 0
If we decompose Equation (6), that is:
S m , n = { 0 , n + m   or   m + n n + m m + n , n < m n + < m + m + n n + m , m < n m + < n + l m l n 1 , n m < m + n + l n l m 1 , m n < n + m +
where l m = m + m , l n = n + n .
The interval number similarity model is applied to the retired battery capacity degradation model, we take the interval number similarity between the unknown Δ SOC and the known Δ SOC as the weight, adopting different assignment methods combined with the semi-empirical model. Because of the nonlinearity of the semi-empirical model, the corresponding methods of retired battery capacity degradation based on interval number similarity can be further divided into two types: the method based on parameter interval number similarity and the method based on model interval number similarity.

3.2. Semi-Empirical Model of Capacity Degradation of Retired Battery Based on Model Interval Number Similarity

The method of the capacity degradation model based on the interval number similarity is to normalize the interval similarity as the weight of the semi-empirical model of each known Δ SOC , calculate the sum of the weights of the semi-empirical model of each known Δ SOC , and obtain the model of the Δ SOC to be determined, as shown in Equations (13) and (14):
First of all, the known interval number similarity can be normalized by Equation (12):
S m , n i = S m , n i S m , n 1 + S m , n 2 + + S m , n k
where m represents the Δ SOC to be simulated, n i ( i = 1 , 2 , , k ) represents k  Δ SOC s with known capacity degradation, S m , n i represents the similarity between the Δ SOC to be simulated and the i-th known Δ SOC , while S m , n i represents the weight of the i-th expression. The capacity degradation model based on the similarity method of model interval numbers is as follows:
S O H model = S m , n 1 × S O H 1 + S m , n 2 × S O H 2 + + S m , n k × S O H k
where S O H i ( i = 1 , 2 , , k ) denotes the retired batteries capacity degradation model obtained by Equation (9) fitting from the known Δ SOC data, and S O H model is the result of the similarity method based on the interval number of the model.
The flow chart of the semi-empirical model of the capacity degradation of retired batteries based on model interval number similarity is shown in Figure 1:

3.3. Semi-Empirical Model of Capacity Degradation of Retired Batteries Based on Parameter Interval Number Similarity

The method of the capacity degradation model based on the parameter interval number similarity is to take the interval similarity as the weight of each fitting parameter in the semi-empirical model, and the fitting parameter of the model to be solved is determined by the weight of each known parameter. Finally, the semi-empirical model of the Δ SOC based on the parameter interval number similarity method is obtained, as shown in Equations (12) and (13).
First of all, the semi-empirical model with parameters in the known Δ SOC can be obtained from Equation (9) as follows:
{ S O H 1 = 1 α 1 · exp [ a 1 · C R a t e   1 + b 1 R · T 1 ] · C R a t e   1 β 1 · D O D 1 γ 1 ( N · D O D 1 · Q b ) z 1 S O H 2 = 1 α 2 · exp [ a 2 · C R a t e   2 + b 2 R · T 2 ] · C R a t e   2 β 2 · D O D 2 γ 2 ( N · D O D 2 · Q b ) z 2 S O H k = 1 α k · exp [ a k · C R a t e   k + b k R · T k ] · C R a t e   k β k · D O D k γ k ( N · D O D k · Q b ) z k
Then, the interval number similarity is assigned to each fitting parameter as a weight, and the new fitting parameters can be obtained as follows:
c j = S m , n 1 × c 1 , j + S m , n 2 × c 2 , j + + S m , n k × c k , j   ( j = 1 , 2 , n c )
where c j denotes the fitting parameter of the semi-empirical model and n c is the number of fitting parameters. Finally, the semi-empirical model of the capacity degradation of retired batteries based on the parameter interval number similarity method is obtained by the following Equation (17):
S O H p a r m = 1 α j · exp [ a j · C R a t e + b j R · T ] · C R a t e β j · D O D j γ j ( N · D O D j · Q b ) z j
where α j , β j , γ j , a j , b j , z j denote the new parameters calculated by the interval number similarity model, and S O H p a r m is the result of the similarity method based on the parameter interval number.

4. An Improved Semi-Empirical Model of Retired Battery Capacity Degradation Based on Least Square Curve Fitting

The previous part proposed two semi-empirical models based on interval number similarity for the capacity degradation of retired batteries, which are divided into two types: the model interval number method and parameter interval number method. Because the interval number similarity-based semi-empirical modeling method can only obtain a capacity degradation model under a certain operating condition, it is impossible to obtain a general semi-empirical model to simulate the capacity decline of retired batteries under various working conditions. Therefore, to directly obtain the degradation of retired battery capacity in different Δ SOC s through the empirical models, it is necessary to improve the empirical models based on the data-driven methods.

4.1. Improvement of Empirical Model

Reference [36] tested the capacity degradation performance of lithium iron phosphate batteries under various influencing factors through aging experiments and proposed a holistic aging model for lithium battery life estimation. In this model, the effect of average voltage on the decline in battery capacity is considered. The test results indicate that the decline factor has a linear relationship with DOD and a quadratic relationship with the average voltage. When the SOC is between 45% and 55%, the capacity degradation is minimal, and higher or lower Δ SOC s will exacerbate the cyclic aging of the battery. The disadvantage lies in that this conclusion is obtained from the aging experiment results of new batteries and may not apply to the retired batteries.
Most of the battery aging experiments conducted in research institutes are conducted on new batteries, but some experiments include part of the battery decommissioning phase. Combining the experimental cycle life test results of Li(NiMnCo)O2 (NMC) batteries with different average SOC values from Ecker et al. [37] and the experimental test results of LiFePO4 (LFP) batteries from Jiang et al. [38], it can be concluded that the cycle life of a battery with an average SOC of close to 50% is the longest, and the cycle life decreases with the development of the average SOC towards both ends. Based on the experimental test data of NMC batteries [37], reference [39] adopted a piecewise Gaussian model to fit the stress factors caused by the mean value of SOC on capacity degradation. The downside is that none of the above references have improved and perfected their empirical models based on test data, and hence under different working conditions, it is impossible to use the general model to generate more capacity degradation models of retired batteries.
Therefore, the empirical model of the retired battery shown in Equation (9) is improved and perfected in this paper. The Δ SOC of the battery can be uniquely determined by DOD and average SOC, and the battery cycle aging factor Δ SOC can be applied to the retired battery empirical model in the form of an aging factor c a g e ; thus, the improved empirical model can be expressed as follows:
S O H = 0.8 c a g e · α · exp [ a · C R a t e + b R T ] · C R a t e β · D O D γ ( N · D O D · Q b ) z
Based on the above research results and conclusions, the quadratic function relationship is proposed in this paper to fit the relationship among the aging factor in the Δ SOC and the average SOC and DOD, as follows:
c a g e = λ 1 + λ 2 · ( S O C a v g S O C 0 ) 2 + λ 3 · S O C a v g · D O D + λ 4 · D O D + λ 5 · D O D 2
where λ 1 , λ 2 , λ 3 ,   λ 4 ,   and   λ 5 denote the fitting parameter and S O C a v g is the average SOC. S O C 0 is the median SOC value in the battery model, and the range is the interval [0, 100], which is obtained by repeated iterative solutions. At this point, the empirical model of retired batteries has been improved and the Δ SOC is integrated into the retired battery model in the form of variables.

4.2. An Improved Semi-Empirical Model Fitting Method Based on the Data-Driven Method

To fit the capacity degradation model of retired batteries as accurately as possible based on the limited Δ SOC data, and at the same time accurately simulate the cycle aging effect of Δ SOC on batteries, this paper proposes a data-driven improved semi-empirical model fitting method. The flow chart of method is shown in Figure 2:
The empirical model of the battery usually obeys the nonlinear relationship, such as exponential functions, quadratic functions, and so on. Moreover, the data-driven method has high requirements for the accuracy of function fitting. Thus, this paper adopts the nonlinear least squares algorithm for data fitting of the above problems [40].
It is known that the sample number of a set of measured data (x, y) is n t , and it approximately obeys the nonlinear function f (s, x, t) with undetermined parameter vector s; accordingly, the sum of squares of the fitting error, that is, the sum of squares of residuals, can be calculated as:
Z = t = 1 n t w t ( y t y ^ t ) 2 = t = 1 n t w t ( y t f ( s , x t , t ) ) 2
where w t is the weight of the t-th sample; if the importance of each sample is identical, then w t = 1 / n ; and y ^ t is the estimated value of the t-th sample. To ensure the best effect of fitting the curve, it is necessary to minimize Z as below:
min Z = min t = 1 n t w t ( y t f ( s , x t , t ) ) 2
Considering that f (s, x, t) is a nonlinear function, a set of nonlinear equations will be obtained when solving the partial derivative of the undetermined parameter vector based on Equation (21), so the iterative method is used for the solution [40].
First, set the initial value of the undetermined parameter vector to s 0 , and the vector Y ^ ( s ) composed of the sample estimate y ^ t performs Taylor series expansion around s 0 , as shown in the following formula:
Y ^ ( s ) Y ^ ( s 0 ) + [ Y ^ ( s ) s T ] s = s 0 × ( s s 0 )
Next, update s with Z / s T = 0 as a known condition, that is:
Z s T = 2 [ Y ^ ( s ) s T ] T × [ Y Y ^ ] 2 J 0 [ Y Y ^ ( s 0 ) J 0 × ( s 1 s 0 ) ] = 0
where Y is the vector formed by the sample value y t . J 0 is the Jacobian matrix corresponding to the initial value, which can be calculated according to:
J 0 = [ Y ^ ( s ) s T ] s = s 0
Combine Equation (23) with Equation (24), that is:
s 1 = s 0 + ( J 0 T J 0 ) 1 J 0 T [ Y Y ^ ( s 0 ) ]
Similarly, the Jacobian matrix J p under the p-th iteration can be obtained by updating the above Equations (22)–(25), that is:
J p = [ Y ^ ( s ) s T ] s = s p
In addition, the corresponding correction is:
{ s p + 1 = s p + Δ s p Δ s p = ( J p T J p ) 1 J p T [ Y Y ^ ( s p ) ]
Finally, Equation (28) can be used to judge whether the iteration is convergent or not:
max | Δ s i p | i = 1 , 2 , , n s σ
where n s denotes the number of parameters to be determined; σ is the given allowable error. When the number of samples of the measured data is equal to the number of undetermined parameters n s , the above nonlinear least squares fitting process is simplified to solve the simple nonlinear equations.
To better evaluate the goodness of fit of the model, two statistical indicators, R-squared (R2) and root mean square error (RMSE) [41], were used to quantify the fitting effect of the model.
R 2 = 1 i = 1 n t ( y ^ i y i ) 2 i = 1 n t ( y ¯ i y i ) 2
R M S E = 1 n t i = 1 n t ( y i y ^ i ) 2
where R2 is the coefficient of determination, and the value of R2 100% means perfect fit. RMSE is the standard deviation of residuals, with smaller RMSE representing a better fit.

5. Case Study

In this case, the experimental data of the retired 18650 lithium iron phosphate battery in reference [42] are selected for theoretical verification and analysis. The basic parameters and experimental parameters of the battery sample are available in Table 1. According to the relevant standards and specifications [43], the life of the retired LFP cells was tested using charge/discharge equipment, a high-accuracy battery performance tester, and a constant temperature and humidity box. In the course of the experiment, the charge/discharge ratio is 1 C, the experimental temperature is 30 °C, and the cut-off voltage is 4.2 V. To obtain the test data of the decay of retired LFP single cells in different Δ SOC s, six conditions are selected as provided in Table 2. The experimental data after processing and the fourth-order polynomial fitting curves given in reference [42] are shown in Figure 3.
The parts of the case study in this paper are generally arranged as follows: first, the fitting of the empirical model under six working conditions is carried out; secondly, the results of three semi-empirical modeling methods for retired batteries are presented in two sections, and then their fitting accuracy and advantages are analyzed through a comparison with the traditional methods; finally, the fitting effects of the three semi-empirical modeling methods are compared comprehensively, and the data scenarios applicable to each method are discussed.

5.1. Fitting of Empirical Model

The measured data in different Δ SOC s are based on the same charge/discharge rate, temperature, and cut-off voltage. To determine the temperature-dependent fitting parameter z, we logarithmically process and rearrange the items of Equation (8), that is:
ln ( Q loss ) = ln ( α ) ( E a R · T ) + z ln ( A h )
Draw ln ( Q loss ) ln ( α ) + ( E a R · T ) as a function of ln ( A h ) , and apply Equation (31) for single-step fitting optimization. The best linear regression curve is as follows.
The power law factor z in the empirical model can be determined from the linear fitting slope shown in Figure 4, whose value is equal to 0.8121. Next, the retired battery empirical model shown in Equation (9) is used to nonlinearly fit the measured data of the battery under six conditions, and the fitting parameters and goodness of fit can be found in Table 3.
From the value of R2 and RMSE in Table 3, it can be seen that the fitting accuracy of the empirical model is high. The fitting results and measured data obtained from the empirical model of Equation (9) under six conditions are shown in Figure 5.

5.2. Fitting of Semi-Empirical Model Based on Interval Number Similarity

Based on the semi-empirical modeling method of interval number similarity proposed in this paper, the empirical models of six conditions obtained from known data are analyzed below. For the six Δ SOC s of [80, 100]%, [40, 60]%, [0, 20]%, [20, 100]%, [10, 90]%, and [0, 100]%, calculate the similarity matrix between any two intervals, as shown in Figure 6.
To verify the effectiveness of the semi-empirical model of retired battery capacity degradation based on interval number similarity proposed in this paper, the measured data under six sets of test cases are used to verify one another, as shown in Table 4.
To verify the advantages of the proposed method, the data-driven method based on interval number similarity proposed in reference [
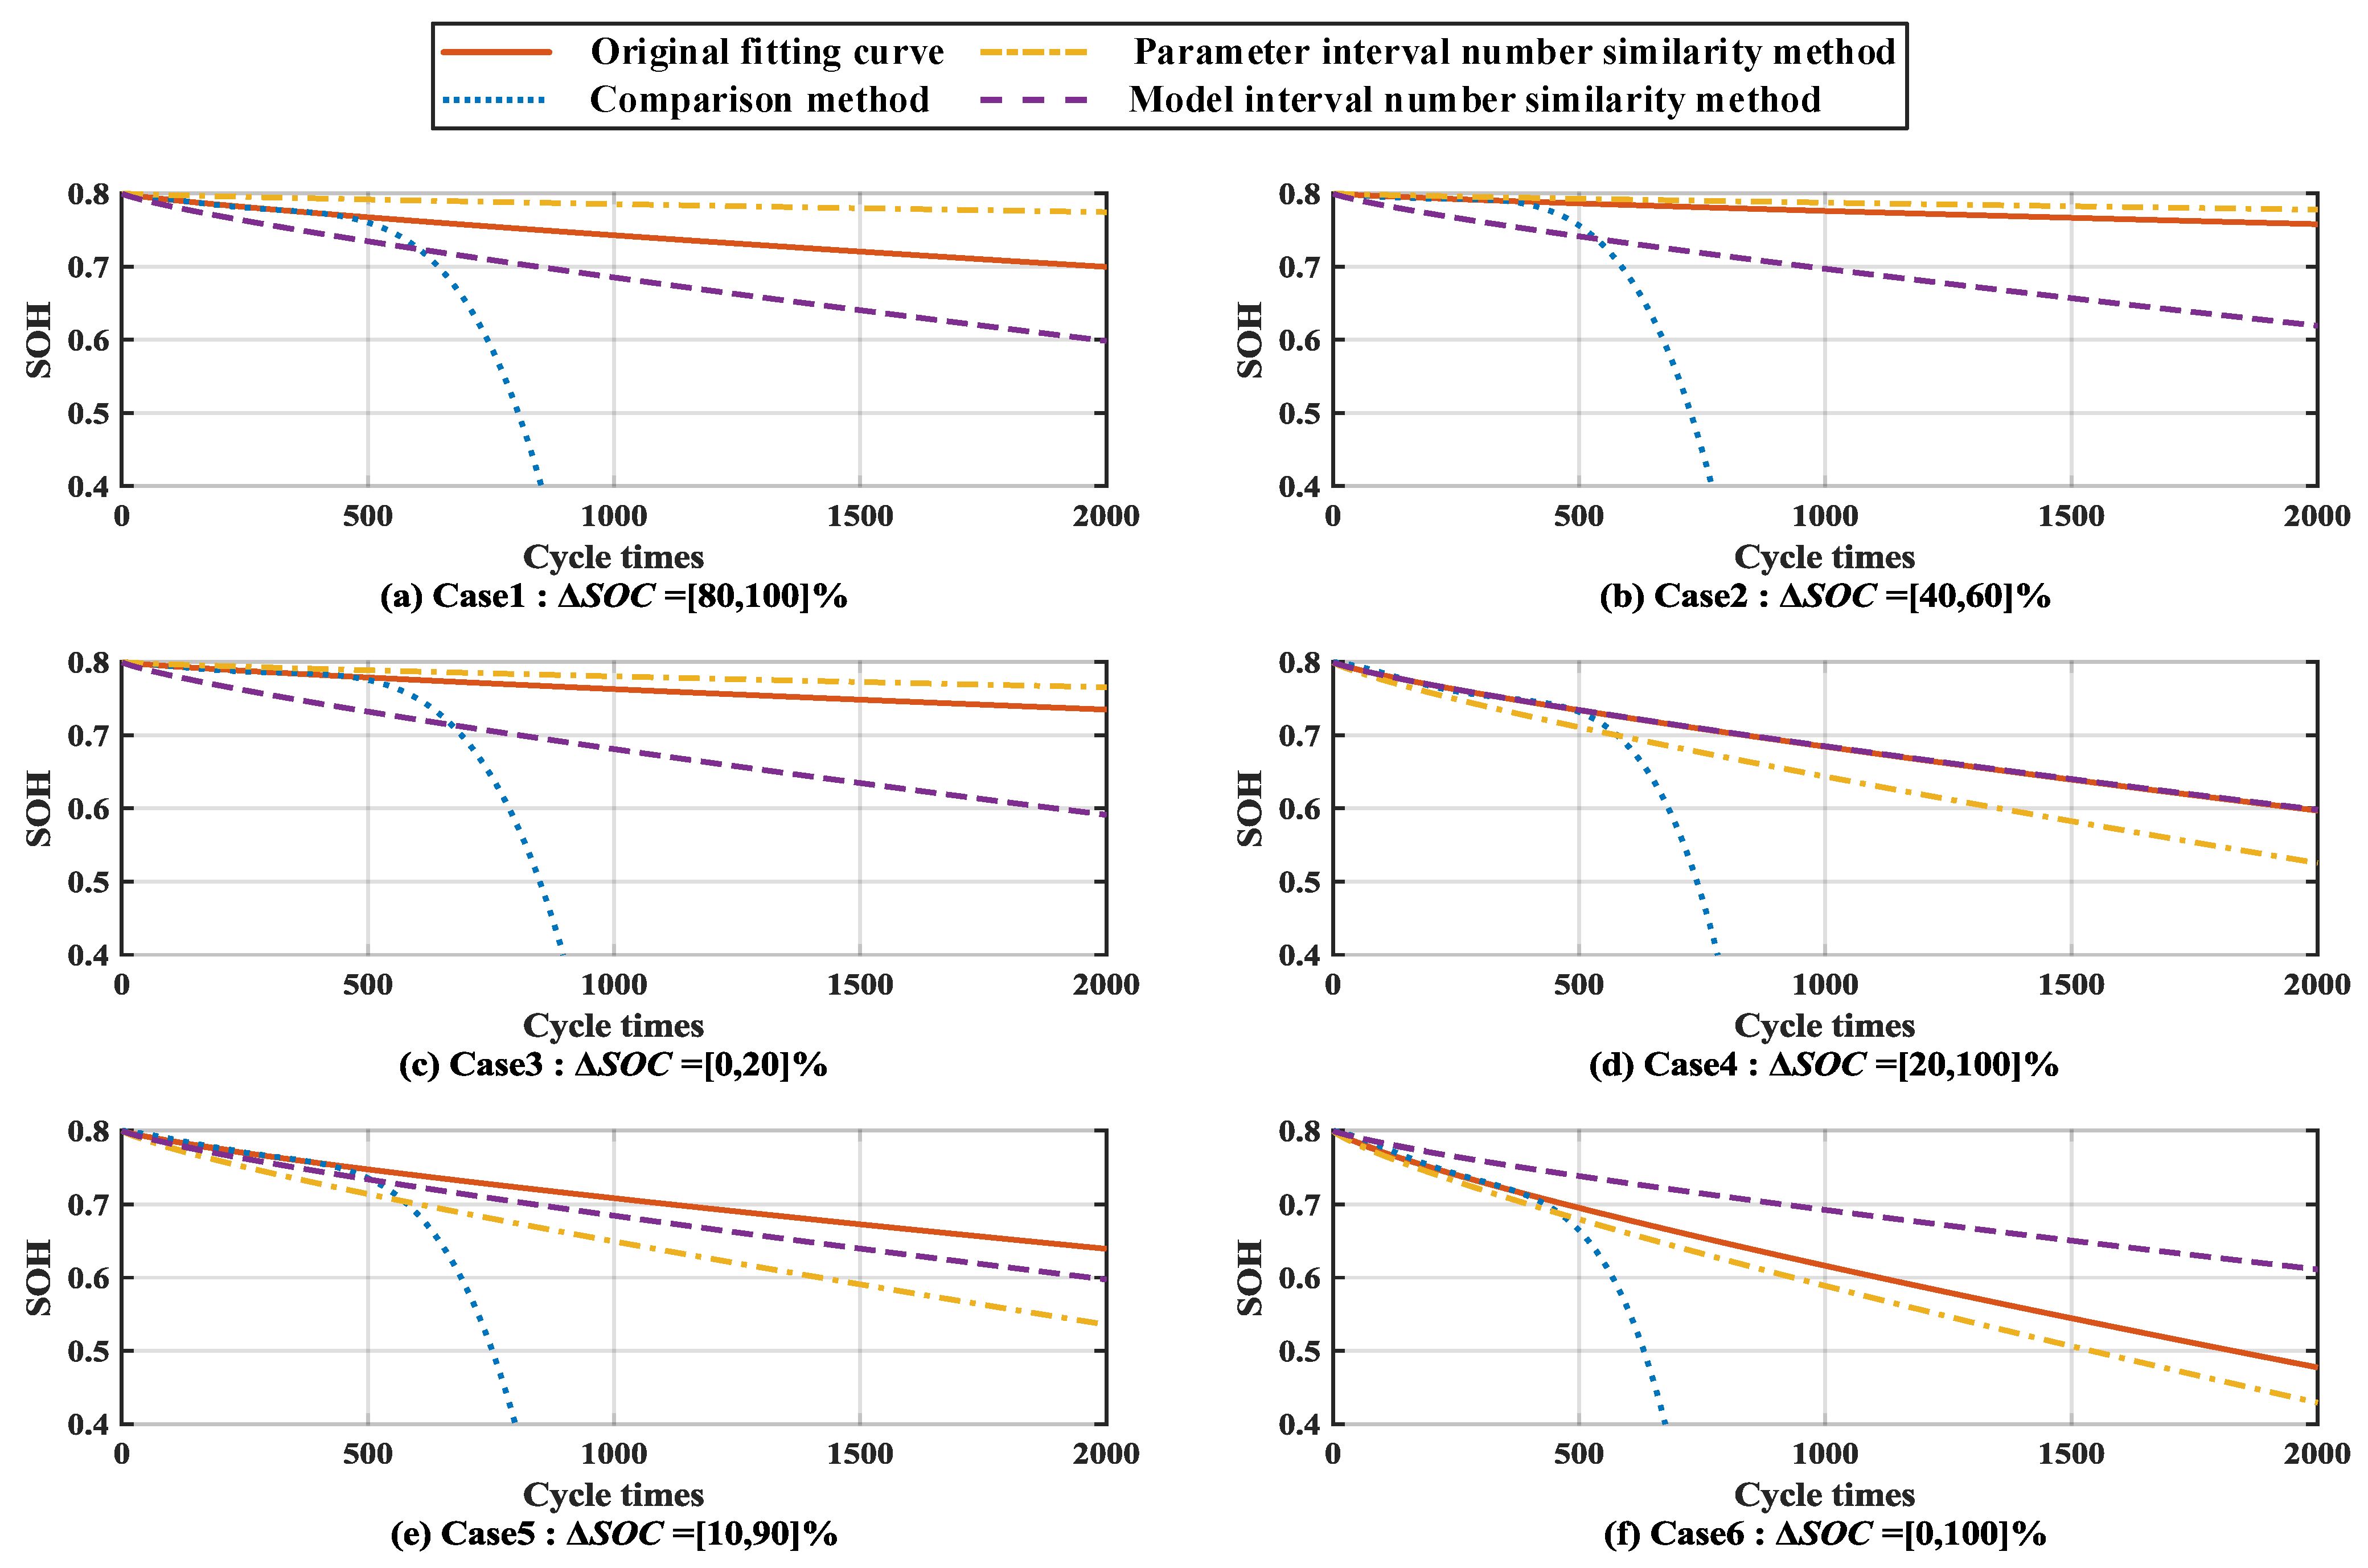
34] is used as the comparison method. We test the two interval number similarity-based semi-empirical modeling methods proposed in this paper, which are the model interval number method and the parameter interval number method. The results of six cases obtained by these two semi-empirical modeling methods and their comparison are shown in Figure 7. Among them, the original fitting curve is defined as the theoretical value of SOH for reference.
It is not difficult to see from the results shown in Figure 7 that although the comparison method is close to the measured fitting data within 500 cycle times, the deviation of the results between the comparison method and the original fitting curve becomes larger and larger as the number of cycle times increases, and they gradually deviate far from the theoretical value. In contrast, the semi-empirical modeling method based on interval number similarity presented in this paper shows the same capacity degradation trend as the original fitting curve and can be more similar to the measured fitting curve in Case 4, Case 5, Case 6, and other examples. To quantify this degree of similarity, the values of R2 and RMSE between the two interval number similarity-based semi-empirical modeling methods and the measured fitting curves are shown in Table 5.
From the values of the goodness of fit in Table 5, we can see that in Case 2, Case 3, and Case 6, the parameter interval number similarity method performs better than the model interval number method; in Case 4 and Case 5, the model interval number similarity method performs better than the parameter interval number method. Combined with the interval number similarity matrix in Figure 6, it can be found that the model interval number similarity method has more advantages when the known Δ SOC can fully cover the unknown Δ SOC ; instead, when the known Δ SOC can not adequately cover the unknown Δ SOC , the parameter interval number similarity method is more superior. In particular, in Case 6, when Δ SOC = [0, 100]%, the known Δ SOC is not fully covered by the unknown Δ SOC , thus the parameter interval number method performs better than the modes. This is because the parameter interval number method approach requires fewer known data and is more adaptable, while the model interval number method approach relies more on the known data.
Compared to the two interval number similarity-based semi-empirical modeling methods of parameter and model herein, the model-based method can only obtain the change in battery capacity degradation in the same Δ SOC of the charge/discharge rate and temperature; it is not practical. The parameter-based method can obtain the change in battery capacity degradation in the desired Δ SOC 
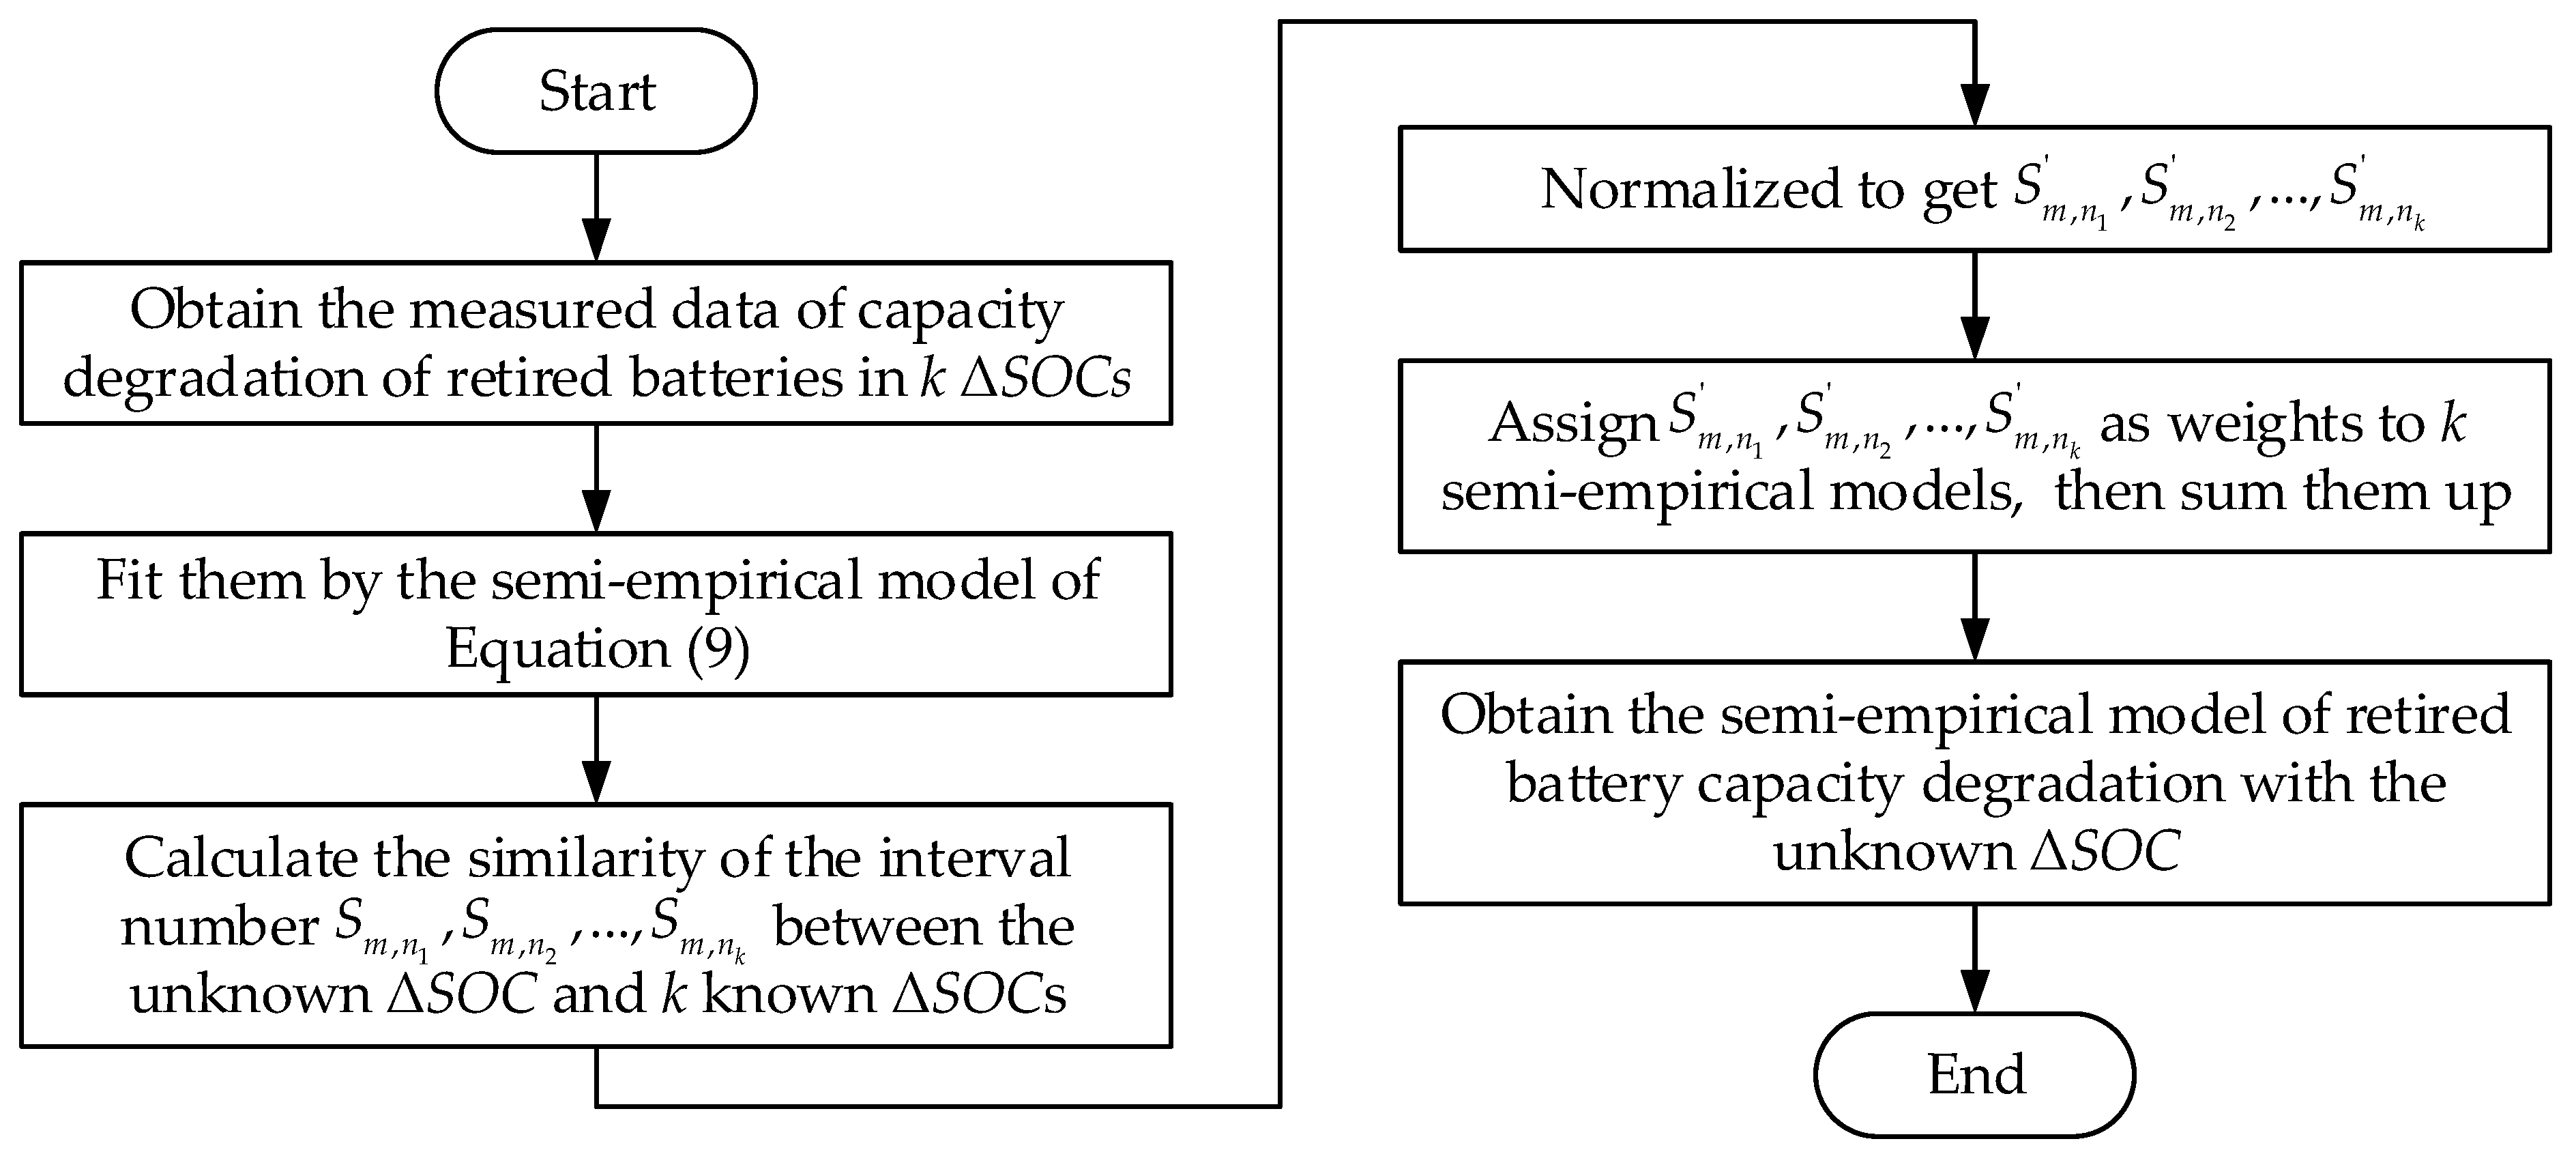
under different charge/discharge rates and temperatures of the working conditions. Taking Case 6 as an example, based on Equation (9), the semi-empirical model of Δ SOC = [0, 100]% obtained by the parameter interval number similarity method is shown as follows:
S O H = 0.8 7.3885 × 10 4 × exp [ 0.9702 · C R a t e + 0.9568 8.314 · T ] · C R a t e 0.9 · D O D 0.1756 ( N · D O D · Q b ) 0.8121
Equation (32) can be used to estimate the change of battery capacity degradation under other operating conditions in Δ SOC = [0, 100]%.

5.3. Fitting of Improved Semi-Empirical Model Based on the Least Square Fitting Method

In the battery charge/discharge cycle aging, not only the Δ SOC will be changed, but also the charge/discharge rate, temperature, and other working conditions will be changed. Therefore, the semi-empirical model is expected to simulate performance degradation under various working conditions. The improved semi-empirical modeling method based on the least square method can meet the above application requirements.
Based on the improved semi-empirical model fitting method proposed in this paper, Case 4 in Table 4 is taken as an example to solve the improved semi-empirical model. The known Δ SOC s are [80, 100]%, [40, 60]%, [0, 20]%, [10, 90]%, and [0, 100]%, while the unknown Δ SOC is [20, 100]%. The known data of Case 4 have the same DOD and different Δ SOC s at the same time and two types of data of the same Δ SOC and different DODs, which can more comprehensively fit the aging factor.
First of all, the empirical model of Equation (9) is used for nonlinear least squares fitting, and then the empirical model fitting results are as follows:
S O H = 0.8 4.5750 × 10 4 × exp [ 0.0355 · C R a t e + 0.8489 8.314 · T ] · C R a t e 0.9595 · D O D 2.2140 ( N · D O D · Q b ) 0.8121
Based on the empirical model of Equation (33), the decline in battery capacity under various DODs, charge/discharge rates, and the temperature working conditions can be obtained correspondingly.
The five conditions of the known measured data can be divided into two groups: the same DOD but different average SOCs and the same average SOC but different DODs. The aging factors of the two groups are calculated, and the relationship between the aging factor and the Δ SOC is studied deeply. The results of aging factors obtained are shown in Figure 8 as follows.
It can be seen from the figure above that the relationship between the aging factor of the experimental data and the average SOC and DOD is approximately a quadratic function, which accords with the aging factor model in the improved semi-empirical model established in this paper.
Based on five groups of measured data, the improved semi-empirical model of Equations (18) and (19) was fitted by the nonlinear least square method, and the fitting results of each unknown parameter were obtained, as shown in Table 6.
Therefore, the improved semi-empirical model based on the least square fitting is built as follows:
c a g e = 26.01 + 0.0103 · ( S O C a v g 37.26 ) 2 0.4247 · S O C a v g · D O D 38.93 · D O D + 33.49 · D O D 2 S O H = 0.8 c a g e × 4.5750 × 10 4 × exp [ 0.0355 · C R a t e + 0.8489 8.314 · T ] · C R a t e 0.9595 · D O D 2.2140 ( N · D O D · Q b ) 0.8121
Among them, S O C a v g , DOD, C R a t e , and T can constitute the working conditions of the retired battery. The capacity degradation of the retired battery under various working conditions can be obtained from the above model.
Figure 9 shows the capacity degradation of retired batteries in three different Δ SOC s obtained by the method in this paper when DOD = 20%, and it compares the original empirical model with the original data. It can be seen that compared with the original empirical model, which cannot distinguish the capacity decline of different Δ SOC s under the same DOD, the improved semi-empirical model in this paper improves the operation scenario of the empirical model and is more in line with the practical application.
In order to verify the feasibility of the improved semi-empirical modeling method proposed in this paper, Case 4 in Table 4 is used for analysis. The known Δ SOC s include [80, 100]%, [40, 60]%, [0, 20]%, [10, 90]%, and [0, 100]%, and the unknown Δ SOC is [20, 100]%. Based on the improved semi-empirical model of Equation (34), the comparison between the improved semi-empirical model and the original fitting curve under six Δ SOC 
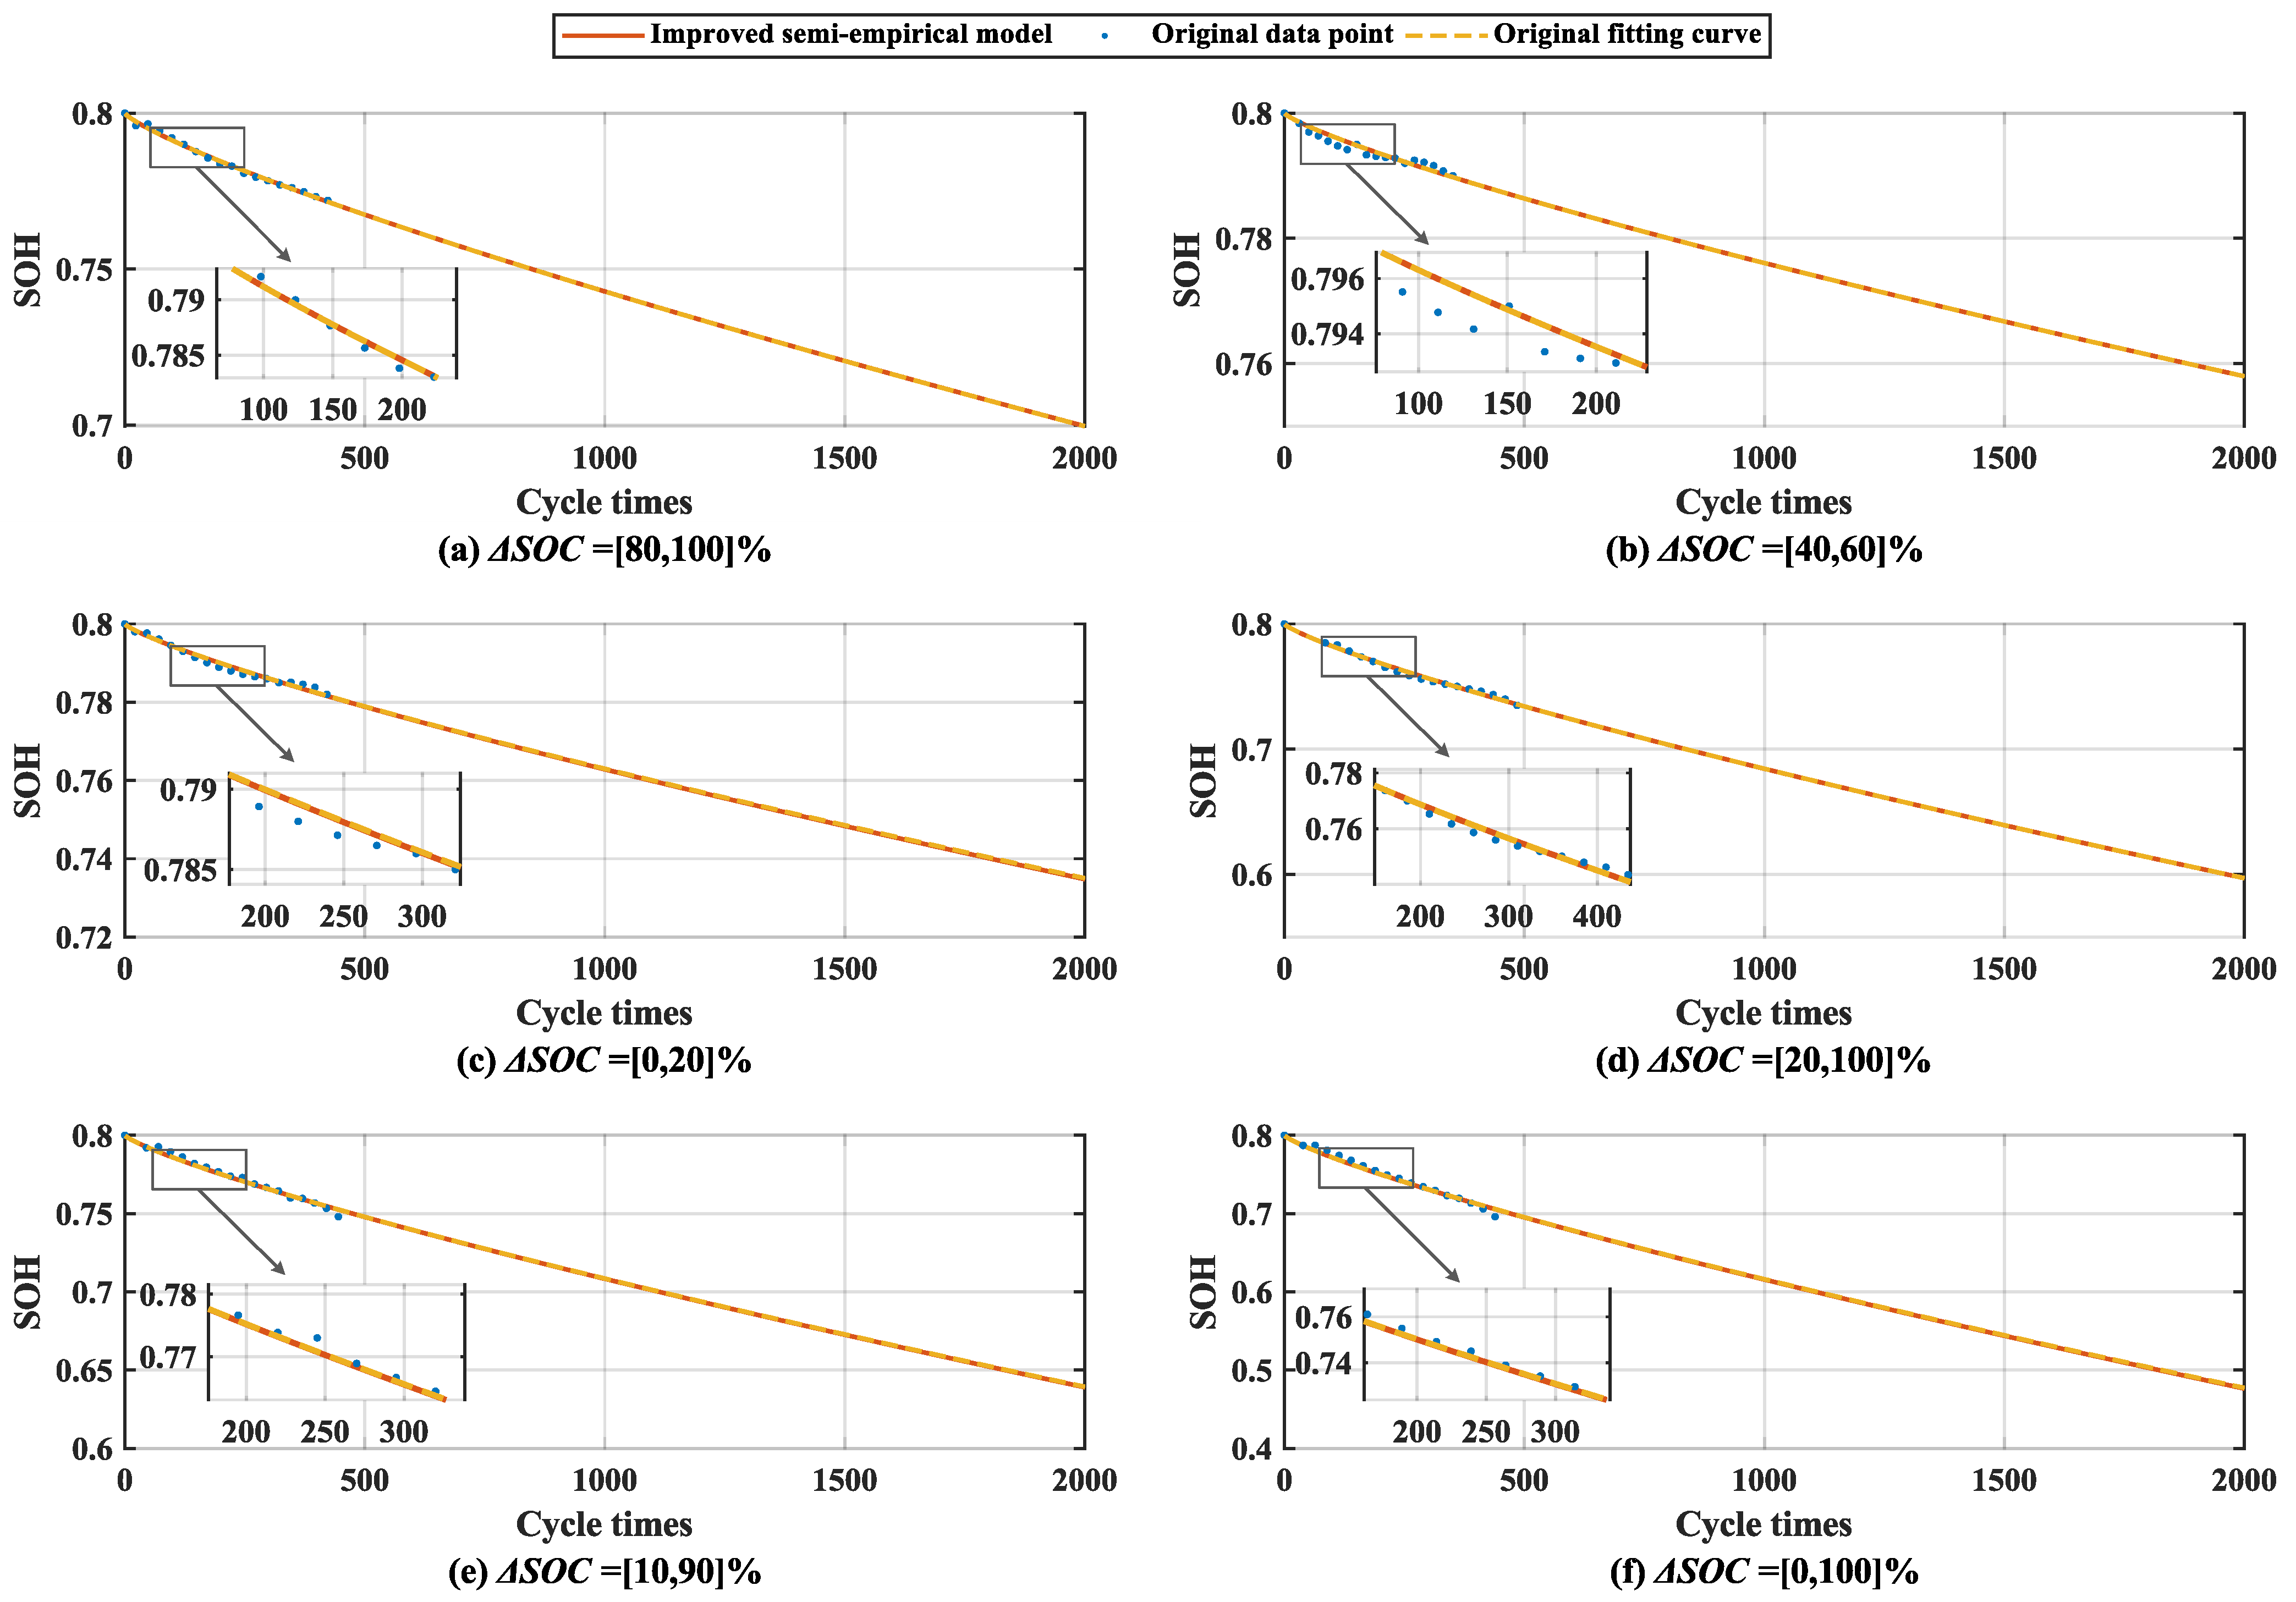
s corresponding to the original data point is shown in the figure below.
In Figure 10d is the fitting result of the unknown Δ SOC , and the Figure 10a–f are the fitting results of the known Δ SOC s. It can be seen that the improved semi-empirical modeling method performs well in both the known Δ SOC s and the unknown Δ SOC , and it maintains a high degree of agreement with the original fitting curve. Similarly, the goodness of fit of the improved semi-empirical models under six working conditions can be calculated as follows.
Combined with the results in Figure 10 and Table 7, we can see that the improved semi-empirical modeling method based on the least square method performs well under various working conditions. For the goodness of fit under all working conditions, R2 is greater than 0.999 and RMSE is less than 1.0 × 10⁻³, indicating that the fitting accuracy of this method to the measured data is very high. In particular, for the unknown Δ SOC , [20, 100]%, it also shows almost as high accuracy as for other conditions. The results indicate that the improved semi-empirical modeling method proposed in this paper can well predict and fit the capacity degradation of retired batteries under various working conditions.

5.4. Comparison of Three Semi-Empirical Modeling Methods

The feasibility of the three semi-empirical modeling methods proposed in this paper is verified above, and the accuracy of the same set of measured data under various methods is calculated at the same time. The following gives a comprehensive comparison of the results of six cases.
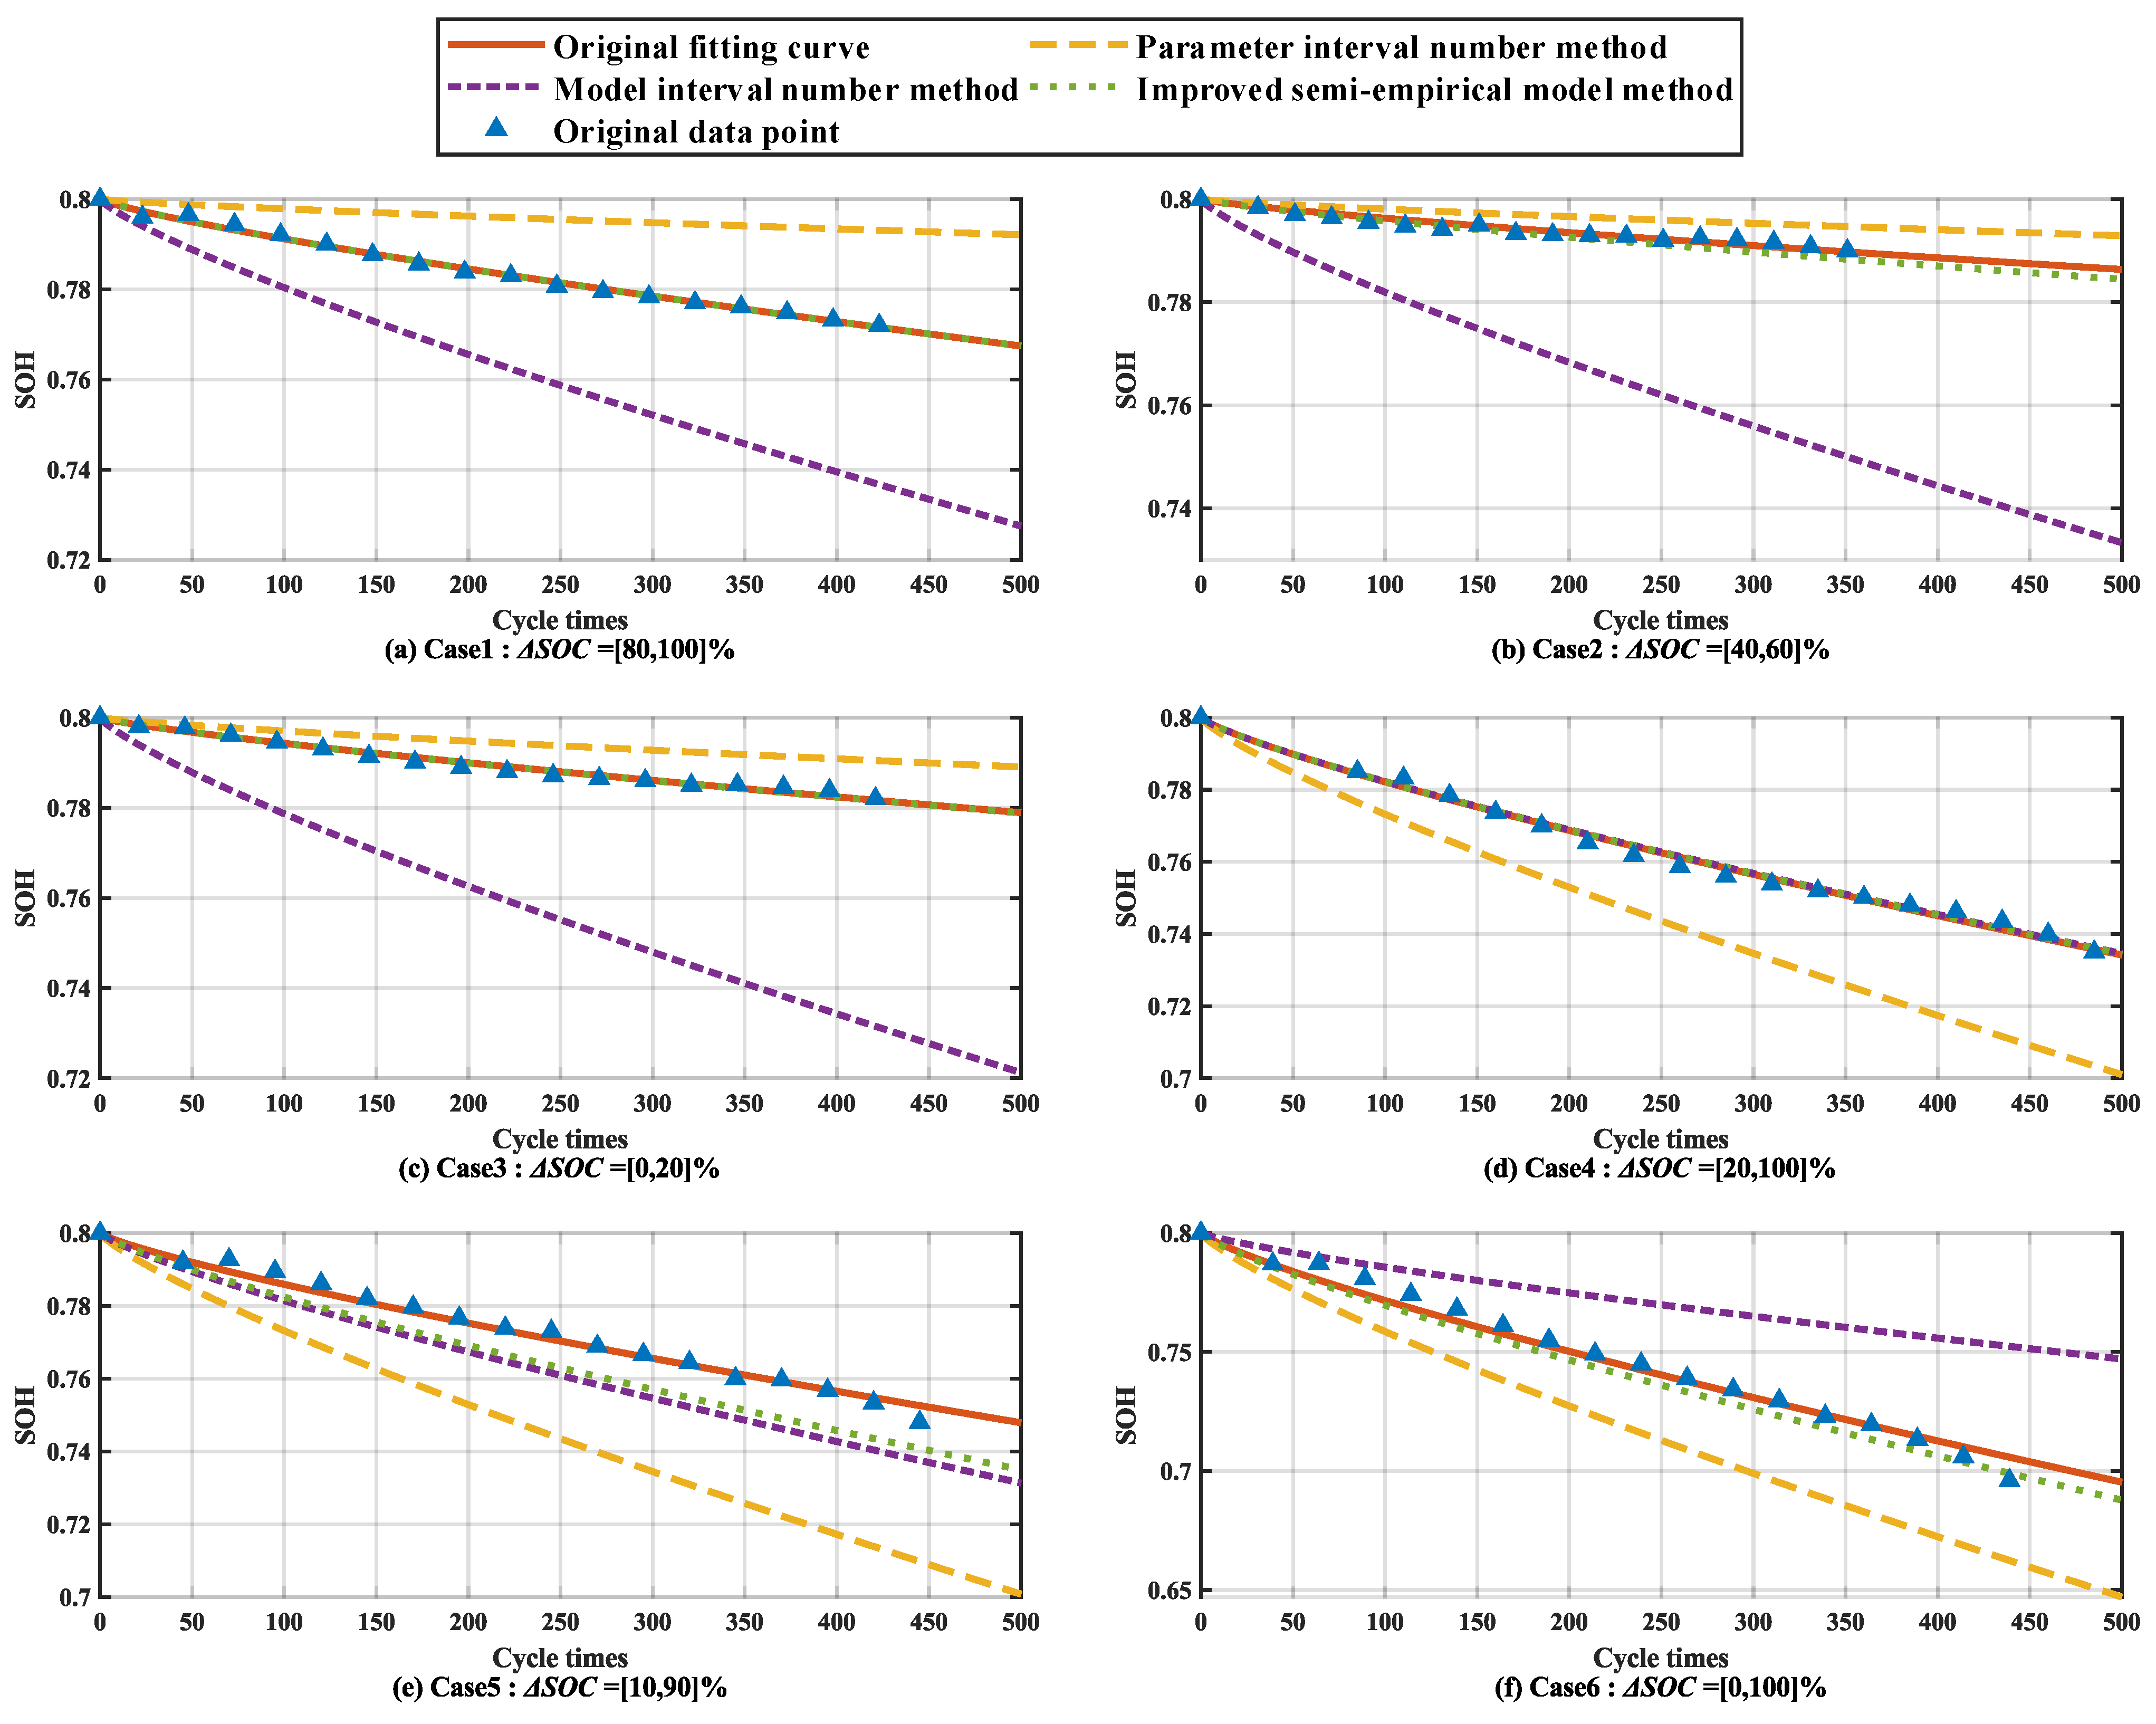
From Figure 11, it can be seen that in the six cases above, the fitting curve obtained by the improved semi-empirical modeling method is closest to the original fitting curve, and the fitting accuracy is higher compared to the two interval number similarity-based semi-empirical modeling methods of parameter and model. Especially for Case 1, Case 3, and Case 4, the improved semi-empirical model performs the same as the original fitting curve. This is because in these three cases, it is known that the Δ SOC includes two sets of cyclic data with the same DOD and different Δ SOC s and the same Δ SOC and different DODs. Under this data premise, the improved semi-empirical modeling method can obtain more accurate fitting models for retired battery capacity degradation under different operating conditions.
The above results can indicate that when the Δ SOC data are relatively comprehensive, the improved semi-empirical model has better accuracy than the interval number method in all cases. To verify the applicability of different methods in data scenarios, the following is a fitting prediction of battery capacity degradation for the above three methods in extreme cases with limited measured data. Thus, the following scenarios in Table 8 are covered.
In the above three scenarios, the measured data are fitted and analyzed based on the three methods proposed in this paper, and the results are as follows: In the above two scenarios, the measured data are fit and analyzed based on the three methods proposed in this article. Among them, due to the limited known data, it is not sufficient to meet the fitting conditions for the aging factor proposed in Equation (16). Therefore, in the improved semi-empirical model below, the optimal polynomial is used to fit the aging factor. The final numerical results of goodness of fit for the two scenarios are shown in the table below.
From the goodness of fit values in Table 9, it can be seen that in both scenarios, the R2 values of the interval number similarity-based semi-empirical modeling method are not all equal to 0. However, the R2 values of the improved semi-empirical modeling method are all equal to 0, and their fitting accuracy is completely inferior to the interval number similarity-based semi-empirical modeling method. Therefore, under the premise that the Δ SOC of the known data is very limited, the method based on interval number similarity has better fitting performance than the method based on improved semi-empirical models. Comparing the two types of methods, it can be found that the method based on interval number similarity has low dependence on data and can perform with high accuracy when known data are limited. For example, the unknown intervals of Scenario 1 and Scenario 2 can be accurately fitted through parameters or modeling methods. The method based on an improved semi-empirical model has high experimental data requirements and requires the calculation of the aging factor based on measured data with the same DOD but different average SOCs. At the same time, the more comprehensive the experimental data, the higher the fitting accuracy and applicability of this method.
To sum up, the three methods have their respective suitable application scenarios: When the Δ SOC is known to be very limited, it is more suitable to use the interval number similarity-based semi-empirical modeling method to approximate the capacity degradation of retired batteries. When the known Δ SOC can cover the unknown Δ SOC more fully, we can choose the model interval number similarity method, and when the known Δ SOC cannot adequately cover the unknown Δ SOC , we can choose the parameter interval number similarity method. When the Δ SOC of the measured data is more comprehensive, that is, two types of measured data with the same average SOC but different DODs and the same DOD but different average SOCs are known, a more accurate retired battery capacity degradation model can be obtained by means of the improved semi-empirical model.

6. Conclusions

The existing retired power battery capacity degradation model makes it difficult to consider the impact of various cycle conditions on battery capacity degradation, especially because there are few studies on retired power battery capacity degradation models involving different Δ SOC s. In addition, due to the long and costly cycle tests of retired batteries, test data for different Δ SOC s are very limited. In view of the inadequacies and data limitations of existing studies, this paper puts forward three semi-empirical modeling methods to obtain the law of capacity degradation of retired batteries under various working conditions. The above content verifies the feasibility and accuracy of the proposed methods in this paper and then summarizes the practical applicability of the three methods according to the advantages and disadvantages of their respective case studies.
  • The method based on model interval number similarity is suitable for situations where the known test data contain limited Δ SOC but the coverage of unknown Δ SOC is relatively comprehensive. In detail, the Δ SOC of the known data contains two types of measured data, the same average SOC but different DODs and the same DOD but different average SOCs. The accuracy of this method is moderate, but it can ensure that the capacity degradation of retired batteries can be predicted within a reasonable range under the circumstances of very limited data. Therefore, in practical application scenarios, this method is suitable for a preliminary assessment of the capacity degradation of retired batteries with unknown Δ SOC ;
  • The method based on parameter interval number similarity is suitable for situations where the known test data contain limited Δ SOC and the coverage of the unknown Δ SOC is not comprehensive enough. In detail, the Δ SOC of the known data contains two types of measured data, the same average SOC but different DODs and the same DOD but different average SOCs. This method has good accuracy and can predict the capacity degradation of retired batteries under various cycle conditions. Therefore, in practical application scenarios, this method is suitable for further evaluation of the capacity degradation of retired batteries with unknown Δ SOC and for estimating the capacity decline of retired batteries under other cycle conditions in the same Δ SOC ;
  • The improved semi-empirical modeling method based on the least square fitting method is suitable for situations where the Δ SOC contained in the known test data is relatively comprehensive. In detail, the Δ SOC of known data would contain both the same average SOC but different DODs and the same DOD but different average SOCs. This method has the highest accuracy and can accurately predict the capacity decline of retired batteries under various cycle conditions. Therefore, in the actual application scenario, this method is suitable for the accurate assessment of the capacity decline of retired batteries in an unknown Δ SOC and has great significance for the cascade utilization analysis of retired batteries.

Author Contributions

Conceptualization, W.X. and J.T.; methodology, W.X., H.C., and J.T.; software, W.X.; validation, W.X. and H.C.; formal analysis, W.X. and X.L.; investigation, H.C. and F.S.; resources, X.L.; data curation, J.W. and J.D.; writing—original draft preparation, W.X. and H.C.; writing—review and editing, X.L. and J.T.; visualization, J.W. and J.D.; supervision, J.T.; project administration, J.T.; funding acquisition, F.S. and J.D. All authors have read and agreed to the published version of the manuscript.

Funding

This work was supported by Science and Technology Project of State Grid Corporation of China, “Research on key technologies for risk assessment of inter-provincial power spot market considering uncertainty of power supply and load” (Project No.: 5108-202355047A-1-1-ZN).

Institutional Review Board Statement

Not applicable.

Informed Consent Statement

Not applicable.

Data Availability Statement

Data are available on reasonable request.

Conflicts of Interest

The authors declare no conflict of interest.

References

  1. Second-Life Electric Vehicle Batteries 2020–2030. Available online: https://www.idtechex.com/en/research-report/second-life-electric-vehicle-batteries-2020-2030/681 (accessed on 5 August 2023).
  2. Battery Recycling to Aid in Reducing Carbon Emissions, Global EV and Energy Storage Battery Recycling Market Forecast to Exceed 1TWh in 2030, Says TrendForce. Available online: https://www.trendforce.com/presscenter/news/20221024-11436.html (accessed on 22 October 2023).
  3. Wei, P.; Abid, M.; Adun, H.; Kemena Awoh, D.; Cai, D.; Zaini, J.H.; Bamisile, O. Progress in Energy Storage Technologies and Methods for Renewable Energy Systems Application. Appl. Sci. 2023, 13, 5626. [Google Scholar] [CrossRef]
  4. Shahjalal, M.; Roy, P.K.; Shams, T.; Fly, A.; Chowdhury, J.I.; Ahmed, M.R.; Liu, K. A Review on Second-Life of Li-Ion Bat-teries: Prospects, Challenges, and Issues. Energy 2022, 241, 122881. [Google Scholar] [CrossRef]
  5. Zhao, Y.; Pohl, O.; Bhatt, A.I.; Collis, G.E.; Mahon, P.J.; Rüther, T.; Hollenkamp, A.F. A Review on Battery Market Trends, Second-Life Reuse, and Recycling. Sustain. Chem. 2021, 2, 167–205. [Google Scholar] [CrossRef]
  6. Haram, M.H.S.M.; Lee, J.W.; Ramasamy, G.; Ngu, E.E.; Thiagarajah, S.P.; Lee, Y.H. Feasibility of Utilising Second Life EV Batteries: Applications, Lifespan, Economics, Environmental Impact, Assessment, and Challenges. Alex. Eng. J. 2021, 60, 4517–4536. [Google Scholar] [CrossRef]
  7. Martinez-Laserna, E.; Gandiaga, I.; Sarasketa-Zabala, E.; Badeda, J.; Stroe, D.-I.; Swierczynski, M.; Goikoetxea, A. Battery Second Life: Hype, Hope or Reality? A Critical Review of the State of the Art. Renew. Sustain. Energy Rev. 2018, 93, 701–718. [Google Scholar] [CrossRef]
  8. Pelletier, S.; Jabali, O.; Laporte, G.; Veneroni, M. Battery Degradation and Behaviour for Electric Vehicles: Review and Numerical Analyses of Several Models. Transp. Res. Part B Methodol. 2017, 103, 158–187. [Google Scholar] [CrossRef]
  9. Xu, B.; Oudalov, A.; Ulbig, A.; Andersson, G.; Kirschen, D.S. Modeling of Lithium-Ion Battery Degradation for Cell Life Assessment. IEEE Trans. Smart Grid 2018, 9, 1131–1140. [Google Scholar] [CrossRef]
  10. Zhang, Q.; White, R.E. Capacity Fade Analysis of a Lithium Ion Cell. J. Power Sources 2008, 179, 793–798. [Google Scholar] [CrossRef]
  11. Uddin, K.; Perera, S.; Widanage, W.D.; Somerville, L.; Marco, J. Characterising Lithium-Ion Battery Degradation through the Identification and Tracking of Electrochemical Battery Model Parameters. Batteries 2016, 2, 13. [Google Scholar] [CrossRef]
  12. Kallel, A.Y.; Petrychenko, V.; Kanoun, O. State-of-Health of Li-Ion Battery Estimation Based on the Efficiency of the Charge Transfer Extracted from Impedance Spectra. Appl. Sci. 2022, 12, 885. [Google Scholar] [CrossRef]
  13. Li, J.; Landers, R.G.; Park, J. A Comprehensive Single-Particle-Degradation Model for Battery State-of-Health Prediction. J. Power Sources 2020, 456, 227950. [Google Scholar] [CrossRef]
  14. Bloom, I.; Cole, B.W.; Sohn, J.J.; Jones, S.A.; Polzin, E.G.; Battaglia, V.S.; Henriksen, G.L.; Motloch, C.; Richardson, R.; Unkelhaeuser, T.; et al. An Accelerated Calendar and Cycle Life Study of Li-Ion Cells. J. Power Sources 2001, 101, 238–247. [Google Scholar] [CrossRef]
  15. Takei, K.; Kumai, K.; Kobayashi, Y.; Miyashiro, H.; Terada, N.; Iwahori, T.; Tanaka, T. Cycle Life Estimation of Lithium Secondary Battery by Extrapolation Method and Accelerated Aging Test. J. Power Sources 2001, 97–98, 697–701. [Google Scholar] [CrossRef]
  16. Ramadass, P.; Haran, B.; White, R.; Popov, B.N. Mathematical Modeling of the Capacity Fade of Li-Ion Cells. J. Power Sources 2003, 123, 230–240. [Google Scholar] [CrossRef]
  17. Thomas, E.V.; Bloom, I.; Christophersen, J.P.; Battaglia, V.S. Statistical Methodology for Predicting the Life of Lithium-Ion Cells via Accelerated Degradation Testing. J. Power Sources 2008, 184, 312–317. [Google Scholar] [CrossRef]
  18. He, W.; Williard, N.; Osterman, M.; Pecht, M. Prognostics of Lithium-Ion Batteries Based on Dempster–Shafer Theory and the Bayesian Monte Carlo Method. J. Power Sources 2011, 196, 10314–10321. [Google Scholar] [CrossRef]
  19. Sarasketa-Zabala, E.; Gandiaga, I.; Martinez-Laserna, E.; Rodriguez-Martinez, L.M.; Villarreal, I. Cycle Ageing Analysis of a LiFePO4/Graphite Cell with Dynamic Model Validations: Towards Realistic Lifetime Predictions. J. Power Sources 2015, 275, 573–587. [Google Scholar] [CrossRef]
  20. Ouyang, D.; Chen, M.; Weng, J.; Wang, J. A Comparative Study on the Degradation Behaviors of Overcharged Lithium-Ion Batteries under Different Ambient Temperatures. Int. J. Energy Res. 2020, 44, 1078–1088. [Google Scholar] [CrossRef]
  21. Wang, H.; Luo, J.; Zhu, G.; Li, Y. Enhanced Whale Optimization Algorithm with Wavelet Decomposition for Lithium Battery Health Estimation in Deep Extreme Learning Machines. Appl. Sci. 2023, 13, 10079. [Google Scholar] [CrossRef]
  22. Gilbert Zequera, R.; Rjabtšikov, V.; Rassõlkin, A.; Vaimann, T.; Kallaste, A. Modeling Battery Energy Storage Systems Based on Remaining Useful Lifetime through Regression Algorithms and Binary Classifiers. Appl. Sci. 2023, 13, 7597. [Google Scholar] [CrossRef]
  23. Wang, D.; Miao, Q.; Pecht, M. Prognostics of Lithium-Ion Batteries Based on Relevance Vectors and a Conditional Three-Parameter Capacity Degradation Model. J. Power Sources 2013, 239, 253–264. [Google Scholar] [CrossRef]
  24. Eddahech, A.; Briat, O.; Bertrand, N.; Delétage, J.-Y.; Vinassa, J.-M. Behavior and State-of-Health Monitoring of Li-Ion Batteries Using Impedance Spectroscopy and Recurrent Neural Networks. Int. J. Electr. Power Energy Syst. 2012, 42, 487–494. [Google Scholar] [CrossRef]
  25. Stamps, A.T.; Holland, C.E.; White, R.E.; Gatzke, E.P. Analysis of Capacity Fade in a Lithium Ion Battery. J. Power Sources 2005, 150, 229–239. [Google Scholar] [CrossRef]
  26. Han, X.; Ouyang, M.; Lu, L.; Li, J. A Comparative Study of Commercial Lithium Ion Battery Cycle Life in Electric Vehicle: Capacity Loss Estimation. J. Power Sources 2014, 268, 658–669. [Google Scholar] [CrossRef]
  27. Liu, K.; Hu, X.; Wei, Z.; Li, Y.; Jiang, Y. Modified Gaussian Process Regression Models for Cyclic Capacity Prediction of Lithium-Ion Batteries. IEEE Trans. Transp. Electrif. 2019, 5, 1225–1236. [Google Scholar] [CrossRef]
  28. Wu, J.; Wang, Y.; Zhang, X.; Chen, Z. A Novel State of Health Estimation Method of Li-Ion Battery Using Group Method of Data Handling. J. Power Sources 2016, 327, 457–464. [Google Scholar] [CrossRef]
  29. IEEE Std 1188-1996; IEEE Recommended Practice for Maintenance, Testing, and Replacement of Valve- Regulated Lead-Acid (VRLA) Batteries for Stationary Applications. IEEE: Piscataway, NJ, USA, 1996; pp. 1–24. [CrossRef]
  30. Battery Recycling Economy Helps Reduce Carbon Emissions, and It Is Estimated That the Scale of Global Power and Energy Storage Battery Recycling Will Exceed That of 1 TWh in 2030. Available online: https://www.trendforce.cn/presscenter/news/20221024-11435.html (accessed on 5 August 2023).
  31. Wang, J.; Liu, P.; Hicks-Garner, J.; Sherman, E.; Soukiazian, S.; Verbrugge, M.; Tataria, H.; Musser, J.; Finamore, P. Cycle-Life Model for Graphite-LiFePO4 Cells. J. Power Sources 2011, 196, 3942–3948. [Google Scholar] [CrossRef]
  32. Zou, Y.L. Modeling and Parameter Estimation of Retired Lithium-Ion Power Battery Based on Capacity, Resistance and the State of Charge. Ph.D. Thesis, Central South University, Changsha, China, 2014. [Google Scholar]
  33. Li, L.F.; Wei, Y.; Gong, D.W.; She, H.T. Research on the Effects of Driving Cycle on Driving Range of Power Battery of Pure Electric Vehicle. Mach. Des. Manuf. 2018, 11, 139–142. [Google Scholar]
  34. Chen, X.; Chen, G.; Chen, F.; Zheng, W.; Xu, W.; Tang, J. An Approximate Method for Retired Battery Capacity Degradation Model Based on Limited Test Data of SOC Ranges. In Proceedings of the 2023 8th Asia Conference on Power and Electrical Engineering (ACPEE), Tianjin, China, 14–16 April 2023. [Google Scholar]
  35. Xu, R. On Similarity Degrees of Interval Numbers. Math. Pract. Theory 2007, 37, 1–8. [Google Scholar] [CrossRef]
  36. Schmalstieg, J.; Käbitz, S.; Ecker, M.; Sauer, D.U. A Holistic Aging Model for Li(NiMnCo)O2 Based 18650 Lithium-Ion Batteries. J. Power Sources 2014, 257, 325–334. [Google Scholar] [CrossRef]
  37. Ecker, M.; Nieto, N.; Käbitz, S.; Schmalstieg, J.; Blanke, H.; Warnecke, A.; Sauer, D.U. Calendar and Cycle Life Study of Li(NiMnCo)O2-Based 18650 Lithium-Ion Batteries. J. Power Sources 2014, 248, 839–851. [Google Scholar] [CrossRef]
  38. Jiang, J.; Shi, W.; Zheng, J.; Zuo, P.; Xiao, J.; Chen, X.; Xu, W.; Zhang, J.-G. Optimized Operating Range for Large-Format LiFePO4/Graphite Batteries. J. Electrochem. Soc. 2013, 161, A336. [Google Scholar] [CrossRef]
  39. Grimaldi, A.; Minuto, F.D.; Perol, A.; Casagrande, S.; Lanzini, A. Ageing and Energy Performance Analysis of a Utility-Scale Lithium-Ion Battery for Power Grid Applications through a Data-Driven Empirical Modelling Approach. J. Energy Storage 2023, 65, 107232. [Google Scholar] [CrossRef]
  40. Giarnetti, S.; Leccese, F.; Caciotta, M. Non Recursive Nonlinear Least Squares for Periodic Signal Fitting. Measurement 2017, 103, 208–216. [Google Scholar] [CrossRef]
  41. Piotrowski, P.; Baczyński, D.; Kopyt, M. Medium-Term Forecasts of Load Profiles in Polish Power System including E-Mobility Development. Energies 2022, 15, 5578. [Google Scholar] [CrossRef]
  42. Yang, Y. Investigation on Cascade Utilization, Capacity Attenuation and Recovery Process of Retired Lithium Power Batteries. Ph.D. Thesis, Hunan University, Changsha, China, 2019. [Google Scholar]
  43. GB/T 31484-2015; Cycle Life Requirements and Test Methods of Power Batteries for Electric Vehicles. China Standard Press: Beijing, China, 2015.
Figure 1. Flow chart of semi-empirical model of capacity degradation of retired batteries based on model interval number similarity.
Applsci 13 11943 g001
Figure 2. Flow chart of improved semi-empirical model fitting method based on data-driven method.
Applsci 13 11943 g002
Figure 3. The experimental data and their fourth-order polynomial fitting curves.
Applsci 13 11943 g003
Figure 4. Use Equation (31) to determine the fitting parameter z for the empirical model in which ln ( Q loss ) ln ( α ) + ( E a R · T ) is plotted as a function of ln(Ah).
Applsci 13 11943 g004
Figure 5. Fitting results obtained from the empirical model under six conditions.
Applsci 13 11943 g005
Figure 6. Interval similarity matrix.
Applsci 13 11943 g006
Figure 7. Comparison of the results of model interval number method and parameter interval number method for six groups of test cases.
Applsci 13 11943 g007
Figure 8. The aging factor varies with the average DOD under different average SOCs.
Applsci 13 11943 g008
Figure 9. Three different Δ SOC s’ battery capacity degradation models under DOD = 20%.
Applsci 13 11943 g009
Figure 10. Comparison between improved semi-empirical model and original fitting model.
Applsci 13 11943 g010
Figure 11. Comparison of three methods under six cases.
Applsci 13 11943 g011
Table 1. Basic parameters of LFP battery samples.
Parameter TypeParameter Value
Battery type18650 LFP battery
Rated capacity (mAh)1600
Actual capacity (mAh)1280 (80%)
Nominal voltage (V)3.70
Charging cutoff voltage (V)4.20 ± 0.05
ShapeCylindrical
Table 2. Experimental condition of Δ SOC .
ConditionDOD (%)Average SOC (%) Δ SOC (%)
Condition 12090100~80
Condition 2205060~40
Condition 3201020~0
Condition 48060100~20
Condition 5805090~10
Condition 610050100~0
Table 3. Fitting parameters and goodness of fit of the empirical model under six working conditions.
ConditionFitting ParametersStatistical Measure
αβγabzR2RMSE
Condition 12.1280 × 10−30.16220.86610.31670.53400.81210.99310.0008
Condition 26.4090 × 10−40.45050.66150.23340.91780.81210.91850.0009
Condition 32.2680 × 10−30.10671.17600.10530.87560.81210.97920.0009
Condition 44.3810 × 10−40.43141.05300.15520.23710.81210.99060.0020
Condition 53.3450 × 10−40.85300.89220.29510.45740.81210.98380.0022
Condition 64.5930 × 10−40.48930.33770.90000.36920.81210.98120.0048
Table 4. Known Δ SOC and unknown Δ SOC s for six sets of test cases.
Case Unknown   Δ SOC (%) Known   Δ SOC s (%)
Case 1[80, 100][40, 60][0, 20][20, 100][10, 90][0, 100]
Case 2[40, 60][80, 100][0, 20][20, 100][10, 90][0, 100]
Case 3[0, 20][80, 100][40, 60][20, 100][10, 90][0, 100]
Case 4[20, 100][80, 100][40, 60][0, 20][10, 90][0, 100]
Case 5[10, 90][80, 100][40, 60][0, 20][20, 100][0, 100]
Case 6[0, 100][80, 100][40, 60][0, 20][20, 100][10, 90]
Table 5. The values of R2 and RMSE between the two interval number similarity-based semi-empirical modeling methods and the measured fitting curves.
CaseParameter Interval Number
Similarity Method
Model Interval Number
Similarity Method
R2RMSER2RMSE
Case 100.046400.0806
Case 20.08960.011100.1088
Case 30.02350.017800.1153
Case 400.07600.99980.0007
Case 500.10470.58160.0287
Case 60.88900.02970.14140.0827
Notes: R2 = 0 means that the fitting effect of the function is worse than the average value.
Table 6. Parameter fitting results of improved semi-empirical model based on the least square method.
Fitting ParametersValueFitting ParametersValue
α4.5750 × 10⁻⁴ SOC 0 37.2600
β0.9595 λ 1 26.0100
γ2.2140 λ 2 0.0103
a0.0355 λ 3 −0.4247
b0.8489 λ 4 −38.9300
z0.8121 λ 5 33.4900
Table 7. The goodness of fit of the improved semi-empirical model.
Δ SOC (%)R2RMSE
[80, 100]1.00001.1353 × 10−5
[40, 60]1.00001.8958 × 10−7
[0, 20]0.99991.6002 × 10−4
[20, 100]1.00003.7004 × 10−5
[10, 90]1.00002.0161 × 10−4
[0, 100]1.00005.5489 × 10−4
Table 8. Scenario combination for a comprehensive comparison of three methods.
Scenario Unknown   Δ SOC (%) Known   Δ SOC (%)
Scenario 1[20, 100][10, 90][0, 100][80, 100][40, 60][0, 20]
Scenario 2[80, 100][40, 60][0, 20][20, 100][10, 90][0, 100]
Table 9. The goodness of fit of three methods in two scenarios with very limited data.
Scenario Unknown   Δ SOC (%)Parameter Interval Number Similarity MethodModel Interval Number Similarity MethodImproved Semi-Empirical Modeling Method
R2RMSER2RMSER2RMSE
Scenario 1[20, 100]00.01210.74720.004500.0185
[10, 90]0.89890.001200.014200.0079
[0, 100]0.89740.001900.013700.0135
Scenario 2[80, 100]00.02130.83220.007500.0249
[40, 60]00.02750.91370.004200.0197
[0, 20]0.84690.011300.032900.0504
Notes: R2 = 0 means that the fitting effect of the function is worse than the average value.
Disclaimer/Publisher’s Note: The statements, opinions and data contained in all publications are solely those of the individual author(s) and contributor(s) and not of MDPI and/or the editor(s). MDPI and/or the editor(s) disclaim responsibility for any injury to people or property resulting from any ideas, methods, instructions or products referred to in the content.

