Abstract
Purpose. This in vitro study compared the vertical marginal discrepancy (MD) and absolute marginal discrepancy (AMD) between the zirconia substructure and titanium (Ti)-base abutment before and after cementation. Material and methods. An intraoral scanner (CEREC Omnicam scanner; Dentsply Sirona) was used to scan the dental model of missing tooth 36 and obtain a three-dimensional virtual model. It was designed and milled for 25 zirconia superstructures (inCoris ZI meso F2 L, Dentsply Sirona). The samples were cemented to Ti bases. The MD and AMD were measured for each sample by using a scanning electron microscope (SEM) before and after cementation. Results. The overall mean values of MD measurements before and after cementation were 14.12 μm and 20.28 μm, respectively. The overall mean values of AMD measurements prior to and after substructure cementation on the Ti base were 54.85 μm and 116.0 μm, respectively. ANOVA revealed significant differences in MD (p = 0.001) and AMD (p < 0.001) before and after cementation. Conclusions. Significant differences were observed in MD and AMD values before and after cementation. The MD and AMD values were significantly lower before cementation than after cementation. The mean MD and AMD values were clinically acceptable.
1. Introduction
Implants have become a common treatment option for missing teeth, especially after reports of the clinical success of osseointegration [1].
One of the reasons for the clinical success of implants is related to the marginal gap between the restoration and the implant abutment, which is considered an important factor in prosthodontics [2]. Poor internal fit can lead to a thicker cement layer, which may influence the stability of dental restoration and lead to bacterial penetration along the implant abutment [3,4].
Studies have shown that an accumulation of bacterial plaque on the margins of the restoration and between the parts of the implant may contribute to bacterial colonization on the abutment interface [5] This may lead to chronic inflammatory infiltrates, increased marginal bone loss, and implant failure in advanced cases [6]. Therefore, the marginal abutment-prosthetic misfit is an important issue in implant rehabilitation.
The term "fit" has been mentioned abundantly in the literature. The different sites between the restoration and the tooth or implant abutment can be defined as internal gap, marginal gap, vertical gap, horizontal gap, etc. [3].
Holmes et al. defined two terms in his study: the marginal discrepancy (MD) and the absolute marginal discrepancy (AMD), which are meaningful factors in the present study [3]. The MD or the vertical value is measured from the cervical margin of the casting to the preparation margin, while the AMD is measured from the cavosurface of the preparation to the cervical margin of the cast. It is defined as the angular combination of the MD and the extension error (Figure 1) [3,4].
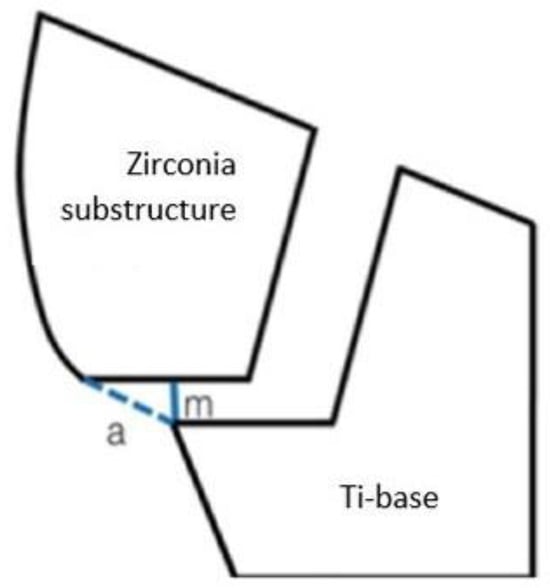
Figure 1.
The differences between the terms, m (MD), a (AMD).
The closeness of the clearance between an implant abutment and the prosthesis indicates the precision of fit. The MD represents the cemented surface which can be dissolved as result of exposure to the oral environment, while the AMD increases plaque accumulation [4]. Therefore, the main goal is to minimize the two marginal misfits, MD and AMD, and decrease bacterial colonization while keeping the surface clean and without roughness due to residual cement.
There is no consensus regarding a clinically acceptable misfit. Several studies examined the MD value between CAD/CAM manufacturing and preparation. They reported that the MD of CAD/CAM systems ranged from 50 μm to 100 μm and a 90 μm MD was clinically acceptable [4,7,8,9,10]. The MD values were measured using light microscopy, a scanning electron microscope (SEM), and epoxy replicas [4,8,9,10].
Some studies have shown that a CAD/CAM implant fit is superior to that of conventional cast frameworks [11], although a few in vitro studies showed lower values of misfit for the conventional method than those of CAD/CAM systems [11]. Bayramoğlu et al. compared the marginal fit between metal ceramic, press on metal, and zirconia restorations. He found that mean MD measurements for press on metal ceramic restoration (81.6 μm ± 18.3 μm) were lower than mean values (98.2 μm ± 34.6 μm) in CAD/CAM zirconia restorations [12]. In a study by Zaghloul et al., the CAD/CAM group had significantly higher MD mean values (80.58 μm) than the coping milling (Zirkonzahn) and base metal alloy groups (50.33 μm and 42.27 μm), respectively [13]. These results support the study by Kapos and Evans, who reported that crowns and abutments fabricated by CAD/CAM demonstrate similar survival rates as conventionally fabricated prostheses [14].
In an integrative review, the clinically acceptable vertical abutment prosthetic misfit in implant-supported prostheses, which is more relevant to the current study, ranged from 50 to 160 μm [15]. Although 100 μm is considered an acceptable mean value for vertical misfit, many studies included in the review reported lower mean values. Furthermore, CAD/CAM techniques resulted in lower mean vertical misfit values (less than 120 μm) compared to the casting technique in this study [15].
CAD/CAM technology specializes in a higher precision, greater standardization, and cost reductions. The ability to manufacture smaller thicknesses and a more conservative dental preparation would decrease the MD value and have less bacterial infiltration and biomechanical problems, although there are few studies regarding CAD/CAM custom abutment, especially using titanium (Ti)-bases [16].
A Ti base serves as a bonding base for customized implant-supported restoration with a high precision and excellent esthetic results. Few clinical studies examined the MD values between implant-supported prostheses and Ti bases. Ti bases can be employed as an alternative to conventional approaches for restoring dental implants, but long-term clinical studies are required for better assessment [17].
Six methods for measuring the MD have been described in the literature. The cross-sectioning method allows clear observation of the MD in the vertical and horizontal planes but does not allow for a long-term analysis and comparison of results obtained during different fabrication stages of the same specimen [2].
The epoxy replica method is also used to examine MD values. It should be noted that the procedures required for fabricating the test specimens (impression making, pouring replicas) may involve some errors, such as difficulty in identifying the crown margins and finishing lines [18,19]
The profile projector, on the other hand, presents views of the die and the specimen in the same focal plane on a computer monitor for an accurate focus. Though, with this method, the thickness of the cement layer at the marginal areas can only be indirectly inferred [19].
The digimatic micrometer and microcomputed tomography methods are not used often due to technical difficulties [2].
The direct microscopy, cross-sectioning, and replica methods are used most often for evaluating the MD. Although direct microscopy has a low accuracy and it is difficult to select measurement points, it is the most straightforward, takes minimal time, and is less expensive than other methods [2].
Numerous studies have examined the MD of crowns fabricated using conventional techniques, but a lack of evidence-based studies regarding misfit between implant-supported prostheses fabricated by CAD/CAM and Ti-base abutment led us to examine them in this study.
Consequently, the purpose of this in vitro study was to evaluate the MD (Figure 2) and the AMD (Figure 3) between the substructures of zirconia crowns (CAD/CAM) and Ti-base abutments before and after cementation, using SEM at ×500 magnification.
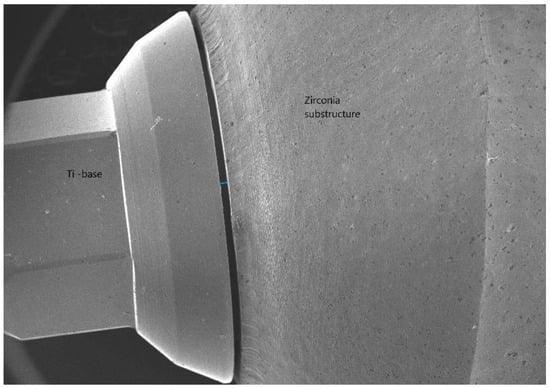
Figure 2.
The MD (marginal discrepancy).
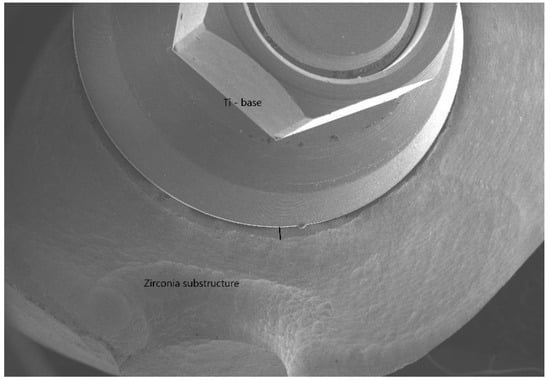
Figure 3.
The AMD (absolute marginal discrepancy).
The null hypothesis was no differences would be found in the marginal misfit measured before and after cementation.
2. Materials and Methods
A gypsum dental model type 1 with missing tooth #36 and the antagonist dental model were prepared for the study.
An implant analog (standard platform, MIS) was embedded in the agonist model, replacing the missing tooth #36. A gingival mask was used to ensure the emergence profile was optimally contoured.
The scan post (standard, Sirona) was inserted on an implant analog and tightened to 30 Ncm using the manufacturer’s torque driver (short driver for 0.05-inch hex, MIS), followed by screwing the scan body (Sirona) on it.
The model and the antagonist were scanned using an intraoral scanner (CEREC Omnicam Scanner; Dentsply Sirona, CEREC SW 4.6.1). This was converted to a 3-dimensional (3D) virtual model (CEREC AC software 4.6.1; Dentsply Sirona). This substructure was chosen instead of zirconia crown design to match the height settings of the SEM imaging JSM-IT100. The zirconia substructure design and the finish line marking of the model for 25 meso blocks (inCoris ZI meso F2 L, Dentsply Sirona) were planned using CEREC AC software 4.1.
The CAD/CAM parameters of zirconia substructure were shoulder width 100 μm, telescope angle 7, radial minimum thickness 500 μm, and occlusal minimum thickness 500 μm.
A milling unit (CEREC MC XL; Dentsply Sirona) was used for CAM processing of the designed zirconia substructure. Milling of each sample from meso blocks was completed in approximately 17 min. At the end of milling, the system transferred the restoration details to SpeedFire for the firing cycle by sintering for 50 min in a furnace (CEREC SpeedFire; Dentsply Sirona).
The surface of the zirconia substructures was polished with HP polishers (CEREC KIT2 HP polishers, EVE Diacera). Each sample was connected to a Ti-base abutment (Z 3.5 MIS Implant Technologies). The notch in the buccal side of the samples matched the concavity in the Ti base.
Specific landmarks were traced with an indelible pen on the axial surfaces of the 3 aspects of each sample using SEM imaging JSM-IT100 to standardize the SEM analysis at completion (Figure 4).
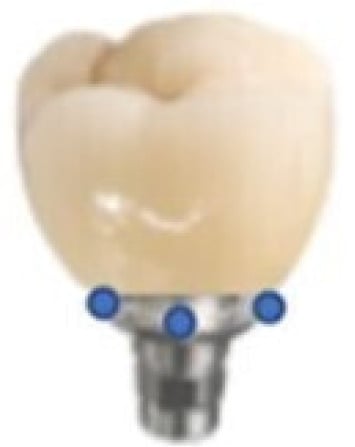
Figure 4.
The three blue dots represent landmarks of the three aspects that were scanned for each sample before and after cementation to provide consistent results.
The 25 samples were not sectioned and scanned with SEM imaging (JSM-IT100). For image mapping, the secondary electron imaging mode (SE) for scanning was used in this study. The operating conditions in this study were: beam energy 5 kV, working distance 15–20 mm, height 15 mm, and magnification ×500. SE was used to produce a topographic SEM image from the surface. SE images have a high resolution that are independent of the material and are acquired from inelastically scattered electrons close to the surface. The MD and the AMD were measured in 3 aspects of each sample under ×500 magnification (Figure 5, Figure 6 and Figure 7). This high magnifying power was chosen since it provides a high degree of resolution that leads to precise measurements of the MD values between the parts. The MD average was obtained by measuring 10 points of each aspect per sample that represented the marginal misfit. The 10 measurements were calculated to one single value representing the MD. The AMD value was measured according to the cosine formula by using a ruler for evaluating the angle and MD value at the edge of each aspect per sample. The average of AMD was also calculated according to the cosine formula by combining the angle that was already measured for each AMD and the MD average obtained from each aspect .
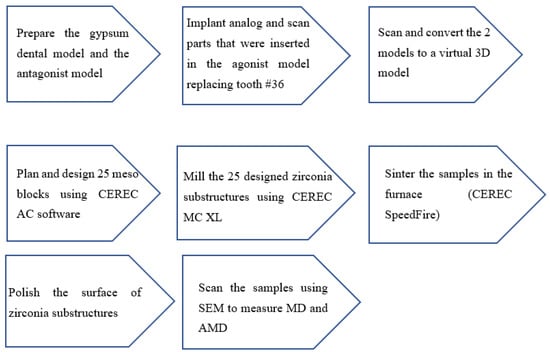
Figure 5.
Steps in preparing the models and samples.
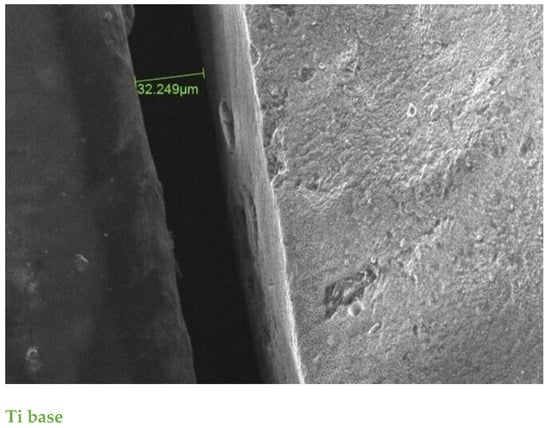
Figure 6.
SE scanning mode ×500 magnification. The MD of aspect between restoration and Ti base before cementation was 32.2 μm; one of the highest values before cementation in the study.
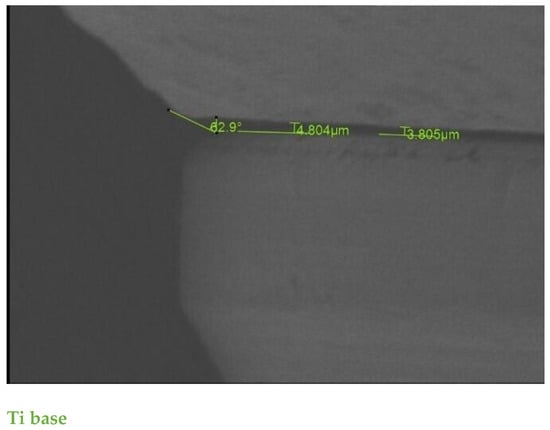
Figure 7.
SE scanning mode ×500 magnification. The AMD was measured using a combination of the angular MD and extension error at the edge of the aspect. The MD values in this aspect were the lowest.The green color numbers represent the gap between the two parts The first number is AMD the unit is-angle.The second two numbers are MD the unit is micron.
The average MD was obtained with 10 SEM measurements of each aspect. The average AMD was measured by combining the extension error and the average MD.
2.1. Cementation Protocol
The 25 substructures were cemented using self-curing luting composite (Multilink hybrid abutment cement, Ivoclar) according to the cementation protocol (Figure 8).
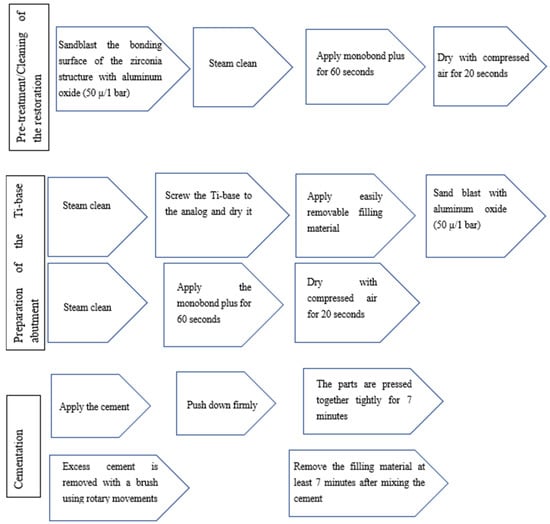
Figure 8.
Steps of the cementation protocol of the Ti base.
The parts were pressed tightly together using finger pressure [4].
The cementation joint was carefully polished using HP polishes.
The MD and AMD from the 3 aspects of each sample were examined and remeasured after cementation.
2.2. Statistical Analysis
The sample size of the current study was 25, according to statistician recommendations. Post hoc power calculation showed that a sample size of at least 25 was needed to have a power of at least 0.876. The mean values of MD, AMD, and average AMD from 3 aspects were calculated before and after cementation.
As result, these values were measured in 75 areas in total which provide more accurate mean values with greater precision. An MD sample power of MD (0.876) was calculated by comparing 25 paired samples. The correlation between them was 0.5.
Square root transformation was used for normally distributed variables. Paired t-test was used to compare the difference between MD before and after cementation for all samples (mean values from 3 aspects for each sample).
Data are presented as mean ± standard deviation (SD).
ANOVA with repeated measures within subject factors was calculated before and after cementation and aspects to test the differences between aspects, the interaction between aspects, and the MD before and after cementation for the 25 samples. p < 0.05 was considered significant.
3. Results
The overall mean ± SD of the MD was significantly smaller (14.12 ± 6.26 μm) before cementation than after (20.28 ± 13.56 μm; p = 0.001). The 95% confidence interval for MD before cementation ranged from 5.29 μm for the lower bound to 28.37 μm for the upper bound. After cementation, the lower bound was 8.56 μm and the upper bound was 71.28 μm (Table 1).

Table 1.
Summary of overall mean of all parameters before and after cementation (μm). The mean values of all parameters were larger after cementation.
No significant differences were found between the aspects (p = 0.320) and no interaction between them (p = 0.575) (Table 2, Figure 9).
Table 2.
Mean values (μm) and standard deviation of MD before and after cementation from 3 aspects. The mean MD values from the 3 aspects were smaller before cementation than after cementation.
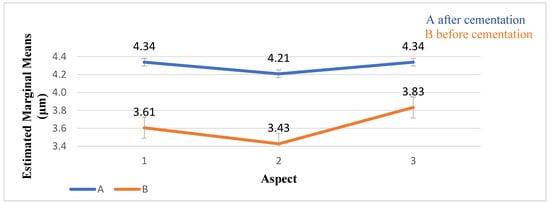
Figure 9.
The distribution of the MD values (μm) and standard deviation before and after cementation. The MD values of the 3 aspects were lower before cementation than after.
The overall mean value of the AMD before cementation was 54.85 ± 35.85 μm, whereas the AMD after cementation was 116.0 ± 77.07 μm (p < 0.001). No significant differences were found between the aspects (p = 0.193) and the interaction (p = 0.162) (Table 3, Figure 10).
Table 3.
The mean values (μm) and standard deviation of AMD before and after cementation from 3 aspects. The AMD after cementation from aspect 1 was the highest of all AMD values before and after cementation.
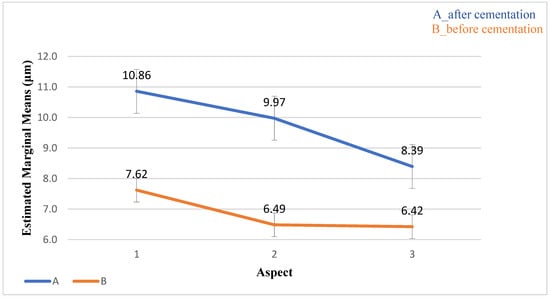
Figure 10.
The distribution of the AMD values (μm) and standard deviation before and after cementation. The AMD value after cementation from aspect 1 was the largest.
The average AMD before cementation was smaller than after cementation (p < 0.001). No significant differences were found between the three aspects (p = 0.504) or the interaction between aspects (p = 0.063) (Table 4, Figure 11).
Table 4.
The mean values (μm) and standard deviation of the average AMD before and after cementation for 3 aspects. The average of AMD before cementation from aspect 2 was the lowest.
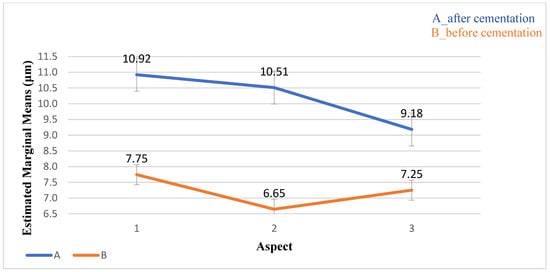
Figure 11.
The distribution of the average AMD values (μm) and standard deviation before and after cementation. The values before cementation were lower than those after cementation.
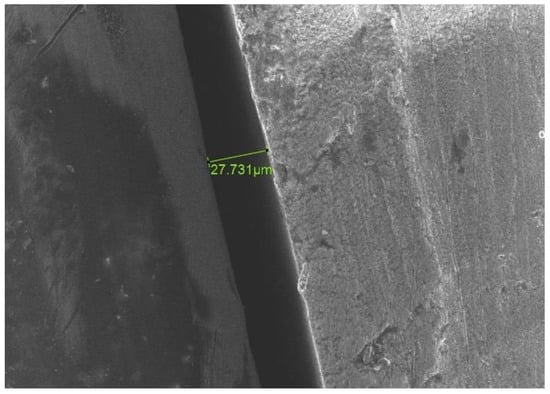
Figure 12.
SE scanning mode ×500 magnification. An increase in the values of MD after cementation in comparison to primary values before cementation for the same aspect. (Before cementation). The green color numbers represent the gap between the two parts.
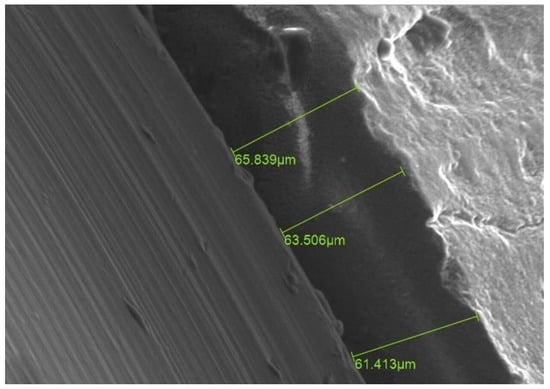
Figure 13.
SE scanning mode ×500 magnification. An increase in the values of MD after cementation in comparison to primary values before cementation for the same aspect. (After cementation). The green color numbers represent the gap between the two parts.
No differences or interactions were found between the three aspects (p > 0.05).
4. Discussion
This study compared the MD and AMD values of samples before and after cementation. The values of MD and AMD were significantly higher (p < 0.05) after cementation compared with the values before cementation. Therefore, the null hypothesis of no difference was rejected.
Previous studies have reported similar results. Martinez-Rus et al. concluded that the mean MD values of different types of crown systems cemented on Ti and zirconia implant abutments, which were measured using SEM, showed an increase ranging from 38.34 μm to 46.58 μm after cementation [18] Even using different types of cement did not change the outcomes. Okutan et al. used two groups of cements and ceramic crowns and reported that mean MD values were significantly lower before cementation (32.7 ± 6.8 μm and 33 ± 6.7 μm, respectively), compared to after cementation (44.6 ±6.7 μm and 46.6 ± 7.7 μm, respectively) [20]. Using a measuring microscope, Borges et al. found higher MD values after cementation for three ceramic systems and two different cements. The mean MD value before cementation was 82.87 ± 20.74 μm, whereas it was 121.0 ± 35.09 μm after cementation [21].
Valente et al. found that the MD of metal-ceramic and In-Ceram implant-supported crowns before cementation were (52.65 ± 11.83 μm and 85.73 ± 14.06 μm, respectively), smaller than after cementation (66.80 ± 15.86 and 89.36 ± 22.66 μm, respectively) [22].
Another study supported these results among teeth and implant crowns. The mean MD of all test groups before cementation was 45.7 μm for teeth crowns and 15.17 μm for implant crowns. A significant increase in the MD was found after cementation within the experimental tooth–implant-supported fixed dental prostheses (implants, 11.7–18.7 μm and teeth, 13.4–24.2 μm) [23].
Although there is no consensus among researchers regarding the definitions of marginal fit and measurement methods, several studies considered the MD values that McLean and von Fraunhofer defined as the standard acceptable misfit [24]. They observed in their in vivo study of more than 1000 crowns that MD values less than 120 μm between teeth preparation and crowns fabricated by conventional casting techniques were more likely to be successful.
Most studies considered the prosthetic-abutment MD to be clinically acceptable around 100 μm in casting techniques; although, some authors showed acceptable values ranging from 50 to 160 μm [15]. However, the current study used CAD/CAM for fabrication and exhibited clinically acceptable MD values, with no MD measurement greater than 100 μm reported for this system. According to a systematic review, the MD values of implant-supported prostheses using CAD/CAM showed MD values smaller than 110 μm [11].
The few studies that examined AMD values were not related to implants but reported clinically acceptable values similar to those in the present study. An in vitro study evaluated the AMD of ceramic crowns fabricated using conventional and digital methods and measured the values using three-dimensional scanning. The AMD of the ceramic crowns fabricated using conventional methods and digital techniques were 115 ± 15.2 μm and 110 ± 14.3 μm, respectively [25]. Another in vitro study showed that the AMD value achieved for the four zirconia-based ceramic crown systems analyzed was within the range of clinical acceptance (120 μm) [26].
The mean AMD values reported in the current study before and after cementation were smaller than 120 μm. Since the AMD is the angular combination of the MD and the extension error, the MD values were smaller than the AMD values, as was expected [3].
Similar results were concluded by Prasad et al. They exhibited differences in the MD of implant superstructures ranging from 13.21 to 75.26 μm for the CAD/CAM groups and 64.89 to 115.27 μm for the group that was conventionally cast [27].
In addition, the use of Ti-base abutments may affect the MD values and can successfully support single zirconia crowns. According to a retrospective study, 118 patients who received CAD/CAM-milled bilayer and monolithic zirconia crowns using implants and Ti-base abutments with up to 5 years of follow-up were not diagnosed with peri-implantitis [28]. Another study revealed that Ti-base abutments did not have a negative effect on the peri-implant soft and hard tissue parameters [29]. Therefore, Ti bases have a similar stability and mechanical behavior as Ti abutments, which is still considered the “gold standard” for implant-supported single reconstructions [30].
Although several studies showed no superiority when using Ti bases in implant-supported prostheses, one study showed that the peri-implant tissues responded to Ti-base abutments in a similar manner to one-piece abutments over a 5 year period [31]. Another study showed no significant differences in human marginal bone levels between the Ti base and one-piece abutments at any of the follow-ups [32]. No definitive conclusion can be drawn based on these studies due to the low power and short follow-up periods.
A few studies that examined MD values did not support the results found in the present study. They reported that cementation did not cause a significant increase in MD values. One study revealed no significant differences in MD values before and after cementation for the analyzed groups with MD values below 120 μm [33]. This may be because they compared the MD values of fixed dental prostheses (FDP) under a stereomicroscope at ×15 magnification. Whereas in this study, the MD values between restoration and implant abutment were examined. A two-dimensional SEM was used to measure the MD values under ×500 magnification by one clinician who performed the scanning, determined the finish line, and the zirconia restoration.
The CAD/CAM system was used because it is an advanced three-dimensional technology which reduces manual intervention and leads to more accurate manufacturing variations and fitting restorations in implants, which may lead to increased implant survival [34]. Additionally, the system has the potential to conserve materials and has an advantage in fabricating complex geometries, although limited evidence is available regarding applying CAD/CAM technologies in implant restorations [35]. As a result, three points of three aspects of each sample were marked in this study to ensure the same surfaces were scanned before and after cementation to provide more accurate results and to evaluate the differences between the three aspects. Due to the accuracy of the CAD/CAM system, no differences were found between the three aspects. However, the mean MD values before cementation were not close to zero because a certain degree of inaccuracy is inevitable even with CAD/CAM, which also depends on the clinician’s expertise and on the equipment used [15].
In the current study, zirconia was chosen as the material for CAD/CAM restoration since its use has become increasingly widespread because of its excellent unique combination of high flexural strength and fracture toughness to resist deformation under contraction forces [36]. Nevertheless, several studies reported similar mechanical stabilities between zirconia meso-abutments bonded to Ti in comparison to customized Ti abutments. In addition, various types of ceramic crown material, including zirconia, showed good stability when used in the monolithic state, without significant differences [30].
Ti base and crown surfaces should be treated mechanically and/or chemically to increase stability. Mechanical treatment of the Ti surface increased the stability and retention forces of the bonding interface between the Ti-base abutments and the crown. The success of the Ti-base abutment concept may depend on the stability of the bonding interface between the Ti base and the ceramic components. For chemical treatment, Monobond Plus appears to be the superior primer among the materials tested for treating Ti bases when using MultiLink hybrid abutment cement [37]. Nonetheless, the film thickness of multilink hybrid abutment cement is 0.15–3 μm, according to manufacturer’s instructions, which may have a negative effect. Additionally, the misfit between components is worse after cementation [4]. Valente et al. also concluded that the cementing procedure affects the marginal adaptation of crowns [22].
Another factor that may have affected the MD values was the finger pressure method. In the present study, the parts were pressed tightly together using finger pressure. As a result, the variability of force exerted on the samples must be considered as a factor that might affect the marginal fit values in the cementation procedure [4,38].
The current study supports the implementation of CAD/CAM systems in the restorative phase to reduce MD and AMD and improve the stability and accuracy of the implant-supported restoration, and the soft tissue’s reaction to the Ti base and the crown connection.
Additional in vitro and long-term clinical studies are needed to support the results obtained regarding the clinical performance of CAD/CAM restorations and Ti-base abutments.
5. Conclusions
Within the limitations of the present study, the following conclusions were drawn:
- The MD and AMD values before cementation were smaller than after cementation.
- The mean MD and AMD values obtained were clinically acceptable.
- The CAD/CAM system is an advanced three-dimensional technology which reduces manual intervention and leads to more accurate manufacturing and fitting restoration.
Author Contributions
Conceptualization, Z.O. and K.A.-R.; methodology, E.D.; validation, Z.O., K.A.-R. and E.D.; formal analysis, A.B.; writing—original draft preparation, K.A.-R.; writing—review and editing, Z.O.; supervision, E.D. All authors have read and agreed to the published version of the manuscript.
Funding
This research received no external funding.
Data Availability Statement
The data presented in this study are available on request from the corresponding author.
Conflicts of Interest
The authors declare no conflict of interests.
References
- Al-Quran, F.A.; Al-Ghalayini, R.F.; Al-Zu’bi, B.N. Single-tooth replacement: Factors affecting different prosthetic treatment modalities. BMC Oral Health 2011, 11, 34. [Google Scholar] [CrossRef]
- Pasali, B.; Sarac, D.; Kaleli, N.; Sarac, Y.S. Evaluation of marginal fit of single implant-supported metal-ceramic crowns prepared by using presintered metal blocks. J. Prosthet. Dent. 2018, 119, 257–262. [Google Scholar] [CrossRef] [PubMed]
- Holmes, J.R.; Bayne, S.C.; Holland, G.A.; Sulik, W.D. Considerations in measurement of marginal fit. J. Prosthet. Dent. 1989, 62, 405–408. [Google Scholar] [CrossRef] [PubMed]
- Meirowitz, A.; Bitterman, Y.; Levy, S.; Mijiritsky, E.; Dolev, E. An in vitro evaluation of marginal fit zirconia crowns fabricated by a CAD-CAM dental laboratory and a milling center. BMC Oral Health 2019, 19, 103. [Google Scholar] [CrossRef] [PubMed]
- Hao, Y.; Huang, X.; Zhou, X.; Li, M.; Ren, B.; Peng, X.; Cheng, L. Influence of dental prosthesis and restorative materials interface on oral biofilms. Int. J. Mol. Sci. 2018, 19, 3157. [Google Scholar] [CrossRef]
- Koutouzis, T.; Wallet, S.; Calderon, N.; Lundgren, T. Bacterial colonization of the implant-abutment interface using an in vitro dynamic loading model. J. Periodontol. 2011, 82, 613–618. [Google Scholar] [CrossRef]
- Akbar, J.H.; Petrie, C.S.; Walker, M.P.; Williams, K.; Eick, J.D. Marginal adaptation of Cerec 3 CAD/CAM composite crowns using two different finish line preparation designs. J. Prosthodont. 2006, 15, 155–163. [Google Scholar] [CrossRef]
- Att, W.; Komine, F.; Gerds, T.; Strub, J.R. Marginal adaptation of three different zirconium dioxide three-unit fixed dental prostheses. J. Prosthet. Dent. 2009, 101, 239–247. [Google Scholar] [CrossRef]
- Ural, C.; Burgaz, Y.; Saraç, D. In vitro evaluation of marginal adaptation in five ceramic restoration fabricating techniques. Quintessence Int. 2010, 41, 585–590. [Google Scholar]
- Baig, M.R.; Tan, K.B.; Nicholls, J.I. Evaluation of the marginal fit of a zirconia ceramic computer-aided machined (CAM) crown system. J. Prosthet. Dent. 2010, 104, 216–227. [Google Scholar] [CrossRef]
- Mello, C.C.; Lemos, C.A.A.; de Luna Gomes, J.M.; Verri, F.R.; Pellizzer, E.P. CAD/CAM vs conventional technique for fabrication of implant-supported frameworks: A systematic review and meta-analysis of in vitro studies. Int. J. Prosthodont. 2019, 32, 182–192. [Google Scholar] [CrossRef]
- Bayramoğlu, E.; Özkan, Y.K.; Yildiz, C. Comparison of marginal and internal fit of press-on-metal and conventional ceramic systems for three- and four-unit implant-supported partial fixed dental prostheses: An in vitro study. J. Prosthet. Dent. 2015, 114, 52–58. [Google Scholar] [CrossRef] [PubMed]
- Zaghloul, H.H.; Younis, J.F. Marginal fit of implant-supported all-ceramic zirconia frameworks. J. Oral Implantol. 2013, 39, 417–424. [Google Scholar] [CrossRef] [PubMed]
- Kapos, T.; Evans, C. CAD/CAM technology for implant abutments, crowns, and superstructures. Int. J. Oral Maxillofac. Implants 2014, 29, 117–136. [Google Scholar] [CrossRef]
- Pereira, L.M.S.; Sordi, M.B.; Magini, R.S.; Calazans Duarte, A.R.; Souza, J.C.M. Abutment misfit in implant-supported prostheses manufactured by casting technique: An integrative review. Eur. J. Dent. 2017, 11, 553–558. [Google Scholar] [CrossRef] [PubMed]
- Scaminaci Russo, D.; Cinelli, F.; Sarti, C.; Giachetti, L. Adhesion to Zirconia: A Systematic Review of Current Conditioning Methods and Bonding Materials. Dent. J. 2019, 7, 74. [Google Scholar] [CrossRef] [PubMed]
- Al-Thobity, A.M. Titanium Base Abutments in Implant Prosthodontics: A Literature Review. Eur. J. Dent. 2022, 16, 49–55. [Google Scholar] [CrossRef] [PubMed]
- Martinez-Rus, F.; Ferreiroa, A.; Ozcan, M.; Pradies, G. Marginal discrepancy of monolithic and veneered all-ceramic crowns on titanium and zirconia implant abutments before and after adhesive cementation: A scanning electron microscopy analysis. Int. J. Oral Maxillofac. Implants 2013, 28, 480–487. [Google Scholar] [CrossRef] [PubMed]
- Nawafleh, N.A.; Mack, F.; Evans, J.; Mackay, J.; Hatamleh, M.M. Accuracy and reliability of methods to measure marginal adaptation of crowns and FDPs: A literature review. J. Prosthodont. 2013, 22, 419–428. [Google Scholar] [CrossRef]
- Okutan, M.; Heydecke, G.; Butz, F.; Strub, J.R. Fracture load and marginal fit of shrinkage-free ZrSiO4 all-ceramic crowns after chewing simulation. J. Oral Rehabil. 2006, 33, 827–832. [Google Scholar] [CrossRef]
- Borges, G.A.; Faria, J.S.; Agarwal, P.; Spohr, A.M.; Correr-Sobrinho, L.; Miranzi, B.A. In vitro marginal fit of three all-ceramic crown systems before and after cementation. Oper. Dent. 2012, 37, 641–649. [Google Scholar] [CrossRef] [PubMed]
- Valente, V.S.; Francischone, C.E.; Júnior, F.C.; Silva, A.M.; Ribeiro, I.S.; Bandéca, M.C.; Tonetto, M.R.; de Jesus Tavarez, R.R. Marginal Fit Metal-Ceramic and In-Ceram Single Crown Cement retained in Implant-supported Abutments. J. Contemp. Dent. Pract. 2016, 17, 969–972. [Google Scholar] [PubMed]
- Boeckler, A.F.; Morton, D.; Kraemer, S.; Geiss-Gerstdorfer, J.; Setz, J.M. Marginal accuracy of combined tooth-implant-supported fixed dental prostheses after in vitro stress simulation. Clin. Oral Implants Res. 2008, 19, 1261–1269. [Google Scholar] [CrossRef]
- McLean, J.W.; von Fraunhofer, J.A. The estimation of cement film thickness by an in vivo technique. Br. Dent. J. 1971, 131, 107–111. [Google Scholar] [CrossRef] [PubMed]
- Liang, S.; Yuan, F.; Luo, X.; Yu, Z.; Tang, Z. Digital evaluation of absolute marginal discrepancy: A comparison of ceramic crowns fabricated with conventional and digital techniques. J. Prosthet. Dent. 2018, 120, 525–529. [Google Scholar] [CrossRef]
- Martínez-Rus, F.; Suárez, M.J.; Rivera, B.; Pradíes, G. Evaluation of the absolute marginal discrepancy of zirconia-based ceramic copings. J. Prosthet. Dent. 2011, 105, 108–114. [Google Scholar] [CrossRef]
- Prasad, R.; Al-Kheraif, A.A. Three-dimensional accuracy of CAD/CAM titanium and ceramic superstructures for implant abutments using spiral scan microtomography. Int. J. Prosthodont. 2013, 26, 451–457. [Google Scholar] [CrossRef][Green Version]
- Guncu, M.B.; Aktas, G.; Guncu, G.N.; Anıl, D.; Turkyilmaz, I.; Antonoff, L.R. Clinical, technical, and radiologic outcomes of 182 implant-supported zirconia single crowns using titanium-base abutments: A retrospective study. Int. J. Prosthodont. 2022, 35, 553–559. [Google Scholar] [CrossRef]
- Pamato, S.; Honório, H.M.; da Costa, J.A.; Traebert, J.L.; Bonfante, E.A.; Pereira, J.R. The influence of titanium base abutments on peri-implant soft tissue inflammatory parameters and marginal bone loss: A randomized clinical trial. Clin. Implant. Dent. Relat. Res. 2020, 22, 542–548. [Google Scholar] [CrossRef]
- Pitta, J.; Hicklin, S.P.; Fehmer, V.; Boldt, J.; Gierthmuehlen, P.C.; Sailer, I. Mechanical stability of zirconia meso-abutments bonded to titanium bases restored with different monolithic all-ceramic crowns. Int. J. Oral Maxillofac. Implants 2019, 34, 1091–1097. [Google Scholar] [CrossRef]
- Rathe, F.; Junker, R.; Heumann, C.; Blumenröhr, J.; Auschill, T.; Arweiler, N.; Schlee, M. Long-term effects of titanium-base abutments on peri-implant health: A 5-year randomised controlled trial. Int. J. Oral Implantol. 2022, 15, 167–179. [Google Scholar]
- Afrashtehfar, K.I.; Weber, A.; Abou-Ayash, S. Titanium-base abutments may have similar long-term peri-implant effects as non-bonded one-piece abutments. Evid. Based Dent. 2022, 23, 134–135. [Google Scholar] [CrossRef] [PubMed]
- Gonzalo, E.; Suárez, M.J.; Serrano, B.; Lozano, J.F. A comparison of the marginal vertical discrepancies of zirconium and metal ceramic posterior fixed dental prostheses before and after cementation. J. Prosthet. Dent. 2009, 102, 378–384. [Google Scholar] [CrossRef] [PubMed]
- Alghazzawi, T.F. Advancements in CAD/CAM technology: Options for practical implementation. J. Prosthodont. Res. 2016, 60, 72–84. [Google Scholar] [CrossRef] [PubMed]
- Watanabe, H.; Fellows, C.; An, H. Digital Technologies for Restorative Dentistry. Dent. Clin. N. Am. 2022, 66, 567–590. [Google Scholar] [CrossRef] [PubMed]
- El-Dessouky, R.; Salama, M.M.; Shakal, M.A.; Korsel, A.M. Marginal adaptation of CAD/CAM zirconia-based crown during fabrication steps. Tanta Dental J. 2015, 12, 81–88. [Google Scholar] [CrossRef]
- Moreno, A.L.M.; Dos Santos, D.M.; Bertoz, A.P.M.; Goiato, M.C. Abutment on Titanium-Base Hybrid Implant: A Literature Review. Eur. J. Dent. 2023, 17, 261–269. [Google Scholar] [CrossRef]
- Weaver, J.D.; Johnson, G.H.; Bales, D.J. Marginal adaptation of castable ceramic crowns. J. Prosthet. Dent. 1991, 66, 747–753. [Google Scholar] [CrossRef]
Disclaimer/Publisher’s Note: The statements, opinions and data contained in all publications are solely those of the individual author(s) and contributor(s) and not of MDPI and/or the editor(s). MDPI and/or the editor(s) disclaim responsibility for any injury to people or property resulting from any ideas, methods, instructions or products referred to in the content. |
© 2023 by the authors. Licensee MDPI, Basel, Switzerland. This article is an open access article distributed under the terms and conditions of the Creative Commons Attribution (CC BY) license (https://creativecommons.org/licenses/by/4.0/).