Abstract
The Easternmost Mediterranean is a transition region from the ocean to the continent where the spreading and collision zones of the lithospheric plates join. The methodology of paleomagnetic mapping of the transition zones is based on combining geological and geophysical techniques for continental and oceanic platforms: magnetic data interpretation, paleomagnetic reconstructions, results of magnetized rock radiometric dating, satellite data analysis, tectonic–structural reconstructions, biogeographical studies, and utilization of different geophysical survey results. The satellite-derived gravity map reflects practically all significant tectonic units in the region, which assists us in the supposed paleomagnetic mapping. The satellite-derived and aeromagnetic maps with the tectonic features and the map of Curie discontinuity of Israel indicate the complexity of this region. Advanced magnetic data analysis supported by paleomagnetic data attraction and other geological–geophysical methods allowed the revealing of the block of oceanic crust with the Kiama paleomagnetic zone relating to the Early Permian age. A narrow reversely magnetized Earth crust block was revealed in the Lower Galilee. Some examples of advanced magnetic anomaly analysis are presented for several areas where the magnetization vector inclination is other than the modern direction: the Sea of Galilee, Carmel, Rosh-Ha-Ayin, Malqishon, and Hebron. In Israeli land, for the combined paleomagnetic mapping, the well-studied using paleomagnetic and radiometric methods (as well as tectonic–structural) areas were selected: (1) Makhtesh Ramon, (2) the Sea of Galilee with the adjoining zones, (3) Carmel, (4) Hula, and (5) Hermon. It is shown that the regional analysis of paleomagnetic data distribution played an essential role in detecting the influence of the recently recognized counterclockwise rotating mantle structure on the near-surface layers.
1. Introduction
The Easternmost Mediterranean (EMM) is a region belonging to the transition zone of the most prominent tectonic structures of the Earth—Eurasia and Gondwana [1,2,3,4]. In the Cenozoic, four lithospheric plates were formed here: Nubian, Arabian, Aegean–Anatolian, and Sinai [5]. The area is characterized by unique geodynamics, which simultaneously expressed the elements of the geodynamic collision associated with the Tethys Ocean evolution [6,7,8], and the Red Sea rift system’s initial spreading [9].
This tectonic–geodynamic circumstance determines the severe complexity and diversification of the developed tectonic elements and the various rock complexes in the Earth’s crust. They form a very bizarre knot that combines heterogeneous blocks of the continental and oceanic crust, terrane complexes, ophiolite belts, traps, folded island arc, and the intricate zones of the tectonic strike–slip, thrusts, and underthrust faults [10,11,12,13,14].
The extensive development of the magmatic associations of different ages and origins triggered the wide employment of the magnetic method in the studied region, e.g., [15,16,17,18,19,20]. However, paleomagnetic methods are necessary considering the presence of practically all possible positions of the magnetization vectors. Nevertheless, the significance of paleomagnetic methods goes beyond just clarifying the magnetic anomalies. Paleomagnetic mapping has methodologically successfully and widely recommended itself for decoding the structure and origin of intricate objects from the subsurface up to the Curie discontinuity in the continents and marine areas [21].
Some scientists initially attempted to apply the single paleomagnetic method in the transition zones from ocean to continent but without tangible success. The accomplished experience of our studies, e.g., [14,16,17,20,22,23], indicates that the combined paleomagnetic investigation is highly effective for analyzing the complex structures of the EMM (sometimes more than all other geological–geophysical methods).
The main objectives of this paper are the following:
- (1)
- The application of effective methodologies for magnetic anomaly quantitative analysis under complex EMM’s physical geological environments,
- (2)
- Demonstrating the possibilities of 3D combined gravity–magnetic modeling,
- (3)
- Description of the methodologies of paleomagnetic–radiometric mapping combined with tectonic–structural analysis and data of the deep geophysics and geodynamics.
2. Brief Tectono-Geophysical Setting
The study area is a complex zone of the lithospheric plate junction of the African–Arabian region, which belonged to the northern zone of the Gondwana in the Mesozoic–Early Cenozoic. There are developed structural elements of the latitudinal zonation caused by the development of the Neotethys Ocean and meridional zonation associated with the development of the Red Sea–East African spreading zone [10,24,25] and the Nubian–Arabian deep mantle structure that merged with this zone in the Late Cenozoic [14].
This is best illustrated by the recently constructed satellite-derived gravity map (Figure 1), which reflects the stable relationship between the changes in the gravity anomalies and the outline of the various regional tectonic features. Eppelbaum and Katz [24] have shown that qualitative analysis of satellite gravity maps (retracked to marine and earth surface) may be performed without any additional reductions for regional tectonic–structural or geodynamical zonation. Such a clear display, obtained for the first time for this geologically very complex region, is highly important since the current task of tectonic–paleomagnetic mapping should be based on a reasonably wide range of geophysical methods. Moreover, from the very beginning, in a series of our works, we set the task of applying the combined studies, including a system of various geological–geophysical surveys, e.g., [16,17,26,27,28].

Figure 1.
Satellite-derived gravity map of the area under study with the main tectonic features (isoline density is 10 mGals). (1) Intraplate faults, (2) interplate faults, (3) the southern boundary of the Mediterranean accretionary belt. DST, Dead Sea Transform; SF, Sinai Fault.
The presented map (Figure 1), being technologically reliable and continuous in the extent of the presented material, captures the essential elements of tectonics and geodynamics of this transitional region between Eurasia and Gondwana. Geodynamic elements of different orders and tectonic structures are located here, reflected in changes in the gravity field behavior. First, the most critical tectonic plates and the zones of faults limiting them are well distinguished. The latter corresponds to two dominant directions: sublatitudinal and submeridional. The first corresponds to the collisional geodynamics of the residual ocean Neotethys.
Furthermore, the second is connected with the initial stages of rifting in the Red Sea system. Naturally, at the intersection of these systems and structures, a complex system of uplifts, troughs, and mobile belts of fold-block and rift type is formed, and an uneven-aged system of traps is developed, reflected in the anomalies of the gravitational and magnetic fields. Tectonically complex areas such as the Dead Sea Transform (DST) zone and the Mesozoic terrane belt (MTB) block system adjacent to it prompt the choice of standard polygons for paleomagnetic mapping. In terms of studying the relationship between the continental and oceanic crust in the zone of transition of the continental structures of Gondwana to the oceanic structures of the Eastern Mediterranean Sea, the gravity map clearly shows the difference between the terranes of the southernmost part of the MTB from the oceanic basins of the Levant. Earlier magneto-geophysical studies of this region, e.g., [21,23], which turned out to be more than relevant, showed the importance of comparing magnetic and satellite–gravity data.
The sublatitude piece of the Neotethys collisional segment of the Earth’s crust, which is replaced to the south by the submeridional Red Sea–East African rift belt, is well illustrated by the data of the magnetic–thermal geodynamic map (Figure 2A,B). Figure 2A was compiled mainly from the aeromagnetic measurements carried out at different levels and re-tracked to the common 5 km altitude (the magnetic data were obtained from the World Digital Magnetic Anomaly Map DataBase compiled by the US Geological Survey (http://earthexplorer.usgs.gov/, (accessed on 23 July 2023)). Figure 2B displays the Curie discontinuity map developed mainly from the thermal data analysis supplemented after [29].
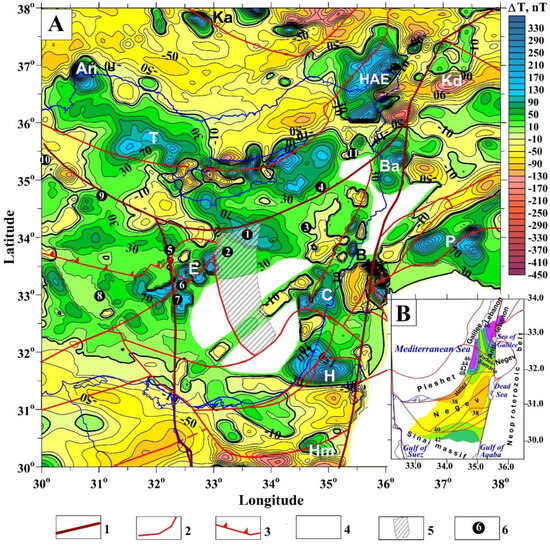
Figure 2.
(A) Magnetic–thermal geodynamic map of the studied region (modified after [23]). (B) Curie discontinuity map of Israel (modified and supplemented after [29]). (1) Main faults, (2) intraplate faults, (3) southern boundary of the Mediterranean accretionary belt, (4) areas with no data, (5) contour of the delineated Kiama paleomagnetic zone [22], (6) thermal flow values observed at sea bottom (after [30] with corrections for the sedimentation velocity, in mW/m2 (❶ 13.9 ± 2.9, ❷ 44.9 ± 12.1, ❸ 46.4 ± 14.2, ❹ 36.3 ± 3.9, ❺ 32.5 ± 7.0, ❻ 20.5 ± 7.3, ❼ 56.9 ± 8.2, ❽ 26.8 ± 10.0, ❾ 32.2 ± 9.9, ❿ 49.5 ± 10.8, ⓫ 26.5 ± 6.9). Key magnetic anomalies: An, Antalya; B, Beirut [6]; Ba, Banyas [31]; C, Carmel [6]; E, Eratosthenes [23]; H, Hebron [6]; HAE, Hasandag and Erciyes Mts. [32]; Hm, HaMeishar [26]; Ka, Karaman and Karsanti [18]; Kd, Kur Dag [18]; P, Palmyrides [31]; T, Troodos.
The magnetic map (Figure 2A) clearly shows that the regions of the EMM with the predominant oceanic crust development are characterized by values from 0 to +370 nT, and the region of the continental crust development of the Anatolian area and the Nubian-Sinai region forms a zone of the negative magnetic values from 0 to −450 nT. The low heat flow values observed in the EMM confirm the hypothesis about the oceanic crust origin in this region [23,28]. The Mesozoic terrane belt (MTB) [20,23], composed of the thinned continental crust, has both positive and negative magnetic field anomalies in equal measure (Figure 2A). The magnetic data generally confirm the tectonic elements overlaid on this map (main tectonic faults, intraplate tectonic faults, and plate boundaries). For instance, in this map, the boundary of the Aegean–Anatolian plate and the western and eastern boundaries of the Sinai plate (see also Figure 1 and Figure 3) are clearly indicated. The boundary between the Precambrian plate and the Mesozoic terrane belt is also well delineated.
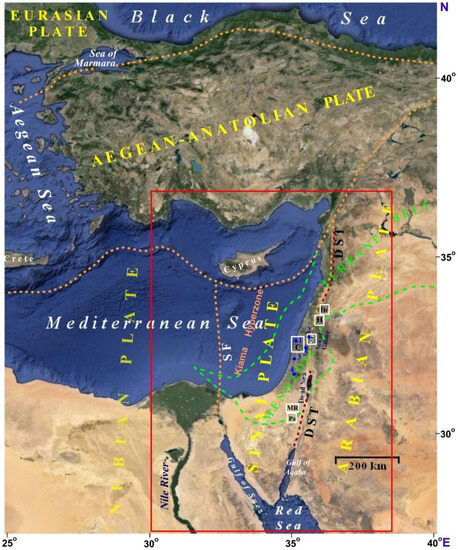
Figure 3.
Areal–tectonic map of the examined magnetic anomalies and paleomagnetic areas in Israel. Paleomagnetic areas: MR—Makhtesh Ramon, Pa—Paran area, CA—Carmel, SG—Sea of Galilee, HE—Hermon, HU—Hula. The blue circles with numbers designate the location of interpreted magnetic anomalies: (1) Carmel, (2) Sea of Galilee, (3) Rosh Ha-Ain, (4) Hebron, (5) Malqishon. DST, Dead Sea Transform; SF, Sinai Fault.
The correlation between the two geodynamic segments of the Earth’s crust in this region—the collisional (Tethyan) and the spreading (Red Sea)—with the data of the Curie discontinuity distribution (Figure 2B), confined to the upper part of the mantle lithosphere [29], looks fascinating. In general, north of latitude 32°, in the offshore zone of the MTB, the position of the Curie surface elevations increases to a depth of −46 km. To the south, it reaches a depth of −(38–40) km, probably due to the proximity of the northern part of the Red Sea rift with an increased heat flow. However, this situation is associated with the modern evaluation stage of this region. Furthermore, in the geological past, the overall development of the magnetoactive complexes of igneous rocks was associated with other deep geophysical processes and their tectonic structures [14].
We considered this circumstance in the areal–tectonic map (Figure 3), which shows the selected areas of the paleomagnetic mapping and the most distinct structurally significant magnetic anomalies that have been quantitatively analyzed. The black circles display the projection of their apical parts to the Earth’s surface (one point is shown in the Sea of Galilee).
3. Magnetic Data Analysis
3.1. Main Principles
The magnetic ΔT anomaly distortions occur due to the inclination of the magnetization vector to the horizon plane and the different orientations of the horizontal magnetization projection concerning the body’s axes, e.g., [33]. Besides the geomagnetic field inclination, the body’s axes’ orientation relative to the geomagnetic field’s horizontal component is also significant. Therefore, the analysis of field graph maps is insufficient and often necessary to analyze the isolines maps [34].
In the conditions of oblique (inclined) magnetization, the “reduction to pole” procedure is often used, i.e., the calculation of the pseudogravimetric anomalies [35]. However, the procedure is appropriate only when all interfering bodies in the studied area (1) are magnetized parallel to the geomagnetic field and (2) have sub-vertical dipping. Only in this case, the recalculated magnetic fields can be used for further quantitative analysis. Besides this, the “reduction to pole” cannot calculate such disturbing factors as the rugged terrain relief and practically always available superposition of the magnetic anomalies with the various wavelengths. Similar approaches based on the transformation of the observed magnetic field—analytic signal, e.g., [36]; wavelet transform, e.g., [37,38]; and Euler deconvolution, e.g., [39,40]—have the same limitations.
The developed interpretation methodologies involve the application of methods elaborated specially for the quantitative analysis of magnetic anomalies in complex physical–geological environments [34,41,42]. Unlike other techniques, these methods (improved versions of tangents, characteristic points, and areal methods) are applicable in oblique (and reverse) magnetization, rugged relief, and unknown levels of the normal field (i.e., superposition of the magnetic anomalies of different orders). Five interpretation models are used: (1) thick bed, (2) thin bed, (3) horizontal circular cylinder (HCC), (4) sphere, and (5) thin horizontal plate. In addition, Eppelbaum [42] showed that a representative class of models that take intermediate forms between the thick bed and the thin horizontal plate could be interpreted using the methodologies developed for the thick bed. Thus, advanced techniques can interpret magnetic anomalies from most geological targets under conditions of inclined magnetization, rugged terrain relief, and superposition of anomalies of different orders.
3.2. Quantitative Interpretation of Magnetic Anomalies in the Sea of Galilee (Lake Kinneret)
The Sea of Galilee (Lake Kinneret) is located in the northern Jordan Valley at the central part of the Dead Sea Transform (DST) (Figure 1). This small sea (lake) is Israel’s primary source of fresh water. It has an average surface of 165 km2 and an average volume of 4 × 10⁹ m3. Numerous geological investigations show that the rock outcrops in this area and rock samples collected in the wells surrounding the sea range from Jurassic to Quaternary. In contrast to the areas around the sea, the structure below it is not completely understood. Environmental restrictions forbid drilling geological boreholes in the lake.
Major basaltic volcanism in the Sea of Galilee region has two phases: Early Cretaceous and Late Cenozoic. The Early Cretaceous basalt thickness in the vicinity of the sea is minimal for northern Israel, and consequently, its influence on the magnetic field is negligible [16]. The Late Cenozoic basalts range from the Miocene to the Pleistocene. Most surface basalt outcrops surrounding the sea are of the Pliocene and Pleistocene ages [43].
Basaltic volcanism of different ages caused severe difficulties in quantitative analysis: in the sea and around it, the magnetic anomalies of different signs and intensities were recognized [16]. Altogether in the sea, about fifteen significant anomalies were selected and interpreted. Results of anomalies A, B, and C interpretation (in the northern part of the sea) are presented in Figure 4. Anomalies A (horizontal circular cylinder (HCC) model, magnetization I = 0.06 SI) and B (thin bed model, magnetization I = 0.55 SI) are positive, while anomaly C (HCC model) is negative. A practical absence of significant magnetic anomalies in the lake’s center is caused by the subsidence of basaltic rocks at a considerable depth [17].

Figure 4.
Sea of Galilee: Quantitative analysis of magnetic anomalies A, B, and C.
3.3. Quantitative Interpretation of Carmel Magnetic Anomaly
The Carmel anomaly is located on the western edge of the Galilean–Lebanon terrane (Figure 3). The magnetic analysis of Carmel anomaly has been carried out by applying the advanced developed methodologies of tangents and characteristic points (Figure 5). The depth of the upper edge of this anomalous target is about 6.5 km, and the average magnetization is about 3000 mA/m. It is vital that the determined position of the magnetization vector does not coincide with the normal one and is vertical (90°). Later, the validity of the obtained model was confirmed by the results of 3D combined modeling of the magnetic and gravitational fields. Geologically, this model is interpreted as an uplift of the magnetic crystalline basement [44]. An exciting fact confirming the modeling data is the coincidence of the apical part of the Carmel magnetic anomaly, with the zone of the highest hypsometric marks location of this ridge reaching 528–546 m (see Figure 5).
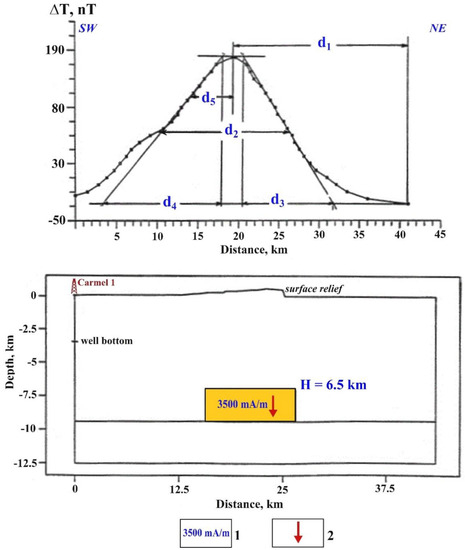
Figure 5.
Quantitative examination of the Carmel magnetic anomaly (see its location in Figure 3), Profile II. (1) Excess magnetization of the anomalous body, (2) position of the magnetization vector.
3.4. Quantitative Interpretation of Malqishon Magnetic Anomaly
The Malkishon magnetic anomaly is in the southwestern block of the Antilebanon terrane (see Figure 3), near its border with the Galilean–Lebanon terrane. This terrane’s main, northeastern block (where Hermon Mt. is located) is displaced relative to the southwestern block by a little over 100 km along the Dead Sea Transform. The same interpretation methods were applied to analyze the Malqishon magnetic anomaly. The depth of the upper edge of this anomalous body consists of 4.5 km, and the magnetization is less than 2500 mA/m. The position of the magnetization vector also does not coincide with the average direction in the region and is about 105° (Figure 6). We propose it is also an uplift of the crystalline basement but narrower than in the Carmel area.
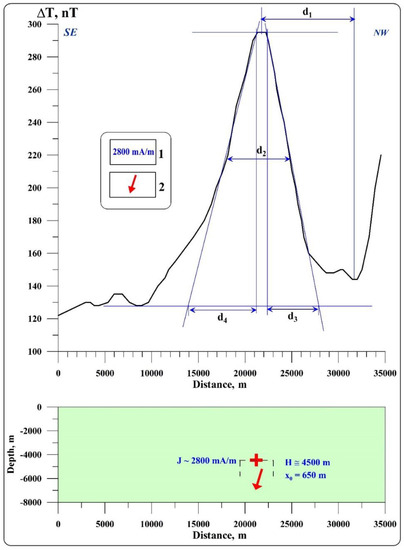
Figure 6.
Quantitative analysis of the Malqishon magnetic anomaly (see its location in Figure 3). Symbol + designates the location of the middle of the upper edge of the anomalous body, the red arrow shows the position of the magnetization vector, and the value x0 indicates the distortion of the maximum magnetic anomaly from the middle of the upper edge due to oblique magnetization.
3.5. Quantitative Interpretation of Rosh-Ha-Ayin Magnetic Anomaly
The Rosh-Ha-Ain anomaly is in the marginal eastern part of the Pleshet terrane (see Figure 3). Magnetic field quantitative interpretation indicates that the upper edge of this target occurs at a depth of about 6.5 km (Figure 7). This target is characterized by significant magnetization (2900 mA/m) and normal vertical (90°) magnetization. It was suggested that it is an uplift of the strongly magnetized crystalline basement [45].
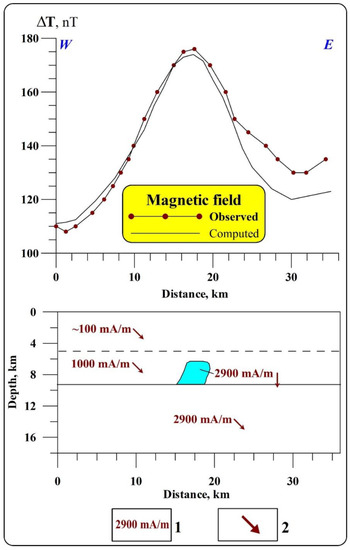
Figure 7.
Quantitative examination of the Rosh-Ha-Ain magnetic anomaly (see its location in Figure 3). (1) Magnetization of the anomalous body and surrounding medium, (2) position of the magnetization vector.
3.6. Nature of the Carmel, Malqishon, and Rosh-Ha-Ayin Magnetic Anomalies
The Carmel, Malqishon, and Rosh-Ha-Ayin magnetic anomalies most likely correspond to the Permian–Triassic Illawarra paleomagnetic hyperzone and are allochthonous, like the Israeli terranes themselves. The source of the extensive magnetic intrusions was probably the hot spots of the active spreading zone of the emerging Neotethys Ocean, where the initial massif of the Levant terranes was located [20] and was tectonically unloaded. Outside this zone, on the Gondwana foreland, only the Permian–Triassic’s sporadic dikes and alkaline ring intrusions are developed [13,46], which do not form significant magnetic anomalies.
3.7. Quantitative Interpretation of Hebron Magnetic Anomaly
The Hebron magnetic anomaly is the most sizable magnetic anomaly observed in Israel’s territory. It occurs in the vicinity of the Negev, Heletz, and Judea–Samaria terranes. Some investigators have related this anomaly to magnetized bodies at comparatively small depths (5–7 km). However, quantitative analysis of airborne data (1000 m over the Earth’s surface) shows that the anomalous magnetic body upper edge occurs at a depth of 26–28 km [47] (Figure 8). A rough estimation of the magnetized lower edge occurrence (the non-magnetized lower part may continue down for tens of km) gave a depth of about 40 km. This body’s magnetization and the magnetization vector’s inclination are estimated as 3000 mA/m and 80°, respectively. Moho and Curie’s discontinuity maps [29] display that in the area, the corresponding surfaces have values of 29–30 and 40–40.5 km, respectively. Hence, the anomalous body’s upper edge occurs 3 km above the calculated Moho boundary, and the lower edge of this body coincides with the maximum possible depth of magnetic target occurrence. Tectonically, the area of the Hebron anomaly relates to the collision zone between the Judea–Samaria and Negev terranes. The sequence formation maps were developed based on the data from several deep boreholes (~5–6 km) in this area. These maps indicate that the Judea–Samaria terrane was subducted under the Negev terrane. Considering that the collision zones are characterized by recognizable geodynamic mantle–crust instability, we propose that a mantle diapir is the source of the Hebron magnetic anomaly.
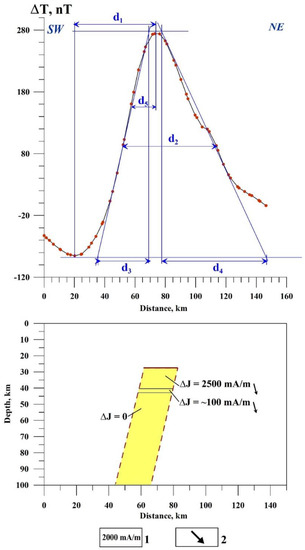
Figure 8.
Quantitative analysis of the Hebron magnetic anomaly (see its location in Figure 3). (1) Excess magnetization of the anomalous body, (2) position of the magnetization vector. Since the constructed Curie discontinuity map [29] indicates a depth of 40–40.5 km in this area, below this depth, the magnetization ΔJ = 0. In some intermediate zone (at 40.5–39.5 km), ΔJ~100 mA/m, and over this zone (39.5–28 km), this anomalous body has the determined magnetization: ΔJ = 2500 mA/m.
4. Three-Dimensional Magnetic Field Modeling
4.1. Applied GSFC Software for 3D Combined Gravity–Magnetic Modeling
The GSFC-M (Geological Space Field Calculation, modified) program is intended to compute 3D gravity and magnetic fields in complex physical–geological conditions [17,34]. This program has been intended for computing gravity field (observed values, free air, and Bouguer), magnetic field components (ΔZ, ΔX, ΔY), and total magnetic field ΔT, as well as second derivatives of the gravitational potential under conditions of uneven terrain relief and oblique magnetization. Three-dimensional horizontal polygonal prisms approximate the geological space. Each body geometrically can be described by 50 points; the number of employed bodies in the calculated model is practically unlimited (up to 1000). The geological bodies can be prepared for calculation, besides the 3D variant, as 2.5D and infinite along the strike. Types of the bodies may be the following: (1) closed, (2) left-hand non-closed, (3) right-hand non-closed, and (4) open.
The program has the following main advantages besides those already mentioned: (1) simultaneous computing of gravity and magnetic fields, (2) description of the terrain relief by irregularly placed characteristic points, (3) computation of the effect of the earth–air boundary by the method of selection directly in the process of interpretation, (4) modeling of the selected profiles flowing over rugged relief or at various arbitrary levels (using characteristic points), (5) simultaneous modeling of several profiles, (6) description of a large number of geological bodies and fragments [34]. The basic algorithm realized in the GSFC program is the solution of the direct 3D problem of gravity and magnetic prospecting for horizontal polygonal prism limited in the strike direction. In the developed algorithm, integration over a volume is realized on the surface, limiting the anomalous body. The combined potential field modeling is carried out by an iteration process, where geological bodies’ geometrical and physical properties may change. An important peculiarity of applied modeling is the possibility of calculating the 3D gravity–magnetic effects from the bodies lying outside the plane of the geological section [34].
4.2. Carmel Area (Northern Israel)
The results obtained at the stage of quantitative interpretation (see Figure 5) were used together with the various geological data to develop the initial Physical–Geological Model (PGM) of the Carmel anomaly [44]. Four profiles were used for 3D combined gravity–magnetic modeling: Profiles 1–3 parallel in the southwest–northeast direction and Profile 4 in the southeast–northwest direction crossing the first three profiles. The results of 3D modeling along with Profile 2 are presented in Figure 9.
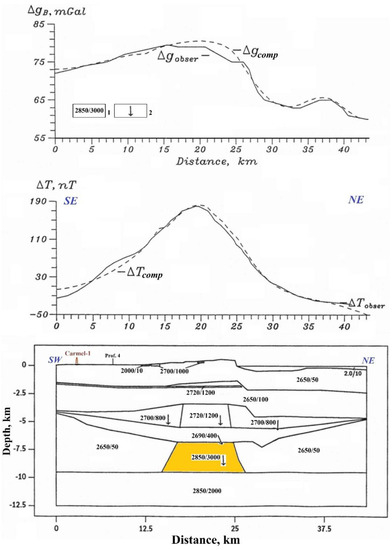
Figure 9.
Results of 3D combined gravity–magnetic modeling along Profile II in the Carmel area. (1) Physical properties (numerator = density, kg/cm3, denominator = magnetization, mA/m), (2) direction of magnetization vector, other than the geomagnetic field inclination for the region. “obser”, observed; “comp”, computed.
The uplifted crystalline basement produces the greatest gravity–magnetic effect with a magnetization of 3000 mA/m and a density of 2850 kg/m3. Based on the results obtained from four interpreting profiles, the uplifted crystalline basement relief map is constructed (Figure 10). The vertical magnetization of the uplift of the high-magnetized crystalline basement can explain the coinciding between the maxima of the gravitational and magnetic anomalies.
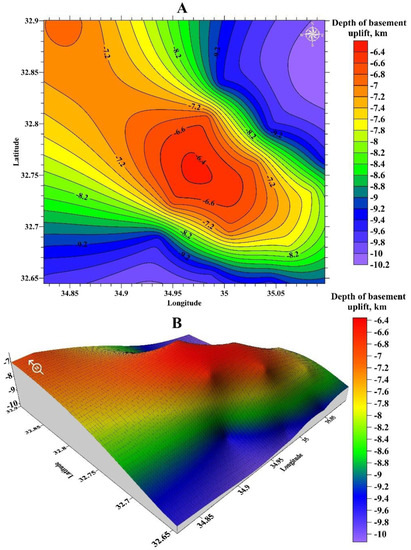
Figure 10.
Maps of the basement uplift of the Carmel anomaly: conventional (A) and relief (B) variants.
4.3. Sea of Galilee (Northern Israel)
Ben-Avraham et al. [48] have demonstrated that the bottom relief morphology in the southern part of the sea testifies to a significant contrast from other zones of the basin. The magnetic field pattern in the sea’s southern part also differs from the magnetic field behavior in the northern and central parts of the basin. The magnetic field 3D modeling along the interpreting profile (see also Section 5.1.1) indicates that a thick hidden basaltic plate causes this anomaly [49]. This inclined plate is characterized by the following parameters: magnetization of 3000 mA/m, vector inclination of 135°, the dip of about 12° from NE (depth of upper edge = 1140 m) to SW (depth of upper edge = 760 m), length of 4000 m, and averaged vertical thickness of 480 m.
4.4. Paran Area (Southern Israel)
Figure 11A displays a simplified magnetic map (based on the airborne magnetic map observed at the altitude of 1 km [50]) of a junction zone between the Sinai massif and Negev terrane. This map specifies that two types of magnetized targets occur here: (1) small, elongated bodies on the Earth’s surface (subsurface) and (2) larger objects at some depth. An interpretation Profile A–B is in the Hameishar subterrane (Hare Govay) in the Sinai massif’s northern part, north of the Paran fault (Figure 11A). Several geophysical and tectonic factors (considering also the anomalous size difference) suggest that the examined large magnetic anomaly (Profile A–B crosses it) corresponds to the remains of the obducted crust of the Tethys Ocean. To identify the nature of this anomaly, 3D magnetic field modeling has been performed (Figure 11B).


Figure 11.
(A) The generalized magnetic map of the junction zone (Paran area) between the Sinai massif and Negev terrane. (1) Faults observed at the day surface, (2) faults reconstructed by integrated geological–geophysical analysis, (3) wells, (4) location of the magnetic profile. (1) and (2) are according to [51], with modifications and the authors’ data. (B) Results of 3D magnetic field modeling of the anomaly along Profile A–B (see Figure 11A). An airborne magnetic map [50] was used to construct the observed magnetic field. The arrows display the position of the magnetization vector (modified after [21]).
The constructed PGM illustrates that the anomalous magnetic field in the profile’s central part (we propose that the left- and right-side magnetic field decrease is produced by the influence of other geological targets) can be generated by a complex form basaltic plate (the vertical thickness of which is varying from 250 to 750 m) [21]. The obtained magnetization of the target is 3600 mA/m (the average magnetization of the surrounding media was assumed as 50 mA/m), and the magnetization vector’s inclination is 53° to the horizon. We propose that this body relates to the Neotethys oceanic crust. The Lower Mesozoic–Upper Paleozoic magmatic complexes (Saharonim ophiolites and Hameishar basalts) were radiometrically dated in this area, which enabled us to associate the recognized body with the Illawarra paleomagnetic hyperzone.
4.5. Easternmost Mediterranean
Ben-Avraham et al. [28], based on integrated seismic–gravity–magnetic (with thermal data attraction) analysis, have verified the existence of oceanic crust in the Levant Basin (in the EMM middle zone) and the presence of continental crust under the Eratosthenes Seamount. Investigating the EMM deep structure requires thorough attention to the basaltic crust blocks with the discovered reverse magnetization [22,28]. This issue was justified as a Kiama paleomagnetic hyperzone of inverse polarity [19,23], which requires a separate comprehensive examination. Three-dimensional magnetic–gravity modeling conducted along three interpreting profiles, supported by seismic data along the same lines (the location of these profiles is shown in Figure 12) and areal tectonic–geodynamic studies, unambiguously indicate the existence of the Earth’s crust blocks with reverse magnetization.
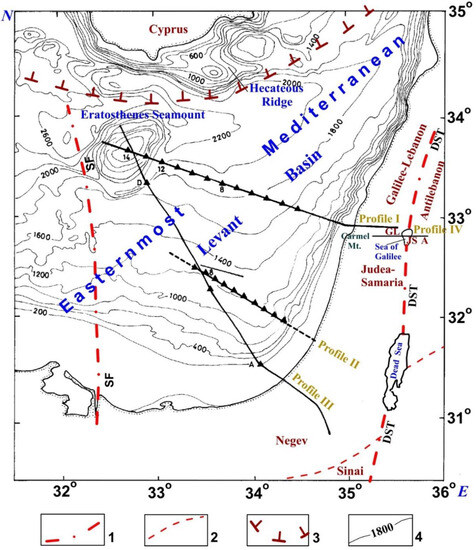
Figure 12.
Location of profiles I, II, III, and IV superimposed on the geodynamic–bathymetric map of the Easternmost Mediterranean (modified after [19,28]). (1) Interplate faults, (2) intraplate faults, (3) deep fault separating the Alpine belt and oceanic depression, (4) bathymetry.
Thus, this research, for the first time, presents combined coordinated seismic–magnetic–gravity models for three crossing profiles (Profiles I, II, and III are shown in Figure 13, Figure 14 and Figure 15, respectively). The most challenging process was the 3D magnetic field modeling (hundreds and hundreds of iterations were applied), considering very complex and magnetically variable media. It was shown [34] that integrated interpretation of three independent geophysical fields (assuming that three anomalous points characterize each field) increases the interpretation reliability using the error function three times. In our case, the number of anomalous points is many times larger; consequently, the interpretation reliability is increased.
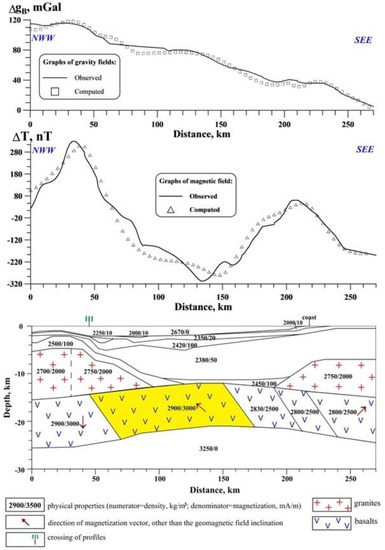
Figure 13.
Results of 3D magnetic–gravity modeling along Profile I (see the location of this profile in Figure 12) (modified after [19,28]).
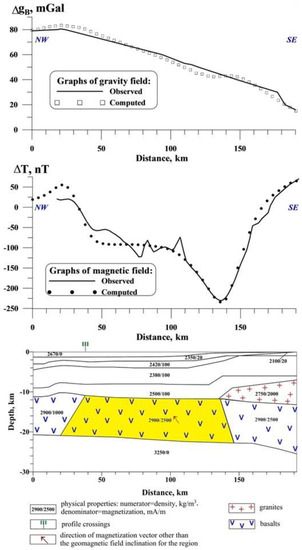
Figure 14.
Results of 3D magnetic–gravity modeling along Profile II (see the location of this profile in Figure 12) (modified after [19,28]).

Figure 15.
Results of 3D magnetic–gravity modeling along Profile III (see the location of this profile in Figure 12) (modified after [19,28]).
Figure 13 displays the results of 3D combined magnetic–gravity modeling along Profile I. The complexity of 3D magnetic field modeling exceeds the gravity field modeling by several times. The main peculiarities of the PGM for Profile I are the revealed crystal block with inverse magnetization (about −120°) in the center of profile [28] (slightly yellow colored) and a crystal block of continental crust with inverse magnetization in the eastern part of this profile (about −45°) (brightly brown colored). The same inversely magnetized blocks were discovered in Profile II (Figure 14) and Profile II (Figure 15).
Another example shows the developed PGM along the profile crossing the Dead Sea Transform (DST) within the Sea of Galilee (Profile IV), also obtained using 3D combined gravity–magnetic field modeling (Figure 16) (the location of this profile is shown in Figure 12). A preliminary PGM of this profile was constructed on the data of [29,31,44,52,53,54,55].
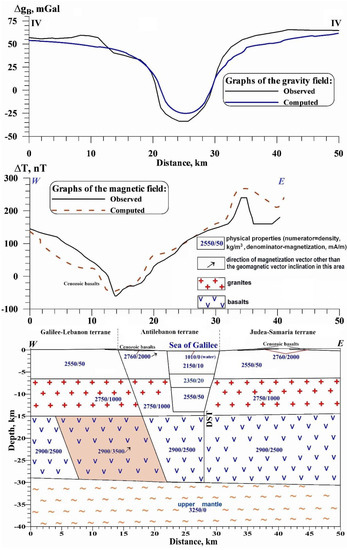
Figure 16.
Results of 3D combined magnetic–gravity modeling along profile IV (see the location of this profile in Figure 12). DST, Dead Sea Transform.
Predominantly, the low-density sedimentary deposits and salt accumulated in the DST zone produce the negative gravity anomaly along Profile IV (Figure 16). A comprehensive analysis of magnetic field behavior indicates that it has a more complex character. Such a magnetic field behavior cannot be explained by effects from subsurface basalts (and by anomalies from any basaltic plates (bodies) occurring at low depths). The present magnetic pattern in these physical–geological conditions may be provided only by a deep crystal block with an inverse magnetization. It confirms the detecting crystal block with the same magnetization direction in the land’s easternmost part of Profile I (see Figure 13).
The considered block of the Earth’s crust is essential for assessing the Early Permian stage of tectonic–thermal activation, corresponding to the initial spreading of the Neotethys Ocean. Traces of this activation are widely seen in the radiometric dates (253–283 Ma) of zircons in xenoliths from Late Cretaceous volcanic apparatuses [56,57]. According to mineralogical and petrological data [58], this igneous complex of the Carmel–Galilee region corresponds to granulite xenoliths. According to the above authors, these rocks were uplifted from the upper mantle to the depths of 18–34 km, which agrees with the proposed physical–geological model (Figure 16).
Figure 17 displays the contoured oceanic crust block with the Kiama paleomagnetic hyperzone (EMM) and the narrow Earth’s crust block (Lower Galilee) with inverse polarities. A reconstruction of the position of a reverse magnetized block of the Earth’s crust enabled us to contour an inverse magnetization zone with an S–N orientation with a width reaching 70 km and a length of about 200 km [23]. Such a large, thick (about 10 km) block of inverse magnetization (the calculated entire volume of this zone exceeds 120,000 km3) must correspond to a significant and prolonged effect of inverse polarity in the Earth’s magnetic field history. Analysis of the paleomagnetic scale indicates that the Early Cretaceous or Early Jurassic periods, as was assumed in [28], do not contain sufficiently prolonged periods of the Earth’s magnetic field inverse polarity. Therefore, it was suggested that this is the Kiama paleomagnetic hyperzone of inverse polarity [23], first detected in Australia’s Late Carboniferous and Permian rocks [59]. Tectonically, it is necessary to note the discordant position of the recognized Kiama oceanic crust block concerning the sea shores. Considering this fact and many other geological–geophysical indicators [23], it was determined that this block and some surrounding blocks of oceanic crusts are allochthonous; it was proposed that this block was initially formed in the region of the modern Persian Gulf [60].
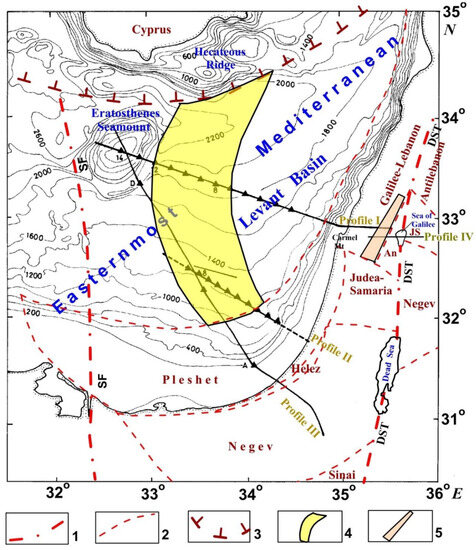
Figure 17.
Final generalization of the 3D combined magnetic–gravity modeling results. (1) Intraplate faults, (2) intraplate faults, (3) deep fault separating the Alpine belt and oceanic depression, (4) contour of the block of oceanic crust with the Kiama paleomagnetic hyperzone, (5) block of the reversely magnetized Earth’s crust. DST, Dead Sea Transform; SF, Sinai Fault; An, Antilebanon; JS, Judea–Samaria.
5. Paleomagnetic Mapping
Paleomagnetic research is broadly accepted as an effective separate tool for tectonic and geodynamic reconstructions, investigating deep structures, searching for economic minerals, and environmental and archaeological studies, e.g., [61,62,63,64,65,66,67,68]. In some cases, important geological–geophysical conclusions derived from paleomagnetic data analysis cannot be achieved from any other geophysical or geological methods [21]. The regional and local magnetostratigraphic scales are extensively applied for the unification of the stratigraphic schemes and the correlation of the numerous local subdivisions. The paleomagnetic mapping (zonation) enables “jumping” from the separate measurements to areal reconstructions that significantly increase the effectiveness of the paleomagnetic method application. At the same time, integrating paleomagnetic data with other geophysical and geological methods frequently strongly increases the efficiency and importance of paleomagnetic research [57].
Eppelbaum et al. [16,17] have productively applied combined paleomagnetic–magnetic data analysis and radiometric dating to the tectonic–structural analysis in the region of the Sea of Galilee. As a result, this area’s initial magnetic–paleomagnetic–radiometric map (scheme) was constructed.
Eppelbaum et al. [22] discovered the Kiama paleomagnetic hyperzone of inverse polarity in the Easternmost Mediterranean (EMM). It triggered the development of the EMM’s first paleomagnetic map based on the combined interpretation of magnetic anomalies, paleomagnetic characteristics, different geophysical fields, and comprehensive analysis of the surrounding volcanogenic and sedimentary structures [20,21,23,49,60].
5.1. Paleomagnetic Mapping in Northern Israel
Nur et al. [69] carried out the first geodynamic paleomagnetic zonation of transition zones from the ocean to the continent in the example of northern Israel. The mentioned authors revealed several tectonic blocks in this area of the prevalent counterclockwise rotation.
The combined paleomagnetic mapping has been carried out for the following tectonically complex areas in Israel: (1) the Sea of Galilee and its vicinity, (2) Hula basin and adjacent areas, (3) Mt. Hermon, (4) Mt. Carmel and surrounding areas.
5.1.1. Combined Paleomagnetic Map for the Sea of Galilee and Its Vicinity
Structurally, historically–geologically, and methodologically, the region of the Sea of Galilee (Lake Kinneret) (see its location in Figure 2B and Figure 3) is the best object of the paleomagnetic mapping of transition regions from the ocean to the continent. The phenomena and structures of the collisional type caused by the closure of the Neotethys Ocean and the elements of the initial phases of the Red Sea–East African Rift system spreading are developed here. It is the largest freshwater reservoir in Israel and the Middle East and an etalon region for the volcanogenic association examination.
The N-S Dead Sea Transform (DST) and the E-W and NW-SE fault systems break up the Galilee region. The sea, and the plain to its south, are in a depression bounded on the east and west by active fault scarps with steep gradients [70]. The superposition of vertical movements perpendicular or inclined to the transform impedes the tectonic–structural interpretation of this basin [54].
At the end of the XX century, different geological and geophysical surveys raised the question of developing the tectonic–geodynamic model of this area, e.g., [54,71]. Further studies [16,17,21] displayed that the solution to this problem is to develop a methodology for the paleomagnetic mapping by an optimal linkage of the methods of magneto-geophysics (adopted in the study of the oceans and the methods of the paleomagnetic stratigraphy assumed for the continents) supported by a set of independent geological–geophysical investigations.
This study [16,17] was the first experience of this kind of research. In the context of the regional geological–geophysical studies of the African–Arabian region, paleomagnetic mapping of the area of the Sea of Galilee has been significantly expanded and detailed [49,57,72].
A compiled paleomagnetic column for the Sea of Galilee indicates the complexity of the medium (Figure 18). The elaborated edition of the paleomagnetic map of the Sea of Galilee and its vicinity (Figure 19) was extended to the south (to the Belvoir uplift) and supported by a paleomagnetic scale. Here, a deep well was drilled, and a set of the Cenozoic traps radiometric dating was obtained. The map was significantly detailed due to the attraction of novel data from the structural, radiometric, and paleomagnetic analyses, which increased the understanding of the studied area’s structure and evolution.
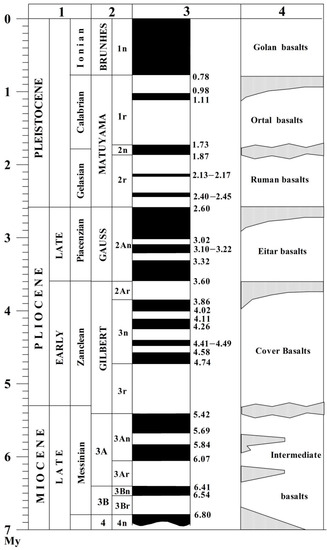
Figure 18.
Generalized chronostratigraphic and magnetostratigraphic scales of Late Cenozoic basaltic formations for the Sea of Galilee and Hula Basin (modified after [16,49,72]). (1) General stratigraphic scale, (2) paleomagnetic chrons and subchrons, (3) paleomagnetic scale and its radiometric limits, (4) sequence of basaltic formations.
For effective paleomagnetic mapping, applying an optimal paleomagnetic scale is necessary. The development of the Jalal, Sogdiana, Gissar, Tuarkyr, and Khorezm paleomagnetic classification is described in [73,74].
Methodologically, in such a manner, we tacked the mapping of the transition region from the ocean to the continent to the methods widely used in the paleomagnetic mapping of the oceanic regions [57] and optimally compiled with the geodynamic principles [75]. A new variant of the paleomagnetic map of the Sea of Galilee and adjacent areas (Figure 19A) includes an anomalous pull-apart basin, areas of the circular structures’ development [15,21], the arc faults, and the rotational markers of the crustal block recognized from the tectonic–structural and paleomagnetic data [54,76,77].
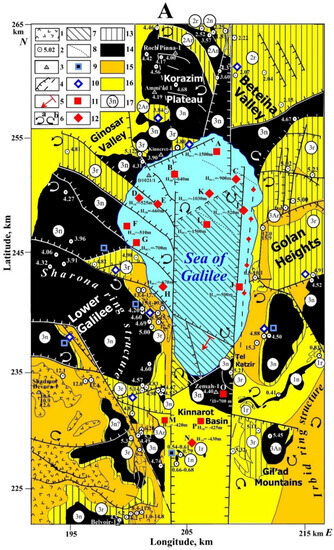
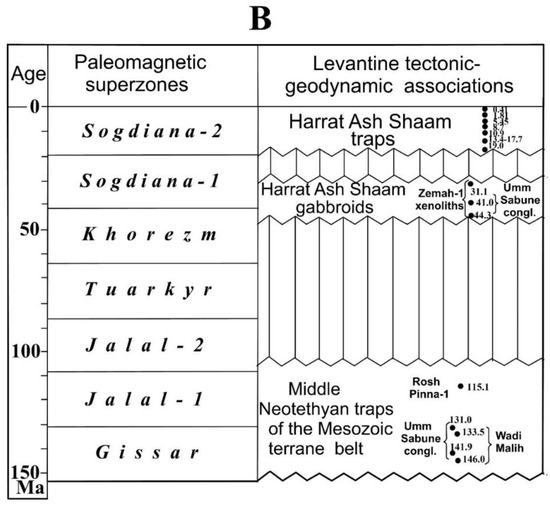
Figure 19.
(A) Combined paleomagnetic–magnetic–radiometric scheme of the Sea of Galilee (modified and supplemented after [49]). (1) Outcropped Cenozoic basalts, (2) points with the radiometric age of basalts (in m.y.), (3) wells, (4) faults, (5) general direction of the discovered buried basaltic plate dipping in the southern part of the Sea of Galilee, (6) counterclockwise (a) and clockwise (b) rotation of faults and tectonic blocks, (7) pull-apart basin of the Sea of Galilee, (8) suggested boundaries of the paleomagnetic zones in the sea, data of land paleomagnetic measurements: (9 and 10) (9) reverse magnetization, (10) normal magnetization; (11 and 12) results of magnetic anomalies analysis: (11) normal magnetization, (12) reverse magnetization; (13) reversely magnetized basalts; (14) normal magnetized basalts; (15) Miocene basalts and sediments with the complicated paleomagnetic characteristics; (16) Pliocene–Pleistocene basalts and sediments with the complicated paleomagnetic characteristics; (17) index of paleomagnetic zonation. The tectonic setting is derived from [54,78,79,80]. The indicators 1n, 2n, 3n, 1Ar, 2Ar, and 3Ar are the indexes of paleomagnetic subchrons (see Figure 18). Radiometric data (K-Ar and Ar-Ar) are compiled from [43,78,81,82,83]. Paleomagnetic data are generalized after [43,76,78,81,82,84,85,86,87,88]. HTB and HHCC designate the calculated depths of the basaltic bodies in the basin: HTB is the upper edge for the model of the thin bed, HTHP is the upper edge for the model of the thin horizontal plate, and HHCC is the center for the model of the horizontal circular cylinder. (B) Paleomagnetic scale for the integrated paleomagnetic scheme for the Sea of Galilee.
Two relatively sizable ring structures are presented here. The first is the Sharon trap depression located in the central-western part of the map. The second is the Irbid ring structure, bounded by conical dikes and partially presented in the southeastern part. Significantly, the largest amplitude of counterclockwise rotation 58° is registered in the Sharona ring structure, which emphasizes the complexity of the geodynamics of the zones of trap formation. An Irbid ring structure prone to counterclockwise rotation has a different nature (Figure 19).
5.1.2. Hula Paleomagnetic Map
Due to the elaboration of the paleomagnetic mapping methodology in the Sea of Galilee etalon area, it became possible to develop a paleomagnetic map of its northern extension—Hula Valley (Figure 20A). The constructed map also includes areas of Upper Galilee Heights, the northern slope of the Korazim Plateau, the northern part of the Golan Plateau, and the southern side of the Hermon Mts. The Pliocene–Quaternary traps and the sedimentary complexes belonging to the Brunhes–Matuyama zones mainly comprise this area. More ancient Pliocene trap complexes are developed in the south, in the Korazim Plateau and Beteiha Valley, belonging to the Gauss and Gilbert superzones.

Figure 20.
Paleomagnetic–geodynamic map of the Hula Basin (see its location in Figure 3) and adjacent areas of the Golan Plateau, Hermon Mt., and Galilea uplift (modified after [57]). (1) Volcanic cones, (2) Cretaceous traps, (3) outcrops with the radiometric ages of basalts (in Ma), (4) boreholes, (5) faults: (a) observed, (b) reconstructed, (6) pull-apart basin, (7) tectonic blocks rotations: (a) counterclockwise, (b) clockwise, (8) outcrops with the determined reversely magnetized basalts, (9) outcrops with the determined normally magnetized basalts, (10) chrons of the Geomagnetic Polarity Timescale, (11) areas of the reversely magnetized basalts, (12) areas of the normally magnetized basalts, (13) Gissar superzone, (14) Jalal superzone, (15) Tuarkyr–Khorezm superzone, (16) Sogdiana superzone. The paleomagnetic scale for this area is presented in Figure 19B.
In the Upper Galilee Heights, at the extreme west of the district, are mainly Upper Cretaceous and Paleogene sedimentary formations related to the Khorezm–Tuarkyr and Jalal paleomagnetic superzones. In the northeast, on the slope of Hermon Mt. are Jurassic and Cretaceous formations penetrated by pre-collisional, collisional, and post-collisional traps of the Gissar and Jalal superzones (Figure 20A,B). This peculiarity is reflected in more detail in a separate paleomagnetic map of this uplift (see Section 5.1.3).
5.1.3. Hermon Paleomagnetic Map
One of the brightest and the most exotic in geological–geophysical terms is Hermon Mt., belonging to the Antilebanon terrane [26]. This mountain is the most elevated tectonic block of the Easternmost Mediterranean, reaching an absolute elevation of 2482 m above sea level and with an abnormal depth of the Moho discontinuity—over 37 km [89].
The area (see its location in Figure 3) is composed mainly of Jurassic limestones and dolomites permeated by vast dike complexes of alkaline basaltoids and, in the south, byeruptive volcanic breccias filling the diatremes with a width of 200 to 1500 m [90,91]. In the southeastern part of the area (Figure 21A), a strip of the Cretaceous volcanic apparatuses—lavas, tuffs, and volcanic cones—was replaced to the south by the Early Cretaceous sandstones and the Late Cretaceous carbonate rocks. The latter are sharply, unconformably overlapped by the Quaternary basaltoids belonging to the traps occurring on the northern part of the Golan Plateau [79].
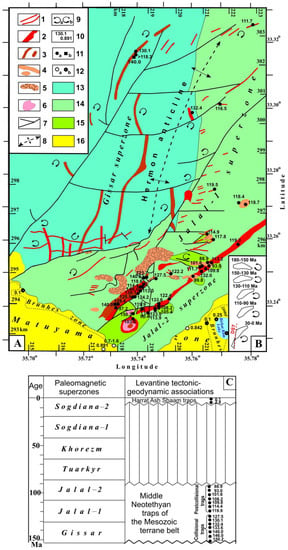
Figure 21.
Mt. Hermon geodynamic–paleomagnetic map (see the location of this area in Figure 3). (A) Tectono-paleomagnetic indicators. (1) Lower Cretaceous basalt–basanite dikes, (2) Lower Cretaceous alkaline basalt flows and tuffs, (3) Jurassic–Lower Cretaceous diabase dikes, (4) Lower–Upper Cretaceous alkaline basalt flows, (5) Lower Cretaceous diatreme pipes, (6) Upper Cretaceous alkaline basalt cone, (7) faults, (8) axis of the Hermon anticline, (9) counterclockwise (a) and clockwise (b) rotation of faults and magmatic bodies, (10) radiometric age of magmatic rocks, (11) points of Mesozoic magmatism studied by different methods: (a) by K-Ar, Ar-Ar data, (b) Nd-Sr-Pb isotopic data, (12) paleomagnetic measurements of the Pleistocene magmatic rocks: (a) reverse polarity, (b) normal polarity; ((1–8) and (10–12) from [88,90,91,92,93,94,95,96,97,98,99], paleomagnetic zones (13–16): (13) Gissar, (14) Jalal-1, (15) Jalal-2, (16) Sogdiana-2 (Matuyama and Brunhes Chrons). (B) Geodynamic changes of Antilebanon terrane displacement in the Middle Mesozoic–Cenozoic. (C) Paleomagnetic scale.
The Jurassic carbonate rocks form a gentle brachyanticlinal fold burrow Hermon, the axis of which extends in the central part of the area in the SSW-NNE direction. In general, the limestone Jurassic massif is penetrated by numerous diagonal tectonic faults parallel to the Hermon anticlinal axis and sub-latitudinal arcuate faults, very characteristic of the region of the EMM, where the primary regional rotation of tectonic blocks counterclockwise is developed [14].
The paleomagnetic map of the Mt. Hermon area has been constructed for the first time (Figure 21A–C). It is based on an integration of sufficiently detailed aforementioned geological data, as well as petrological [93,95], petrostructural [91], radiometric [88,93,94,95,96,97], and paleomagnetic [88,100] data.
All these data enable us to conclude that within the study area, three paleomagnetic complexes are developed, two of which are Mesozoic (Gissar and Jalal), and one is Late Cenozoic; the youngest zones of the Brunhes and Matuyama relate to the Sogdiana superzone (Figure 21C). The most ancient Gissar superzone is in the central and eastern parts of the region and is composed of Jurassic carbonates. The latter are erupted by a set of sub-meridionally oriented tholeitic microgabbro–dolerite megadikes [90]; the southern dike—Orchard—reaches a width of 100–200 m [91].
The basanitic dike swarm is developed in the east of this zone. Few radiometric age data for the Gissar dikes in the north give estimations of 140, 132.4, and 130 Ma. To the south, the xenoliths of these rocks were carried by younger volcanoes, and their radiometric ages were determined between 150 and 140 Ma. In the Elazar horizon, the age of conglomerates is determined as 146 Ma [95].
These data are in good agreement with the age from the basal part of the Tayasir traps (Wadi Maliah), i.e., 146 and 133.5 Ma [96,101], and with the age of the Um Sabune Middle Miocene basalts conglomerates, i.e., 141.9 Ma in the Shelah area, 35 km north of the exit bedrock basites of the Lower Cretaceous [81]. The Wadi Maliah district in the southwestern block of the Antilebanon terrane in the zone of the left strike-slip DST is separated from the northeastern block and Mt. Hermon by 100 km. This tectonic peculiarity is reflected in the inset of Figure 21B, which indicates the evolution of the movement of the Antilebanon terrane from the Jurassic to the present time.
5.1.4. Carmel Paleomagnetic Map
The Mt. Carmel structure (see its location in Figure 3) differs from other coastal plain structures of the EMM by the essential tectonic amplitudes, vast development of magmatic formations (from Mesozoic to Cenozoic), geomorphological characteristics, high gravity–magnetic field gradients, and significant intensity of the seismic events [21].
Paleotectonically, the Carmel structure is located at the boundary between the Judea–Samaria and Galilee–Lebanon terranes [6]. The recent analysis indicates that this boundary is displaced a few km south of the Atlit fault branch zone (Figure 22A). Neotectonically, this boundary coincides with the seismic activity zone within the Yagur fault branch system. The boundary continues onshore and divides the area into the northern and southern sectors [102].
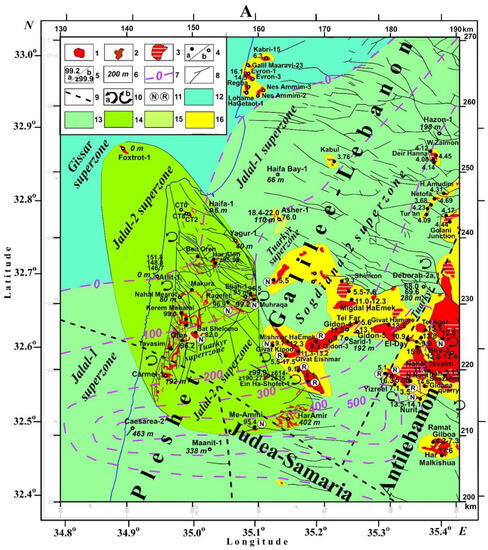
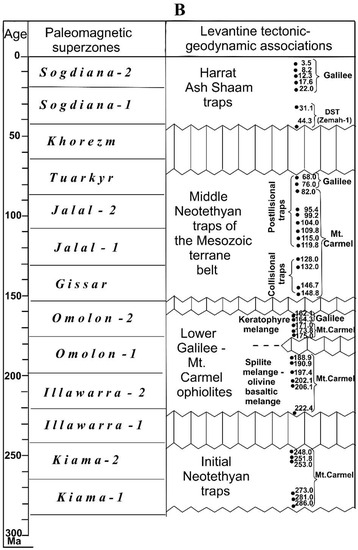
Figure 22.
(A) Geodynamic–paleomagnetic map of the Mt. Carmel–Galilee region (see its location in Figure 3) (modified and supplemented after [57]). (1) Cretaceous–Miocene basalts, (2) Miocene gabbroid intrusive, (3) Pliocene Cover basalts, (4) outcrops (a) and boreholes (b) with the Mesozoic–Cenozoic magmatic complexes, (5) radiometric age of magmatic rocks and minerals from K-Ar, Ar-Ar methods (a) and zircon geochronology (b), (6) thickness of the Lower Cretaceous traps (in m), (7) isolines of the Lower Cretaceous traps thicknesses (in m), (8) faults, (9) boundaries of terranes, (10) counterclockwise (a) and clockwise (b) rotation derived from tectonic and paleomagnetic data, (11) data of paleomagnetic measurements of magmatic rocks with normal (N) and reverse (R) polarities, (12–15) paleomagnetic zones: (12) Gissar, (13) Jalal-1, (14) Jalal-2, (15) Tuarkyr, (16) Sogdiana-2. (B) Paleomagnetic scale for the integrated paleomagnetic scheme for the Mt. Carmel–Galilee region.
The Carmel tectonic node is crucial in estimating the space interaction of the continental and oceanic zones in the studied region. The oldest discovered deposits are the Triassic associations, an overlying series of the magmatic and sedimentary rocks of the Early Mesozoic (Asher Volcanics) [103]. The last associations were covered by younger Mesozoic–Cenozoic deposits and affected by the extended complex deformation of the postaccretional tectonic stage (>130 Ma).
It was assumed earlier [103,104] that the Early Mesozoic formation of the Asher Volcanics was generated within the graben structure. Gvirtzman et al. [105] proposed that the formations composing this graben have a primarily continental genesis since they include the soils and coal. Other data [106,107] indicate that Asher Volcanics relates to a deep basin with a possible ocean-like crust; the results of our investigations [20,21,22] partially coincide with the last proposition.
In a series of numerous works, we have established that the concept of the Asher graben filled with volcanic rocks is initially tectonically and paleogeographically incorrect, e.g., [23]. A detailed analysis made it possible to determine that the Early and Middle Mesozoic igneous–sedimentary rocks underlying the Lower Cretaceous traps are a series of sheets of ophiolite mélange. At the same time, the youngest of them, keratophyre mélange, up to 164 million years old, lies at the base of the section. Furthermore, the oldest one, Mt. Carmel Upper ophiolites, is composed of an olivine–basalt mélange with blocks of igneous rocks up to 222.4 Ma old [57]. In general, the association of allochthonous oceanic rocks of the Carmel–Lower Galilee is the thickest (up to 4 km) ophiolite complex in the EMM, detached from a block of oceanic crust, penetrated along transform faults from the northeast from the Neotethys zone towards the isolated oceanic basin of the Levant [21,57]. The platform Triassic terrigenous–carbonate formations underlying the Carmel–Galilee ophiolite complex are of considerable thickness, up to 3000 m, and are intruded by Late Jurassic and Early Cretaceous trap sills. Older sedimentary cover rocks require drilling at depths over 6531 m and 5647 m (wells Atlit-2 and Devora-2A).
The complex of Carmel ophiolites with angular and structural unconformity is overlain by Lower Cretaceous traps and carbonate formations of the Upper Cretaceous and Cenozoic, intruded by the Upper Cretaceous complex of volcanoes and Neogene traps. To understand the characteristics of deep basement rocks, mineralogical–petrological, and radiometric analysis of xenoliths found in the Cretaceous and Late Cenozoic trap series play an important role. Discovering numerous mantle minerals [56,108,109,110,111,112] also confirmed the last theory. It should be noted that an anomalously high content of the Permian zircons was discovered in the xenoliths of the Cretaceous volcanoes [56]. Based on the ratios of trace element analysis, these authors consider that these zircons are associated with the magmatic complexes of the Earth’s crust of the oceanic type.
Figure 22A illustrates the results of paleomagnetic mapping of the well geological–geophysical studied area of Mt. Carmel and the adjacent territories of the Galilee and the Mediterranean shelf. Tectonically, this area belongs predominantly to the Galilee–Lebanon terrane and the marginal parts of the Pleshet, Judea–Samaria, and Antilebanon terranes. This area is significant for understanding the Carmel regional magnetic–gravity anomaly (see Figure 5, Figure 9, and Figure 10), the apical part of which almost coincides with the top part of the Carmel Plateau with the hypsometric elevations up to 546 m. The Carmel anomaly (mainly associated with the anomalies from the crystalline basement uplift) signs the southern part of the Galilea–Lebanon terrane, where significant changes in the basement depth and thrust of the ophiolite sheets are developed. The latter includes magmatic complexes and mélange [21].
The second geophysical boundary structure (besides the Carmel anomaly) located near the junction of the Galilea–Lebanon, Antilebanon, and Judea–Samaria terranes is the Malqishon magnetic anomaly (see Figure 3 and Figure 7). We mention these anomalies in connection with the fact that their geological nature, in contrast to the geophysical one, needs to be studied more and requires additional data on paleomagnetic mapping, which is presented below. This mapping became possible due to the attraction of new data on the paleomagnetic, radiochronological, mineral, petrological, and structural–tectonic analysis of the magmatic and sedimentary complexes developed here. In general, the paleomagnetic mapping of this area made it possible to reveal at the surface (and in the subsurface) the outcrops of the paleomagnetic superzones: Gissar, Jalal-1, Jalal-2, Tuarkyr, and Sogdiana-2 (Figure 22A,B).
The data on the Gissar and Jalal-1 superzones (Figure 22A,B) were obtained (in contrast to the areas of the Mt. Hermon and the Makhtesh Ramon depression, where they are developed in outcrops) from the numerous borehole sections, where both the thickness and the radiometric age of these formations were studied. Due to these data, the geological boundary of the Gissar and Jalal-1 superzones was mapped, corresponding to the pinching out of collisional–post-collisional effusive trap strata reaching a thickness of 463 m (Caesarea-3 borehole), and to the east, around the Malqishon magnetic anomaly, probably exceeding 500 m.
The second paleomagnetic phenomenon of the Mt. Carmel region is the development of the Upper Cretaceous (Cenomanian) diamondiferous volcanics of the Jalal-2 superzone, stratigraphically and radiometrically dated both in the natural outcrops and the wells Foxtrot-1, Eliah-1, Carmel-1, and Ein Ha-Shofet [56,98] and outcrops [96,98,99]. It is indicative that the outline and dimensions of the outcropping area of the paleomagnetic Jalal-2 superzone generally coincide with the gravity–magnetic [15,44,113] anomalies of Carmel Mt. and its outskirts.
The data join the deep physical mechanisms of different levels—the mantle plumes from the deep mantle and the movements of the Earth’s crust basement, which are sources of shallow gravity and magnetic anomalies [14]. The Tuarkyr, confined in this area to the Senonian, was developed in the form of insignificant areas at the surface as scattered outcrops of the Bat Shelomo effusive rocks in the south of the Carmel Plateau, having a radiometric age of 82 Ma [96].
The radiometrically dated sills from the Asher-1 borehole [114] and tuffs in the Devorah-2 borehole [115], correspond to the Campanian and Maastrichtian, presenting the other two finds in this superzone. The Late Cretaceous volcanic rocks of the Jalal-2 and Tuarkyr superzones outcropping on the surface in a few areas were studied by the paleomagnetic method [116] and are characterized by a direct polarity (Figure 22).
The Sogdiana-2 paleomagnetic superzone, extending submeridionally concerning the more ancient Mesozoic superzones, occurs discordantly, encompassing from the giant outcrop of the Cenozoic Ash Shaam traps diagonally stretching from the SE to the NW. In this area, the belt of the Cenozoic traps forms the scattered outcrops within the Cretaceous and Paleogene rocks, often combining with them in a narrow space—in the Asher-1 borehole [114]—and even using the ways of introducing the Mesozoic traps, as it was discovered [56] in the field of the Santonian Bat Shelomo volcano.
5.2. Paleomagnetic Mapping in Southern Israel
Makhtesh Ramon Paleomagnetic Map
According to our previous geological–geophysical studies, e.g., [20,57], the Makhtesh Ramon block is a marginal subterrane of the relatively large Negev terrane. This terrane is the extreme southwestern part of the MTB, collisional articulated with the Arabian-Nubian part of Gondwana. This fact explains the greatest complexity of the Ramon subterrane structure, which contains various tectonic–structural elements formed during the pre-collisional, collisional, and post-collision stages of its paleogeodynamics. The subterrane (Figure 23) has a wedge-shaped outline, the narrowed part of which is in the southwest and extends to the northeast.
The paleomagnetic scheme (Figure 23A) and the diagram of the historical and geodynamic reconstructions (Figure 23B) conventionally depict not all subterrane but the edge (outline) of its submerged part corresponding to the erosion–tectonic depression, enclosing outcrops of the Mesozoic rocks (Lower Cretaceous, Jurassic and Triassic) and Late Cenozoic [79]. These rocks are permeated by a variety of Mesozoic traps, whose radiometric ages range from 165.7 to 93.8 Ma [115] and contain the scattered outcrops of the ophiolite plates of the Saharonim basalts [21], the radiometric age of which is refined within 205 and 207 Ma [117]. They correspond in age to the Illawarra-2 superzone, confirming the paleomagnetic studies’ data [118], and determining their normal polarity. Ophiolites meet the accretionary stage associated with the absorption of the Triassic–Jurassic crust of the Levantine part of the Neotethys Ocean in the middle of the Hauterivian (Early Cretaceous) about 133 million years ago in the Levantine phase of tectogenesis [20,23].
The pre-collision formations preceding this phase are represented by the basaltic radial dike swarms of the Omolon-2 and Gissar superzones and the laccolites and stocks of the alkalic olivine gabbro, monzogabbro, and syenites [119,120]. The mentioned magmatic associations are confined to the Gissar superzone and the initial stages of its transition to the Jalal-1 superzone corresponding to the epoch of the tectonic collision—135–125 million years ago.
One of the most significant indicators of this collision is a change in the magmatism nature and bridging with the formation of a folded block structure Makhtesh Ramon. In this erosion–tectonic structure, among the Lower Jurassic sandstones of the Inmar Formation, a unique outcrop of Upper Jurassic (Oxfordian) limestones of the Beer Sheva Formation, penetrated by Lower Cretaceous volcanic rocks, was found [107]. The authors of the abovementioned work explained the presence of this single outcrop by the presence of a graben in which the Oxford limestones were preserved from erosion.
These exotic formations in other areas of Makhtesh Ramon are absent, as well as in the adjacent sections of the Hameishar subterrane and southern Avdat subterrane—in the Nafha-1, Nafha-2, and Avdat-1 boreholes. The Oxford limestones were preserved from erosion only at 30 or more kilometers to the north and northwest—in the sections of the Boqer-1 and Shezaf-1 boreholes [121]. The amplitude of uplift of the Ramon subterrane in the Levantine phase, judging by the thickness of the Upper and partly Middle Jurassic rocks subjected to early secondary erosion, is about 700 m.
As a result of a comprehensive structural–geodynamic analysis [21], the reasons for the anomalous removal to the day surface in the Ma’ale Ha’atzmaut area (see Figure 23A) of blocks of these limestones (tens of meters in size) were identified. This process is due to ascending volcanic movements that have passed through the underthrust zone between the Avdat and Ramon subterranes, where these limestones are submerged under older rocks. This deep removal is significant evidence of the geodynamic intensity of movements of the Levantine phase of tectogenesis [23] at the boundary between Gondwana and the Neotethys Ocean.
During the post-collisional phase, corresponding to the Jalal-1 and Jalal-2 superzones (Figure 23C), the effusive olivine–basalt–basanite–nephelinite association was formed, among which the deep xenoliths are widely developed. They are represented by the mantle dunites, harzburgites, lherzolites, lower crustal gabbroids, and xenoliths of the Upper Proterozoic tuffs [120], various minerals of the diamond-bearing association, and the small diamond crystals themselves [122].

Figure 23.
Makhtesh Ramon geodynamic–paleomagnetic map (see its location in Figure 3) (modified and supplemented after [23]). (A) Geodynamic–paleomagnetic indicators. (B) Geodynamic changes in Makhtesh Ramon subterrane displacement in the Middle Mesozoic. (C) Paleomagnetic scale. (1) Pre-collisional–collisional basalt dikes, (2) post-collisional alkalic olivine basalt flows and volcanoclastic rocks, (3) pre-collisional association of alkalic olivine gabbro, monzogabbro, and syenites, (4) post-collisional association of basanites and nefelinites, (5) quartzitic hexagonal prisms, (6) faults, (7) hypsometric isolines within the Makhtesh Ramon plateau (1–7 from [21,79,119,120,123,124,125,126,127,128,129,130,131,132,133], (8) radiometric age of the magmatic rocks (from [115,117,134], (9) counterclockwise (a) and clockwise (b) rotation of the linear structures (faults, dikes, and volcanic ridges), (10)–(11) magmatic rocks with normal (10), and reversal (11) paleomagnetic polarity (from [118,135,136], (12)–(15) paleomagnetic zonation inside the magmatic complexes: (12) Illawarra, (13) Omolon, (14) Gissar, (15) Jalal.
The paleomagnetic data [118,135,136] and their radiometric and stratigraphic corrections [134] confirmed the belonging of this paleomagnetic stage of the Middle Cretaceous (Aptian–Cenomanian) epoch of the direct geomagnetic field polarity dominance.
The geodynamic processes are of significant interest for the Makhtesh Ramon and its blocks (Figure 23A). For this purpose, we used the analysis of the discontinuities and hypsometry of the plateau framing the canyon itself and outlines of the erosional canyon. The latter is essential because the boomerang-like canyon outlines with a deviation of the southwestern end to the east, and of the northeast end to the west, indicating the rotation of the subterrane in the counterclockwise direction.
At the same time, the highest hypsometric marks exceeding 1000 m are in a narrow zone corresponding to the center rotation of the tectonic block. The cirrus nature of tectonic ruptures, spherical in places with prominent shear–slip elements, confirms the regional nature of the rotation of the structure, mainly in the counterclockwise direction. To analyze the evolution of movements of the Ramon subterrane (Figure 23B), we examined the movement of the radiometrically dated dikes and chains of the effusive rocks displaced from the primary latitudinal orientation. The performed studies showed that during almost the entire Jurassic–Middle Cretaceous stage, the area experienced a movement from the southern side of the Neotethys Ocean to the southwest with a concomitant counterclockwise rotation (except for a part of the Aptian centuries (115–125 Ma ago), when the sublatitudinal post-collisional dikes shifted clockwise).
5.3. Paleomagnetic Mapping as One of the Indicators for Discovering Mantle Rotating Structure below the Easternmost Mediterranean
Twelve independent geological–geophysical indicators discovered the mantle giant rotating structure below the EMM [14], including paleomagnetic parameters. Examples of the primarily counterclockwise rotation were shown in detail for the Sea of Galilee and around it (Figure 19), Hula Basin (Figure 20), Hermon area (Figure 21), Carmel structure (Figure 22), and Makhtesh Ramon area (Figure 23). Besides the small tectonic blocks and dikes, terranes and subterranes mainly rotate counterclockwise, which include these bodies. This fact can be seen in Figure 21B and Figure 23B (Hermon and Makhtesh areas).
In other regions of the EMM, for example, in the Troodos (Cyprus) and Baer-Bassit (Syria), the ophiolite massifs [137] were found where the rocks were subjected to significant counterclockwise rotation. Paleomagnetic reconstructions made it possible to construct visual geodynamic diagrams illustrating the rotation of the structure of Cyprus Island counterclockwise from the Cretaceous to the Late Cenozoic (Figure 24). The analyzed generalization of the numerous paleomagnetic data in the areas mentioned above in Israel and many other areas of the EMM is shown in Figure 25. One of the most essential geodynamic factors is the Anatolian plate’s tectonic knot, confined to the projection of the apical zone of the mantle structure. Here, most of the tectonic blocks, according to GPS data, experience a counterclockwise rotation, e.g., [138]. On the other hand, the data of paleomagnetic studies, e.g., [66,68], are consistent with satellite geodesy data. The coincidence of different methods indicates the relevance and sustainability of the phenomena of regional geodynamics due to deep processes.
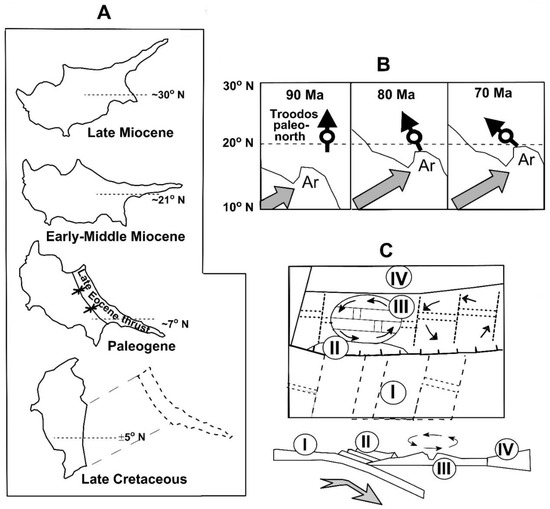
Figure 24.
Geodynamic schemes of Cyprus rotation (Cretaceous–Late Cenozoic). (A) Counterclockwise rotation of Cyprus from Late Cretaceous to Late Miocene according to paleomagnetic data [139], (B) change in the relative position of Cyprus and the African–Arabian Plate of Gondwana paleocontinent in Late Cretaceous according to paleomagnetic data [137], (C) structural–paleogeodynamic reconstruction of Cyprus’ paleostructures within the Late Cretaceous Tethys Paleo Ocean and its frame (after [13]). I, subducting oceanic plate of the southern side of Neotethys; II, ophiolite complex of the Early Mesozoic crust of the Mammonia basin; III, area of spreading zone of Late Cretaceous part of middle Troodos ridge; IV, zone of terranes of the Aegean–Anatolian belt with continental crust.
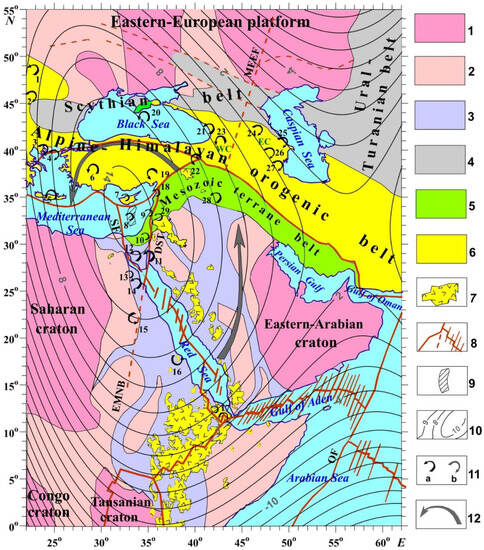
Figure 25.
The tectonic–geophysical sketch map of the African–Arabian junction superimposed on the gravity residual anomaly (modified after [14]). (1) Archean cratons, (2–4) fold belts: (2) Paleo–Middle Proterozoic, (3) Neoproterozoic, (4) Late Paleozoic (Hercynian), (5) Mesozoic terrane belt, (6) Alpine–Himalayan orogenic belt, (7) African–Arabian Late Cenozoic traps, (8) main fault systems, (9) Kiama paleomagnetic hyperzone of inverse polarity [22], (10) isolines of the obtained polynomial regional gravity trend, (11) rotational geodynamic elements derived from the paleomagnetic data; (a) counterclockwise, (b) clockwise, (12) global counterclockwise rotation by the GPS data (modified after [138]).
6. Discussion
The hard-to-explain phenomena of magneto-geophysics prompted the organization of comprehensive research in paleomagnetic mapping aimed at revealing the dynamics and history of the development of structures based on the reconstruction of their paleomagnetic age. The paleomagnetic mapping includes the procedure for paleomagnetic determination of age and the typification of the magnetized objects, making it possible to apply the plate geodynamics concepts widely. It enables us to describe the stages of development of various forms of magmatism under conditions of transition from the ocean to the continent. It should be emphasized that the broad integration of paleomagnetic mapping with other geophysical (e.g., gravity, geothermics, and seismics) and geological methods (firstly, tectonic–structural reconstructions, petrological, and mineralogical analyses) noticeably increases the efficiency of its application.
Quantitative analysis of Carmel (Figure 5) and Rosh-Ha-Ayin (Figure 6) magnetic anomalies indicates that they have the same depth of the upper edge and the same normal vertical (90°) magnetization vector orientation. Besides this, the developed Curie map (Figure 2B) implies that these areas are characterized by the same depth of the Curie discontinuity. These mutual parameters allowed us to conclude that these targets are formed at the same geological time and compose one common geodynamic zone.
The upper edge of the Malqishon anomaly source is at a depth of 4500 m, and magnetization vector inclination is about 105°; the tectonic origin of this anomaly is a discussable one. The advanced analysis of magnetic anomalies in the Sea of Galilee and around it is reliably connected to the paleomagnetic and radiometric analyses that allowed the development of an integrated geological–geophysical scheme of this tectonically complex area.
The combined comprehensive 3D gravity–magnetic modeling in the Carmel area (where the results of quantitative analysis of magnetic anomalies were introduced as a model of a first approximation) gave the possibility to construct a map of the crystalline basement uplift relief (Figure 10). Undoubtedly, this tectonic feature played an essential role in the geodynamics of this complex area.
Tectonic–paleomagnetic mapping as a new geological–geophysical tool contributed to a necessary amendment to understanding the nature and structure of Israel and the EMM. The studied areas in Israel—Makhtesh Ramon, Mt. Carmel, Sea of Galilee, Hula Valley, and Mt. Hermon—are unique objects from the geological point of view, and they are well studied in various ways. However, their geodynamics, structure, and other critical questions of genesis are not clear and inexplicable. Therefore, we decided to apply the combined paleomagnetic mapping to investigate these intricate targets.
Interestingly, by the paleomagnetic mapping examination, a wide diapason of the paleomagnetic data was used: from the Paleozoic (Permian–Carboniferous) Kiama paleomagnetic superzone in the EMM) to the Holocene, an almost modern volcano with the Birkat Ram crater lake in the Golan Heights. It should be accentuated that this study became possible only thanks to the many years of painstaking work of Israeli geologists and geophysicists, who created a vast database of paleomagnetic and radiometric studies as well as geological mapping and tectonic reconstructions for Israel’s territory. Our comprehensive studies in the African–Arabian region of the junction of Eurasia and Gondwana [14,21] with the prevalent application of paleomagnetic mapping techniques are the testing instrument for the combined investigations of geologically complex areas.
It has long been assumed that tectonic movements in the EMM, south of the Aegean–Anatolian Plate, were associated with the transcontinental shears from the Atlantic Ocean [140]. Meanwhile, integrated analysis of numerous geological–geophysical data allowed us to conclude that the main EEM structures are associated not with the mentioned folding but with the Neotethys Ocean’s collision. South of the Alpine orogenic belt, within the Arabian and Sinai lithospheric plates, the Mesozoic terrane belt (MTB) was identified (Figure 25), e.g., [23]. An allochthonous oceanic crust occupies the westernmost part of the mentioned belt. We propose that the collision processes’ features include the influence of a deep giant structure rotating counterclockwise [14]. This rotation indicates that the MTB’s most critical element movement occurred from the northeast to the southwest of the EM. These structural–geodynamic data (in addition to several significant geological–geophysical features) are also confirmed by paleobiogeographic data showing that the allochthonous Jurassic fauna of the Ethiopian province is widely developed in EMM [23]. An important role was the discovery of an ancient block of oceanic crust in the western part of the MTB, corresponding to the reversely magnetized Kiama zone of the Early Permian age (Figure 12, Figure 13, Figure 14, Figure 15 and Figure 17). This block was evidently moved along transform faults from the Neotethys region, roughly relating to the current location of Eastern Arabia. The movement of MTB terranes contributed, for instance, to the formation of Mt. Carmel ophiolites (northern Israel) [57]. In the absorption zone of the EM autochthonous oceanic crust, the Saharonim, Hameishar, and Karkom ophiolites (in/near the Makhtesh Ramon area, southern Israel) arose [23]. Thus, we can conclude that the multi-parametric geophysical–geological assessment (3D magnetic–gravity modeling, paleomagnetic, paleobiogeographic, petrological, and tectonic–structural analyses) unambiguously indicates the allochthonous nature of the MTB and the EM oceanic crust, which moved over more than 1000 km from the northeast.
The detection of the Earth’s crust’s narrow block of reverse magnetization in the Lower Galilea, near Lake Kinneret (Figure 16), according to the recent mineralogical-petrological data [56,58], may correspond to the initial spreading of the Neotethys Ocean (253–283 Ma).
Based on the research conducted, we can conclude the following main items.
Our integrated analysis, based on the plate tectonic concept, testifies that the dominance of the geodynamics of the region in the Mesozoic and Cenozoic was carried out not from the western (Atlantic) but from the eastern (Neothetical) direction. Applying paleomagnetic data with further mapping made it possible to evaluate the previously identified structures of various ranks from the standpoint of statics and geodynamics. This approach is novel due to the optimal combination of various applied geological–geophysical methods.
In this study, for the first time, the paleomagnetic maps were accompanied by the corresponding scales that make these maps more understandable (Figure 19B, Figure 21B, and Figure 22B). Areas of development of the Kinneret (Figure 19A) and Hula (Figure 20) pull-apart basins have been identified, experiencing not only differentiation under the left DST shift conditions but also the formation of the faults and ring structures rotating counterclockwise in the adjacent zones. This phenomenon, previously established in [69,76], was explained by the extended integrated geophysical studies in the region using 3D modeling and structural–geodynamic analysis [14].
The staging of the development of the Negev and Antilebanon terranes (see Figure 1) was substantiated by the example of the Hermon (Figure 21) and Makhtesh Ramon (Figure 23) areas, respectively, at the phases of their existence in the conditions of the oceanic margin in the pre-collisional phase of development, and in the further stages—the collisional development and the post-collision movements. These data indicate that both mentioned terranes and MTB moved in the Mesozoic from the east to the west in a counterclockwise direction.
The paleomagnetic mapping contributed to the finding of an ophiolite complex in the southern framing of the EMM, an area topologically replaced by the MTB in the southern margin of the Neotethys Ocean. The 3D magnetic field modeling [21] indicates that the thickness of the ophiolite complex to the south of the Makhtesh Ramon area reaches 500 m (Figure 11B).
The paleomagnetic data studies in the Carmel area (22A) made it possible to show in a new way that the Triassic–Jurassic ophiolite complex underlying the Aptian–Albian traps of the Mt. Carmel within the Galilea–Lebanon terrane contrasts sharply with the Mesozoic and sedimentary rocks penetrated by traps. These traps’ regional Late Jurassic–Neocomian age precedes the Late Jurassic–Neocomian phase of joining the MTB to the Gondwana.
The paleomagnetic analysis of the oceanic crust of the EMM, where the oldest Kiama hyperzone of inverse polarity was identified [21,22], was cartographically implemented (Figure 17). The map development was based mainly on the correlation with the ophiolites of the neighboring areas of the Galilea–Antilebanon terrane, with the ophiolite plates of the Illawarra, Omolon, and Gissar superzones immediately following in the general paleomagnetic scale after the Kiama superzone. Such an ancient crust has an allochthonous origin, which is evident due to (1) the presence of the Cretaceous ophiolites dominating in the Alpine belt of this junction of Eurasia and Gondwana, and (2) the development of the Neotethys oceanic crust in the very Late Paleozoic (Kiama paleomagnetic chron) to the east of the studied region. These studies open new aspects of the development of the terrane belts in plate tectonics, where both the continental and oceanic terranes are present.
During paleomagnetic mapping, we revealed the phenomenon of changing the strike of magnetoactive bodies of different ages. These bodies represent single linearly oriented structures, i.e., sills, dikes, and their swarms, and larger zones of coeval trap formation.
A difference in the strike of dikes of different ages was revealed in the Antilebanon terrane near Hermon Mt. (Figure 21B) and in the south of the Negev terrane, the Makhtesh Ramon subterrane (Figure 23B). A common feature for both regions is that the older dikes of intrusive traps extend submeridionally. In comparison, the younger dikes extend sublatitudinally, thus fixing the rotation of the terranes counterclockwise by more than 90°.
In Carmel and Galilee, in the junction zone of the Galilee–Lebanon, Antilebanon, Judea–Samaria, and Pleshet terranes (see Figure 1), a rotation of the magnetization zones of the Early, Late Cretaceous, and Late Cenozoic was revealed (Figure 22A). In general, the older traps of the Hissar and Halal-1 superzones of the Late Jurassic-Early Cretaceous extend in the NNE-SW direction, while the younger Halal-2 traps of the Late Cretaceous extend in the direction of NE-SSE. The youngest traps of the Sogdiana-2 zone of the late Cenozoic extend in the direction WNW-ESE, as well as the largest trap zone in the Eastern Mediterranean, Harrat Ash Shaam, to which it belongs. The final moment of the regional paleomagnetic mapping of the Carmel–Galilee region is the fact that from the Early Cretaceous to the Late Cenozoic, this vast zone of the Mesozoic terrane belt was rotated for about 140 Ma by at least 90° counterclockwise.
According to the paleomagnetic mapping, the Cenozoic stage of development in the region observes contrast in terms of discordance of the paleomagnetic structures of the Mesozoic and Cenozoic. This discordance was explained in the light of the latest combined geodynamic studies [14], according to which the axis of the deep mantle structure in the middle of the Cenozoic began to turn more intensively in the counterclockwise direction, which caused the lithospheric plate disruption development, and the formation of the topologically displaced zones of the dike complexes and younger effusive traps.
7. Conclusions
Based on the presented research, we can conclude the following:
- (1)
- The wide application of practical methodologies for the quantitative interpretation of magnetic anomalies in complex geological conditions allows the creation of novel, precise physical–geological models for solving different tectonic, structural, environmental, and other problems;
- (2)
- The paleomagnetic methods have established themselves as powerful tools for geodynamic mapping. At the same time, their effectiveness and significance will be increased by optimal integration with other geological–geophysical methods;
- (3)
- The geodynamic results retrieved from the paleomagnetic data are unique and sometimes cannot be obtained from other geological–geophysical data;
- (4)
- The presented regional tectonic–geodynamic data suggest the need to revise the geodynamic development of the Eastern Mediterranean.
Author Contributions
L.V.E., Y.I.K. and Z.B.-A. made equivalent contributions to all sections of this paper. All authors have read and agreed to the published version of the manuscript.
Funding
This research received no external funding.
Institutional Review Board Statement
Not applicable.
Informed Consent Statement
Not applicable.
Data Availability Statement
The data presented in this study are available on request.
Acknowledgments
The authors would like to thank four anonymous reviewers, who thoroughly reviewed the manuscript, and their critical comments and valuable suggestions were very helpful in preparing this paper.
Conflicts of Interest
The authors declare no conflict of interest.
References
- McKenzie, D. Active tectonics of the Mediterranean region. Geophys. J. Int. 1972, 30, 109–185. [Google Scholar] [CrossRef]
- Khain, V.E. Tectonics of Continents and Oceans; Scientific World: Moscow, Russia, 2001. (In Russian) [Google Scholar]
- Muttoni, G.; Kent, D.V.; Garzanti, E.; Brack, P.; Abrahamsen, N.; Gaetani, M. Early Permian Pangea ‘B’ to Late Permian Pangea ‘A’. Earth Planet. Sci. Lett. 2003, 215, 379–394. [Google Scholar] [CrossRef]
- Stern, R.J.; Johnson, P. Continental lithosphere of the Arabian Plate: A geologic, petrologic, and geophysical synthesis. Earth-Sci. Rev. 2010, 101, 29–67. [Google Scholar] [CrossRef]
- Ben-Avraham, Z.; Schattner, U.; Lazar, M.; Hall, J.K.; Ben-Gai, Y.; Neev, D.; Reshef, M. Segmentation of the Levant continental margin, eastern Mediterranean. Tectonics 2006, 25, TC5002. [Google Scholar] [CrossRef]
- Ben-Avraham, Z.; Ginzburg, A. Displaced terranes and crustal evolution of the Levant and the eastern Mediterranean. Tectonics 1990, 9, 613–622. [Google Scholar] [CrossRef]
- Le Pichon, X.; Kreemer, C. The Miocene-to-present kinematic evolution of the Eastern Mediterranean and Middle East and its implications for Dynamics. Annu. Rev. Earth Planet. Sci. 2010, 38, 323–351. [Google Scholar] [CrossRef]
- Stampfli, G.M.; Hochard, C.; Vérard, C.; Wilhem, C.; von Raumer, J. The formation of Pangea. Tectonophysics 2013, 593, 1–19. [Google Scholar] [CrossRef]
- Bosworth, W.; Huchon, P.; McClay, K. The Red Sea and Gulf of Aden basins. J. Afr. Earth Sci. 2005, 43, 334–378. [Google Scholar] [CrossRef]
- Picard, L. Geology and oil exploration of Israel. Bull. Res. Counc. Isr. 1959, G8, 1–30. [Google Scholar]
- Rotstein, Y.; Ben-Avraham, Z. Active Tectonics in the Eastern Mediterranean: The role of oceanic plateaus and accreted terranes. Isr. J. Earth Sci. 1986, 35, 23–39. [Google Scholar]
- Robertson, A.H.F. Mesozoic-Tertiary tectonic evolution of the easternmost Mediterranean area: Integration of marine and land evidence. In Proceedings of the Ocean Drilling Program, Scientific Results; Robertson, A.H.F., Eneis, K.C., Richter, C., Camerlenghi, A., Eds.; Scientific Results. Ocean Drilling Program: College Station, TX, USA, 1998; Volume 160, pp. 723–782. [Google Scholar]
- Hall, J.K.; Krasheninnikov, V.A.; Hirsch, F.; Benjamini, C.; Flexer, A. Geological Framework of the Levant; Vol. II: The Levantine Basin and Israel; Historical Productions-Hall: Jerusalem, Israel, 2005; 826p. [Google Scholar]
- Eppelbaum, L.V.; Ben-Avraham, Z.; Katz, Y.; Cloetingh, S.; Kaban, M. Giant quasi-ring mantle structure in the African-Arabian junction: Results derived from the geological-geophysical data integration. Geotectonics 2021, 55, 67–93. [Google Scholar] [CrossRef]
- Ben-Avraham, Z.; Hall, J. Geophysical survey of Mount Carmel structure and its extension into the eastern Mediterranean. J. Geophys. Res. 1977, 82, 793–802. [Google Scholar] [CrossRef]
- Eppelbaum, L.; Ben-Avraham, Z.; Katz, Y. Integrated analysis of magnetic, paleomagnetic and K-Ar data in a tectonic complex region: An example from the Sea of Galilee. Geophys. Res. Lett. 2004, 31, L19602. [Google Scholar] [CrossRef]
- Eppelbaum, L.V.; Ben-Avraham, Z.; Katz, Y.I. Structure of the Sea of Galilee and Kinarot Valley derived from combined geological-geophysical analysis. First Break 2007, 25, 21–28. [Google Scholar] [CrossRef]
- Rybakov, M.; Voznesensky, V.; Ben-Avraham, Z.; Lazar, M. The Niklas anomaly southwest of Cyprus: New insights from combined gravity and magnetic data. Isr. J. Earth Sci. 2008, 57, 125–138. [Google Scholar] [CrossRef]
- Eppelbaum, L.V. Comparison of 3D integrated geophysical modeling in the South Caucasian and Eastern Mediterranean segments of the Alpine-Himalayan tectonic belt. Izv. Acad. Sci. Azerb. Rep. Ser. Earth Sci. 2015, 3, 25–45. [Google Scholar]
- Eppelbaum, L.V.; Katz, Y.U.I. Newly Developed Paleomagnetic Map of the Easternmost Mediterranean Unmasks Geodynamic History of this Region. Cent. Eur. J. Geosci. 2015, 7, 95–117. [Google Scholar]
- Eppelbaum, L.V.; Katz, Y.U.I. Paleomagnetic mapping in various areas of the easternmost Mediterranean based on an integrated geological-geophysical analysis. In New Developments in Paleomagnetism Research; Series: Earth Sciences in the 21st, Century; Eppelbaum, L., Ed.; Nova Science Publisher: Hauppauge, NY, USA, 2015; pp. 15–52. [Google Scholar]
- Eppelbaum, L.V.; Nikolaev, A.V.; Katz, Y.I. Space location of the Kiama paleomagnetic hyperzone of inverse polarity in the crust of the eastern Mediterranean. Dokl. Earth Sci. 2014, 457, 710–714. [Google Scholar] [CrossRef]
- Eppelbaum, L.V.; Katz, Y.U.I. Eastern Mediterranean: Combined geological-geophysical zonation and paleogeodynamics of the Mesozoic and Cenozoic structural-sedimentation stages. Mar. Pet. Geol. 2015, 65, 198–216. [Google Scholar] [CrossRef]
- Eppelbaum, L.V.; Katz, Y.U.I. A New Regard on the Tectonic Map of the Arabian-African Region Inferred from the Satellite Gravity Analysis. Acta Geophys. 2017, 65, 607–626. [Google Scholar] [CrossRef]
- Eppelbaum, L.; Katz Yu Klokochnik, J.; Kosteletsky, J.; Zheludev, V.; Ben-Avraham, Z. Tectonic Insights into the Arabian-African Region Inferred from a Comprehensive Examination of Satellite Gravity Big Data. Glob. Planet. Chang. 2018, 171, 65–87. [Google Scholar] [CrossRef]
- Eppelbaum, L.; Katz, Y. Tectonic-Geophysical Mapping of Israel and Eastern Mediterranean: Implication for Hydrocarbon Prospecting. Positioning 2011, 2, 36–54. [Google Scholar] [CrossRef][Green Version]
- Eppelbaum, L.V.; Katz, Y.I. Key Features of Seismo-Neotectonic Pattern of the Eastern Mediterranean. Izv. Acad. Sci. Azerb. Rep. Ser. Earth Sci. 2012, 3, 29–40. [Google Scholar]
- Ben-Avraham, Z.; Ginzburg, A.; Makris, J.; Eppelbaum, L. Crustal structure of the Levant basin, eastern Mediterranean. Tectonophysics 2002, 346, 23–43. [Google Scholar] [CrossRef]
- Eppelbaum, L.V.; Pilchin, A.N. Methodology of Curie discontinuity map development for regions with low thermal characteristics: An example from Israel. Earth Planet. Sci. Lett. 2006, 243, 536–551. [Google Scholar] [CrossRef]
- Eckstein, Y. Review of heat flow data from the Eastern Mediterranean region. Pageoph 1978, 117, 150–159. [Google Scholar] [CrossRef]
- Krasheninnikov, V.A.; Hall, J.K.; Hirsch, F.; Benjamini, H.; Flexer, A. Geological Framework of the Levant; Vol 1: Cyprus and Syria; Historical Productions-Hall: Jerusalem, Israel, 2005. [Google Scholar]
- Ates, A.; Bilim, F.; Buyuksarac, A. Curie point depth investigation of Central Anatolia, Turkey. Pure Appl. Geophys. 2005, 162, 357–371. [Google Scholar] [CrossRef]
- Parasnis, D.S. Principles of Applied Geophysics; Chapman & Hall: London, UK, 1997; 429p. [Google Scholar]
- Eppelbaum, L.V.; Khesin, B.E. Geophysical Studies in the Caucasus; Springer: Heidelberg/Berlin, Germany; New York, NY, USA, 2012; 411p. [Google Scholar]
- Blakely, R.J. Potential Theory in Gravity and Magnetic Applications; Cambridge University Press: Cambridge, UK, 1995; 435p. [Google Scholar]
- Roest, W.R.; Verhoef, J.; Pilkington, M. Magnetic interpretation using the 3-D analytic signal. Geophysics 1992, 57, 116–125. [Google Scholar] [CrossRef]
- Moreau, F.; Gibert, D.; Saracco, G.; Holschneider, M. Identification of sources of potential fields with the continuous wavelet transform—Basic theory. J. Geophys. Res. 1999, 104, 5003–5013. [Google Scholar] [CrossRef]
- Vallée, M.A.; Keating, P.; Smith, R.S.; St-Hilaire, C. Estimating depth and model type using the continuous wavelet transform of magnetic data. Geophysics 2004, 69, 191–199. [Google Scholar] [CrossRef]
- Beiki, M. TSVD analysis of Euler deconvolution to improve estimating magnetic source parameters: An example from the Åsele area, Sweden. J. Appl. Geophys. 2013, 90, 82–91. [Google Scholar] [CrossRef]
- Florio, G.; Fedi, M. Multiridge Euler deconvolution. Geophys. Prospect. 2014, 62, 333–351. [Google Scholar] [CrossRef]
- Eppelbaum, L.V.; Mishne, A.R. Unmanned Airborne Magnetic and VLF investigations: Effective Geophysical Methodology of the Near Future. Positioning 2011, 2, 112–133. [Google Scholar] [CrossRef]
- Eppelbaum, L.V. Quantitative interpretation of magnetic anomalies from bodies approximated by thick bed models in complex environments. Environ. Earth Sci. 2015, 74, 5971–5988. [Google Scholar] [CrossRef]
- Heimann, A.; Steinitz, G.; Mor, D.; Shaliv, G. The Cover Basalt Formation, its age and its regional and tectonic setting: Implications from K-Ar and 40Ar/39Ar geochronology. Isr. J. Earth Sci. 1996, 45, 55–71. [Google Scholar]
- Ginzburg, A.; Eppelbaum, L. A Combined 3-D Interpretation of Carmel Gravity and Magnetic Anomalies; Oilfields Ltd.: Rosh Ha-Ayin, Israel, 1993; pp. 1–42. [Google Scholar]
- Eppelbaum, L.V. Combined interpretation of gravity and magnetic fields over the Rosh-Ha’Ayin structure, Israel. In Trans. of the Conference of the Geological Society of America, North-Central Section; USA Geological Society: Iowa City, IA, USA, 1996; Volume 28, p. 38. [Google Scholar]
- Said, R. (Ed.) The Geology of Egypt; Routledge: London, UK, 2017; 734p. [Google Scholar]
- Eppelbaum, L.; Ben-Avraham, Z.; Katz, Y. Does mantle diapir produce Hebron magnetic anomaly? In Abstracts-Israel Geological Society; Israel Geological Society: Jerusalem, Israel, 2005; p. 26. [Google Scholar]
- Ben-Avraham, Z.; Amit, G.; Golan, A.; Begin, Z.B. The bathymetry of Lake Kinneret and its structural significance. Isr. J. Earth Sci. 1990, 39, 77–84. [Google Scholar]
- Eppelbaum, L.V.; Katz, Y.I.; Ben-Avraham, Z. Advanced combined geophysical-geological mapping of the Sea of Galilee and its vicinity. In Instrumentation and Measurement Technologies for Water Cycle Management; di Mauro, A., Scozzari, S.A., Soldovieri, Eds.; Springer: Berlin/Heidelberg, Germany, 2022; pp. 553–579. [Google Scholar] [CrossRef]
- Folkman, Y.; Yuval, Z. Aeromagnetic Map of Israel, 1:250,000; Israel Institute for Petroleum Research and Geophysics: Holon, Israel, 1976. [Google Scholar]
- Segev, A.; Goldshmidt, V.; Itamar, A.; Rybakov, M. Effects of Mesozoic magmatism on composition, structure, and metallic mineralization in the Ramon area (southern Israel). Magnetometric and gravimetric evidence. Isr. J. Earth Sci. 1996, 45, 89–112. [Google Scholar]
- Rotstein, Y.; Bartov, Y. Seismic reflection across a continental transform: An example from a convergent segment of the Dead Sea rift. J. Geophys. Res. 1989, 94, 2902–2912. [Google Scholar] [CrossRef]
- Rotstein, Y.; Bartov, Y.; Freislander, U. Evidence for local shifting of the main fault and changes in the structural setting, Kinarot basin, Dead Sea transform. Geology 1992, 20, 251–254. [Google Scholar] [CrossRef]
- Ben-Avraham, Z.; ten-Brink, U.; Bell, R.; Reznikov, M. Gravity field over the Sea of Galilee: Evidence for a composite basin along a transform fault. J. Geophys. Res. 1996, 101, 533–544. [Google Scholar] [CrossRef]
- Meiler, M.; Reshef, M.; Shulman, H. Seismic depth-domain stratigraphic classification of the Golan Heights, central Dead Sea Fault. Tectonophysics 2011, 510, 354–369. [Google Scholar] [CrossRef]
- Griffin, W.L.; Gain, S.E.M.; Huang, J.-X.; Belousova, E.A.; Toledo, V.; O’Reilly, S.Y. Permian to quaternary magmatism beneath the Mt Carmel area, Israel: Zircons from volcanic rocks and associated alluvial deposits. Lithos 2018, 314–315, 307–322. [Google Scholar] [CrossRef]
- Eppelbaum, L.V.; Katz, Y.I. Paleomagnetic-geodynamic mapping of the transition zone from ocean to the continent: A review. Appl. Sci. 2022, 12, 5419. [Google Scholar] [CrossRef]
- Lu, J.-G.; Griffin, W.L.; Huang, J.-X.; Dai, H.-K.; Castillo-Oliver, M.; O’Reily, S.Y. Structure and composition of the lithosphere beneath Mount Carmel, North Israel. Contrib. Mineral. Petrol. 2022, 177, 29. [Google Scholar] [CrossRef]
- Irving, E. Paleomagnetism of some Carboniferous rocks from New South Wales and its relation to geological events. J. Geophys. Res. 1966, 71, 6025–6051. [Google Scholar] [CrossRef]
- Eppelbaum, L.; Katz, Y.u. Significant tectono-geophysical features of the African-Arabian tectonic region: An overview. Geotectonics 2020, 54, 266–283. [Google Scholar] [CrossRef]
- Khramov, A.N.; Goncharov, G.I.; Komissarova, R.A.; Pisarevsky, S.A.; Pogarskaya, I.A.; Rzhevsky, Y.U.S.; Rodionov, V.P.; Slauzitais, I.P. Paleomagnetology; Nedra: Leningrad, Russia, 1982. (In Russian) [Google Scholar]
- Opdyke, N.D.; Channell, J.E.T. Magnetic Stratigraphy; International Geophysics Series; Academic Press: Cambridge, MA, USA, 1996; Volume 64, 361p. [Google Scholar]
- Molostovsky, E.A.; Khramov, A.N. Magnetostratigraphy and Its Importance in Geology; Saratov Universtiy: Saratov, Russia, 1997; 180p. (In Russian) [Google Scholar]
- Tauxe, L. Paleomagnetic Principles and Practice; Kluwer Academic Publishers: Boston, NY, USA; Dordrecht, The Netherlands, 1997; 299p. [Google Scholar]
- Duermeijer, C.E.; Nyst, M.; Meijer, P.; Langereis, C.G.; Spakman, W. Neogene evolution of the Aegean arc: Paleomagnetic and geodetic evidence for a rapid and young rotation phase. Earth Planet. Sci. Lett. 2000, 176, 509–525. [Google Scholar] [CrossRef]
- Kaymakci, N.; Langereis, C.; Özkaptan, M.; Özacar, A.A.; Gülyüz, E.; Uzel, B.; Sözbilir, H. Paleomagnetic evidence for upper plate response to a STEP fault, SW Anatolia. Earth Planet. Sci. Lett. 2018, 498, 101–115. [Google Scholar] [CrossRef]
- Lazos, I.; Sboras, S.; Chousianitis, K.; Kondopoulou, D.; Pikridas, C.; Bitharis, S.; Pavlides, S. Temporal evolution of crustal rotation in the Aegean region based on primary geodetically-derived results and palaeomagnetism. Acta Geod. Geophys. 2022, 57, 317–334. [Google Scholar] [CrossRef]
- Van Hinsbergen, D.J.J.; Dekkers, M.J.; Bozkurt, E.; Koopman, M. Exhumation with a twist: Paleomagnetic constraints on the evolution of the Menderes metamorphic core complex, western Turkey. Tectonics 2010, 29, TC3009. [Google Scholar] [CrossRef]
- Nur, A.; Ron, H.; Scott, O. Mechanics of distributed fault and block rotation. In Paleomagnetic Rotations and Continental Deformation; NATO ASI Series: Mathematical and Physical Sciences; Kissel, C., Laj, C., Eds.; Kluwer Academic Publishers: Dordrecht, The Netherlands; Boston, MA, USA; London, UK, 1989; pp. 209–228. [Google Scholar] [CrossRef]
- Garfunkel, Z.; Zak, I.; Freund, R. Active faulting in the Dead Sea Rift. Tectonophysics 1981, 80, 1–26. [Google Scholar] [CrossRef]
- Ben-Avraham, Z.; Shosham, Y.; Klein, E.; Michelson, H.; Serruya, C. Magnetic survey of Lake Kinneret—Central Jordan Valley, Israel. Marine Geophys. Res. 1980, 4, 257–276. [Google Scholar] [CrossRef]
- Eppelbaum, L.V.; Katz, Y.I. Multidisciplinary Geological-Geophysical Analysis Unmasks Anthropological Site Structure in the Northern Part of the Levantine Corridor. J. Anthropol. Archaeol. Sci. 2023, 8, 1056–1078. [Google Scholar] [CrossRef]
- Molostovsky, E.A.; Pechersky, D.M.; Frolov, I.Y. Magnetostratigraphic Timescale of the Phanerozoic and Its Description Using a Cumulative Distribution Function. Izv. Phys. Solid Earth 2007, 43, 811–818. [Google Scholar] [CrossRef]
- Pechersky, D.M.; Lyubushin, A.A.; Sharonova, Z.V. On the synchronism in the events within the core and on the surface of the earth: The changes in the organic world and in the polarity of the geomagnetic field in the Phanerozoic. Izv. Phys. Solid Earth 2010, 46, 613–623. [Google Scholar] [CrossRef]
- Kissel, C.; Laj, C. Paleomagnetic Rotations and Continental Deformation; NATO ASI Series: Mathematical and Physical Sciences; Kluwer Academic Publishers: Dordrecht, The Netherlands; Boston, MA, USA; London, UK, 1989; 530p. [Google Scholar]
- Ron, H.; Freund RGarfunkel, Z.; Nur, A. Block rotation by strike-slip faulting: Structural and paleomagnetic evidence. J. Geophys. Res. 1984, 89P, 6256–6270. [Google Scholar] [CrossRef]
- Heimann, A.; Ron, H. Geometric changes of plate boundaries along part of the Northern Dead Sea transform—Geochronological and paleomagnetic evidence. Tectonics 1993, 12, 477–491. [Google Scholar] [CrossRef]
- Heimann, A. The Development of the Dead Sea Rift and Its Margins in Northern Israel during the Pliocene and Pleistocene. PhD Thesis, Hebrew University, Jerusalem, Israel, 1990. (In Hebrew, Summary in English). [Google Scholar]
- Sneh, A.; Bartov, Y.; Rozensaft, M. Geological Map of Israel, Scale 1:200,000; Geological Survey of Israel; The Ministry of National Infrastructures: Jerusalem, Israel, 1998. [Google Scholar]
- Hurwitz, S.; Garfunkel, Z.; Ben-Gai, Y.; Reznikov, M.; Rotstein, Y.; Gvirtzman, H. The tectonic framework of a complex pull-apart basin: Seismic reflection observations in the Sea of Galilee, Dead Sea transform. Tectonophysics 2002, 359, 289–306. [Google Scholar] [CrossRef]
- Shaliv, G. Stages in the Tectonics and Volcanic History of the Neogene Basin in the Lower Galilee and the Valleys. Ph.D. Thesis, Hebrew University, Jerusalem, Israel, 1991. (In Hebrew, Summary in English). [Google Scholar]
- Heimann, A.; Braun, D. Quaternary stratigraphy of the Kinarot Basin, Dead Sea Transform, northeastern Israel. Isr. J. Earth Sci. 2000, 49, 31–44. [Google Scholar] [CrossRef]
- Segev, A. Zemah-1, a Unique Deep Oil Well on the Dead Sea Fault Zone, Northern Israel: A New Stratigraphic Amendment; Report GSI/21/2017; Geological Survey of Israel: Jerusalem, Israel, 2017; pp. 1–27. [Google Scholar]
- Mor, D. A time-table for the Levant Volcanic Province, according to K-Ar dating in the Golan Heights, Israel. J. Afr. Earth Sci. 1993, 16, 223–234. [Google Scholar] [CrossRef]
- Freund, R.; Oppenheim, M.J.; Schulman, N. Direction of magnetization of some basalts in the Jordan Valley and Lower Galilee (Israel). Isr. J. Earth Sci. 1965, 14, 37–74. [Google Scholar]
- Nur, A.; Helsey, C.F. Palaeomagnetism of Tertiary and Recent lavas of Israel. Earth Planet. Sci. Lett. 1971, 10, 375–379. [Google Scholar] [CrossRef]
- Dembo, N.; Hamiel, Y.; Granot, R. Intraplate Rotational Deformation Induced by Faults: Carmel-Gilboa Fault System as a Case Study; Report No. GSI/19/2015; Geological Survey of Israel: Jerusalem, Israel, 2015; 32p. [Google Scholar]
- Behar, G.; Shaar, R.; Tauxe, L.; Asefaw, H.; Ebert, Y.; Heimann, A.; Koppers, A.A.P.; Ron, H. Paleomagnetism and paleosecular variations from the Plio-Pleistocene Golan Heights volcanic plateau, Israel. Geochem. Geophys. Geosystems 2019, 20, 4319–4334. [Google Scholar] [CrossRef]
- Eppelbaum, L.V.; Katz, Y.I.; Ben-Avraham, Z. Israel—Petroleum Geology and Prospective Provinces. AAPG Eur. Newsl. 2012, 4, 4–9. [Google Scholar]
- Shimron, A.E. Tectonic Evolution of the Southern Mount Hermon; Report GSI/10/98; Geological Survey of Israel: Jerusalem, Israel, 1998. [Google Scholar]
- Shimron, A.E.; Peltz, S. Early Cretaceous Pyroclastic Volcanism on the Hermon Range; Geological Survey of Israel; Bulletin: Jerusalem, Israel, 1993; Volume 84, p. 43. [Google Scholar]
- Mor, D.; Mihelson, H.; Druckman, Y.; Mimran, Y.; Heimann, A.; Goldberg, M.; Sneh, A. Notes on the Geology of Golan Heights; Report GSI/15/97; Geological Survey of Israel: Jerusalem, Israel, 1997; pp. 1–18. [Google Scholar]
- Shimron, A.E.; Lang, B. New Geological Data and K-Ar Geochronology of the Magmatic Rocks on the Southeast Flanks of Mount Hermon; Report GSI/41/88; Geological Survey of Israel: Jerusalem, Israel, 1989. [Google Scholar]
- Lang, B.; Shimron, A.E. New K-Ar Data of the Mount Hermon Mesozoic Magmatic Rocks; Report GSI/26/91; Geological Survey of Israel; Ministry of Energy and Infrastructure, Ministry of Energy Resources Division: Jerusalem, Israel, 1991. [Google Scholar]
- Wilson, M.; Shimron, A.E.; Rosenbaum, J.M.; Preston, J. Early Cretaceous magmatism of Mount Hermon, Northern Israel. Contrib. Mineral. Petrol. 2000, 139, 54–67. Available online: https://www.researchgate.net/journal/Contributions-to-Mineralogy-and-Petrology-1432-0967 (accessed on 17 July 2023). [CrossRef]
- Segev, A.; Lang, B. 40Ar/39Ar dating of Valanginian top Tayasir Volcanics in the Mount Hermon area, northern Israel. Israel Geological Survey. Curr. Res. 2002, 13, 100–104. [Google Scholar]
- Segev, A.; Lang, B. 40Ar/39Ar Dating of top Early Cretaceous Tayasir Volcanics in the Mount Hermon Area; Israel Geological Society: Jerusalem, Israel, 2002. [Google Scholar]
- Segev, A. 40Ar/39Ar and K-Ar geochronology of Berriasian-Hauteririan and Cenomanian tectomagmatic events in northern Israel: Implications for regional stratigraphy. Cretac. Res. 2009, 30, 818–828. [Google Scholar] [CrossRef]
- Segev, A.; Sass, E. The Geology of the Carmel Region, Albian-Turonian Volcano-Sedimentary Cycles on the Northwestern Edge of the Arabian Platform; Geological Survey of Israel: Jerusalem, Israel, 2009; pp. 1–77. [Google Scholar]
- Frank, U.; Schwab, M.J.; Negendank, J.F.W. A lacustrine record of paleomagnetic secular variations from Birkat Ram, Golan Heights (Israel) for the last 4400 years. Phys. Earth Planet. Inter. 2002, 133, 21–34. [Google Scholar] [CrossRef]
- Lang, B.; Mimran, Y. An Early Cretaceous volcanic sequence in central Israel and its significance to the absolute date of the base of the Cretaceous. J. Geol. 1985, 93, 179–184. [Google Scholar] [CrossRef]
- Garfunkel, Z.; Almagor, G. Geology and structure of the continental margin off northern Israel and the adjacent part of the Levantine basin. Mar. Geol. 1985, 62, 105–131. [Google Scholar] [CrossRef]
- Gvirtzman, G.; Steinitz, G. The Asher Volcanics—An Early Jurassic event in the northern Israel. Curr. Res. 1983, 28–33. Available online: https://pascal-francis.inist.fr/vibad/index.php?action=getRecordDetail&idt=9601477 (accessed on 24 July 2023).
- Garfunkel, Z. Tectonic setting of Phanerozoic magmatism in Israel. Isr. J. Earth Sci. 1989, 38, 51–74. [Google Scholar]
- Gvirtzman, G.; Klang, A.; Rotstein, Y. Early Jurassic shield volcano below Mount Carmel: New interpretation of the magnetic and gravity anomalies and implication for Early Jurassic rifting. Isr. J. Earth Sci. 1990, 39, 149–159. [Google Scholar]
- Dvorkin, A.; Kohn, B.P. The Asher volcanics, northern Israel: Petrography, mineralogy, and alteration. Isr. J. Earth Sci. 1989, 38, 105–123. [Google Scholar]
- Garfunkel, Z.; Derin, B. Reevaluation of the latest Jurassic-Early Cretaceous history of the Negev and the role of magmatic activity. Isr. J. Earth Sci. 1988, 37, 43–52. [Google Scholar]
- Esperanca, S.; Garfunkel, Z. Ultramafic xenoliths from the Mt. Carmel area (Karem Maharal volcano), Israel. Lithos 1986, 19, 43–49. [Google Scholar] [CrossRef]
- Mittlefehldt, D.W. Petrology of high pressure clinopyroxenite series xenoliths, Mount Carmel, Israel. Contrib. Mineral. Petrol. 1986, 94, 245–252. [Google Scholar] [CrossRef]
- Apter, D.B. High pressure indicator minerals from the Rakefet magmatic complex (RMC). Mt. Carmel, Israel. In Proceedings of the Kimberley Diamond Symposium, Kimberley, South Africa, 11–14 September 2014. [Google Scholar]
- Kaminchik, J.; Segev, A.; Katzir, Y. The Origin of Intraplate Alkaline Mafic Magmatism in Continental Shelves: Lavas and Xenoliths from the Upper Cretaceous Volcanos of Mt Carmel. Master’s Thesis, Beer-Sheva University: Be’er Sheva, Israel, 2014; Unpublished. [Google Scholar]
- Dobrzhinetskaya, L.; Mukhin, P.; Wang, Q.; Wirth, R.; O’Bannon, E.; Zhao, W.; Eppelbaum, L.; Sokhonchuk, T. Moissanite (SiC) with metal-silicide and silicon inclusions from tuff of Israel: Raman spectroscopy and electron microscope studies. Lithos 2018, 310–311, 355–368. [Google Scholar] [CrossRef]
- Folkman, Y. Magnetic and Gravity Investigations of the Crustal Structure in Israel. PhD Thesis, Tel Aviv University, Tel Aviv, Israel, 1976. (In Hebrew, English Abstract). [Google Scholar]
- Ilani, S.; Kafri, U.; Harlavan, Y. Campanian volcanism within the Asher-1 borehole. Isr. J. Earth Sci. 2005, 54, 179–181. [Google Scholar] [CrossRef]
- Lang, B.; Steinitz, G. K-Ar dating of Mesozoic magmatic rocks in Israel: A review. Isr. J. Earth Sci. 1989, 38, 89–103. [Google Scholar]
- Segev, A.; Sass, E.; Ron, H.; Lang, B.; Kolodny, Y.; McWilliams, M. Stratigraphic, geochronologic, and paleomagnetic constraints on Late Cretaceous volcanism in northern Israel. Isr. J. Earth Sci. 2002, 51, 297–309. [Google Scholar] [CrossRef]
- Segev, A. Synchronous magmatic cycles during the fragmentation of Gondwana: Radiometric ages from the Levant and other provinces. Tectonophysics 2000, 325, 257–277. [Google Scholar] [CrossRef]
- Baer, G.; Heimann, A.; Eshet, Y.; Weinberger, R.; Mussett, A.; Sherwood, G. The Saharonim Basalt: A Late Triassic—Early Jurassic intrusion in southeastern Makhtesh Ramon, Israel. Isr. J. Earth Sci. 1995, 44, 1–10. [Google Scholar]
- Yudalevich, Z.A.; Fershtater, G.B.; Eyal, M. Magmatism of Makhtesh-Ramon: Geology, geochemistry, petrogenesis (Conservation area Har Ha-Negev, Israel). Lithosphere 2014, 3, 70–92. (In Russian) [Google Scholar]
- Yudalevich, Z.; Vapnik, E. Xenocrysts and megacrysts of alkali-olivine-basalt-basanite-nephelinite association of Makhtesh Ramon (Israel): Interaction with transporting magmas and morphological adjustment. Lithosphere 2018, 18, 70–92. (In Russian) [Google Scholar] [CrossRef]
- Fleischer, L.; Varshavsky, A. A Lithostratigraphic Data Base of Oil and Gas Wells Drilled in Israel; Report OG/9/02; Ministry of National Infrastructure of Israel: Jerusalem, Israel, 2012. [Google Scholar]
- Eppelbaum, L.V.; Vaksman, V.L.; Kouznetsov, S.V.; Sazonova, L.M.; Smirnov, S.A.; Surkov, A.V.; Bezlepkin, B.; Katz, Y.; Korotaeva, N.N.; Belovitskaya, G. Discovering of microdiamonds and minerals-satellites in Canyon Makhtesh Ramon (Negev desert, Israel). Dokl. Earth Sci. 2006, 407, 202–204. [Google Scholar] [CrossRef]
- Garfunkel, Z.; Katz, A. New magmatic features in Makhtesh Ramon, southern Israel. Geol. Mag. 1967, 104, 608–629. [Google Scholar] [CrossRef]
- Zak, I. Geological Map of Israel (1:20,000); Israel Geological Survey: Malkhey Israel, Israel, 1968. [Google Scholar]
- Baer, G.; Reches, Z. Mechanics of emplacement and tectonic implications of the Ramon dike systems, Israel. J. Geophys. Res. 1991, 96, 11895–11910. [Google Scholar] [CrossRef]
- Baer, G. Flow directions in sills and dikes and formation of cauldrons in eastern Makhtesh Ramon. Isr. J. Earth Sci. 1993, 42, 133–148. [Google Scholar]
- Avni, Y. Har Loz, Sheet 21-III. Geological Map of Israel 1:50,000; Geological Survey of Israel: Jerusalem, Israel, 2001. [Google Scholar]
- Zilberman, E.; Avni, Y. The Geological Map of Israel, 1:50,000. Sheet 21-I; Israel Geological Survey: Jerusalem, Israel, 2004. [Google Scholar]
- Zilberman, E.; Avni, Y. The Geological Map of Israel, 1: 50,000. Sheet 21-II: Mizpe Ramon; Israel Geological Survey: Jerusalem, Israel, 2004. [Google Scholar]
- Vapnik, Y.; Sharygin, V.; Samoilov, V.; Yudalevich, Z. The petrogenesis of basic and ultrabasic alkaline rocks of Western Makhtesh Ramon, Israel: Melt and fluid inclusion study. Int. J. Earth Sci. 2007, 96, 663–684. [Google Scholar] [CrossRef]
- Avni, Y.; Bartov, Y.; Shen, A. Har Ardon, Sheet 22-I. Geological Map of Israel 1:50,000; Geological Survey of Israel: Jerusalem, Israel, 2016. [Google Scholar]
- Avni, Y.; Beker, A.; Zilberman, E. Be’erot Oded, Sheet 21-IV. Geological Map of Israel 1:50,000; Geological Survey of Israel: Jerusalem, Israel, 2017. [Google Scholar]
- Baer, Y.; Soudry, D.; Bar, O.; Shen, A. Zofar, Sheet 22-III, IV. Geological Map of Israel 1:50,000; Geological Survey of Israel: Jerusalem, Israel, 2017. [Google Scholar]
- Segev, A.; Weissbrod, T.; Lang, B. 40Ar/39Ar dating of the Aptian-Albian igneous rocks in Makhtesh Ramon (Negev, Israel) and its stratigraphic implications. Cretac. Res. 2005, 26, 633–656. [Google Scholar] [CrossRef]
- Ron, H.; Baer, G. Paleomagnetism of Early Cretaceous rocks from southern Israel. Isr. J. Earth Sci. 1988, 37, 73–81. [Google Scholar]
- Gvirtzman, G.; Weissbrod, T.; Baer, G.; Brenner, J. The age of Aptian stage and its magmatic events: New Ar-Ar ages and paleomagnetic data from the Negev, Israel. Cretac. Res. 1996, 17, 293–310. [Google Scholar] [CrossRef]
- Morris, A.; Erson, M.W.; Robertson, A.H.; Al-Riyami, K. Extreme tectonic rotations within an eastern Mediterranean ophiolite (Baer–Bassit, Syria). Earth Planet. Sci. Lett. 2002, 202, 247–261. [Google Scholar] [CrossRef]
- Reilinger, R.; McClusky, S.; Vernant, P.; Lawrence, S.; Ergintav, S.; Cakmak, R.; Ozener, H.; Kadirov, F.; Guliev, I.; Stepanyan, R.; et al. GPS constraints on continental deformation in the Africa-Arabia-Eurasia continental collision zone and implications for the dynamics of plate interactions. J. Geophys. Res. 2006, 111, BO5411. [Google Scholar] [CrossRef]
- Borradaile, G.J.; Lagroix, F.; Hamilton, T.D.; Trebilcock, D.A. Ophiolite tectonics, rock magnetism and paleomagnetism, Cyprus. Surv. Geophys. 2010, 31, 285–359. [Google Scholar] [CrossRef]
- Neev, D. Tectonic evolution of the Middle East and the Levantine Basin (easternmost Mediterranean). Geology 1975, 3, 683–686. [Google Scholar] [CrossRef]
Disclaimer/Publisher’s Note: The statements, opinions and data contained in all publications are solely those of the individual author(s) and contributor(s) and not of MDPI and/or the editor(s). MDPI and/or the editor(s) disclaim responsibility for any injury to people or property resulting from any ideas, methods, instructions or products referred to in the content. |
© 2023 by the authors. Licensee MDPI, Basel, Switzerland. This article is an open access article distributed under the terms and conditions of the Creative Commons Attribution (CC BY) license (https://creativecommons.org/licenses/by/4.0/).