Abstract
Laser ablation of a bulk graphite target in water using femtosecond laser pulses (pulse width ≤ 190 fs) was performed to investigate the synthesis of polyynes and carbon-based nanomaterials and compare them with the well-studied cases of longer pulse (picosecond or nanosecond) ablations. The laser ablation products were characterized using UV-vis absorption spectroscopy, Raman spectroscopy, X-ray diffraction, and transmission electron microscopy, whereas the induced plasma plumes were characterized using laser-induced breakdown spectroscopy. Carbon-based nanomaterials and short-chain polyynes (C6H2 and C8H2) are formed in the solutions as proven by their characteristic absorption band at ~262 nm and peaks in the region of 190–240 nm as well as at around 2100 cm−1 in the Raman spectra, respectively. Polyynes (C8H2) are present in the solutions that are produced under an ablation that is carried out in two intervals with a short pause between them, which is contrary to a continuous ablation that is performed for the same total time duration. The ablation products have a hexagonal graphite crystal structure. The carbon-based nanomaterials consist of large non-spherical and small spherical nanoparticles as well as sheet-like structures. The results of the study were compared with previous studies and discussed based on those studies.
1. Introduction
Laser ablation of a bulk graphite target in water leads to the synthesis of carbon-based nanomaterials (NMs) (C-NMs), such as carbon nanoparticles (NPs) (CNPs), graphene quantum dots (GQDs), graphene layers, and others; also, the process leads to hydrogen-terminated polyynes [1,2,3,4]. Polyynes are molecular compounds consisting of chains of sp-hybridized carbon atoms with alternating single and triple bonds (a series of consecutive alkynes [(-C≡C-)n] with n > 1) that are end-capped by hydrogen atoms. Methyl [CH3]-terminated polyynes have also been observed to be formed but with a probability that is lower by almost two orders of magnitude compared with that of hydrogen-terminated polyynes [4,5]. Polyynes exhibit a semiconducting behavior that depends on the end groups. The synthesis of C-NMs and polyynes by laser ablation of a bulk graphite target in water has been well-investigated in the case of using nanosecond (ns) or picosecond (ps) laser sources for ablation. These carbon nanostructures have excellent electronic, optical, and mechanical properties and a potential applicability in optoelectronics, biosensing, organic electronics, nanocomposites, and other fields [2,4]. A straightforward and easy method to identify them is by using UV-vis absorption spectrophotometry measurements of the produced solutions; short chain polyynes produce a series of sharp peaks in the spectra in the region of ~190–240 nm, whereas C-NMs produce wider bands in the region of ~240–300 nm [2,3,4].
Early studies of the laser ablation of a bulk graphite target in water for polyyne and NM synthesis showed that, upon ns laser ablation (5, 6, or 7 ns; 1064, 532, 355, or 266 nm; 10 Hz; 0.4–5.1 J/cm2; irradiation time of 5–60 min), short-chain polyynes (C6H2, C8H2, and C10H2) were synthesized [6,7,8]; meanwhile, the efficiency of the shorter chain polyyne formation was enhanced while ablating the target in an acidic solution compared with a basic solution due to the higher H+ concentration that occurred as a result of the faster chain growth termination [9]. A background residual absorption in the UV-vis absorption spectra was attributed to the formation of carbon-based NPs in addition to the polyynes [6]. Subsequent studies showed that upon the ns laser ablation (5 ns/532 nm/10 Hz) of highly oriented pyrolytic graphite (HOPG) in water with fluences below ~6 J/cm2, only polyynes (C8H2 and C6H2) were formed, whereas with fluences above ~6 J/cm2, C-NMs (reduced graphene oxide (rGO) layers) were also formed together with the polyynes [10]. A study of the laser ablation of HOPG in water using a fs laser source (35 fs/800 nm/1 kHz) had presented UV-vis absorption spectrophotometry spectra where, for a fluence of 25 J/cm2, C-NMs in the form of GQDs and porous graphene (PG) nanosheets were formed in the solution [11]. More recently, a ns laser ablation (6 ns/532 nm/10 Hz) of graphite in water with a fluence of 0.4 J/cm2 led to the synthesis of C-NMs (nanosheets, nanospheres, nanotubes, and nano-necklaces) (absorption peak at ~266 nm) without the presence of any peaks from polyynes in the spectra [1]. Upon the ps laser ablation (700 ps/1064 nm) of a graphite target in water with fluences in the region of 0.41–0.95 J/cm2, C-NMs in the form of CNPs (mean size of around 18 nm) were formed for a pulse repetition rate of 7 kHz, but no polyynes were formed; meanwhile, for higher rate of 10 kHz, polyynes were also formed together with the carbon nanostructures [12]. Additionally, fs laser irradiation (120 fs/800 nm/700 μJ) of HOPG in a vacuum (no liquid) showed that mainly polyynes and cumulenes [(=C=C=)n] were formed at the central ablated area where the fluence was maximum; outside of that area, at the perimeter of the crater corresponding to a lower fluence (due to the Gaussian intensity profile of the laser beam), mainly nanodiamonds (NDs) and some trans-polyacetylenes were formed [13].
The generally accepted polyyne formation mechanism involves the polymerization reaction of single carbon atoms (C1 or CI or C), carbon dimer radicals (C2), or larger radicals (Cm). This process starts with the addition to a Cm (for m ≥ 1) of either the direct addition of C2 or two C1 atoms sequentially added in two steps of one C1 [14]. The processes of the addition of C2 or C1 to the Cm (first step of the reaction) have equal probabilities of occurring. Along with the chain elongation that is due to polymerization, there is a competing hydrogenation process that finally terminates the chain growth by its hydrogen or radical (R) end-capping. The carbon radicals needed for the chain growth are supplied by the ablation of the material during the formation of the plasma plume, whereas the hydrogen atoms are supplied by the vaporization or decomposition of water at the plume–water interface because of the high temperature of the plasma plume. It is also believed that the formation of polyynes occurs within the plasma plume [4,14].
The ultrafast deposition of laser energy into the material in the case of a fs pulse laser ablation results in the ablation of the material via a direct solid-to-gas transition (sublimation) for fluences that are close to the ablation threshold of the material; this is contrary to the case of a ns pulse laser ablation, where the material is ablated via a solid-to-liquid-to-gas transition (melting and vaporization) [15]. However, even in the case of a fs ablation for fluences that are far above the ablation threshold of the material, there is also a contribution to the material’s sublimation ablation mechanism in the form of melting and a small percentage of NPs (usually the bigger NPs) corresponding to melted droplets that are directly ejected from the melt pool.
Furthermore, the use of fs pulses compared with ns or ps pulses avoids a secondary interaction of the ablating laser pulse with the plasma plume from the material (plasma heating effects), as in this case, the pulse width remains much smaller compared with the plume formation starting time (usually in 1–10 ps time frame); the time interval between successive pulses is much larger than the plume lifetime (usually in the order of a few hundred nanoseconds) in the case of multipulse ablation, even for pulse repetition rates as high as 6 kHz (interval between the pulses ≈ 167 μs) (as will be presented later in the paper). However, in the case of a high pulse repetition rate ablation, and depending on the pulse energy, there may be an interaction between the laser pulses and the NPs during their growth, coalescence, and especially ripening within the cavitation bubble (the cavitation bubble lifetime could range from a hundred to a few hundred microseconds) [4].
In the field of laser synthesis and the processing of colloids, the interaction mechanism of a laser beam with the material being placed in liquid for a certain laser fluence mainly depends on the following: In the field of laser synthesis and the processing of colloids, the interaction mechanism of a laser beam with the material being placed in liquid for a certain laser fluence mainly depends on the following: in the case of a bulk material (target) that is immersed in the liquid, the laser pulse duration in relation to the electron−phonon coupling time constant of the material; in the case of a material in the form of micro/nanoparticles (M/NPs) that are suspended in the liquid, it also depends on the particle size through the dependence of the absorption and scattering cross-sections of the particle on it, which in turn determines the amount of energy that is absorbed by the particle [16]. Thus, in the case of a fs laser irradiation, for a certain laser fluence, for particles whose size is such that the energy that is absorbed by them lies close to that corresponding to their ablation threshold, they are ablated via a Coulomb explosion (particle disintegration due to the buildup of electrostatic charge); meanwhile, for particles whose size is such that the energy that is absorbed by them is much larger than that corresponding to their ablation threshold, they are ablated via photothermal surface vaporization (heating-melting-vaporization).
Laser ablation of a bulk target material (A) in an NP colloidal solution of another material (B) usually leads to the synthesis of core–shell NPs of the B@A type because the NPs of B act as the nucleation sites for the ablated material A [17].
Optical spectroscopy of the photon emission from electronically excited plasma plume species (atoms, ions, or molecules) during the expansion of the plume, which is termed as laser-induced breakdown spectroscopy (LIBS), and particularly time-resolved dynamics help to provide information about the formation of plasma plume species and the chemistry of the plume and allow for the determination of characteristic parameters of the plume, such as plasma temperature and electron density, that critically determine the mechanisms of synthesis of NPs or NMs and other species by laser ablation of a bulk target material [18]. From an LIBS analysis of the temporal evolution of the Swan band of C2 molecules and that of the continuum background radiation during ns UV laser ablation (5 ns/355 nm/10 Hz/80 mJ) of pyrolytic graphite in water that lead to the synthesis of NDs, it was concluded that the NMs were growing in a very narrow temporal window at the early stages of the plasma process (time < 125 ns) and during the fulfilment of the thermodynamic conditions of pressure and temperature in the plume for diamond growth [19]. Nanosecond laser ablation of graphite in water using a UV wavelength (193 nm) leads to the production of mostly NDs that also have much smaller sizes when compared with those created by ablation using an IR wavelength (1040 nm) where, additionally to the NDs, other carbon-based nanostructures such as C8 and n-diamond are also produced [20].
This study deals with the fs laser ablation of a bulk graphite target in water for NM and polyyne synthesis. Although there are a large number of papers in the literature about the formation of polyynes by laser ablation in liquids, there is still not any direct experimental evidence reported about their formation by the fs laser ablation of a bulk graphite target in water. The produced solutions were analyzed using UV-vis absorption spectroscopy. The solutions dried out on glass substrates were analyzed using X-ray diffraction (XRD) and Raman spectroscopy and on carbon-coated copper grids using transmission electron microscopy (TEM). The optical emission spectra of the ablation plume were measured using LIBS. The results are discussed and compared with results from relevant literature studies.
2. Materials and Methods
The fs laser sources that were used in this work for polyyne and NM synthesis by laser ablation of the bulk target material in liquid had a beam wavelength/pulse width/pulse repetition rate/focused beam diameter on the sample surface of either 800 nm/90 fs/1 kHz/~36 μm or 343 nm/190 fs/1–6 kHz/~7 μm. The UV wavelength was obtained by converting the fundamental IR laser beam wavelength (1030 nm) using a standard optical setup consisting of BBO crystals, half- and quarter-waveplates, and mirrors. The bulk target material was a piece of pyrolytic graphite (dimensions of 10 × 10 × 2-mm) and was ablated while lying at the bottom of a beaker filled with deionized (DI) water (Sigma-Aldrich (St. Louis, MO, USA) 38796-1L). The liquid volume in the beaker was kept to the minimum possible volume of ~3 mL to also ensure a minimum liquid height above the target surface of ~1 mm, thus avoiding the induction of non-linear optical effects of self-focusing and filamentation in the liquid by the laser beam. The beam was vertically impinging onto the horizontally lying target at the bottom of the beaker, and it scanned the target surface under the stationary beam in a meandering fashion (5 mm length, 0.01 mm pitch, and 1 mm/s scanning speed) using a computer-controlled translational stage. The optical emission spectrum of the laser ablation plasma plume was measured by collecting the plume emission light using an achromatic lens positioned at a 45° angle relative to the normal and by focusing it at the entrance of an optical fiber that was coupled to an echelle spectrometer (Andor Mechelle (Oxford Instruments, Abingdon, UK) 5000) equipped with a gateable, intensified charge-coupled device (ICCD) camera (iStar 334T, (Oxford Instruments, Abingdon, UK)). The ICCD camera detector was synchronized with the trigger of the laser pulse using a digital delay generator (AtomTrace (Brno-Královo Pole, Czech Republic), AC-DDG-4). The time delay of the ICCD (td) was chosen to be between 2 and 50 ns, the gate window (tw) between 100 and 200 ns, the number of pulses for each shot between 1000 and 6000 (corresponding to the laser pulse repetition rate), the number of accumulations for each shot between 1 and 50, and the spectral resolution to be 0.1 nm to maximize the signal-to-noise ratio (SNR) in the measured spectra. All spectral measurements were completed soon after starting the ablation (typically within the first minute or earlier). For comparison purposes, experiments were also performed on the target in ambient air using the same ablation and detetion parameters. Following ablation of the target in liquid, the produced solutions were characterized using UV-vis absorption spectroscopy. The ablation products from solution droplets that were dried out on carbon-coated grids were characterized using TEM, whereas those obtained from droplets that were dried out on clean glass substrates were characterized using XRD, a diffractometer with a Cu Kα source (λ = 1.5406 Å), and Raman spectroscopy (excitation beam wavelength of 532 nm, power < 0.06 mW). The emission lines in the LIBS spectra were identified using the NIST database [21] and Plasus SpecLine software Version 2.1.
3. Results and Discussion
The fs laser beam travels through the water layer that is transparent to its wavelength and lies above the surface of the target material. The beam is focused onto the surface of the material, the material is ablated, and a plasma plume is formed, which consists of carbon species from the target material (ions, atoms, or clusters). The plasma plume appears as a small volume of intense white light on the target surface, and this light is concentrated at the laser beam’s focal point. Shock waves are also generated. Due to the high temperature of the plume at the plume–liquid interface, the liquid can be vaporized or even decomposed (atomized or ionized) and can be converted into water vapor, molecular/atomic oxygen or hydrogen, or radicals (water plasma). A cavitation bubble is generated, which consists of the vaporized liquid, and the bubble surrounds the plasma plume from the ablated material. The oxygen and hydrogen species can react with the carbon plasma species at the region of the interface, be mixed with the carbon plume plasma, and interact with its species in the volume of the ablation plume; alternatively, the species can interact with ablated material that is in the form of hot gas in the volume of the cavitation bubble. In the present case, because of the fs pulse, there is no plasma heating effect as in the case of using ns or ps pulses. The NPs start to form by nucleation in the plasma plume from the material under the conditions of supersaturation, which is followed by their growth and coalescence in the plasma plume and cavitation bubble. It is generally believed that the polyynes are formed in the plasma plume [4].
3.1. UV-Vis Spectrophotometry
UV-vis absorption spectra from the solutions produced by 800 nm/90 fs/1 kHz laser ablation for different fluences (pulse energies) of 4 (40), 11 (110), and 20 (200) J/cm2 (μJ) (30 min ablation time) and those produced by 343 nm/190 fs/1 or 6 kHz/98 or 80 μJ laser ablation are shown in Figure 1a,b.
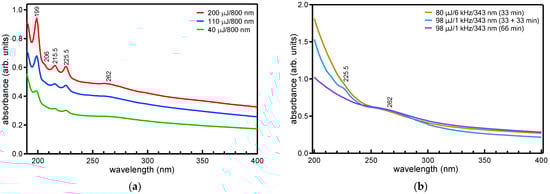
Figure 1.
UV-vis absorption spectra of the produced solutions corresponding to the 800 (a) and 343 nm (b) ablation.
In the case of the 343 nm ablation, due to the shorter laser beam wavelength, the focus beam diameter on the target surface (~7 μm) becomes much smaller than in the case of 800 nm ablation; this results in the application of a much higher fluence, even for a relatively small pulse energy (250 and 200 J/cm2 for the above pulse energies, respectively). The implication of this fact on the production yield of polyynes will be discussed later. Considering the 800 nm ablation, absorption peaks appear for all fluences in the UV region of the spectra, which correspond to the allowed electric dipole transitions of hydrogen terminated polyynes from the ground state to the excited state (1Σu+ ← X 1Σg+). Particularly, peaks due to C8H2 are observed at 225.5, 215.5, and 206 nm, respectively, and C6H2 peaks are observed at 199 nm [22]. Absorption peaks from the longer chain polyyne C8H2 are observed at higher wavelengths compared with those from the shorter chain polyyne C6H2 due to the decrease in the HOMO-LUMO gap of the polyyne with the increase in its length [23,24].
Contrary to the 800 nm ablation, no polyyne peaks are observed in the spectra corresponding to the 343 nm ablation that was carried out at 80 μJ/6 kHz and 98 μJ/1 kHz continuously for 33 and 66 min, respectively (Figure 1b), indicating that polyynes are not formed under these conditions of ablation. However, a weak peak from polyynes, particularly from the longer chain C8H2 polyyne at 225.5 nm, is distinguished in the spectrum of the solution that was produced at 98 μJ/1 kHz, not under a continuous 66 min ablation, but carried out instead in two intervals of 33 min each with a pause of ablation for ~5 min between them. These findings can be understood when considering the interaction of the ablating laser beam with the synthesized polyynes in the solution that is determined by its wavelength and pulse energy in relation to the ablation rate of the material that in turn is determined by the pulse energy and the focus beam diameter on its surface (the fluence), which leads to the polyyne formation [4,24]. The balance between these two competing processes determines the polyyne synthesis yield and thus the concentration in the final produced solution. Density functional theory (DFT) calculations have shown that the band gap of a polyyne decreases with its number of carbon atoms [23,25,26]. The lower the wavelength of the ablating laser beam, the stronger its interaction with the polyynes for the same pulse energy. In fact, from the calculated band gap value of the polyynes, the interaction of the IR-wavelength (800 nm) beam with the polyynes (particularly for the shorter chain C6H2 and C8H2) is expected to be minimum, whereas that of the UV wavelength (343 nm) is expected to be strong. This interaction of the polyynes with the beam may result in their destruction. It is also likely that the higher pulse repetition rate (6 kHz) ablation will result in the destruction of the polyynes at a higher rate than at the lower pulse repetition rate (1 kHz) ablation for the same pulse energy and ablation time duration. The rate of destruction will be even higher in a smaller solution volume (a slight increase was observed for the increase of the solution volume from 1.5 to 2.5 mL in the case of a ns ablation [24]). Moreover, the higher fluence applied in the case of the 343 nm ablation compared with the 800 nm ablation for almost the same pulse energy does not necessarily ensure a higher ablation rate of the material; this is because the higher fluence is obtained by the decrease in the focus beam diameter onto the material surface (spot size), which results in a decrease in the material volume that can absorb high enough energy from the beam to reach the threshold for ablation. In fact, ablation studies using ns laser beams have shown that the polyyne concentration in the produced solution becomes lower at higher fluences that are determined by a smaller spot size (radius ≤ 1.5 mm) and low pulse energy, whereas a higher concentration (by at least twice) is obtained for lower fluences but is determined by a larger spot size and higher energy [4]. These arguments can explain the absence of any polyyne peaks in the spectra that correspond to the 343 nm ablation compared with the 800 nm ablation; meanwhile, the presence of the weak peak in the spectra (and also from the longer chain (C8H2) polyyne) that corresponds to the 1 kHz interval ablation compared with the continuous 1 kHz ablation for the same total time duration can be explained by assuming that any polyynes that have not been destroyed by the laser beam during the first ablation interval (33 min) have already been diffused outside of the ablating laser beam path in the liquid volume, thus remaining undestroyed by the laser beam during the second ablation interval and/or by the formation of any new polyynes [4,24].
In all spectra, there is also a band centered at ~262 nm, which is known to be related to C-NMs that are formed in the solution together or apart from the polyynes [2,3] and which originates from the π–π* transition of the carbon skeleton. In the case of a ps laser ablation (700 ps/1064 nm/7 or 10 kHz/0.50–0.95 J.cm−2) of graphite in water, such a band appeared in the spectra at ~260–300 nm, and it was attributed to a resonance transition of possibly existing C-related bonds onto the surfaces of CNPs that are formed in the solution [12]. In the case of a ns laser ablation (5 ns/532 nm/10 Hz) of graphite in water, a similar band at ~260 nm in the spectra was attributed to reduced graphene oxide (rGO) layers that are detached from the graphite during the laser ablation process and float on the solution surface (air–water interface) [10]. The band is only observed for ablation at high fluences (above 6 J/cm2) together with peaks that are only from the longer chain C8H2 polyynes that also have reduced intensity, and this is consistent with the present observation about the presence in the spectrum that corresponds to the interval ablation (Figure 1b) of only the long-chain C8H2 polyyne (together with the 262 nm band); for lower fluences, the band was absent, and peaks from the long- and short-chain polyynes were observed [10]. Upon fs laser ablation (35 fs/800 nm/1 kHz) of HOPG in water at a high fluence of 25 J/cm2, this band was observed at ~270 nm (but no peaks from polyynes were present in the spectra) and was attributed to GQDs and PG [11]. In the case of an 800 nm ablation, the increase in the intensity of the peaks in the spectra with fluence (Figure 1a) indicates an increase in the synthesis yield of polyynes as well as C-NMs.
In addition to the peaks from the polyynes and the band from C-NMs in the low wavelength region, the spectra are also characterized by a background absorption in the whole spectral region up to the longest measured wavelength of 1100 nm. This background absorption is attributed to the formation of various residual hydrocarbons (impurities) that have a form that is different than that of the polyynes, and it typically appears during polyyne synthesis by laser ablation of graphite in water using ns or ps laser sources [5,7,12]. In connection with these studies, the ratio of the integrated intensity of the absorption peak from the polynes to that of the background (IApolyyne/Abackground) is a measure of the efficiency of polyyne formation over the other products upon laser ablation of the bulk target in liquid [5,27]. The ratio determined for the two polyynes versus the pulse energy is plotted in Figure 2a. The integrated intensity of the polyyne peaks, C-NMs band (IApolyyne or C-NMs), and residual background absorption (Abackground), which are proportional to the relative concentration of each of those species in the solution, are also plotted in Figure 2b.
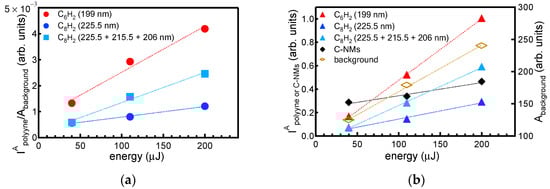
Figure 2.
(a) The ratio of the integrated intensity of the absorption peaks from the polyynes to that of the background absorption versus pulse energy. (b) The integrated intensity of the absorption peaks from the polyynes, C-NMs and background absorption versus pulse energy.
The plots show that, for every pulse energy, the formation efficiency of the shorter chain polyyne C6H2 is higher than that of the longer chain polyyne C8H2. Additionally, in the measured pulse energy regime (up to 200 μJ), the polyyne formation efficiency increases with energy linearly and with the rate for the shorter polyyne being higher than that of the longer polyyne. Moreover, in the case of ns ablation, an increase in the polyyne concentration with fluence was obtained, which was determined by an increase in the pulse energy under a constant spot size [4]. UV-vis absorption spectra of solutions produced by a ps laser ablation also show that the shorter chain polyyne C6H2 is produced with fluence at a higher rate than the longer chain polyyne C8H2 (i.e., the intensity of the peak at 199 nm increases with fluence faster compared with the intensity of the peaks at 215.5 and 225.5 nm) [12]. According to the accepted model for polyyne formation (outlined in the Introduction of this paper), this in turn indicates that the chain growth termination becomes more effective as the fluence increases because of the increase in the amount of hydrogen atoms or radicals that are produced from the water vaporization or decomposition and that are mixed with the plasma plume species.
3.2. XRD and TEM
The crystal structure of the formed C-NMs is the same as that of the bulk graphite target, as proven by the XRD patterns of Figure 3. Particularly, they correspond to graphite with a hexagonal crystal structure (Space group: P63/mmc) [28].
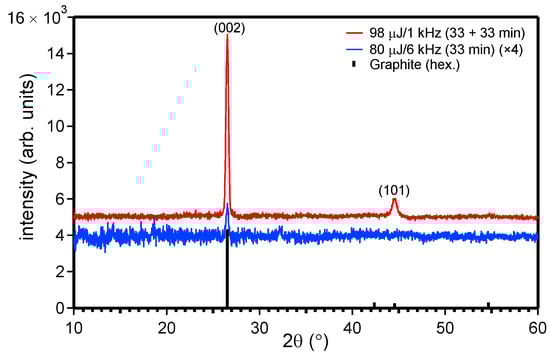
Figure 3.
XRD patterns of the ablation products after drying the produced solutions on a substrate.
TEM images of the formed C-NMs are shown in Figure 4 (see also Figures S6 and S7). A variety of C-NMs with different morphologies are produced, such as large NPs with sizes ranging from ~50 to 260 nm (Figure 4a) (the plot in Figure 4b provides an indication of the deviation of the NP shape from the perfectly spherical shape); small spherical NPs with sizes ranging from ~2 to 5 nm (Figure 4c); and sheet-like structures with sizes ranging a few hundred nanometers (Figure 4d). The small NPs are formed by the nucleation of the plasma plume carbon species from the target material ablation, as explained in detail in the Introduction of this paper, while the larger NPs of Figure 4a may correspond to material melted droplets that are directly ejected from the target material during ablation due to the high fluence used [2]. The flake-like structures are single- or multilayer graphene (or rGO) (multilayer structure similar to the bulk graphite target) that are formed from the exfoliation of the target from the laser beam [11]. The band at ~262 nm observed in the UV-vis spectra is due to the formed C-NMs.
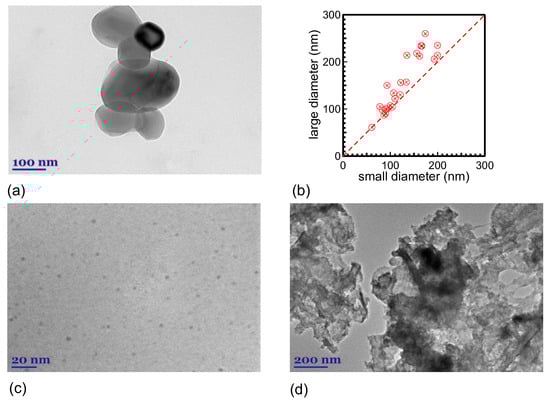
Figure 4.
TEM images of the ablation products ((a) 98 μJ/1 kHz, 33 + 33 min; (c) and (d) 80 μJ/6 kHz, 33 min). The plot in (b) shows the large versus the small diameter of NPs in (a) (measured from the TEM images).
3.3. Raman Spectroscopy
In the Raman spectra from the laser ablation products (Figure 5), the D and G bands that are known to characterize the presence of defects in graphitic structures (structural (lattice) defects) and graphitic order appear at ~1360 and 1582 cm−1; 1364 and 1582 cm−1; and 1372 and 1582 cm−1 for the 800 nm ablation with pulse energies of 40, 110, and 200 μJ, respectively (~1356 and 1581 cm−1; 1383 and 1580 cm−1 for the 343 nm ablation with 80 μJ/6 kHz and 98 μJ/1 kHz, respectively). The shapes, relative intensities, and FWHM of the two bands in the spectra are typical of the presence of carbon systems with an sp2 hybridization [29]. The G band is narrower and higher in intensity by a factor of almost two compared with the D band. In the case of a single crystal graphite or monolayer graphene, only a sharp G band is present in the spectrum [29,30]. This indicates that the ablation products are disordered, but not too much when compared with the graphite target. The narrower G band for the products from the 343 nm ablation compared with that from the 800 nm ablation indicates that they contain a higher percentage of graphene-like structures (a lower percentage of disordered (amorphous) carbon), most probably corresponding to the small NPs and sheet-like structures of Figure 4c,d.
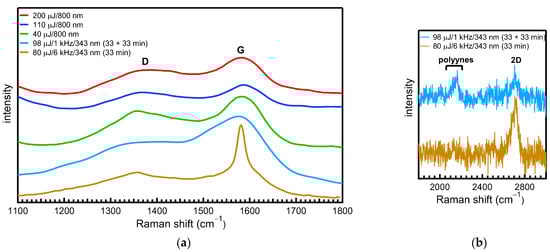
Figure 5.
Raman spectra of the ablation products after drying the produced solutions on a substrate; spectra are in the region of 1100–1800 cm−1, where the D and G bands appear (a), and in the region of 1800–3000 cm−1, where the polyyne peaks appear at around 2100 cm−1 (b).
The intensity of the D band is inversely proportional to the graphite crystal size [29]. The ratio of the intensities of the D and G bands [ID/IG], which is usually a measure of the degree of structural disorder in graphitic materials, was determined to be ≈ 0.70, 0.71, and 0.71 for the products produced at a 40, 110, and 200 μJ pulse energy with the 800 nm laser beam; and ≈ 0.36 and 0.63 for those produced with the 343 nm laser beam (80 μJ/6 kHz and 98 μJ/1 kHz, respectively). Furthermore, the integrated area ratio of the D and G bands [I*DA/I*GA] can be calculated by fitting Voigt (Gaussian–Lorentzian) shape components to the spectra in the region of 1200–1800 cm−1 and is derived to be ≈ 1.46, 1.11, and 1.14 for the products produced at a 40, 110, and 200 uJ pulse energy with the 800 nm laser beam; and ≈ 1.24 and 2.03 for those produced with the 343 nm laser beam (80 μJ/6 kHz and 98 μJ/1 kHz, respectively). The larger ratio for the products compared with that for the bulk material indicates that they have a smaller degree of graphitization (contain more disordered carbon) compared with graphite. This indicates that the synthesized C-NMs have a graphitic structure but also have a high percentage of a less ordered crystalline phase. The intensity ratios of the two bands in the region of 0.149–0.032 were determined for NPs (mean diameter ≈ 100–400 nm) produced by ns laser ablation (1.5 ns/532 nm) of a graphite target in water using different pulse repetition rates in the region ranging from 1 to 100 Hz and fluences ranging from 0.21 to 0.004 J/cm2 [31]. In the case of a ps laser ablation of graphite, the ID/IG ratio was determined to be equal to 0.90, and it was concluded that the synthesized CNPs had a similar graphitic-like structure [12]; in the case of a 200 ns laser ablation of graphite, the synthesized CNPs were found to also contain fullerenes (C60) in addition to having a graphitic structure with a high content of disordered graphite [32]. Bands due to the synthesized polyynes are distinguished in the Raman spectra measured in the region of 1800–3000 cm−1 (Figure 5b) but are distinguished using an excitation power that is ten times higher than that used to measure the spectra of Figure 5a. The polyyne peaks (stretching vibrations of the carbon–carbon triple bond) appear as a broad band at around 2100 cm−1 (consisting of the stronger- and weaker-intensity α and β peaks at high and low frequencies, respectively) (corresponding to the C8H2) [33] in the spectrum of the sample produced under the interval ablation of 33 + 33 min, whereas they are not present in the spectrum of the sample produced under the 33 min ablation, which is consistent with the UV-vis spectrophotometry spectra of Figure 1b.
3.4. LIBS
The plasma plume optical emission spectra upon laser ablation of the target in DI water for short time delays (up to ~120 ns) are dominated by a continuum background, which is known to mainly originate from decelerated free electrons and the electron–ion recombination processes [34]. At later times, the background emission is extinguished (Figure 6a).
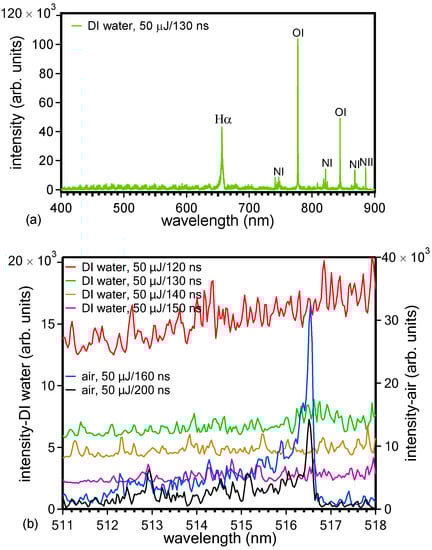
Figure 6.
LIBS spectra measured for different time delays upon ablation (50 μJ/6 kHz) of the target in DI water in the whole spectral region (400–900 nm) (a) and in the region of 511–518 nm where the (0,0) transition of the C2 Swan band appears at 516.47 nm (b). Spectra taken upon ablation of the target in air are also shown in (b) for comparison.
The visual intensity of the plume and the intensity of the light emitted from any excited plasma plume species that are able to reach the detector was very weak even when using higher pulse energies because of the scattering and/or absorption of the plume emission light from the water and because of the absence of the plasma plume heating effect by the laser pulse due to the use of a fs laser pulse for ablation. There is a hint of the appearance in the spectra of emission due to the (0,0) fundamental vibrational transition Δν = 0 of the Swan band at 516.47 nm from radical diatomic carbon molecules C2 (d 3Πg–a 3Πu) (Figure 6b). For comparison, in the same graph, spectra are also shown upon target ablation in ambient air (Supplementary Materials and corresponding references [35,36,37,38,39,40,41,42]). These carbon diatomic species are created in the plasma plume under the high-pressure conditions because of the water confinement of the plume, and they contribute to the formation of the C-NMs. However, based on the mechanism of polyyne formation (explained in the Introduction of the paper), the possibility that they may also contribute to the formation of polyynes that are subsequently destroyed by the laser beam is not excluded; the final result is that, at the end of ablation time duration, polyynes are not present in the solution and only C-NMs are (Figure 1b).
Other carbon-related lines that are distinguished in the spectra are a line at 808.37 nm (Figure 7a) that corresponds to the 2s22p3p 3P2 ← 2s22p5s 3Po1 transition of neutral carbon atoms (CI or C) [21] and a line at 868.25 nm (Figure 7b) that corresponds to the 2s24s 2S1/2 ← 2p3 2Po3/2 transition of CII ions (the weak line at 869.66 nm that is distinguished in the spectra corresponding to 110, 120, and 130 ns corresponds to the 2s24s 2S1/2 ← 2p3 2Po1/2 transition of the CII ions) [21]. Notably, the peaks that appear on either side of the peak at 868.25 nm in the spectrum corresponding to 110 ns (at 867.52, 868.04, 868.39, and 868.67 nm) (Figure 7b) are due to nitrogen ions or neutrals [21]. These lines decrease in intensity for longer time delays and are finally extinguished from the spectra at ~160 ns. The almost absent C2 Swan band from the spectra measured in DI water may be due to the possibility that so much oxygen is produced by the water decomposition at the plume–liquid interface that its reaction with the carbon plume species largely inhibits the formation of C2 dimers [C2 + O → CO + C].
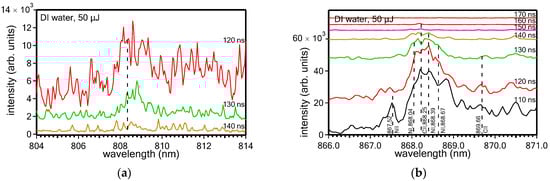
Figure 7.
LIBS spectra measured with different time delays upon ablation (50 μJ/6 kHz) of the target in DI water, showing the CI line at 808.37 nm (a) and CII line at 868.25 nm (b).
Other lines that are distinguished in the spectra measured in DI water (Figure 6a) are: Hα (656.26 nm), NI (742.46 nm), NI (744.32 nm), NI (746.96 nm), OI (777.41 nm), OI (795.08 nm), NI (818.79 nm), NI (821.71 nm), NI (824.4 nm), OI (844.73 nm), NI (863.06 nm), NI (871.95 nm), and NII (881.93 nm) [21]. The oxygen and hydrogen lines mainly originate from the water decomposition, whereas the nitrogen lines originate from the atmospheric nitrogen that exists dissolved in water.
4. Conclusions
In this work, we have presented experimental evidence for the production of polyynes as well as C-NMs by a fs laser ablation of a bulk graphite target in DI water. C-NMs are formed for high as well as low fluences. However, for low fluences ranging from 4 and up to 20 J/cm2 (800 nm laser beam wavelength), polyynes are also detected in the produced solutions, whereas for high fluences of 250 J/cm2 (343 nm laser beam wavelength), polyynes are detected when the ablation for the total ablation time duration was performed in two split intervals with a pause of ablation between them. The ablation products consist of large NPs (~50–200 nm), small NPs (~2–5 nm), and large, flake-like structures. The products have a hexagonal graphite crystal structure. The LIBS spectra in DI water are dominated by neutral or singly ionized carbon atoms rather than C2 dimers.
Supplementary Materials
The following can be downloaded at: https://www.mdpi.com/article/10.3390/app131810388/s1. Figure S1: LIBS spectra measured upon ablation of the target in air at 50 μJ/6 kHz and 30 μJ/6 kHz; Figure S2: LIBS spectra measured upon ablation of the target in air at 50 μJ/6 kHz and for different time delays in the region of 465–475 (a), 512–518 (b), and 553–565 nm (c) where the C2 Swan bands due to Δν = +1, 0, and −1 transitions appear, respectively; Figure S3: LIBS spectra measured for different time delays in the region of 553–565 nm where the C2 Swan bands corresponding to Δν = −1 transitions appear. The blue lines correspond to theoretical fitting to the experimentally measured spectra (red lines); Figure S4: Vibrational/rotational temperature of the C2 molecules versus the time delay as determined from the theoretical fitting of Figure S3; Figure S5: LIBS spectra measured with different time delays upon ablation (50 μJ/6 kHz) of the target in air, showing the CI line at 833.65 nm (a) and CII line at 868.25 nm (b); Figure S6: TEM image of the sheet-like structures in the ablation products (DI water, 80 μJ/6 kHz, 33 min). The large NPs are distinguished on the sheets and in the spaces between them; Figure S7: TEM images of the ablation products (DI water, 800 nm/110 μJ).
Author Contributions
Conceptualization, N.G.S.; methodology, N.G.S., O.B., R.J., A.D. and G.N.; formal analysis, N.G.S., O.B., R.J. and G.N.; investigation, N.G.S.; resources, N.G.S., O.B. and E.H.; data curation, N.G.S., O.B., R.J., A.D. and G.N.; writing—original draft preparation, N.G.S.; writing—review and editing, N.G.S., O.B., R.J., A.D., G.N. and E.H.; supervision, O.B., R.J. and E.H.; project administration, N.G.S., O.B. and E.H.; funding acquisition, N.G.S., O.B. and E.H. All authors have read and agreed to the published version of the manuscript.
Funding
Part of the research leading to these results has received funding from LASERLAB-EUROPE (grant agreement No. 871124, European Union’s Horizon 2020 research and innovation programme).
Institutional Review Board Statement
Not applicable.
Informed Consent Statement
Not applicable.
Data Availability Statement
The data presented in this study are available from the corresponding author upon reasonable request.
Conflicts of Interest
The authors declare no conflict of interest.
References
- Ganash, E.A.; Al-Jabarti, G.A.; Altuwirqi, R.M. The synthesis of carbon-based nanomaterials by pulsed laser ablation in water. Mater. Res. Express 2020, 7, 015002–015012. [Google Scholar] [CrossRef]
- Altuwirqi, R.M. Graphene Nanostructures by Pulsed Laser Ablation in Liquids: A Review. Materials 2022, 15, 5925. [Google Scholar] [CrossRef] [PubMed]
- Yogesh, G.K.; Shukla, S.; Sastikumar, D.; Koinkar, P. Progress in pulsed laser ablation in liquid (PLAL) technique for the synthesis of carbon nanomaterials: A review. Appl. Phys. A 2021, 127, 810–850. [Google Scholar] [CrossRef]
- Marabotti, P.; Peggiani, S.; Vidale, A.; Casari, C.S. Pulsed laser ablation in liquid of sp-carbon chains: Status and recent advances. Chin. Phys. B 2022, 31, 125202–125223. [Google Scholar] [CrossRef]
- Peggiani, S.; Marabotti, P.; Lotti, R.A.; Facibeni, A.; Serafini, P.; Milani, A.; Russo, V.; Bassi, A.L.; Casari, C.S. Solvent-dependent termination, size and stability of polyynes synthesized via laser ablation in liquids. Phys. Chem. Chem. Phys. 2020, 22, 26312–26321. [Google Scholar] [CrossRef]
- Compagnini, G.; Mita, V.; Cataliotti, R.S.; D’Urso, L.; Puglisi, O. Short polyyne chains produced by pulsed laser ablation of graphite in water. Carbon 2007, 45, 2445–2458. [Google Scholar] [CrossRef]
- Choi, Y.K.; Song, J.K.; Park, S.M. Production of Hydrogen-Capped Polyynes by Laser Ablation of Graphite in Neat Water. Bull. Korean Chem. Soc. 2009, 30, 3073–3074. [Google Scholar] [CrossRef][Green Version]
- Park, Y.E.; Shin, S.K.; Park, S.M. The physical effects on the formation of polyynes by laser ablation. Chem. Phys. Lett. 2013, 568, 112–116. [Google Scholar] [CrossRef]
- Shin, S.K.; Song, J.K.; Park, S.M. Preparation of polyynes by laser ablation of graphite in aqueous media. Appl. Surf. Sci. 2011, 257, 5156–5158. [Google Scholar] [CrossRef]
- Compagnini, G.; Russo, P.; Tomarchio, F.; Puglisi, O.; D’Urso, L.; Scalese, S. Laser assisted green synthesis of free standing reduced graphene oxides at the water-air interface. Nanotechnology 2012, 23, 505601–505607. [Google Scholar] [CrossRef]
- Russo, P.; Hu, A.; Compagnini, G.; Duley, W.W.; Zhou, N.Y. Femtosecond laser ablation of highly oriented pyrolytic graphite: A green route for large-scale production of porous graphene and graphene quantum dots. Nanoscale 2014, 6, 2381–2389. [Google Scholar] [CrossRef]
- Bagga, K.; McCann, R.; Wang, M.; Stalcup, A.; Vázquez, M.; Brabazon, D. Laser assisted synthesis of carbon nanoparticles with controlled viscosities for printing applications. J. Colloid Interface Sci. 2015, 447, 263–268. [Google Scholar] [CrossRef]
- Hu, A.; Rybachuk, M.; Lu, Q.-B.; Duley, W.W. Direct synthesis of sp-bonded carbon chains on graphite surface by femtosecond laser irradiation. Appl. Phys. Lett. 2007, 91, 131906–131909. [Google Scholar] [CrossRef]
- Tsuji, M.; Tsuji, T.; Kyboyama, S.; Yoon, S.-H.; Korai, Y.; Tsujimoto, T.; Kubo, K.; Mori, A.; Mochida, I. Formation of hydrogen-capped polyynes by laser ablation of graphite particles suspended in solution. Chem. Phys. Lett. 2002, 355, 101–108. [Google Scholar] [CrossRef]
- Chichkov, B.N.; Momma, C.; Nolte, S.; von Alvensleben, F.; Tünnermann, A. Femtosecond, picosecond and nanosecond laser ablation of solids. Appl. Phys. A 1996, 63, 109–115. [Google Scholar] [CrossRef]
- Hashimoto, S.; Werner, D.; Uwada, T. Studies on the interaction of pulsed lasers with plasmonic gold nanoparticles toward light manipulation, heat management, and nanofabrication. J. Photochem. Photobiol. C 2012, 13, 28–54. [Google Scholar] [CrossRef]
- Gellini, C.; Deepak, F.L.; Muniz-Miranda, M.; Caporali, S.; Muniz-Miranda, F.; Pedone, A.; Innocenti, C.; Sangregorio, C. Magneto-Plasmonic Colloidal Nanoparticles Obtained by Laser Ablation of Nickel and Silver Targets in Water. J. Phys. Chem. C 2017, 121, 3597–3606. [Google Scholar] [CrossRef]
- Noll, R. Laser-Induced Breakdown Spectroscopy: Fundamentals and Applications; Springer: Berlin/Heidelberg, Germany, 2012. [Google Scholar]
- Amans, D.; Chenus, A.-C.; Ledoux, G.; Dujardin, C.; Reynaud, C.; Sublemontier, O.; Masenelli-Varlot, K.; Guillois, O. Nanodiamond synthesis by pulsed laser ablation in liquids. Diam. Relat. Mater. 2009, 18, 177–180. [Google Scholar] [CrossRef]
- Mortazavi, S.Z.; Parvin, P.; Reyhani, A.; Mirershadi, S.; Sadighi-Bonabi, R. Generation of various carbon nanostructures in water using IR/UV laser ablation. J. Phys. D 2013, 46, 165303–165312. [Google Scholar] [CrossRef]
- NIST. NIST Atomic Spectra Database Lines Form. Available online: https://physics.nist.gov/PhysRefData/ASD/lines_form.html (accessed on 21 August 2023).
- Wakabayashi, T.; Nagayama, H.; Daigoku, K.; Kiyooka, Y.; Hashimoto, K. Laser induced emission spectra of polyyne molecules C2nH2 (n = 5–8). Chem. Phys. Lett. 2007, 446, 65–70. [Google Scholar] [CrossRef]
- Zhang, K.; Zhang, Y.; Shi, L. A review of linear carbon chains. Chin. Chem. Lett. 2020, 31, 1746–1756. [Google Scholar] [CrossRef]
- Lotti, R.A. Sp-Carbon Chains by Pulsed Laser Ablation in Liquids: Synthesis and Stability. Master’s Thesis, University of Milan, Milan, Italy, 2019. [Google Scholar]
- Yang, S.; Kertesz, M. Bond Length Alteration and Energy Band Gap of Polyyne. J. Phys. Chem. A 2006, 110, 9771–9774. [Google Scholar] [CrossRef] [PubMed]
- Casari, C.S.; Tommasini, M.; Tykwinski, R.R.; Milani, A. Carbon-atom wires: 1-D systems with tunable properties. Nanoscale 2016, 8, 4414–4435. [Google Scholar] [CrossRef] [PubMed]
- Taguchi, Y.; Endo, H.; Abe, Y.; Matsumoto, J.; Wakabayashi, T.; Kodama, T.; Achiba, Y.; Shiromaru, H. Polyyne formation by graphite laser ablation in argon and propane mixed gases. Carbon 2015, 94, 124–128. [Google Scholar] [CrossRef]
- JCPDS no. 00-056-0159 (Graphite-Hexagonal). 2023 International Centre for Diffraction Data. Available online: icdd.com (accessed on 10 May 2023).
- Tuinstra, F.; Koenig, J.L. Raman Spectrum of Graphite. J. Chem. Phys. 1970, 53, 1126–1130. [Google Scholar] [CrossRef]
- Lucchese, M.M.; Stavale, F.; Martins Ferreira, E.H.; Vilani, C.; Moutinho, M.V.O.; Capaz, R.B.; Achete, C.A.; Jorio, A. Quantifying ion-induced defects and Raman relaxation length in graphene. Carbon 2010, 48, 1592–1597. [Google Scholar] [CrossRef]
- Woo, W.K.; Hung, Y.M.; Wang, X. Anomalously enhanced thermal conductivity of graphite-oxide nanofluids synthesized via liquid-phase pulsed laser ablation. Case Stud. Therm. Eng. 2021, 25, 100993–101006. [Google Scholar] [CrossRef]
- Dudek, M.; Rosowski, A.; Koperkiewicz, A.; Grobelny, J.; Wach, R.; Sharp, M.; French, P.; Janasz, L.; Kozanecki, M. Carbon nanoparticles fabricated by infrared laser ablation of graphite and polycrystalline diamond targets. Phys. Status Solidi A 2017, 214, 1600318–1600326. [Google Scholar] [CrossRef]
- Tabata, H.; Fujii, M.; Hayashi, S.; Doi, T.; Wakabayashi, T. Raman and surface-enhanced Raman scattering of a series of size-separated polyynes. Carbon 2006, 44, 3168–3176. [Google Scholar] [CrossRef]
- Sakka, T.; Iwanaga, S.; Ogata, Y.H.; Matsunawa, A.; Takemoto, T. Laser ablation at solid-liquid interfaces: An approach from optical emission spectra. J. Chem. Phys. 2000, 112, 8645–8653. [Google Scholar] [CrossRef]
- Claeyssens, F.; Lade, R.J.; Rosser, K.N.; Ashfold, M.N.R. Investigations of the plume accompanying pulsed ultraviolet laser ablation of graphite in vacuum. J. Appl. Phys. 2001, 89, 697–709. [Google Scholar] [CrossRef]
- Wakisaka, A.; Gaumet, J.J.; Shimizu, Y.; Tamori, Y.; Sato, H.; Tokumaru, K. Growth of Carbon Clusters. J. Chem. Soc. Farad. Trans. 1993, 89, 1001–1005. [Google Scholar] [CrossRef]
- Al-Shboul, K.F.; Harilal, S.S.; Hassanein, A. Emission features of femtosecond laser ablated carbon plasma in ambient helium. J. Appl. Phys. 2013, 113, 163305–163314. [Google Scholar] [CrossRef]
- Parigger, C.G.; Woods, A.C.; Surmick, D.M.; Gautam, G.; Witte, M.J.; Hornkohl, J.O. Computation of diatomic molecular spectra for selected transitions of aluminium monoxide, cyanide, diatomic carbon, and titanium monoxide. Spectr. Chim. Act. B 2015, 107, 132–138. [Google Scholar] [CrossRef]
- Parigger, C.G. Diatomic Line Strengths for Fitting Selected Molecular Transitions of AlO, C2, CN, OH, N2+, NO, and TiO, Spectra. Foundations 2023, 3, 1–15. [Google Scholar] [CrossRef]
- Saito, K.; Sakka, T.; Ogata, Y.H. Rotational spectra and temperature evaluation of C2 molecules produced by pulsed laser irradiation to a graphite-water interface. J. Appl. Phys. 2003, 94, 5530–5536. [Google Scholar] [CrossRef]
- Chaudhary, K.; Rosalan, S.; Aziz, M.S.; Bohadoran, M.; Ali, J.; Yupapin, P.P.; Bidin, N. Saktioto, Laser-Induced Graphite Plasma Kinetic Spectroscopy under Different Ambient Pressures. Chin. Phys. Lett. 2015, 32, 043201–043206. [Google Scholar] [CrossRef]
- Claeyssens, F.; Ashfold, M.N.R.; Sofoulakis, E.; Ristoscu, C.G.; Anglos, D.; Fotakis, C. Plume emissions accompanying 248 nm laser ablation of graphite in vacuum: Effects of pulse duration. J. Appl. Phys. 2002, 91, 6162–6172. [Google Scholar] [CrossRef]
Disclaimer/Publisher’s Note: The statements, opinions and data contained in all publications are solely those of the individual author(s) and contributor(s) and not of MDPI and/or the editor(s). MDPI and/or the editor(s) disclaim responsibility for any injury to people or property resulting from any ideas, methods, instructions or products referred to in the content. |
© 2023 by the authors. Licensee MDPI, Basel, Switzerland. This article is an open access article distributed under the terms and conditions of the Creative Commons Attribution (CC BY) license (https://creativecommons.org/licenses/by/4.0/).