Abstract
Korea’s industrial accident rate ranks high among Organization for Economic Co-operation and Development countries. Moreover, large-scale accidents have recently occurred. Accordingly, the requirements for management and supervision in industrial sites are increasing; in this context, the “Act on Punishment of Serious Accidents, etc.” has been enacted. Aiming to prevent such industrial accidents, various data collected by devices such as sensors and closed-caption televisions (CCTVs) are utilized to track workers and detect hazardous substances, gases, and fires at industrial sites. In this study, an industrial area requiring such technology is selected. A hazardous situation event is derived, and a dataset is built using CCTV data. A violation corresponding to a hazardous situation event is detected and a warning is provided. The events incorporate requirements extracted from industrial sites, such as those concerning collision risks and the wearing of safety equipment. The precision of the event violation detection exceeds 95% and the response and delay times are under 20 ms. Thus, this system is believed to be used at industrial sites and for other intelligent industrial safety prevention solutions.
1. Introduction
Manufacturing represents a massive share of the global economy. In most countries, workers engaged in manufacturing must comply with occupational safety rules. Each government enforces such laws institutionally. Violators of such regulations are punished and receive significant social attention. However, even with great institutional coercion or social interest, injuries or deaths at industrial sites still occur due to, e.g., the environments of each workplace, various industry-specific reasons, and insensitivity to safety concerns. Thus, accidents continue to occur despite being addressed through workplace environment management, policies, and safety management education encouragement [1,2].
The issue of industrial accidents is consistently raised in Korea. From 2012 to 2021, according to the data on industrial accidents and yearbooks published by the Korea Occupational Safety and Health Agency every quarter, as the number of workplaces and workers continued to increase, the number of injured people continued to rise [3]. This can be regarded as a side effect of Korea’s rapid growth [4,5]. According to the data on accident rates per 100,000 workers published by the International Labor Organization, Korea’s accident rate ranks the highest among Organization for Economic Co-operation and Development (OECD) countries, followed by Mexico, Turkey, the United States, and Lithuania [6]. These data are shown in Figure 1 below.
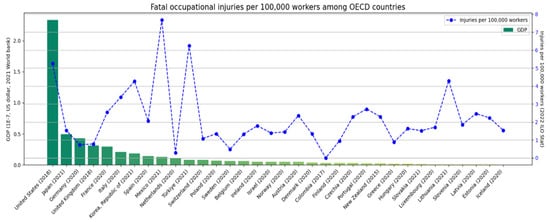
Figure 1.
Fatal occupational injuries per 100,000 workers among OECD countries.
In Figure 1, the countries are shown in order of descending GDP based on World Bank 2022 data [7]. The names of the countries are on the x-axis and the values in parentheses indicate the latest year in which the International Labor Organization accident rates were reported. Data are reported from 2021 for Mexico, Turkey, Lithuania, and South Korea and 2018 for the United States. Korea has the third-highest accident rate among the top 10 OECD countries. Figure 2 shows the number of injuries and deaths by industry from the 2022 data published by the Korea Occupational Safety and Health Agency [8].
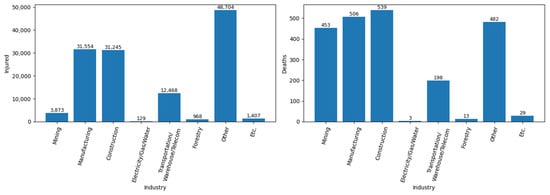
Figure 2.
Number of injured (left) and deaths (right) by industry.
In Figure 2, the graph on the left shows the number of injured people by industry and the chart on the right shows the number of deaths by industry sector. In the industry categories, “Other” generally refers to wholesale and retail businesses, health and social welfare businesses, and food and lodging businesses as service industries; “Etc.” refers to fishery, agriculture, finance, and insurance businesses. Both graphs show that the numbers of injuries and fatalities are higher in the manufacturing and construction industries than in other sectors. Figure 3 depicts the number of injuries and deaths according to the workplace size.
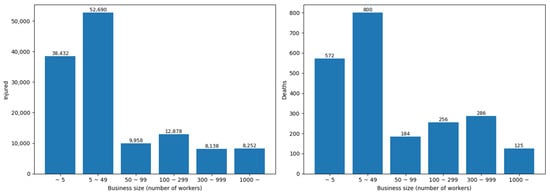
Figure 3.
Number of injured (left) and number of deaths (right) by business size (number of workers).
Similar to Figure 2, Figure 3 is divided into left and right graphs, and the data are classified according to the workplace size (based on the number of workers working). Workplaces with less than 50 workers have an overwhelmingly high number of accidents and deaths. Businesses with less than 50 workers tend to have poorer environments than other workplaces, a lack of safety awareness among workers, educational activities, and institutional support [9,10,11].
As shown earlier, Korea has a higher industrial accident rate than other countries, and many of these accidents and deaths occur in manufacturing and construction industries and workplaces with less than 50 workers. Various studies and institutional supplements attempt to solve these problems [12,13,14,15,16,17,18]. In Korea, the “Serious Accident Punishment Act” was implemented in 2022, making employers liable for industrial accidents [19,20,21,22].
This study analyzed common scenarios and disasters occurring in manufacturing workplaces. We standardized the data based on closed-caption television (CCTV) video to build an object-based detection model. Three workplaces in downtown Daejeon were selected as manufacturing workplaces. The data standardization for the video data was based on the guidelines for building a learning dataset provided by the Korea National Information Society Agency. You Only Look Once (YOLO)v4 was used as the object detection model, and the accuracy exceeded 95%. Thus, this approach could create safe working environments for workers, including those outside the manufacturing sector.
2. Related Works
This section describes the data labeling tool and object detection model used in this study.
2.1. Data Labeling Tool
In general, the events of workers and accidents occurring at industrial sites are recorded and monitored by the CCTVs installed at industrial sites. In this study, because data collected from the workplace filmed by CCTV are being used, it is necessary to identify which event has occurred and which object has appeared in one frame in the video. This task is called data labeling or annotation. Various labeling tools exist; Table 1 compares the functions of the three tools [23,24,25].

Table 1.
Feature comparison of three annotations (labeling) tools.
Table 1 indicates the functions provided by each labeling tool. DarkLabel is not open-source and works only on the Windows operating system, which is not web-based. In contrast, YOLO Mark and the “Computer Vision Annotation Tool” (CVAT) are open-source and work well with other operating systems. As CVAT is web-based, labeling can be performed co-operatively. In addition, to consider the user’s perspective, the UI or shortcut functions, labeling functions for automatically extracting frames or tracking objects, and the degree of difficulty of installation were investigated and displayed.
2.2. Object Detection Model
Various open object detection models have been proposed. Starting with the region-based convolutional neural network (R-CNN) in 2014, Fast R-CNN, Faster R-CNN, Mask R-CNN, YOLO, and the single-shot detector (SSD) have subsequently been released. These models can be divided into single-stage and two-stage models [26,27,28,29,30,31,32,33,34,35,36,37]. The two-stage method is a method in which a separate module creates a proposal for a region of interest; it first finds an object in an image and then classifies it. The R-CNN family belongs to this category. In contrast, the single-stage method is a technique for simultaneously proposing a region of interest and organizing an object using a single-shot technique. The YOLO and SSD models belong to this group. Table 2 compares the models’ image input size, accuracy, and frames per second (FPS).
Table 2.
Compare accuracy and frames per second (FPS) of object detection models, including region-based convolutional neural network (R-CNN) and single-shot detector (SSD).
The accuracy values shown in Table 2 are based on an indicator called the average precision (AP) used in object detection. The AP uses the intersection over union (IoU), i.e., the intersection of the entire union of the correct object and the object observed by the model. If this IoU value is enormous, the model should measure more accurately because the intersection of the valid object and the object followed by the model should be more significant. The IoU value can be adjusted to calculate the precision and recall. The formulas for precision and recall are shown in Equation (1) below:
The AP is obtained by calculating the precision and recall for each class using the above formulas and taking the average value for all categories. The IoU value of the AP is marked with a subscript; thus, the IoU value of the AP in Table 2 is set to 0.5. Overall, it can be seen that the two-stage model has a high AP but low FPS, whereas the single-stage model shows the opposite tendencies. YOLOv4 was ultimately selected for this study as a model with a high processing rate and high accuracy between the FPS and AP.
YOLOv4 refers to the fourth version of the object detection model following the YOLO model. It uses a backbone network combining a cross-stage partial (CSP) technique and the Darknet53 used in previous versions. The CSP technique reduces the number of computations by preventing the reuse of gradient values [38]. In addition, a spatial pyramid pooling (SPP) technique and the PANet technique were mixed. The SPP technique performs more accurate feature extraction by extracting features from an image as a spatial pyramid [39]. The PANet technique up-samples feature extraction filters or images, down-samples them, and then aggregates them [40]. This makes it possible to extract more diverse features. YOLOv4 employs these techniques to overcome the difficulties in detecting small objects in previous versions of YOLO problems. Figure 4 is a simple schematic diagram of the YOLOv4 model.
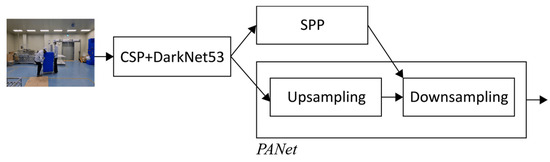
Figure 4.
Schematic diagram of the “You Only Look Once” (YOLO)v4 model.
To compare YOLOv4 to other models, we experimented with the performance of SSD + MobileNetV2 and CenterNet [33,34,41,42,43]. The two models compared are one-stage methods similar to YOLOv4. The one-stage approach simplifies the structure of the model to allow for fast object tracking. SSD is a network using MobileNetV2 for the backbone network, and CenterNet is a model using key-point estimation. The difference between these models is that YOLOv4 and SSD track based on boxes, while CenterNet uses center-point key points.
We compared the mean average precision (mAP) values of the three models and selected the highest model. The mAP is calculated by plotting Equation (1) above with precision on the x-axis and recall on the y-axis and dividing the area of the graph by the number of objects to be detected. When the same indoor image was tested under the same conditions, the results are shown in Table 3 below, and the final YOLOv4 was selected [43].
Table 3.
Comparative experiment results for object detection model selection.
3. Design and Implementation
To implement the industrial accident risk detection model, hazardous situations are derived from industrial sites to select the objects to be detected. The training dataset for learning the risk detection model is standardized in the JavaScript Object Notation (JSON) data format, and the final model is built by conducting experiments to detect objects. The model implementation process is shown in Figure 5.
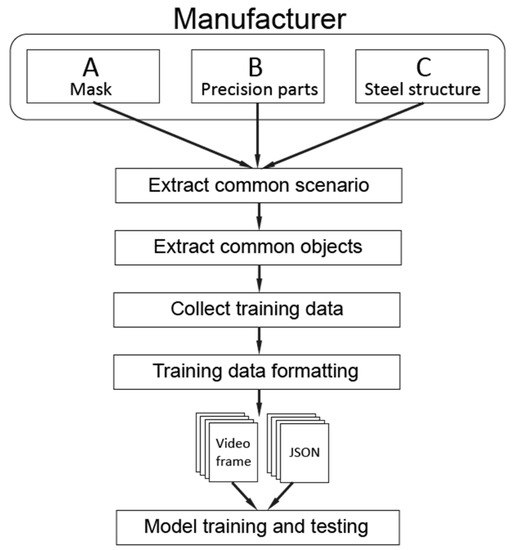
Figure 5.
Hazardous situation determination model process.
3.1. Scenario Derivation and Object Selection
A risk scenario must be derived before identifying a hazardous situation. Before that, a workplace must be selected; then, the scenario derivation, object selection, and learning data collection can proceed. In this study, the business site comprises small- and medium-sized businesses in the manufacturing field in Daejeon, Korea. The Korean government has established these businesses as certified manufacturers related to industrial safety and worker welfare. Several industrial safety certifications are provided by the Korean government and, among them, this study considers manufacturers certified as standard workplaces for persons with disabilities and as having clean workplace systems.
The standard workplace for disabled people is a system supported by the Korea Employment Agency for Persons with Disabilities. This system creates an appropriate physical and emotional environment by presenting environmental standards for disabled people. In this system, disabled people must be hired and selected based on review criteria for disabled people (such as those concerning welfare) and on-site confirmation surveys [44]. Similarly, the Korea Occupational Safety and Health Agency provides specific amounts of money to support clean workplace systems for continuously improving various factors to create safe workplaces (e.g., industrial accident occurrence factors, environmental factors, and process procedures) [45].
The three selected manufacturers all have certifications related to industrial safety from the Korean government. In general, it is necessary to establish risk prevention measures to prevent and manage industrial safety accidents. In this study, each manufacturer does not represent only one manufacturing field; instead, they mean different types of industries and work sites. Hazardous situations commonly applied in industrial safety can be derived as scenarios. Manufacturer A is a mask manufacturer, B is a precision parts manufacturer, and C is a steel structure manufacturer. Table 4 shows each manufacturer’s safety management characteristics and the results of the investigation regarding objects related to them.
Table 4.
Investigation of safety management features and objects for each manufacturer (●: required).
All three manufacturers handle cutting tools and pose risks of operator collisions with carts, trucks, forklifts, and oversized materials. Workers of the three manufacturers must wear safety equipment such as hard hats and gloves. In the case of mask manufacturer A and precision parts manufacturer B, they must also use hygiene equipment such as caps and gloves.
Accordingly, an area of the workplace for handling cutting tools is classified as hazardous; an area where masks or precision parts are assembled is classified as a hygiene area. Asking a common query from the three manufacturers results in two or more people. As all three manufacturers have a risk of workers colliding with moving equipment such as carts, trucks, and forklifts both indoors and outdoors, this scenario is extracted as a risk scenario. Another extracted risk scenario comprises lack of personal protective equipment.
In addition, the Korea National Information Society Agency recommends guidelines to determine whether a dataset is suitable for a learning dataset; moreover, the quality of datasets is being actively studied in the academic world [46,47,48,49]. Table 5 shows the results applied in this study to improve the dataset’s quality, based on the Korean government’s guidelines for dataset suitability and previous references.
Table 5.
Training dataset suitability items from the Korean government and results.
Table 5 shows three manufacturers with various complex industries selected to protect diversity, reliability, and consistency. Figure 6 shows photos collected from these manufacturers.
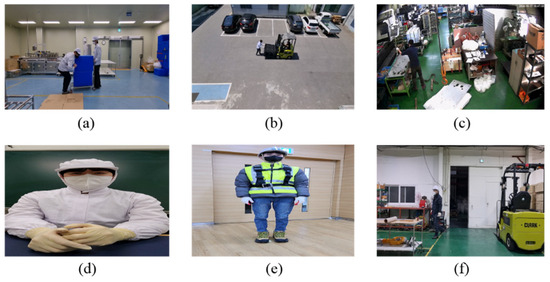
Figure 6.
Images were collected from three manufacturers.
In Figure 6a is an image taken by manufacturer A, assuming a situation in which materials and workers collide. (b) is a photo taken by manufacturer B, considering a situation where a forklift and worker collide. The accidents were safely reproduced and filmed under the supervision of a safety manager. The filming was conducted using CCTV installed at the manufacturer’s location. We filmed the accidents because finding accident situations in the existing working video is relatively difficult. (c) is an image taken by manufacturer C; it represents a hazardous situation in which materials are loaded into an aisle. (d) to (f) are additional images taken from the front (unlike (a) to (c)) to verify whether personal protective equipment is being worn. Table 6 summarizes the videos used in the experiment according to the scenario.
Table 6.
Information according to the hazardous scenario for the frames used in the experiment.
Nine objects are selected according to the scenarios mentioned above. Specifically, workers, materials, carts, forklifts, trucks, hard hats (or hygiene hats), safety clothes (or hygiene clothes), masks, and safety gloves (or hygiene gloves) are selected, as shown in Figure 7.
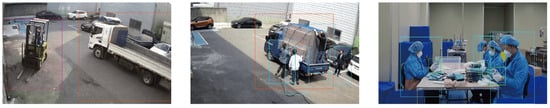
Figure 7.
Example of video frames containing nine selected objects.
3.2. Training Data Labeling and Standardization
After collecting the learning data according to the scenario, to determine whether or not the scenario is hazardous in the risk judgment model, objects (such as workers, trucks, forklifts, and personal protective equipment) in the image must first be extracted. A person must directly label an object in the image for the model to detect the object.
Labeling refers to drawing a bounding box for an object in a frame (or image) and naming the object. As a labeling tool, CVAT was used by comparing the three features in Table 1. CVAT is provided as an open-source tool by the OpenCV Foundation [25]. Notably, while labeling, the frames in images with hazardous scenarios are separately organized. Figure 8 summarizes the labeling process and frames related to the hazardous images.
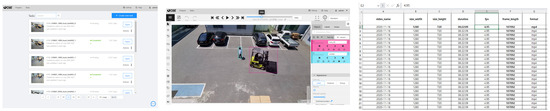
Figure 8.
Labeling process using “Computer Vision Annotation Tool” (CVAT) and frames in which hazardous situations were filmed.
The labeling result is output as a frame image of the video and YOLO model format. The most intuitive way to express the bounding box of an object is in the Microsoft “Common Objects in Context” (COCO) format. This method uses the object’s top-left point (, ) horizontal size , and vertical size . In contrast, the YOLO format is expressed in the form of x, y, w, h as the relative values of the center co-ordinates (, ) of the object and according to resolution size (, ) of the entire image. The formula for converting the COCO format to the YOLO format is shown in Equation (2) [30,50].
The frames, objects appearing in such frames, and risk events are integrated and standardized. We add metadata such as which manufacturer the learning data were recorded from, the number of FPS and format of the recorded video, actual time, and resolution. However, the entire recorded video cannot be used as the training data, so the video is divided. It contains information regarding events and objects occurring in frames obtained from the segmented images.
The learning data are written in JSON format to manage this information quickly. JSON is a data exchange format grammar organized by the European Computer Manufacturers Association [51]. The reason for standardizing the learning data as JSON data is to save the results of the object labeling for the images in a form similar to that of the PASCAL Visual Object Classes (VOC) and Microsoft COCO image datasets [50,52]. PASCAL VOC is an extensible markup language, and the Microsoft COCO dataset uses JSON. The standardized final result is schematized in a tree form, as shown in Figure 9.
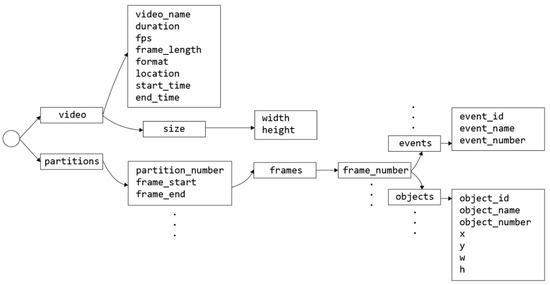
Figure 9.
Building model learning data in JavaScript Object Notation (JSON) format for manufacturer hazardous situation detection.
The circle at the front denotes the root node and contains image information (including segmented image information). The video is split because the video taken by the CCTV is transferred by day or week. This video is too large to label all of it at once, so it is cut into frame sections. In this study, the sections comprise 18,000 frames or less.
The video information includes the video name, length, number of FPS, total frame length, video format, the location where the video was taken, the start and end times, and the horizontal and vertical length of the video frame.
The segmented image information contains the division number given in the order in which the video was cut, along with the start and end numbers of the frames. As innumerable such frames can exist, the video is separated once more. As a result, each frame number contains event information of a risk occurring in the corresponding frame and object information appearing in the corresponding frame.
The event information includes the event numbering, name, and unique event number. The event numbering is separated because several events may occur in a frame. The particular event number is the same as in the hazardous scenario in Table 6. The object information consists of the object numbering, name, and object identification number. The objects are uniquely numbered from 1 to 9 in the order of worker, material, cart, forklift, truck, hard hat (or hygiene hat), safety suit (or hygiene suit), mask, and safety glove (or hygiene glove).
This information is stored to subsequently test the model, as discussed in Section 4. It is used to check whether the model accurately judges a hazardous situation as hazardous. In addition, appropriate data collection is essential to applying the risk assessment model to the other risk scenarios suggested herein or to other manufacturers. Thus, ensuring the data have been appropriately collected is important.
3.3. Model Design
Figure 10 shows the process from data preprocessing to inference after selecting the three manufacturers.
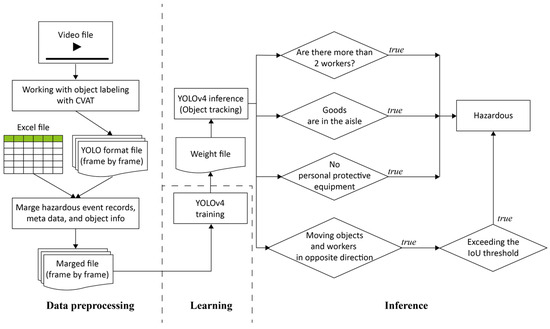
Figure 10.
Industrial accident detection model design flow chart.
After the data preprocessing and YOLOv4 model training described in the previous section, the objects are tracked through weight files. After the object tracking, four items are inspected. Table 6 is simplified. If two or more workers are present, further inspections are conducted on loading goods in the aisle, whether or not personal protective equipment is worn, and collisions with moving objects.
In the case of a moving object collision, assuming that a worker and equipment (such as a truck or forklift) are moving in opposite directions, the collision between the two objects is judged to have occurred when an IoU threshold value of the two objects is exceeded. Figure 11 depicts a situation corresponding to such a judgment. Figure 12 shows cases of detecting the presence or absence of the loading of goods and the wearing of safety equipment.
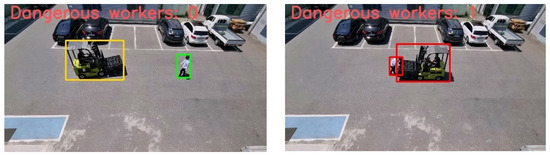
Figure 11.
Detect hazardous situations when a worker and forklift collide.
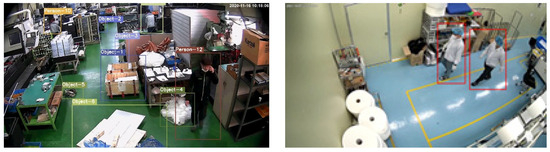
Figure 12.
Loading of goods and inspection of personal protective equipment.
3.4. Model Implementation
Table 7 provides the hardware specifications for preprocessing the training data and model learning, along with the installed programs or libraries.
Table 7.
Hardware specifications of training data preprocessing system and model training system.
YOLOv4 uses object detection probability values. If the probability value is exceeded, the corresponding object is considered as detected. This study uses a 50% probability value. In addition, the IoU is used as a reference value for determining when a worker collides with a moving object; here, it is set to 0.05. This is because the degree of overlap (IoU) is minimal. Specifically, the object is smaller than in an image taken from the front because it is captured from a CCTV installed at an elevated angle.
4. Evaluation and Consideration
We measure the response time, delay time, total processing time, object detection precision, and risk determination precision to observe the results from the industrial accident detection model in a real environment and to explore whether this model can be used in actual industrial sites.
4.1. Time Measurement
This study evaluates the moving object collision scenario video, as this is the most complex and time-consuming situation to determine. First, we want to calculate the response time based on this video. Thus, 18,000 frames are read from the test video data, and the time required to start and end the risk determination is calculated as an average value. The average value of the time required for risk determination (including the time required for the object detection process) is the delay time. Figure 13 shows the response and delay times required to start the risk determination for each frame as graphs.
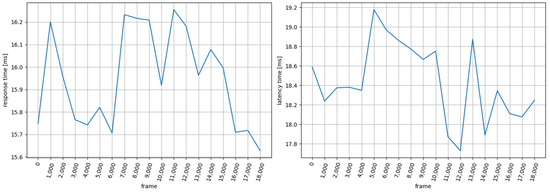
Figure 13.
Response time (left) and delay time (right).
In Figure 13, the response and delay times are displayed in units of 1000 frames for all 18,000 frames. The average response time is 15.94 ms and the average delay time is 18.43 ms. The average delay time is higher because YOLOv4 incorporates the object detection time.
We use the same test video to measure the total processing time for the risk determination (i.e., the total time from the start until the time the information directly labeled by a person and video frame are displayed on the screen). Then, we measure the time required to process the JSON file storing the video frames and risk events. JSON used two types of files: 1000 files and 18,000 frames of test video. Figure 14 provides a graph of the total processing time.
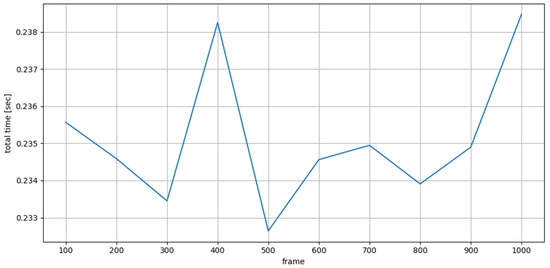
Figure 14.
Total processing time.
As shown in Figure 14, the total processing time is graphed in units of 100 JSON files and takes an average of 0.23 s. We measure the time taken to read and process the JSON file containing the risk event because the model can be retrained according to industrial site environment changes when being used in the industrial field. This is to check in advance whether a hazardous situation in the industrial site is correctly determined and whether this model is suitable for actual deployment.
4.2. Detection and Judgment Precision
From the object detection and risk judgment accuracies, it is confirmed that the actual model accurately identifies objects and determines hazardous situations. The formula for obtaining the precision is the same as Equation (1). In object detection, a true positive is when the object predicted by the model matches the object information directly labeled by the person in the JSON file; thus, the model is correct. A false positive is when the model does not identify an object, and the model is incorrect because the object information was entered in the JSON file.
In contrast, in risk judgment, a true positive refers to a case where the model classifies an event as hazardous and correctly organizes it as a hazardous event in the JSON file. A false positive is a case where the model classifies the event as not hazardous but the judgment is wrong (i.e., a risk event exists in the JSON file and an actual risk has occurred). Table 8 lists the results regarding object detection and risk judgment precision.
Table 8.
Results of the object and hazardous situation detection.
Looking at Table 8, the object detection accuracy is based on YOLOv4, so the precision and recall show good results. However, although the model showed 97.06% precision for the risk situation judgment, it showed a slightly lower result for the rate of recall. This represents a false negative, meaning that a situation was judged as hazardous in the model but not labeled as hazardous in the JSON file. Owing to these false alarms, the recall rate is slightly lower.
4.3. Discussion
In the case of a collision between a worker and a moving object, such as a forklift or truck, it was not as challenging to identify the object. This was because the object’s size was small, owing to most CCTVs being installed at high angles. Identifying collusions by simply calculating the distance between two objects is challenging. We tuned the degree of overlap between them and determined the collision based on this threshold. Scenarios where safety equipment is worn or not, with two or more workers, or when goods are loaded in an aisle differ from simple problems of determining whether an object is present. As such, the evaluation based on these collision experiments is significant.
5. Conclusions
In this study, three manufacturing industries were selected, common risk scenarios were extracted, and an industrial accident prevention model was implemented using an object detection model. Among the common risk scenarios, collisions between workers and moving objects and workers failing to wear safety equipment were identified. The model was evaluated in terms of time and accuracy for application in actual environments at industrial sites. The inference time was approximately 18 ms and the precision of the risk judgment was 97.06%.
This study used data preprocessing to detect objects and identify hazardous situations. Direct object labeling information, risk event information, and metadata of the corresponding video were combined into a single JSON format file. However, as the model was designed based on rules for risk detection and the algorithm was designed to meet these rules, it showed high accuracy. However, a limit exists insofar as its application to other industrial sites. In the evaluation results, the false negative rate slightly increased in the risk judgment, showing a drop in the recall rate. This is a situation that the model judged to be hazardous but was not hazardous. This situation can eventually cause inconveniences to workers or employers working in actual industrial sites; corresponding studies are left for future research.
In addition, it is believed that the deviations depending on the CCTV installation environment will vary greatly. Most CCTVs are installed at high angles, making it difficult to identify objects. In addition, they may be covered by lighting facilities installed in industrial sites, installed medium–large equipment, etc. Moreover, the data collection process may become biased when directly applied in the workplace. For example, data representing hazardous situations collected from the workplace may be excluded, i.e., administrators operating the CCTVs may delete these data to avoid institutional penalties. In such a case, the model will only train on safe situations, so it may fail to detect unsafe situations. Although this study did not solve all of these limitations, it showed that risk detection based on object detection is possible. Thus, this study can contribute to worker safety via industrial accident prevention solutions and safety manager environmental monitoring systems.
Author Contributions
Conceptualization, T.L.; methodology, T.L. and K.W.; software, T.L.; validation, T.L. and P.K.; formal analysis, T.L. and K.W.; writing—original draft preparation, T.L.; visualization, T.L.; supervision, H.J.; project administration, H.J. All authors have read and agreed to the published version of the manuscript.
Funding
This research was supported by Regional Innovation Strategy (RIS) through the National Research Foundation Korea (NRF) funded by the Ministry of Education (MOE) (2021RIS-004).
Institutional Review Board Statement
Not applicable.
Informed Consent Statement
Not applicable.
Data Availability Statement
Not applicable.
Acknowledgments
The authors also greatly appreciate the anonymous reviewers and academic editor for their careful comments and valuable suggestions to improve the manuscript.
Conflicts of Interest
The authors declare no conflict of interest.
References
- Sanchez, F.A.S.; Pelaez, G.I.C.; Alis, J.C. Occupational safety and health in construction: A review of applications and trends. Ind. Health 2017, 55, 210–218. [Google Scholar] [CrossRef]
- Friend, M.A.; Kohn, J.P. 1. Introduction to Occupational Safety and Health. In Fundamentals of Occupational Safety and Health, 8th ed.; Bernan Press: Lanham, MD, USA, 2023; pp. 1–24. [Google Scholar]
- Industrial Accident Status. Available online: https://www.index.go.kr/unity/potal/main/EachDtlPageDetail.do?idx_cd=1514 (accessed on 22 March 2023).
- Kim, S.; Lee, J.; Kang, C. Analysis of industrial accidents causing through jamming or crushing accidental deaths in the manufacturing industry in South Korea: Focus on non-routine work on machinery. Saf. Sci. 2021, 133, 104998. [Google Scholar] [CrossRef]
- Jeong, B.Y. Characteristics of occupational accidents in the manufacturing industry of South Korea. Int. J. Ind. Ergon. 1997, 20, 301–306. [Google Scholar] [CrossRef]
- Fatal Occupational Injuries per 100,000 Workers by Economic Activity—Annual. Available online: https://www.ilo.org/shinyapps/bulkexplorer36/?lang=en&id=INJ_FATL_ECO_RT_A (accessed on 24 April 2023).
- GDP (Current US Dollar). Available online: https://data.worldbank.org/indicator/NY.GDP.MKTP.CD (accessed on 24 April 2023).
- [Quarterly] Status of Occupational Accidents at the End of December 2022. Available online: https://www.kosha.or.kr/kosha/data/industrialAccidentStatus.do?mode=view&articleNo=438399 (accessed on 3 March 2023).
- Kwon, J. A Study on Measures to Promote Industrial Accident Prevention in Workplaces with Less than 50 Employees. Master’s Thesis, Korea University, Seoul, Republic of Korea, 16 July 2009. [Google Scholar]
- Ro, J.S.; Leigh, J.H.; Jeon, I.; Bang, M.S. Trends in burden of work-related upper limb amputation in South Korea, 2004–2013: A nationwide retrospective cohort study. BMJ Open 2019, 9, e032793. [Google Scholar] [CrossRef] [PubMed]
- Ko, S.C.; Eum, T.S.; Song, C.G. Development of Disaster Safety Program for Small-sized Workplaces and Its Introduction to Occupational Safety&Health Act: Focusing on Fire, Explosion and Chemical Spill. J. Converg. Inf. Technol. 2021, 11, 84–90. [Google Scholar] [CrossRef]
- Kim, W.Y.; Cho, H.H. Unions, Health and Safety Committees, and Workplace Accidents in the Korean Manufacturing Sector. Saf. Health Work 2016, 7, 161–165. [Google Scholar] [CrossRef]
- Choi, S.D.; Guo, L.; Kim, J.; Xiong, S. Comparison of fatal occupational injuries in construction industry in the United States, South Korea, and China. Int. J. Ind. Ergon. 2019, 71, 64–74. [Google Scholar] [CrossRef]
- Min, J.; Kim, Y.; Lee, S.; Jang, T.W.; Kim, I.; Song, J. The Fourth Industrial Revolution and Its Impact on Occupational Health and Safety, Worker’s Compensation and Labor Conditions. Saf. Health Work 2019, 10, 400–408. [Google Scholar] [CrossRef]
- Kang, S.Y.; Min, S.; Won, D.; Kang, Y.J.; Kim, S. Suggestion of an Improved Evaluation Method of Construction Companies’ Industrial Accident Prevention Activities in South Korea. Int. J. Environ. Res. Public Health 2021, 18, 8442. [Google Scholar] [CrossRef] [PubMed]
- Ahn, H.; Son, S.; Park, K.; Kim, S. Cost assessment model for sustainable health and safety management of high-rise residential buildings in Korea. J. Asian Archit. Build. Eng. 2021, 21, 689–700. [Google Scholar] [CrossRef]
- Kang, S.Y.; Min, S.; Kim, W.S.; Won, J.H.; Kang, Y.J.; Kim, S. Types and Characteristics of Fatal Accidents Caused by Multiple Processes in Workplace: Based on Actual Cases in South Korea. Int. J. Environ. Res. Public Health 2022, 19, 2047. [Google Scholar] [CrossRef] [PubMed]
- Hwang, S.H.; Kang, S.; Shin, Y. Study on the Risk Assessment of Fall Accidents at Construction Sites Through the Analysis of Accident Cases. J. Korea Acad. Ind. Coop. Soc. 2022, 23, 41–49. [Google Scholar] [CrossRef]
- Moon, J. The effect of subcontractor status on occupational injury and disease incidence: A cross-sectional study using the 9th Occupational Safety and Health Company Survey. Int. Arch. Occup. Environ. Health 2022, 95, 1003–1016. [Google Scholar] [CrossRef]
- Baek, H.; Kim, D.H.; Jeon, Y. A Study on Disclosure Items of Safety and Health Management System for Major Injury Prevention. Crisisonomy 2022, 18, 29–40. [Google Scholar] [CrossRef]
- Choi, J.; Lim, S.; Park, S.; Roh, H.; Jin, H.; Lee, C. The Serious Accidents Punishment Act of South Korea and Its Impact on the Shipping Industry: Toward Sustainability. Sustainability 2022, 14, 8936. [Google Scholar] [CrossRef]
- Hwang, J. Criminal Justice in a Time of Ecological Crisis: Can the Serious Accidents Punishment Act in Korea Be Enforced to Punish ‘Ecocide’? Int. J. Crim. Justice 2022, 4, 30–57. [Google Scholar] [CrossRef]
- DarkLabel. Available online: https://github.com/darkpgmr/DarkLabel (accessed on 4 September 2021).
- Yolo_mark. Available online: https://github.com/AlexeyAB/Yolo_mark (accessed on 24 April 2019).
- CVAT.ai. Available online: https://github.com/opencv/cvat (accessed on 21 April 2023).
- Girshick, R.; Donahue, J.; Darrell, T.; Malik, J. Rich Feature Hierarchies for Accurate Object Detection and Semantic Segmentation. In Proceedings of the IEEE Conference on Computer Vision and Pattern Recognition (CVPR), Columbus, OH, USA, 24–27 June 2014; pp. 580–587. Available online: https://openaccess.thecvf.com/content_cvpr_2014/html/Girshick_Rich_Feature_Hierarchies_2014_CVPR_paper.html (accessed on 1 February 2023).
- Girshick, R. Fast R-CNN. In Proceedings of the IEEE International Conference on Computer Vision (ICCV), Santiago, Chile, 7–13 December 2015; pp. 1440–1448. Available online: https://openaccess.thecvf.com/content_iccv_2015/html/Girshick_Fast_R-CNN_ICCV_2015_paper.html (accessed on 1 February 2023).
- Ren, S.; He, K.; Girshick, R.; Sun, J. Faster R-CNN: Towards Real-Time Object Detection with Region Proposal Networks. In Proceedings of the Advances in Neural Information Processing Systems 28 (NIPS), Montreal, QC, Canada, 10–12 December 2015; Available online: https://proceedings.neurips.cc/paper/2015/hash/14bfa6bb14875e45bba028a21ed38046-Abstract.html (accessed on 1 February 2023).
- He, K.; Gkioxari, G.; Dollar, P.; Girshick, R. Mask R-CNN. In Proceedings of the IEEE International Conference on Computer Vision (ICCV), Venice, Italy, 22–29 October 2017; pp. 2961–2969. Available online: https://openaccess.thecvf.com/content_iccv_2017/html/He_Mask_R-CNN_ICCV_2017_paper.html (accessed on 1 February 2023).
- Redmon, J.; Divvala, S.; Giorshick, R.; Farhadi, A. You Only Look Once: Unified, Real-Time Object Detection. In Proceedings of the IEEE Conference on Computer Vision and Pattern Recognition (CVPR), Las Vegas, NV, USA, 26 June–1 July 2016; pp. 779–788. Available online: https://www.cv-foundation.org/openaccess/content_cvpr_2016/html/Redmon_You_Only_Look_CVPR_2016_paper.html (accessed on 1 February 2023).
- Redmon, J.; Farhadi, A. YOLO9000: Better, Faster, Stronger. In Proceedings of the IEEE Conference on Computer Vision and Pattern Recognition (CVPR), Honolulu, HI, USA, 21–26 July 2017; pp. 7263–7271. Available online: https://openaccess.thecvf.com/content_cvpr_2017/html/Redmon_YOLO9000_Better_Faster_CVPR_2017_paper.html (accessed on 1 February 2023).
- Redmon, J.; Farhadi, A. YOLOv3: An Incremental Improvement. arXiv 2018, arXiv:1804.02767. [Google Scholar] [CrossRef]
- Bochkovskiy, A.; Wang, C.Y.; Liao, H.Y.M. YOLOv4: Optimal Speed and Accuracy of Object Detection. arXiv 2020, arXiv:2004.10934. [Google Scholar] [CrossRef]
- Liu, W.; Anguelov, D.; Erhan, D.; Szegedy, C.; Reed, S.; Fu, C.Y.; Berg, A.C. SSD: Single Shot MultiBox Detector. In Proceedings of the Computer Vision-ECCV 2016: 14th European Conference, Amsterdam, The Netherlands, 11–14 October 2016; Springer: Cham, Switzerland; Volume 9905. [Google Scholar] [CrossRef]
- Lina, W.; Hailong, S.; Cheng, Z.; Zuqiang, M.; Huiwu, L.; Xichun, L.; Yuan, Y.T. Hyperspectral image classification using wavelet transform-based smooth ordering. Int. J. Wavelets Multiresolution Inf. Process. 2019, 17, 1950050. [Google Scholar] [CrossRef]
- Guariglia, E. Primality, Fractality, and Image Analysis. Entropy 2019, 21, 304. [Google Scholar] [CrossRef]
- Zaidi, S.S.A.; Ansari, M.S.; Aslam, A.; Kanwal, N.; Asghar, M.; Lee, B. A survey of modern deep learning based object detection models. Digit. Signal Process. 2022, 126, 103514. [Google Scholar] [CrossRef]
- Wang, C.Y.; Liao, H.Y.M.; Wu, Y.H.; Chen, P.Y.; Hsieh, J.W.; Yeh, I.H. CSPNet: A New Backbone That Can Enhance Learning Capability of CNN. In Proceedings of the IEEE/CVF Conference on Computer Vision and Pattern Recognition (CVPR) Workshops, Virtual, 14–19 June 2020; pp. 390–391. Available online: https://openaccess.thecvf.com/content_CVPRW_2020/html/w28/Wang_CSPNet_A_New_Backbone_That_Can_Enhance_Learning_Capability_of_CVPRW_2020_paper.html (accessed on 1 May 2023).
- He, K.; Zhang, X.; Ren, S.; Sun, J. Spatial Pyramid Pooling in Deep Convolutional Networks for Visual Recognition. IEEE Trans. Pattern Anal. Mach. Intell. (TPAMI) 2015, 37, 1904–1916. [Google Scholar] [CrossRef] [PubMed]
- Liu, S.; Qi, L.; Qin, H.; Shi, J.; Jia, J. Path Aggregation Network for Instance Segmentation. In Proceedings of the IEEE Conference on Computer Vision and Pattern Recognition (CVPR), Salt Lake City, UT, USA, 18–22 June 2018; pp. 8759–8768. Available online: https://openaccess.thecvf.com/content_cvpr_2018/html/Liu_Path_Aggregation_Network_CVPR_2018_paper.html (accessed on 1 May 2023).
- Sandler, M.; Howard, A.; Zhu, M.; Zhmoginov, A.; Chen, L.-C. MobileNetV2: Inverted Residuals and Linear Bottlenecks. In Proceedings of the IEEE Conference on Computer Vision and Pattern Recognition, Salt Lake City, UT, USA, 18–22 June 2018; pp. 4510–4520. Available online: https://openaccess.thecvf.com/content_cvpr_2018/html/Sandler_MobileNetV2_Inverted_Residuals_CVPR_2018_paper.html (accessed on 1 May 2023).
- Duan, K.; Bai, S.; Xie, L.; Qi, H.; Huang, Q.; Tian, Q. CenterNet: Keypoint Triplets for Object Detection. In Proceedings of the IEEE/CVF International Conference on Computer Vision, Seoul, Republic of Korea, 27 October–2 November 2019; pp. 6569–6578. Available online: https://openaccess.thecvf.com/content_ICCV_2019/html/Duan_CenterNet_Keypoint_Triplets_for_Object_Detection_ICCV_2019_paper.html (accessed on 1 May 2023).
- Taejun, L.; Yunjeong, K.; Hoekyung, J. Dataset Construction and Model Learning for Manufacturing Worker Safety Management. J. Korea Inst. Inf. Commun. Eng. 2021, 25, 890–895. [Google Scholar] [CrossRef]
- Disability Awareness in the Workplace. Available online: https://www.kead.or.kr/en/dsawnswplc/cntntsPage.do?menuId=MENU1391 (accessed on 24 April 2023).
- Purpose of Clean Workplace Creation Project. Available online: https://clean.kosha.or.kr/content.do (accessed on 24 April 2023).
- Data Quality Management Guidelines for AI Learning Version 2.0. Available online: https://www.nia.or.kr/site/nia_kor/ex/bbs/View.do?cbIdx=26537&bcIdx=24250&parentSeq=2425 (accessed on 14 March 2022).
- Cai, L.; Zhu, Y. The Challenges of Data Quality and Data Quality Assessment in the Big Data Era. Data Sci. J. 2015, 14, 1–10. [Google Scholar] [CrossRef]
- Picard, S.; Chapdelaine, C.; Cappi, C.; Gardes, L.; Jenn, E.; Lefevre, B.; Soumarmon, T. Ensuring Dataset Quality for Machine Learning Certification. In Proceedings of the 2020 IEEE International Symposium on Software Reliability Engineering Workshops (ISSRE), Coimbra, Portugal, 12–15 October 2020; pp. 275–282. [Google Scholar] [CrossRef]
- Budach, L.; Feuerpfeil, M.; Ihde, N.; Nathansen, A.; Noack, N.; Patzlaff, H.; Naumann, F.; Harmouch, H. The Effects of Data Quality on Machine Learning Performance. arXiv 2022, arXiv:2207.14529. [Google Scholar] [CrossRef]
- Lin, T.Y.; Maire, M.; Belongie, S.; Hays, J.; Perona, P.; Ramanan, D.; Dollar, P.; Zitnick, C.L. Microsoft COCO: Common Objects in Context. In Proceedings of the European Conference on Computer Vision (ECCV), Zurich, Switzerland, 6–12 September 2014; Springer International Publishing: Cham, Switzerland; Volume 5, pp. 740–755. [Google Scholar] [CrossRef]
- The JSON Data Interchange Syntax. Available online: https://www.ecma-international.org/wp-content/uploads/ECMA-404_2nd_edition_december_2017.pdf (accessed on 1 December 2017).
- Vicente, S.; Carreira, J.; Agapito, L.; Batista, J. Reconstructing PASCAL VOC. In Proceedings of the IEEE Conference on Computer Vision and Pattern Recognition (CVPR), Columbus, OH, USA, 24–27 June 2014; pp. 41–48. Available online: https://openaccess.thecvf.com/content_cvpr_2014/html/Vicente_Reconstructing_PASCAL_VOC_2014_CVPR_paper.html (accessed on 1 May 2023).
Disclaimer/Publisher’s Note: The statements, opinions and data contained in all publications are solely those of the individual author(s) and contributor(s) and not of MDPI and/or the editor(s). MDPI and/or the editor(s) disclaim responsibility for any injury to people or property resulting from any ideas, methods, instructions or products referred to in the content. |
© 2023 by the authors. Licensee MDPI, Basel, Switzerland. This article is an open access article distributed under the terms and conditions of the Creative Commons Attribution (CC BY) license (https://creativecommons.org/licenses/by/4.0/).