Abstract
This paper introduces a novel approach for mapping process description with Scan data to Building Information Modeling (BIM) in a 3D Geographic Information System (GIS). The methodology focuses on automatically generating building mass and facade information on the GIS platform using Point Cloud Data (PCD) of Airborne Laser Scanning (ALS). Advanced scanning techniques capture detailed geometry from the physical site and generate high-resolution point clouds, which are processed to create 3D models for GIS integration. The critical contribution of this research lies in a scalable Scan to BIM mapping process, which can be used for generating building footprints and masses, including attributes, on 3D GIS. The resulting integrated BIM–GIS dataset provides an accurate building mass, facade information, facility asset management, and architectural design and facilitates improved decision-making in urban planning based on enhanced visualization, analysis, and simulation. This study suggests a flexible Scan to BIM mapping process description based on use cases, including algorisms. Through prototype development, a case study demonstrates the effectiveness of the process approach, the automatic generation of BIM on a 3D GIS platform, and reducing the manual efforts. The proposed method automatically creates DEM, SHP, GeoJSON, IFC, and coordinate system information from scan data and can effectively map building objects in 3D GIS.
1. Introduction
Integrating BIM and GIS has emerged as a promising approach for enhancing decision-making, collaboration, urban scale simulation in architecture, engineering, and construction (AEC). BIM provides a comprehensive digital representation of buildings, while GIS offers powerful geospatial analysis capabilities. Combining these two technologies holds great potential for improving urban planning, asset management, and digital twin-based simulation as the viewpoint of digital transformation [1]. For example, if there are BIM models generated in GIS, urban environment simulations can be easily performed.
However, capturing the digital data of existing building assets and converting them from BIM to GIS is one of the main challenges in the Scan to BIM mapping process for BIM–GIS integration. Building masses, including attributes, are critical components that must be accurately represented in BIM and GIS datasets. The conversion process of this dataset should be scalable and adjustable according to user requirements and processed based on the GIS coordinate system. PCD processing between these systems in Scan to BIM mapping is time-consuming and error-prone, because it is based on manual processes that are not fully integrated [2], often leading to discrepancies and data inconsistencies. Since it is difficult to reuse the algorithm parameter values used in the manually incompletely integrated Scan to BIM mapping process, these problems are repeated in similar projects.
This paper proposes a flexible Scan to BIM mapping description (SBMD) approach in 3D GIS. This study utilizes ALS technology to capture detailed geometric information from the physical site. The captured PCD is then processed to create highly accurate 3D models that are the basis for integration with GIS.
The main focus of the proposed methodology is a reusable process for the automatic generation of building mass information from ALS datasets by using SBMD. Using a method that allows users to predefine the parameters of an algorithm and reuse it makes the integration between BIM and GIS more efficient and reliable than manual work. The methodology includes extracting the building footprint algorithm, root height, and mass from the PCD obtained in SBMD for 3D GIS.
In conclusion, this paper presents an approach for a flexible Scan to BIM mapping description method in 3D GIS. Automatically generating a building mass, including attributes, in a GIS platform offers significant efficiency, accuracy, and decision-making advantages.
To clarify the research scope, this study analyzes the existing manual-based Scan to BIM mapping process and derives use cases that SBMD can support. The required algorithm models are studied to implement use cases, and the SBMD framework structure is designed to operate within a flexible mapping process. Afterward, the proposed method is implemented as a prototype, and the efficiency compared to manual work is analyzed to review the effect.
2. Research Methods
The research methodology for developing the SBMD in a 3D GIS environment is as follows.
- Conduct a literature search for relevant keywords. The literature review will look at the algorithms used and identify the critical components of the Scan to BIM automation process.
- To clarify the research scope, use cases of BIM object generation necessary for urban planning or building management are investigated with ALS data, such as drones.
- Design the Scan to BIM mapping process framework and algorithm model in the 3D GIS environment based on the first and second results.
- Based on the 3rd result, develop a prototype and analyze the performance. Compared to manual work, the accuracy and productivity of the proposed method were investigated. The performance analysis identifies what needs to be improved and derives considerations for future performance improvements.
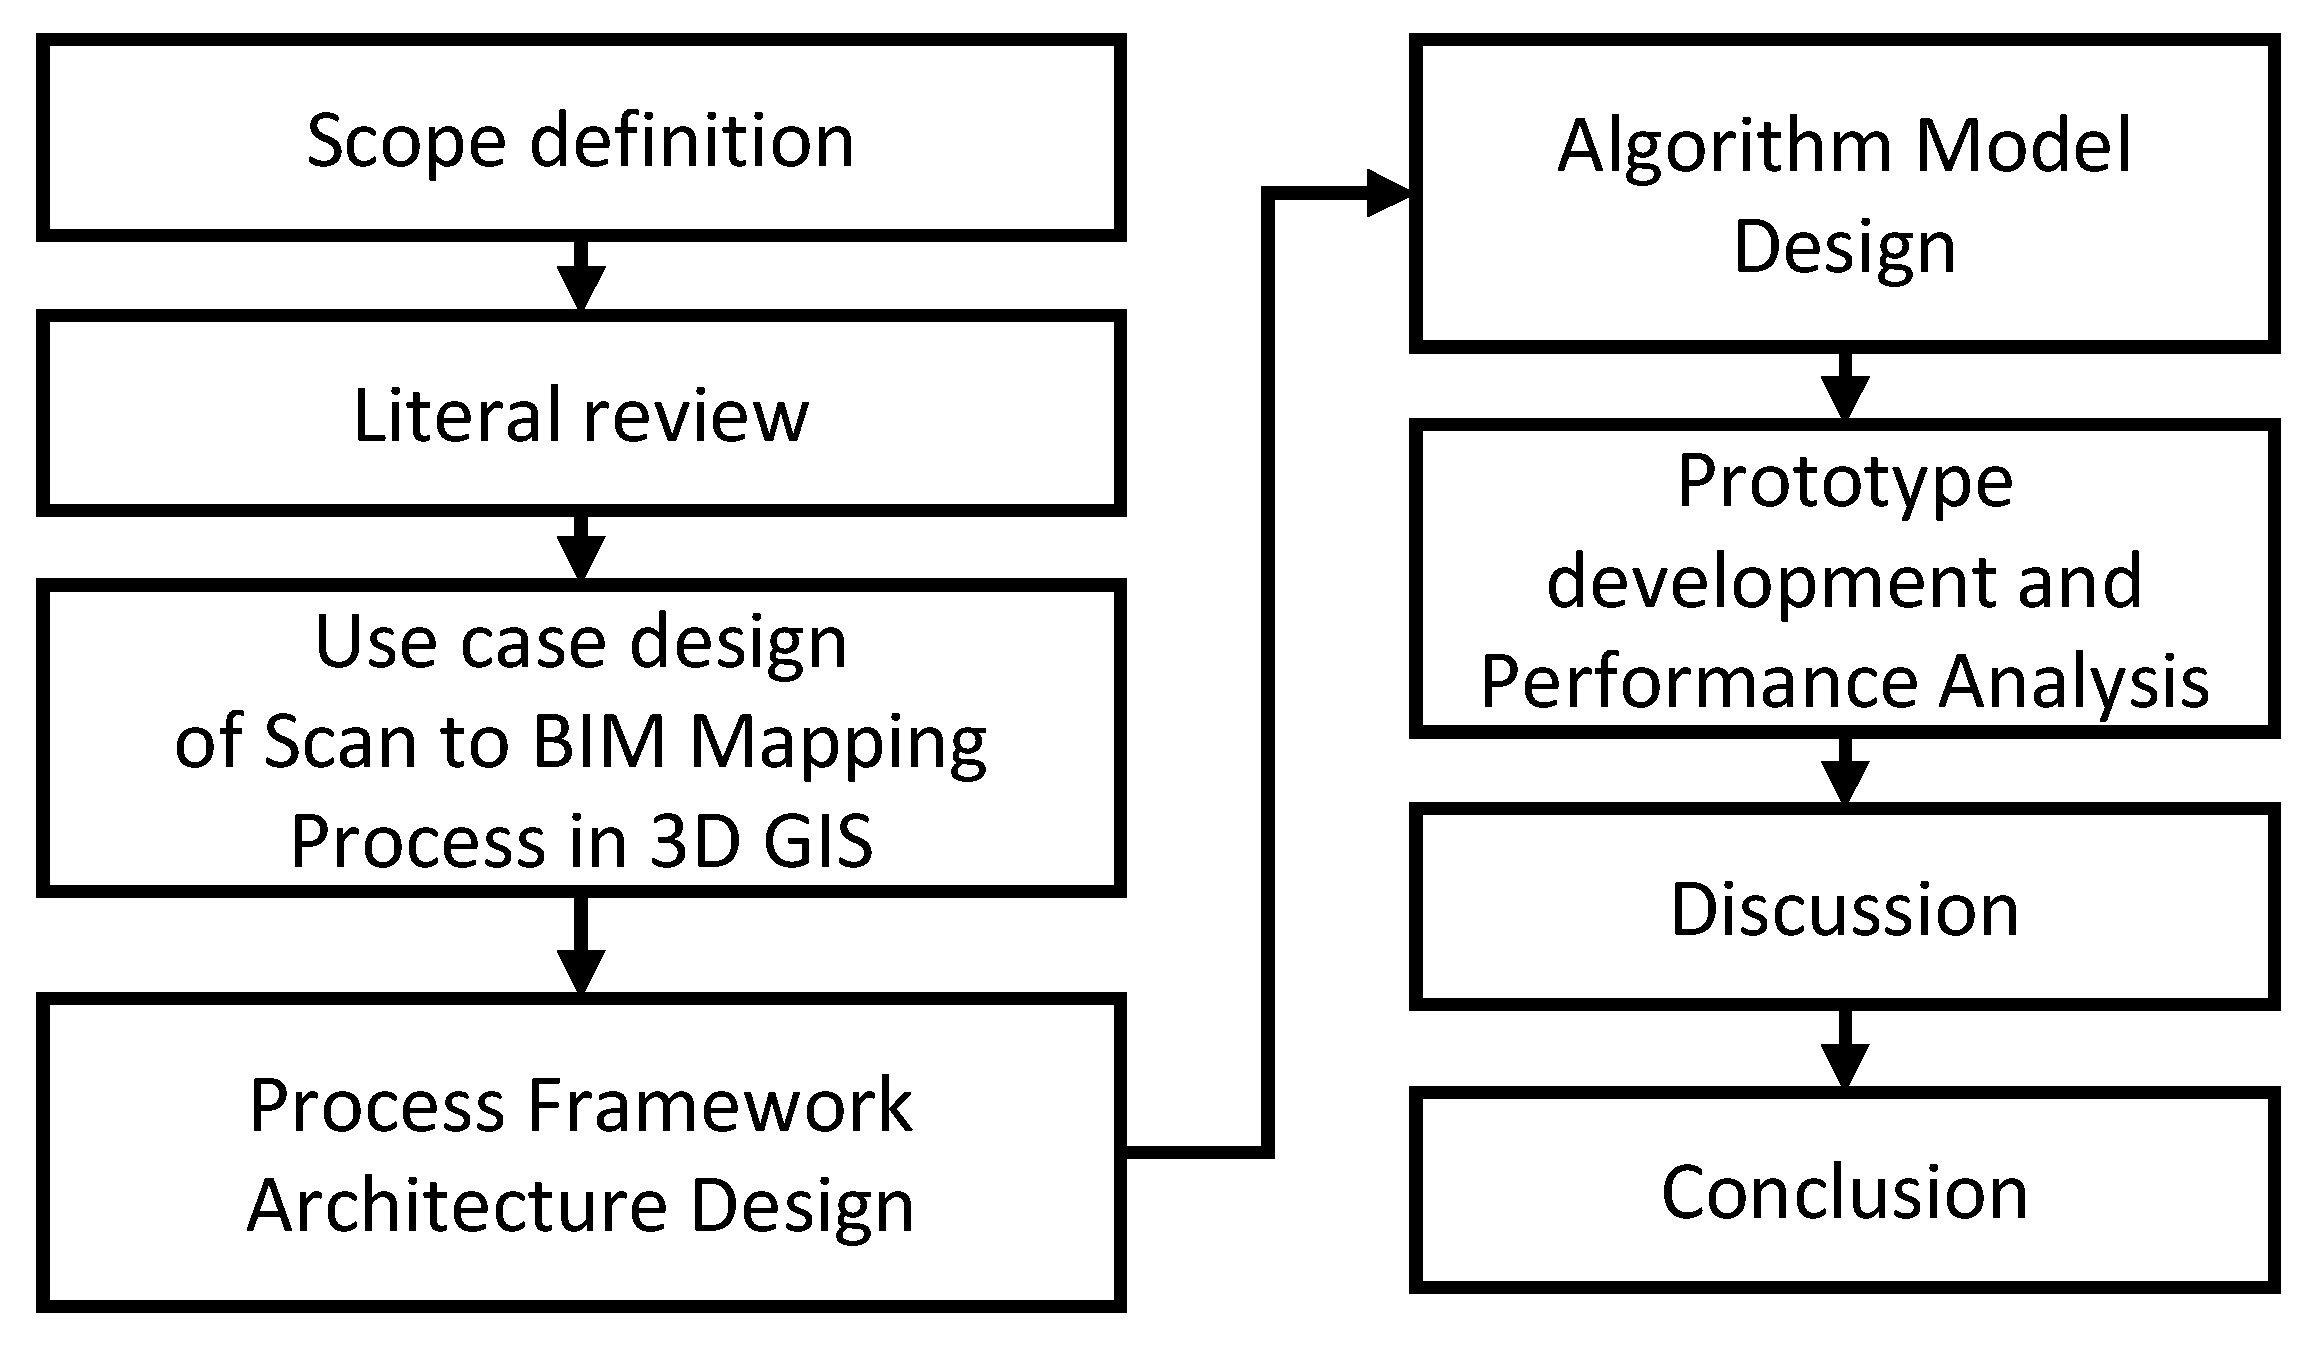
Figure 1 shows the research flow of this study.
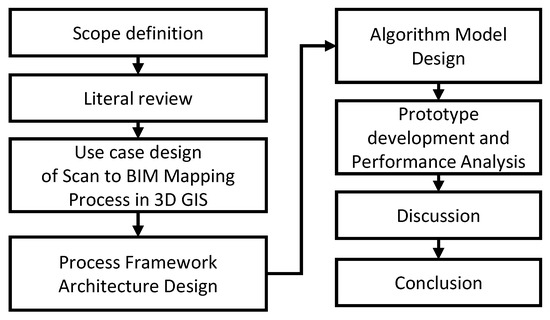
Figure 1.
Research method.
3. Related Works
A literature survey was conducted with the following keywords to survey related processes and algorithms.
“Scan”, “ALS”, “Building”, “Footprint”, “BIM”, “GIS”, “Generation”, “Process”, and “Description”.
Research on the parametric-based urban information modeling method has been conducted for earthquake disaster risk assessments. This study proposes a parametric methodology that supports urban information modeling through finite element analysis [3]. This study created a parametric city model using a geographic data database to create a city information model expressed in SHP (Shapefile format). This study focuses on processing parametric information using the Rhino Tool’s Grasshopper add-in.
A study proposed a method of generating a 2D model by automatically filtering the point cloud of a building acquired using ALS technology [4]. This study established the criteria for extracting the roof of a building based on the z-axis to create a 2D model of a building. Through this, a method of automatically generating a 2D model by extracting the exterior boundary and roof area of a building was proposed.
There was a study on automatically extracting objects required for digital topographic map creation from point clouds obtained through ALS [2]. This study presented the topics of building outline denoising, edge vectorization, segmentation, and artificial intelligence-based building object extraction for the automatic generation of conventional 2D digital maps. This study mentions the discontinuity, incompleteness, and ambiguity of the point cloud. As one of the ways to improve them, the application of a deep learning model based on a Dynamic Graph Convolutional Neural Network (DGCNN) is proposed.
In this study, a feature extraction module such as DGCNN for segmentation was used. This module mainly encodes the features of point cloud data to compute the meaning of the points. For reference, it is challenging to classify walls and windows only with point features in scan scene data. Therefore, deep learning models such as DGCNN encode center point and neighbor point color information in feature extractions [5].
The process of mapping building objects from ALS data presents several challenges. Among them, the method of extracting individual buildings is one factor that significantly influences the quality of the result. Research was conducted to increase instance creation accuracy through a matching process between scan data and polygons [6]. This study proposed a method to generate similar building instance footprints by extracting building roofs and assembling predefined building segments.
A method of generating scan data as voxels was studied to obtain the geometric shape information required for building energy performance simulation [7]. This study used a point-projected grid system and Principal Component Analysis (PCA) to extract the wall elements necessary for an energy performance analysis. Openings such as doors were created by calculating empty grid areas under certain dimensional conditions. Plane intersection calculations fill edge gaps between walls. This study implemented and tested a shape generation technique for a single building.
There was a study on CityGML LoD (Level of Detail) 3 modeling for smart city information model creation [8]. The data source used for modeling was an aerial Digital Terrain Model (DTM) image. In this study, a process using Sketchup, a commercial tool for modeling, was proposed.
There was a study on extracting building footprints considering outliers and missing points in the ALS dataset [9]. This study used a Maximum Consistency within Minimum Distance (MCMD) and Random Sample Consensus (RANSAC) model to obtain the building space. A method for extracting the roof of a building from ALS data has been studied [10]. In this study, after extracting PCD seed points for the roof, a segmentation step is performed to compare the curvatures between the points to grow the roof point cloud region.
There has been a study on building model extraction using ALS data [11]. A Leica CityMapper was used for data collection. This study proposed a method for creating a building shape by extracting the roof contour using the CloudCompare tool and generating a poly surface model using Rhino.
To utilize IFC (Industry Foundation Classes) when creating a GIS information model, there has been a study on the geographic coordinate reference method and calculations [12]. This study describes a technique for mapping the local coordinate system of IFC elements to the GIS coordinate system.
There was a study on constructing a 3D city model from satellite images [13]. This study proposed extracting building segments using the SSD (Single Shot Detector) deep learning model implemented in the ESRI ArcGIS Pro tool and extracting the building height using the DSM (Digital Surface Model).
A study analyzed the CityJSON model’s structure to review the 3D spatial data model [14]. In this study, the data structure and exchange method of CityJSON were examined, and the feasibility of the application was evaluated. There was a study on effectively creating BIM information in GIS [15]. This study presented a method for automatically generating building LoD using IFC files.
There was a study on analyzing building renovation projects using the Ready2BIM tool [16]. This tool supports the BIM modeling process using 3D scan data. Ready2BIM was developed with support from EUREKA and enables web-based IFC and point cloud data viewing.
A study proposed a building area classification method for LiDAR point clouds [17]. In this study, the problem of estimating the building area was pointed out, which often includes unrelated objects other than the roof, causing errors in height estimations. In this study, the buildings were classified using the Random Forest (RF) classifier algorithm, and the difference between height and actual height was confirmed through sample data from one building.
There was a study on data acquisition for urban building energy modeling [18]. This study presented a methodology for acquiring and modeling the dataset required for building energy modeling.
There was a study on extracting dense urban buildings from LiDAR point clouds [19]. This study proposed a methodology to acquire the building area after creating a Digital Surface Model (DSM) from aerial photographs and LiDAR point clouds.
One study presented a modeling methodology for historical buildings [20]. This study investigated the challenges of modeling historic buildings in Malaysia and proposed a method for modeling from scanned point cloud data using ESRI software.
There was a study on the methodology to connect a 3D point cloud and CityGML model [21]. This study proposed a method for generating point clouds from CityGML shapes for digital twin model development. Point cloud data can be used in various fields. A study investigated the automation method for BIM–GIS integration [22]. This study identified the technique required for BIM–GIS integrated automation from 3D scan point cloud data to modeling.
One study proposed a modeling method that can lighten scanned point cloud data for path estimations of an unmanned aerial vehicle such as a drone [23]. This study suggested a method for extracting a bounding box from point cloud data and presented the data compression rate through it.
A study proposed a method for generating a 3D tree model from a LiDAR point cloud [24]. In this study, the roof part was filtered from the point cloud, and the tree area was extracted using the DSM generated from the rest of the point cloud.
A study proposed Scan to BIM technology for digital data management and expression [25]. This study presented the use of Rhino and ArcScene software for Scan to BIM. One study proposed a method of extracting ground from a 3D point cloud [26]. In this study, a ground extraction method using ArcGIS was proposed.
There was a review study on integrating GIS and BIM required for developing a digital twin model for smart city design [27]. This study classified urban structures such as buildings to develop a digital twin model and investigated and analyzed technologies that connect information. There was a study on BIM–GIS data integration to implement a smart city information model [28]. This study proposed the necessary steps to map IFC to GIS.
The research topics investigated focus on generating geometries from scan data, and they are classified as follows.
- Develop the mapping process using existing commercial tools such as ESRI.
- PCD processing algorithms such as point feature calculation and denoising.
- Development of a segmentation algorithm for PCD classification, such as ground surface and building.
- Development of a Vectorization Algorithm for Building Footprint Extraction in Polygon Format such as SHP.
- Development of a building height extraction algorithm.
- A geometry generation algorithm as a 3D object format.
As a result of the investigation, it was identified that the algorithm model that creates geometric objects from scan data varies depending on the characteristics of the scan data and user requirements. For example, extracting the building footprint obtains various results, depending on whether input scan data and algorithm model parameters are used. Since user requirements determine the output quality, the Scan to BIM mapping process without the defined use case inevitably produces undesirable results. The backgrounds and needs of the investigated studies range from the purpose of GIS analysis to the implementation of digital twin models.
Most studies are limited to mapping scan data to GIS without generating BIM objects with fixed models and parameters. The scope of this study proposes a customizable SBMD method with a process and structure that performs Scan to BIM using ALS data in 3D GIS.
4. Scan to BIM Mapping in 3D GIS
4.1. Mapping Process Survey
In this section, to confirm the scope of the study describing the Scan to BIM mapping process, the existing work process is investigated through interviews with three experts with more than seven years of experience in the related field. The experts who participated in the interview carried out various projects for a long time at an aerial surveying company and had experience scanning the entire city through an ALS device and developing LoD2 and LoD3 city models as a major company in the ALS field.
Scan to BIM mapping in 3D GIS proceeds with the steps of extracting the footprint of the building using the vectorizing tool from the PCD obtained from ALS, modeling the geometry, and mapping it on the GIS.
In more detail, ALS data are collected from aerial LiDAR and GPS. The data obtained from each sensor is post-processed to match the acquired data based on a specific coordinate system. Post-processing includes matching data from LIDAR, IMU, GPS, etc. to timestamp units using expensive commercial tools and setting a reference coordinate system.
Matched PCDs are often not of sufficient capacity to be handled by a single computer. Therefore, the PCD file is divided into tile units that can process data using a Global Mapper tool that can process large amounts of data. These tile data files are stripped of unnecessary parts (e.g., the surface) and converted to a Digital Terrain Model (DTM) using a tool such as ESRI ArcGIS Geoprocessing.
The building footprint is extracted after the DTM is converted to a DEM raster model with height information. The extracted footprint is expressed as an initial polygon set composed of vertices at points where the curvature changes. Since this initial polygon set is challenging to use in practice, it undergoes a normalization process such as simplification.
Then, the base and roof heights of each building are extracted from the DEM and ground surface. Then, the 3D building geometry is modeled using Sketchup, Autodesk Revit, etc. The modeled building geometry is mapped on the GIS according to the coordinate system.
This whole process is not easy to achieve the desired result in the first place. Therefore, each step is repeated until a product that satisfies the requirements is obtained.
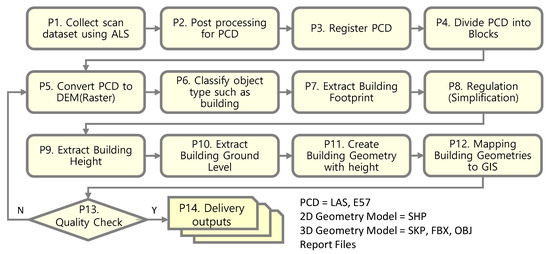
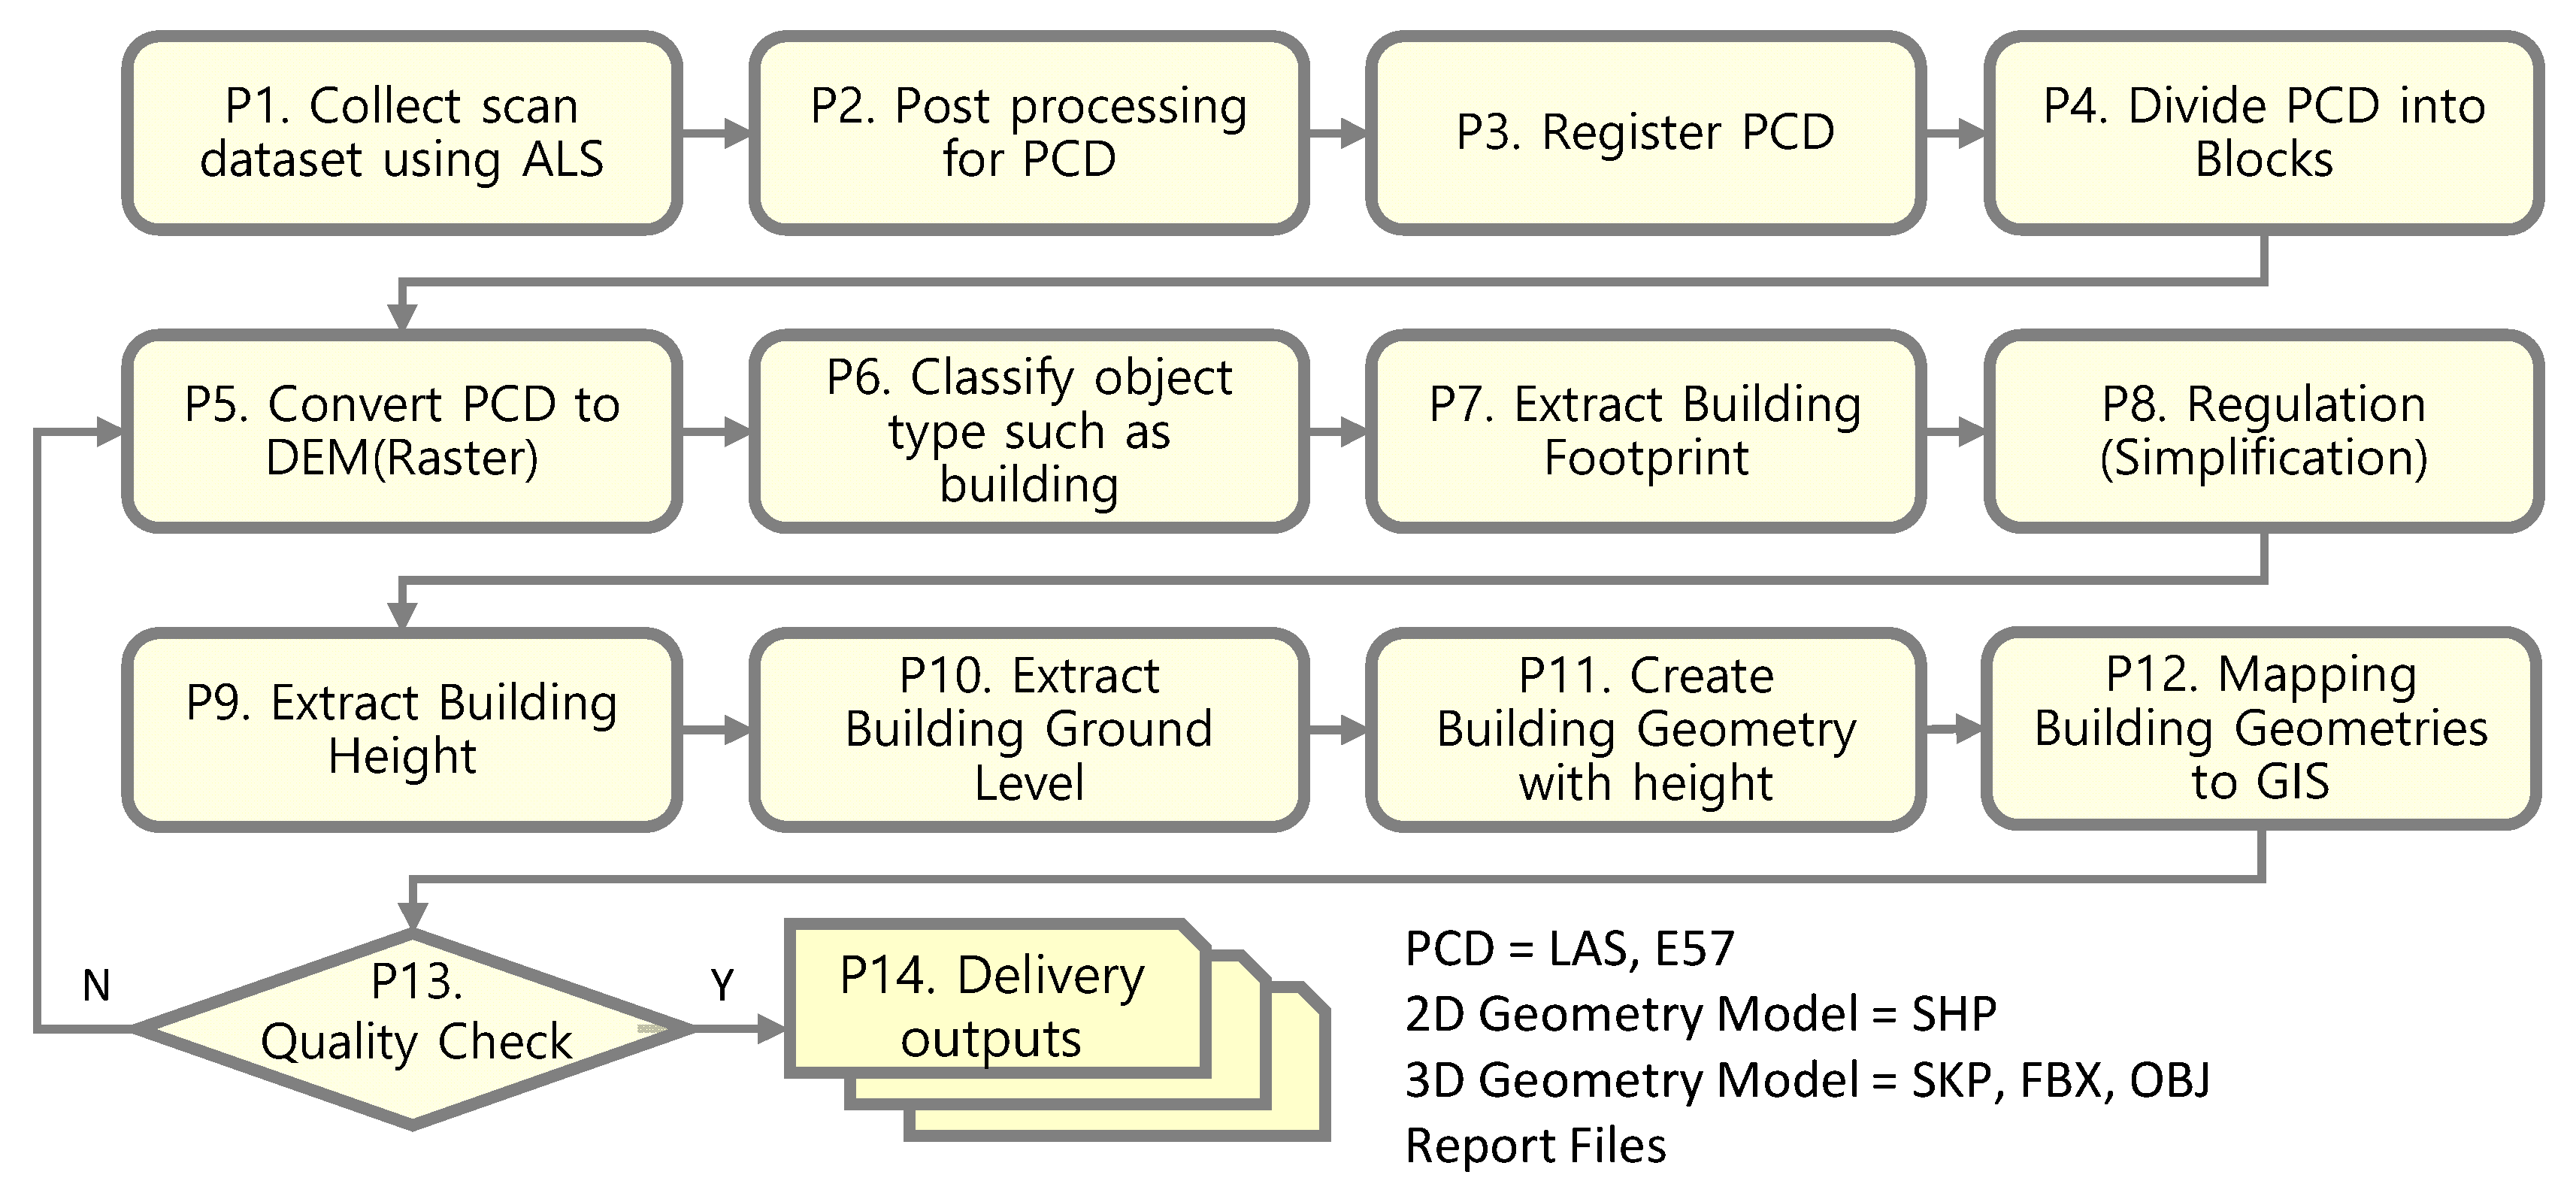
Figure 2.
The building mapping process from the ALS dataset in 3D GIS.

Table 1.
The building mapping process description from the ALS dataset in 3D GIS.
For reference, if the data registration process is performed from P1 to P3 in Table 1, the entire PCD capacity can be terabytes or more. It is difficult to process this big data in limited computer memory. P4 of Table 1 divides and stores large capacity PCD files into blocks that can be operated on a computer considering user requirements or adjust the LoD level of PCD to enable data processing.
The subject of this study is limited to stages P5–P12 related to SBMD.
4.2. Use Cases Design Considering SBMD
A separate method to describe the process is needed for Scan to BIM mapping to select or reuse an algorithm model according to user requirements. Most of the studies and practical procedures investigated above repeat adjusting the PCD’s LoD using various software to obtain the desired result and modifying the parameters to generate appropriate DEM, footprints, and building geometries. If the SBMD language describing the Scan to BIM mapping is provided to the user, they can reuse the pre-described process according to the requirements, and the modified model can be partially used.
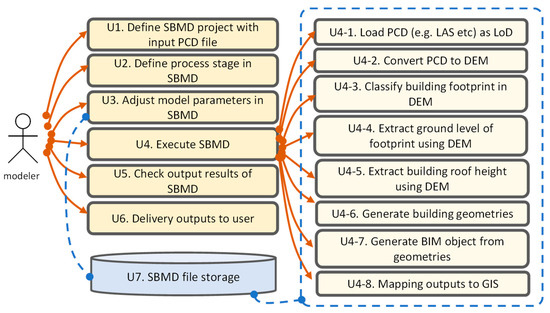
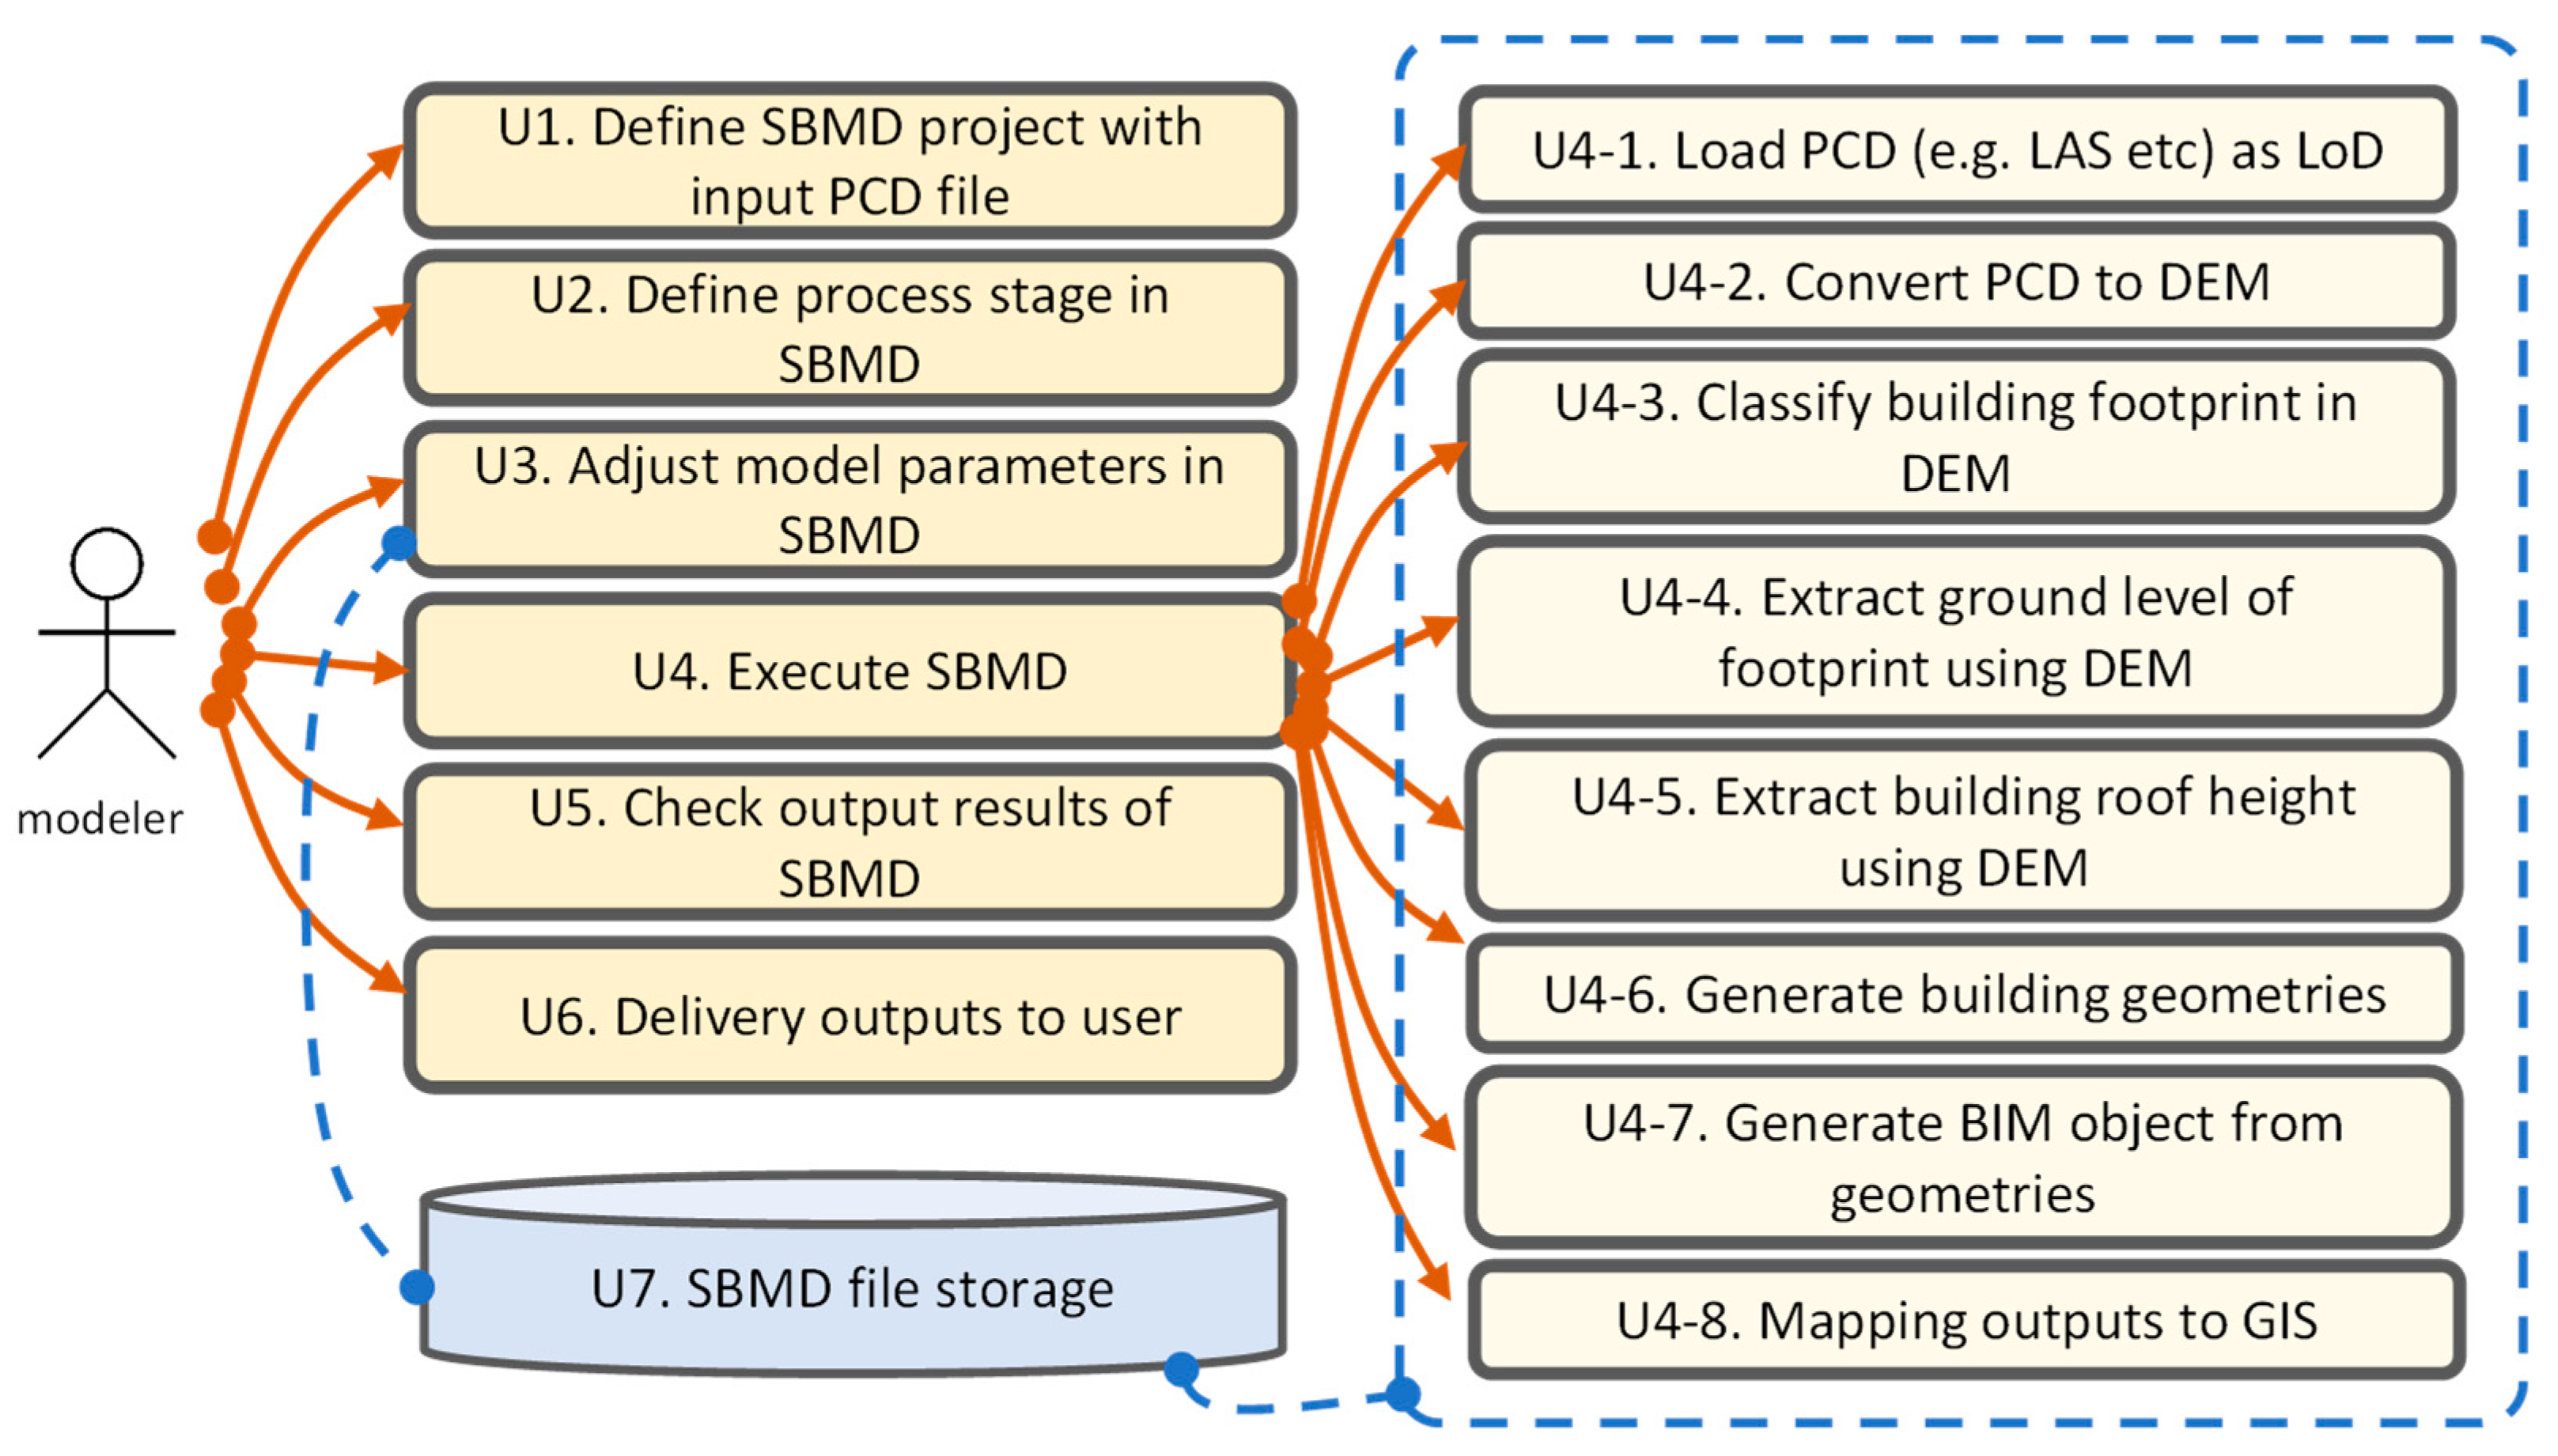
Figure 3.
Use cases diagram for SBMD.
Table 2.
Use cases function of SBMD.
5. SBMD Process Framework Design
5.1. Process Framework Architecture Design
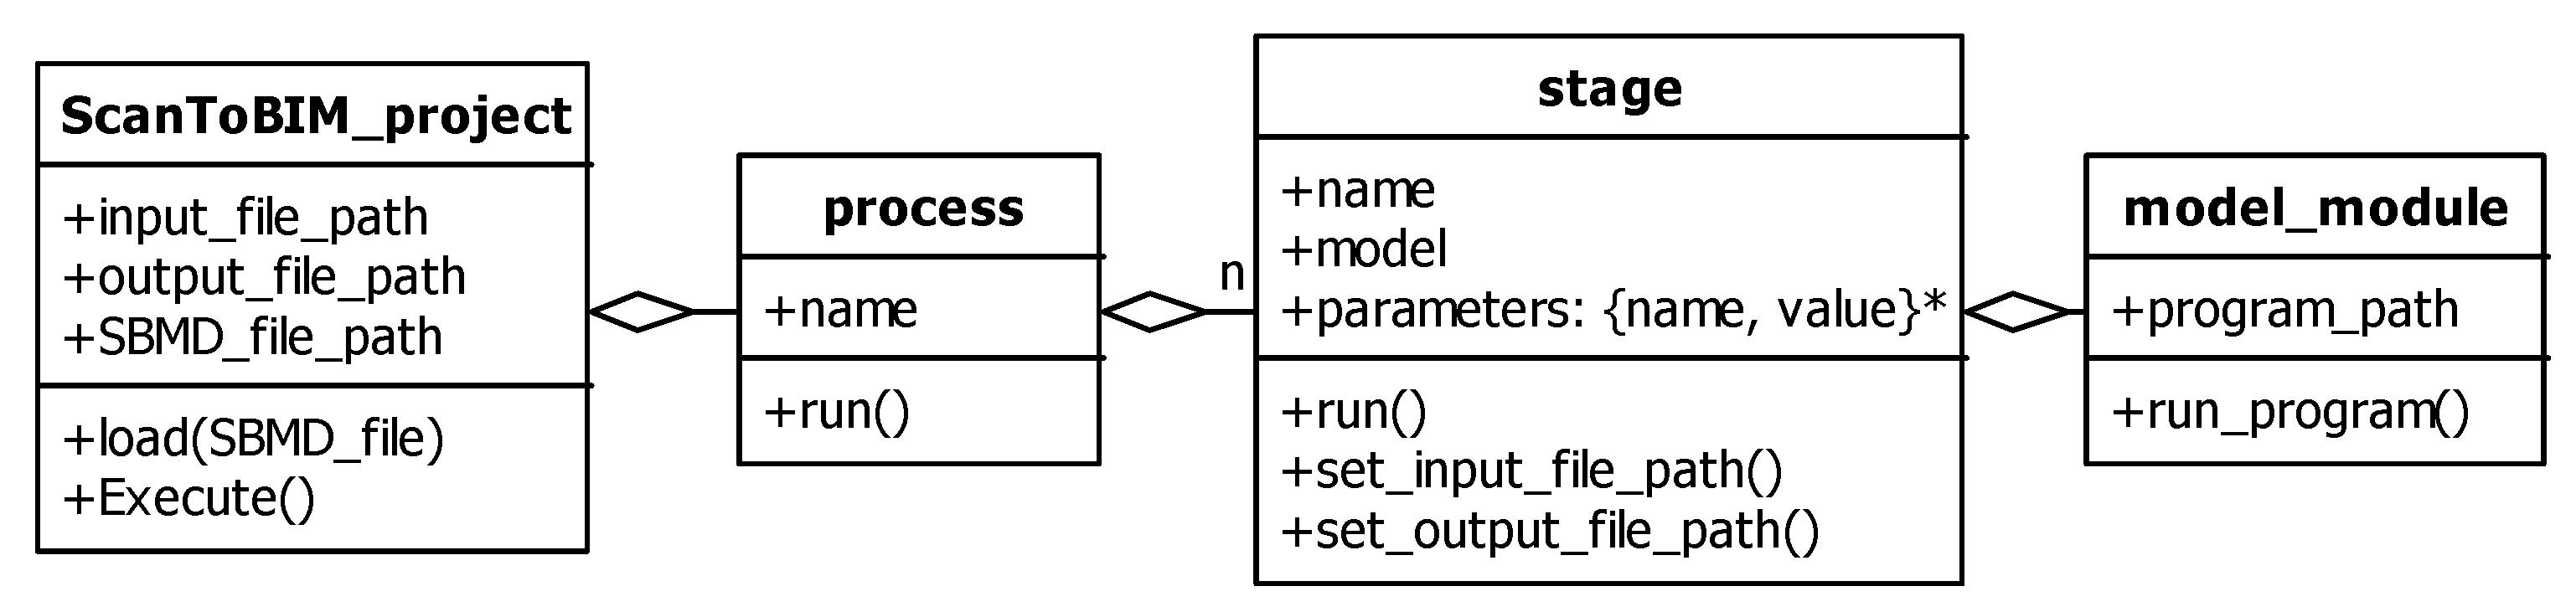
Based on the previously defined Figure 3 and Table 2, the SBMD process framework structure is defined using UML (Unified Modeling Language).
SBMD defines a process consisting of several stages. A stage consists of the algorithm model to be used with the related parameters. A stage with a recursive structure receives the result calculated in the previous stage as an input file, calculates it by the specified model, and saves the result again as a file. The stage calls an external program module that contains model calculation logic. In this way, each stage can be executed independently or operated as a component of a connected process like Lego blocks.
Figure 4 shows the SBMD structure in UML.

Figure 4.
Process framework architecture (UML. * = multiple).
The model parameters, input file path, and output file path at each stage are transferred to the program of the connected model_module object when executed.
5.2. Algorithm Model Definition
This section defines the part corresponding to the stage model defined in Figure 4. To generate the building geometry in the 3D GIS environment, the algorithm model for the previously described steps U4-1 to U4-8 must be specified. The algorithm model for each step is shown in Table 3.
Table 3.
Algorithm models to generate BIM in 3D GIS.
In addition to the building density, conditions such as the point cloud density, DEM resolution, and presence or absence of objects around the building may be required in order to obtain the height information with accuracy when there are many changes in the topography or around complex buildings. If there is no significant change in the height of the site around the building and there are few objects, the method using the offset polygon of the footprint can be used.
The function algorithm Algorithms 1 for calculating by using the offset polygon is defined as follows.
| Algorithms 1: building footprint’s ground level calculation |
| for in : = = 1e+10 for vertex in : = (vertex.x, vertex.y) if >: = = |
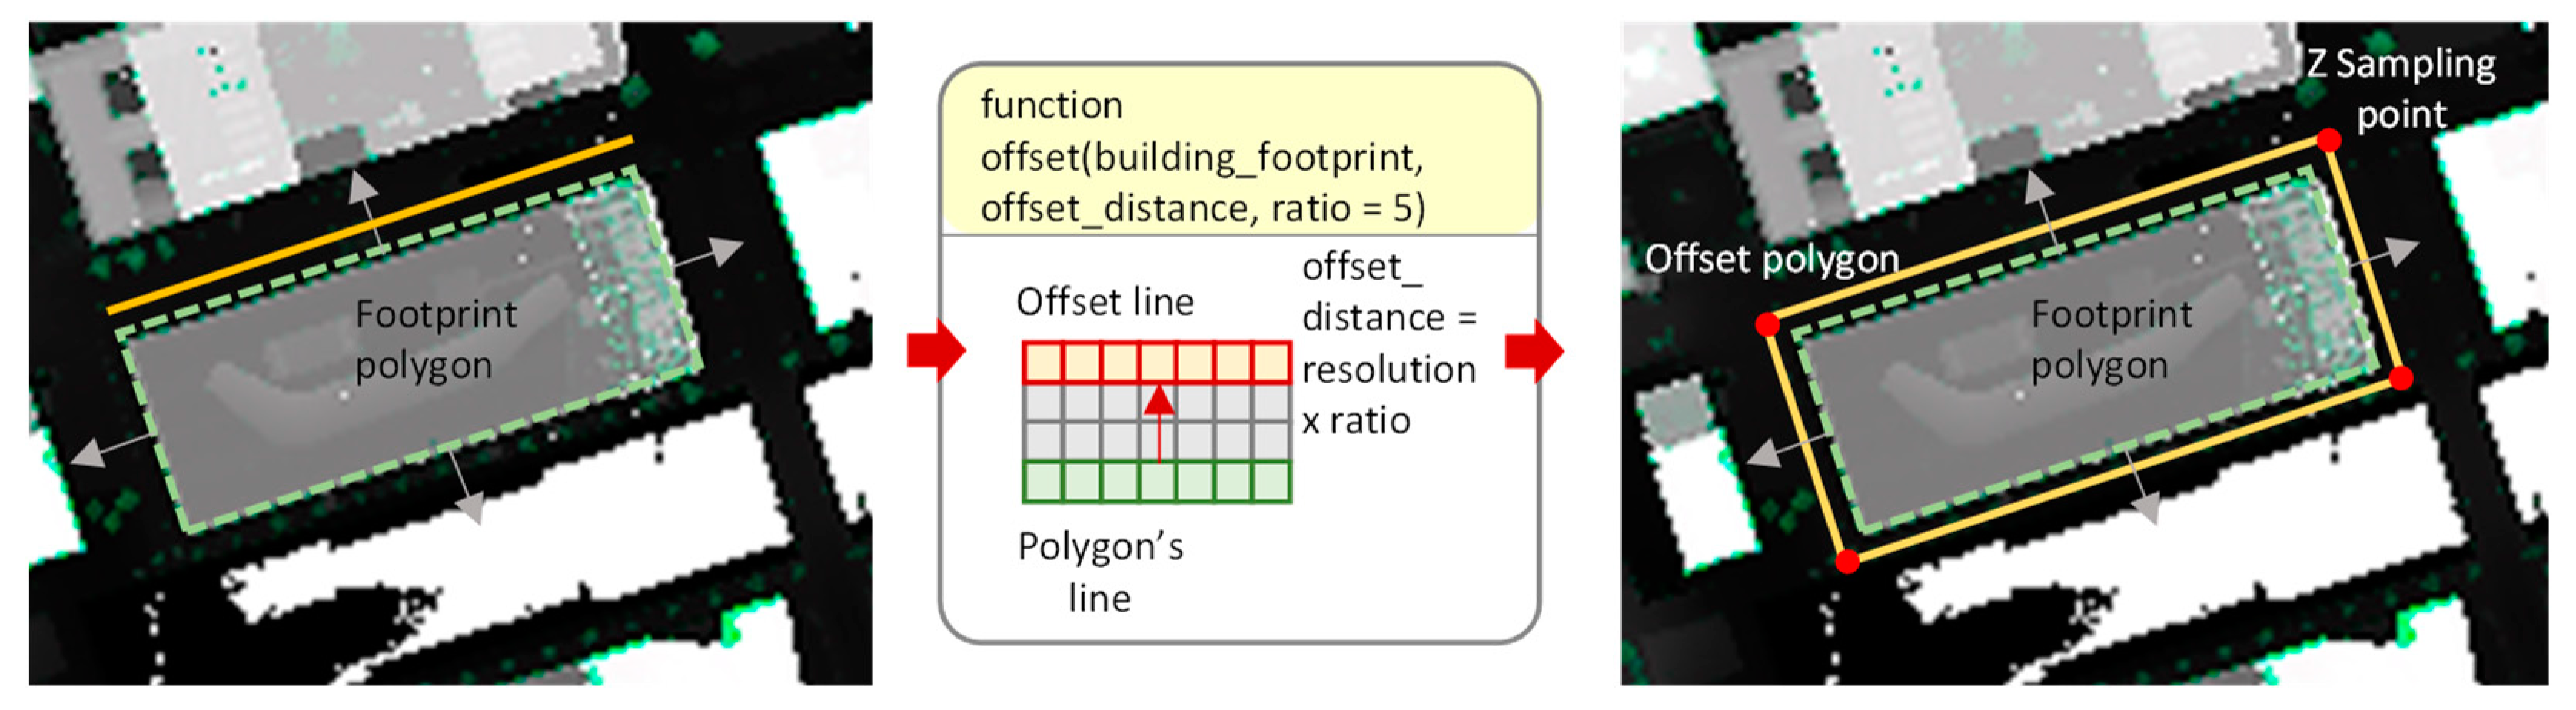
The offset polygon’s vertices are used as the basis for sampling the z-value to obtain the . Here, the value around the building may vary according to the offset distance. In a place where the height of terrain changes rapidly or in an environment where buildings are dense, the difference in the value may be considerable depending on the offset distance. This study’s offset distance value was three to five times the DEM resolution.
Figure 5 shows the process of calculating the of a building.

Figure 5.
Building roof height calculation method (dashed green = footprint, yellow = offset polygon, and red dot = z-value sampling point).
The calculation algorithm is also almost similar to Algorithms 1; the difference is that, instead of the minimum z-value, the z-average value of the shrinking polygon’s vertex is calculated. For reference, calculating these values may also vary, depending on the user requirements.
6. Prototype Development and Performance Analysis
6.1. Prototype Development
Based on the previously defined SBMD, JSON-based Scan to BIM mapping Description Language (SBDL) was developed. SBDL has the following simple syntax so that the algorithm module parameters of the U4 use cases level can be defined as extensible.
| “Scan to BIM mapping Description Language”: [ { “type”: “[algorithm module name]”, “[parameter]”: “[value]”, … }, … ] |
The following is the project example file using SBDL to execute the Scan to BIM process in 3D GIS with the SBMD tool developed by Python. In this example, the resolution for DEM generation is 0.2, and the contour z-value for classifying the building in DEM is defined as “extract_pixel_min_z_value” and “ex-tract_pixel_max_z_value”. The “simplify_factor” parameter to simplify the footprint’s polygons is 10.0, and the “remove_area” parameter is defined to remove small objects such as trees and vehicles.
| { “Scan_to_BIM.process”: [ { “type”: “pcd_to_dem”, “resolution”: 0.2, “classification”: “building” }, { “type”:”dem_to_geo”, “extract_pixel_min_z_value”: 60, “extract_pixel_max_z_value”: 200, “simplify_factor”: 10.0, “remove_area”: 20.0, “output_dataset”: “dimension.csv”, “output_pset”: “json” }, { “type”:”geo_to_bim_outdoor”, “link_pset”: “link_propertyset.json” } ] } |
The SBMD project file described using SBDL is interpreted by the SBDL parser, and the objects and relationships based on UML defined in Figure 4 are automatically generated. When the SBMD project file is executed along with the input/output folder, “[parameter]” set is transmitted to the algorithm module specified in the “type” of each stage, the input data is calculated, and the output files are saved in the output data folder.
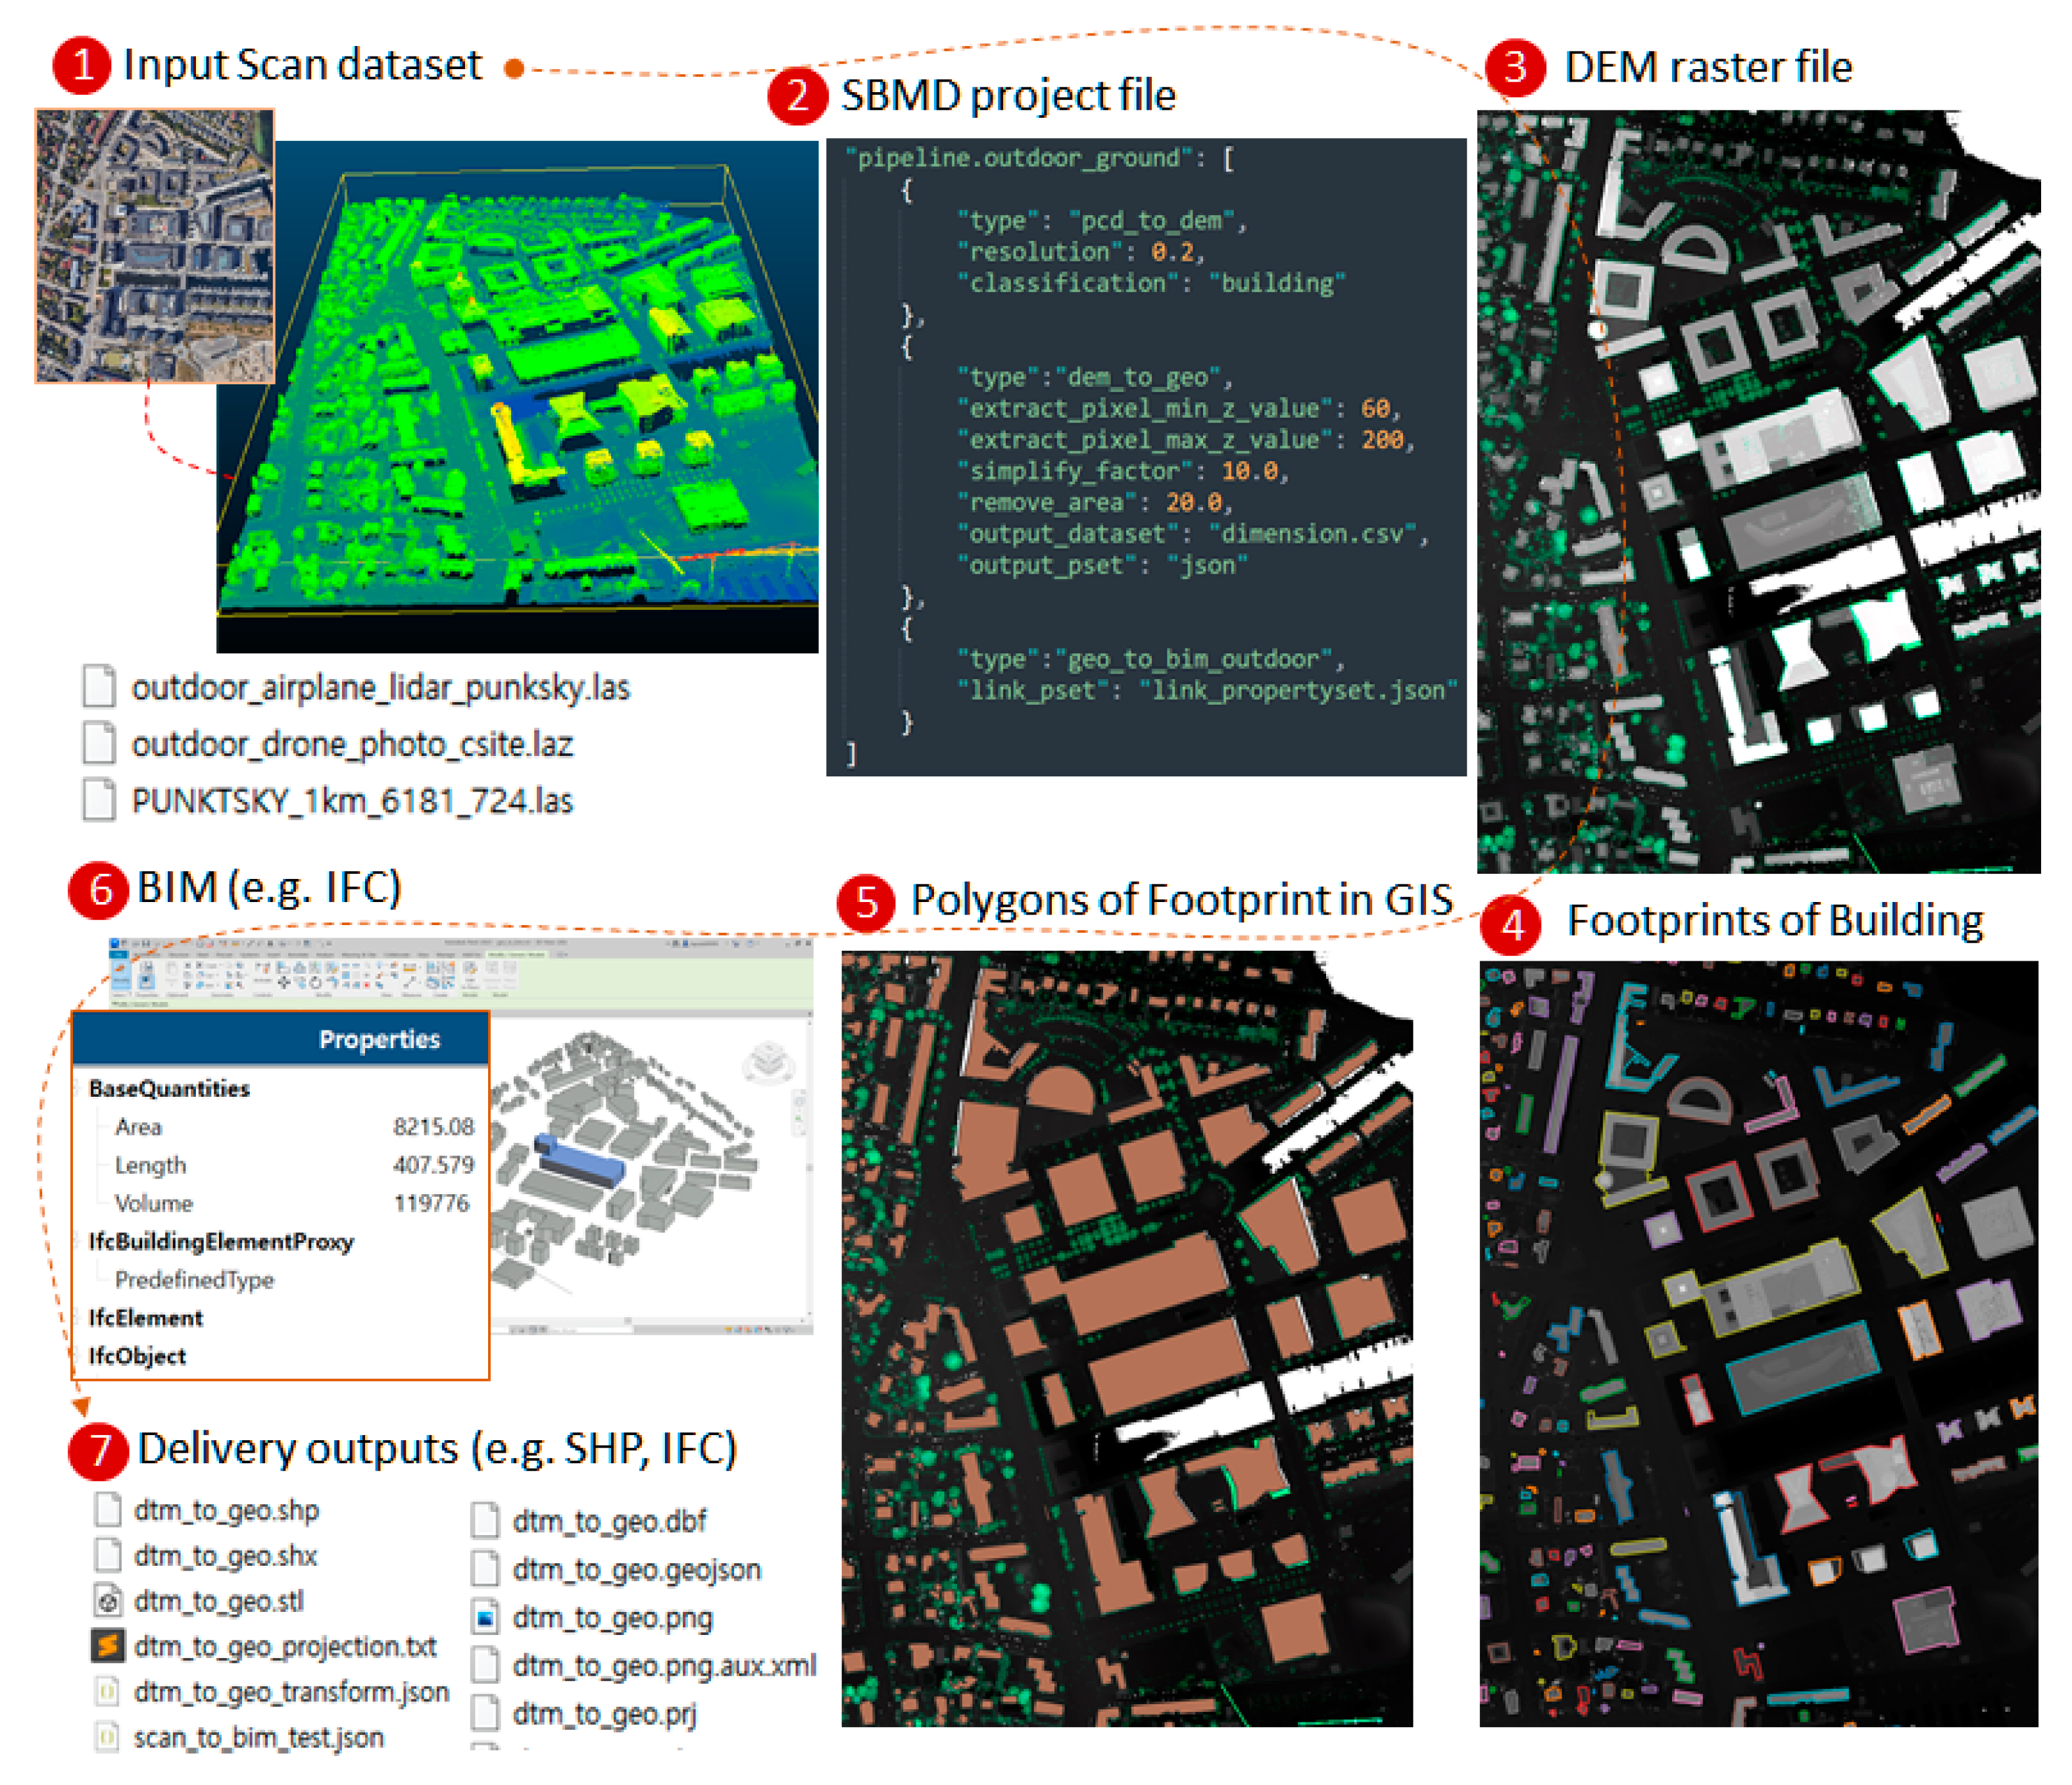
The program call logic is implemented so that the algorithm logic module can be called with the name specified in “type”. Figure 6 shows the SBMD execution sequence. For the SBMD test, the scan data (Tuborg Havnepark, Denmark) registered using the ALS tool was used. The scan data volume with a length of 566 m by 775 is 238.2 MB.
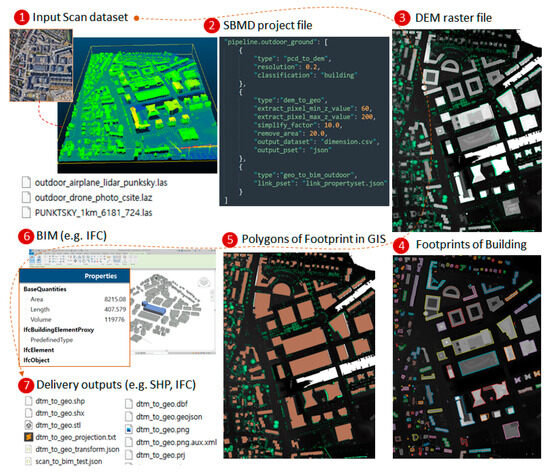
Figure 6.
Results of the SBMD execution.
In Figure 6, the SBMD in step 2 defined the following parameters for each step.
- PCD to DEM step: pixel resolution for DEM generation = 0.2.
- DEM to Geometry step: minimum height for extracting buildings from DEM = 60, maximum height for extracting buildings = 200, simplification factor = 10 [29], minimum area for removing small objects other than buildings from DEM = 20, dimension data output file including footprint polygon after geometry calculation = dimension.csv, and output property format = json.
- Geometry to BIM step: link_pset = Define properties such as area and length to be added when creating the IFC file.
As a result of running the SBMD Project, outputs such as SHP, GeoJSON, and IFC are created, and a projection file containing the GIS coordinate system information of the LAS input file for GIS mapping is generated, like below.
| UNIT[“meter”, 1, AUTHORITY[“EPSG”, “9001”]], AXIS[“Gravity-related height”, UP], AUTHORITY[“EPSG”, “5799”]]] |
6.2. Results Analysis
Through the SBMD method, even if the type and characteristics of the input dataset are changed, only JSON, which is a text format, needs to be modified so that the process can be easily reused and expanded.
For the developed SBMD test, an ALS LAS dataset, including 5,067,019 points, was used. As a result of SBMD execution, all 178 buildings with attribute information included in the scan data were automatically generated (Figure 7).
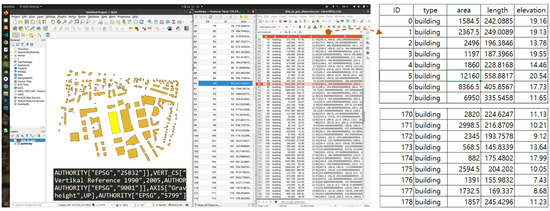
Figure 7.
Building information list generated by SBMD.
The execution time for 3D building creation was 71 s (Intel i9, 32GB, GPU memory 8GB). The SBMD process saved the coordinate system information necessary for GIS mapping, along with SHP, GeoJSON, and the IFC file during the Scan to BIM conversion, so the result could be visualized in a GIS program such as QGIS in Figure 7.
For the analysis, a comparison between manual modeling using Revit and the SBMD execution time was performed, as shown in Table 4. For the comparison, an engineer with more than 7 years of experience in Scan to BIM engineering measured the BIM modeling time using Autodesk Revit, and the SBMD method’s operation time with the generated information was measured.
Table 4.
Performance analysis of the SBMD compared to manual work (unit = second).
The indicators were defined as the Tm (manual work time), Ts (SBMD execution time), Am (area by manual modeling), As (area generated by SBMD), Vm (inputted vertices by manual), and Vs (vertices generated by SBMD).
As a result, 2.26% fewer polygon areas (Error) in the manual-generated footprint were entered compared to the SBMD, 110.21% AoI (Amount of Information ratio) improved, and the generation speed (SBPm) was 23.7 times higher (Table 5).
Table 5.
Error and information amount analysis of the SBMD compared with manual work.
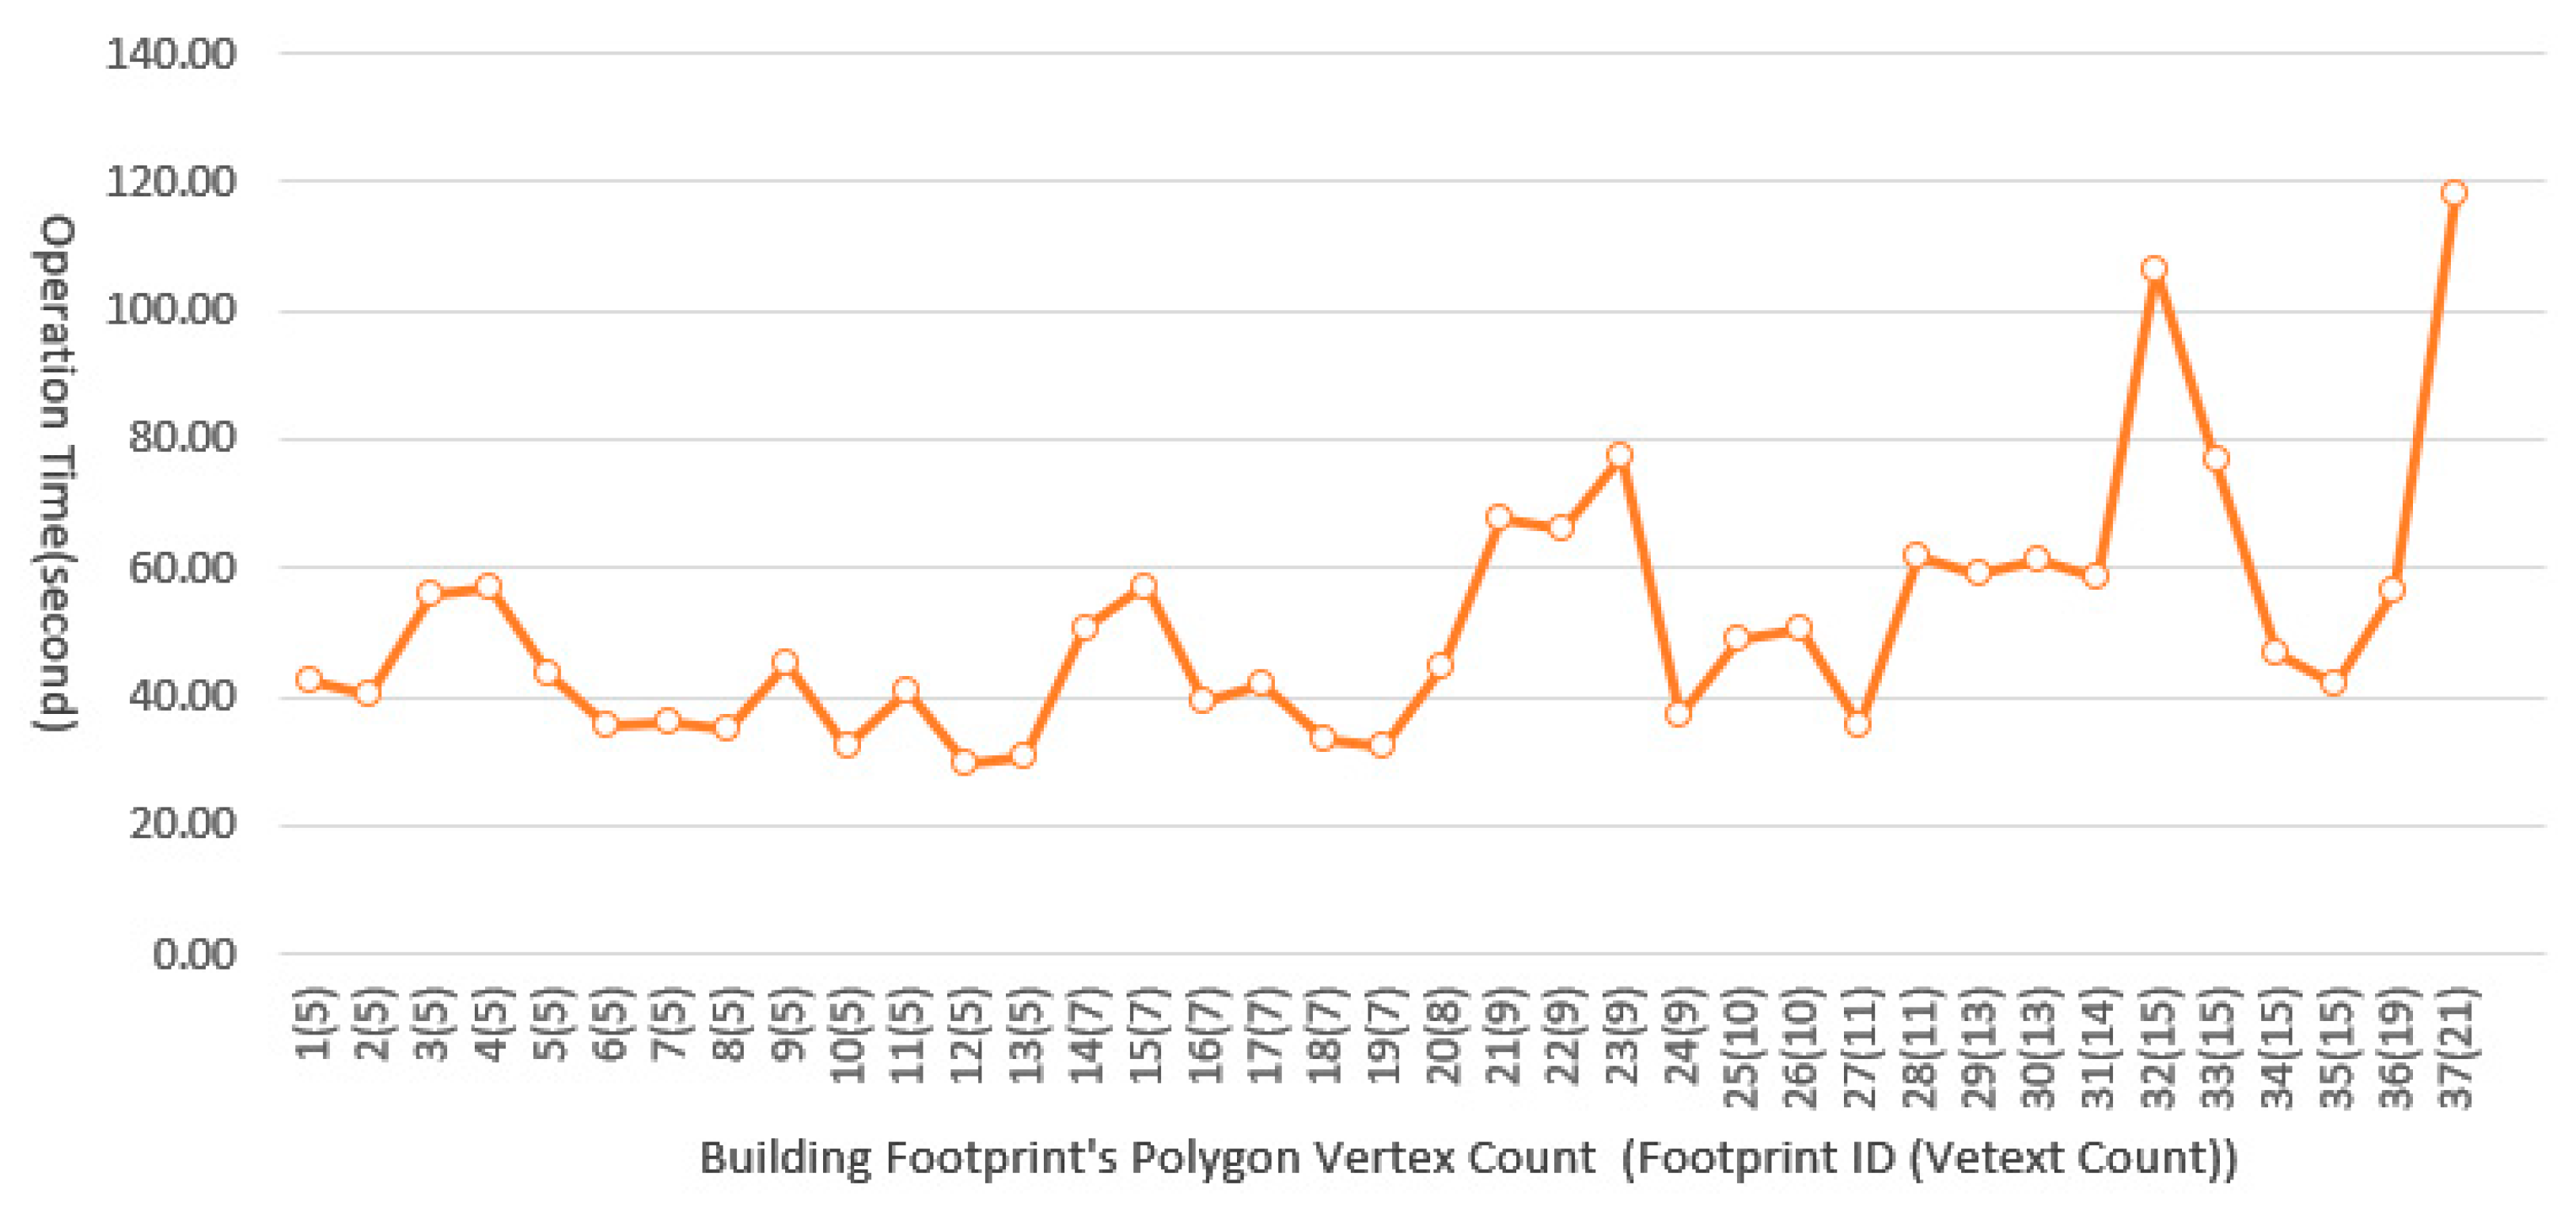
The manual operation times were compared according to the number of vertices in the footprint polygons. As a result, it was confirmed that, as the number of polygon vertices to be input increased, the variation in the working time increased (Figure 8). Figure 8 shows that, the larger the scan data, the more the quality of footprint generation depends on the modeler’s experience.

Figure 8.
Manual operation time analysis for footprint generation in the Scan dataset (x-axis = vertex input count about each building footprint’s polygon, y-axis = second).
The SBMD method can be automated by connecting the algorithm modules required for footprint and BIM object generation, and it can deal with these problems more effectively because it can adjust the exposed model parameters according to the characteristics of the scanned dataset.
7. Conclusions and Future Work
This paper proposes the SBMD method in a 3D GIS environment. A case study based on the prototype development demonstrates the effectiveness of the process approach, the automatic generation of BIM on a 3D GIS platform, and reducing the manual efforts.
The proposed method can be automated by connecting the algorithm modules for Scan to BIM in 3D GIS. The SBMD automatically creates DEM, SHP, GeoJSON, IFC, and coordinate information from scan data and can effectively map building objects in a 3D GIS environment. As a result of the SBMD performance analysis, the difference in the area error of the input building footprint was 2.26% compared to the manually generated footprint, and the amount of information was 110.21% higher, but the building information generation speed performance was 23.7 times faster. The SBMD process can generate SHP, GeoJSON, and IFC files with the coordinate system information necessary for GIS mapping, which can be visualized in GIS programs such as QGIS and used in BIM programs such as Autodesk Revit.
BIM–GIS digital transformation using SBMD can usefully support urban planning, asset management, and digital twin-based simulation. In the future, research will be conducted to classify building segments in terrains with large height differences and to create LoD shapes with high accuracy based on deep learning.
Funding
This research was supported by a grant “3D vision & AI based Indoor object Scan to BIM pipeline for building facility management” of the Korea Institute of Civil Engineering and Building Technology(KICT).
Institutional Review Board Statement
Not applicable.
Informed Consent Statement
Not applicable.
Data Availability Statement
Not applicable.
Conflicts of Interest
The author declares no conflict of interest.
References
- Kang, T. Development of a conceptual mapping standard to link building and geospatial information. ISPRS Int. J. Geo-Inf. 2018, 7, 162. [Google Scholar] [CrossRef]
- Widyaningrum, E. Automatic Object Extraction from Airborne Laser Scanning Point Clouds for Digital Base Map Production. Ph.D. Thesis, Delft University of Technology, Delft, The Netherlands, 2021. [Google Scholar]
- La Russa, F.M.; Intelisano, M.; Galizia, M.; Caliò, I.; Santagati, C. An expeditious parametric approach for City Information Modeling and Finite Element Analysis. Int. Arch. Photogramm. Remote Sens. Spat. Inf. Sci. 2022, 46, 307–314. [Google Scholar] [CrossRef]
- Tarsha Kurdi, F.; Awrangjeb, M.; Munir, N. Automatic filtering and 2D modeling of airborne laser scanning building point cloud. Trans. GIS 2021, 25, 164–188. [Google Scholar] [CrossRef]
- Zeng, Z.; Xu, Y.; Xie, Z.; Tang, W.; Wan, J.; Wu, W. LEARD-Net: Semantic segmentation for large-scale point cloud scene. Int. J. Appl. Earth Obs. Geoinf. 2022, 112, 102953. [Google Scholar] [CrossRef]
- Xia, S.; Xu, S.; Wang, R.; Li, J.; Wang, G. Building instance mapping from ALS point clouds aided by polygonal maps. IEEE Trans. Geosci. Remote Sens. 2021, 60, 5700813. [Google Scholar] [CrossRef]
- O’Donnell, J.; Truong-Hong, L.; Boyle, N.; Corry, E.; Cao, J.; Laefer, D.F. LiDAR point-cloud mapping of building façades for building energy performance simulation. Autom. Constr. 2019, 107, 102905. [Google Scholar] [CrossRef]
- Buyukdemircioglu, M.; Kocaman, S. Reconstruction and efficient visualization of heterogeneous 3D city models. Remote Sens. 2020, 12, 2128. [Google Scholar] [CrossRef]
- Nurunnabi, A.; Teferle, N.; Balado, J.; Chen, M.; Poux, F.; Sun, C. Robust techniques for building footprint extraction in aerial laser scanning 3D point clouds. Int. Arch. Photogramm. Remote Sens. Spat. Inf. Sci. 2022, XLVIII-3/W, 48. [Google Scholar] [CrossRef]
- Shao, J.; Zhang, W.; Shen, A.; Mellado, N.; Cai, S.; Luo, L.; Wang, N.; Yan, G.; Zhou, G. Seed point set-based building roof extraction from airborne LiDAR point clouds using a top-down strategy. Autom. Constr. 2021, 126, 103660. [Google Scholar] [CrossRef]
- Costantino, D.; Vozza, G.; Alfio, V.S.; Pepe, M. Strategies for 3D Modelling of Buildings from Airborne Laser Scanner and Photogrammetric Data Based on Free-Form and Model-Driven Methods: The Case Study of the Old Town Centre of Bordeaux (France). Appl. Sci. 2021, 11, 10993. [Google Scholar] [CrossRef]
- Zhu, J.; Wu, P. A common approach to geo-referencing building models in industry foundation classes for BIM/GIS integration. ISPRS Int. J. Geo-Inf. 2021, 10, 362. [Google Scholar] [CrossRef]
- Pepe, M.; Costantino, D.; Alfio, V.S.; Vozza, G.; Cartellino, E. A novel method based on deep learning, GIS and geomatics software for building a 3D city model from VHR satellite stereo imagery. ISPRS Int. J. Geo-Inf. 2021, 10, 697. [Google Scholar] [CrossRef]
- Apeh, M.M.; Abdul Rahman, A. A Review of 3D Spatial Data Models for Surface and Subsurface Integration of Spatial Objects. Int. Arch. Photogramm. Remote Sens. Spat. Inf. Sci. 2023, 48, 15–23. [Google Scholar] [CrossRef]
- Zhu, J.; Wu, P.; Anumba, C. A semantics-based approach for simplifying IFC building models to facilitate the use of BIM models in GIS. Remote Sens. 2021, 13, 4727. [Google Scholar] [CrossRef]
- Gyuris, P.; Pal, B.; Benedek, C.; Janko, Z. Collaborative research and innovation project for revitalizing the BIM process. e-Zbonik Electron. Collect. Pap. Fac. Civ. Eng. 2021, 22, 11–19. [Google Scholar] [CrossRef]
- Park, Y.; Guldmann, J.M. Creating 3D city models with building footprints and LIDAR point cloud classification: A machine learning approach. Comput. Environ. Urban Syst. 2019, 75, 76–89. [Google Scholar] [CrossRef]
- Wang, C.; Ferrando, M.; Causone, F.; Jin, X.; Zhou, X.; Shi, X. Data acquisition for urban building energy modeling: A review. Build. Environ. 2022, 217, 109056. [Google Scholar] [CrossRef]
- Guo, L.; Deng, X.; Liu, Y.; He, H.; Lin, H.; Qiu, G.; Yang, W. Extraction of dense urban buildings from photogrammetric and LiDAR point clouds. IEEE Access 2021, 9, 823–832. [Google Scholar] [CrossRef]
- Mohd Noor, N.; Ibrahim, I.; Abdullah, A.; Abdullah, A.A.A. Information fusion for cultural heritage three-dimensional modeling of Malay cities. ISPRS Int. J. Geo-Inf. 2020, 9, 177. [Google Scholar] [CrossRef]
- Beil, C.; Kutzner, T.; Schwab, B.; Willenborg, B.; Gawronski, A.; Kolbe, T.H. Integration of 3D point clouds with semantic 3D city models–providing semantic information beyond classification. ISPRS Ann. Photogramm. Remote Sens. Spat. Inf. Sci. 2021, 8, 105–112. [Google Scholar] [CrossRef]
- Karimi, S.; Iordanova, I. Integration of BIM and GIS for construction automation, a systematic literature review (SLR) combining bibliometric and qualitative analysis. Arch. Comput. Methods Eng. 2021, 28, 4573–4594. [Google Scholar] [CrossRef]
- Moore, A.; Schubert, M.; Fang, T.; Smith, J.; Rymer, N. LiDAR-derived navigational geofences for low altitude flight operations. In AIAA AVIATION 2020 FORUM; American Institute of Aeronautics and Astronautics: Reston, VA, USA, 2020; p. 2908. [Google Scholar]
- Münzinger, M.; Prechtel, N.; Behnisch, M. Mapping the urban forest in detail: From LiDAR point clouds to 3D tree models. Urban For. Urban Green. 2022, 74, 127637. [Google Scholar] [CrossRef]
- Pepe, M.; Costantino, D.; Alfio, V.S.; Restuccia, A.G.; Papalino, N.M. Scan to BIM for the digital management and representation in 3D GIS environment of cultural heritage site. J. Cult. Herit. 2021, 50, 115–125. [Google Scholar] [CrossRef]
- Shirowzhan, S.; Sepasgozar, S.M. Spatial analysis using temporal point clouds in advanced GIS: Methods for ground elevation extraction in slant areas and building classifications. ISPRS Int. J. Geo-Inf. 2019, 8, 120. [Google Scholar] [CrossRef]
- Xia, H.; Liu, Z.; Efremochkina, M.; Liu, X.; Lin, C. Study on city digital twin technologies for sustainable smart city design: A review and bibliometric analysis of geographic information system and building information modeling integration. Sustain. Cities Soc. 2022, 84, 104009. [Google Scholar] [CrossRef]
- Zhu, J.; Wu, P. Towards effective BIM/GIS data integration for smart city by integrating computer graphics technique. Remote Sens. 2021, 13, 1889. [Google Scholar] [CrossRef]
- Visvalingam, M.; Whyatt, J.D. The Douglas-Peucker algorithm for line simplification: Re-evaluation through visualization. Comput. Graph. Forum 1990, 9, 213–225. [Google Scholar] [CrossRef]

Disclaimer/Publisher’s Note: The statements, opinions and data contained in all publications are solely those of the individual author(s) and contributor(s) and not of MDPI and/or the editor(s). MDPI and/or the editor(s) disclaim responsibility for any injury to people or property resulting from any ideas, methods, instructions or products referred to in the content. |
© 2023 by the author. Licensee MDPI, Basel, Switzerland. This article is an open access article distributed under the terms and conditions of the Creative Commons Attribution (CC BY) license (https://creativecommons.org/licenses/by/4.0/).