
Scan to BIM Mapping Process Description for Building Representation in 3D GIS

Abstract
:1. Introduction
2. Research Methods
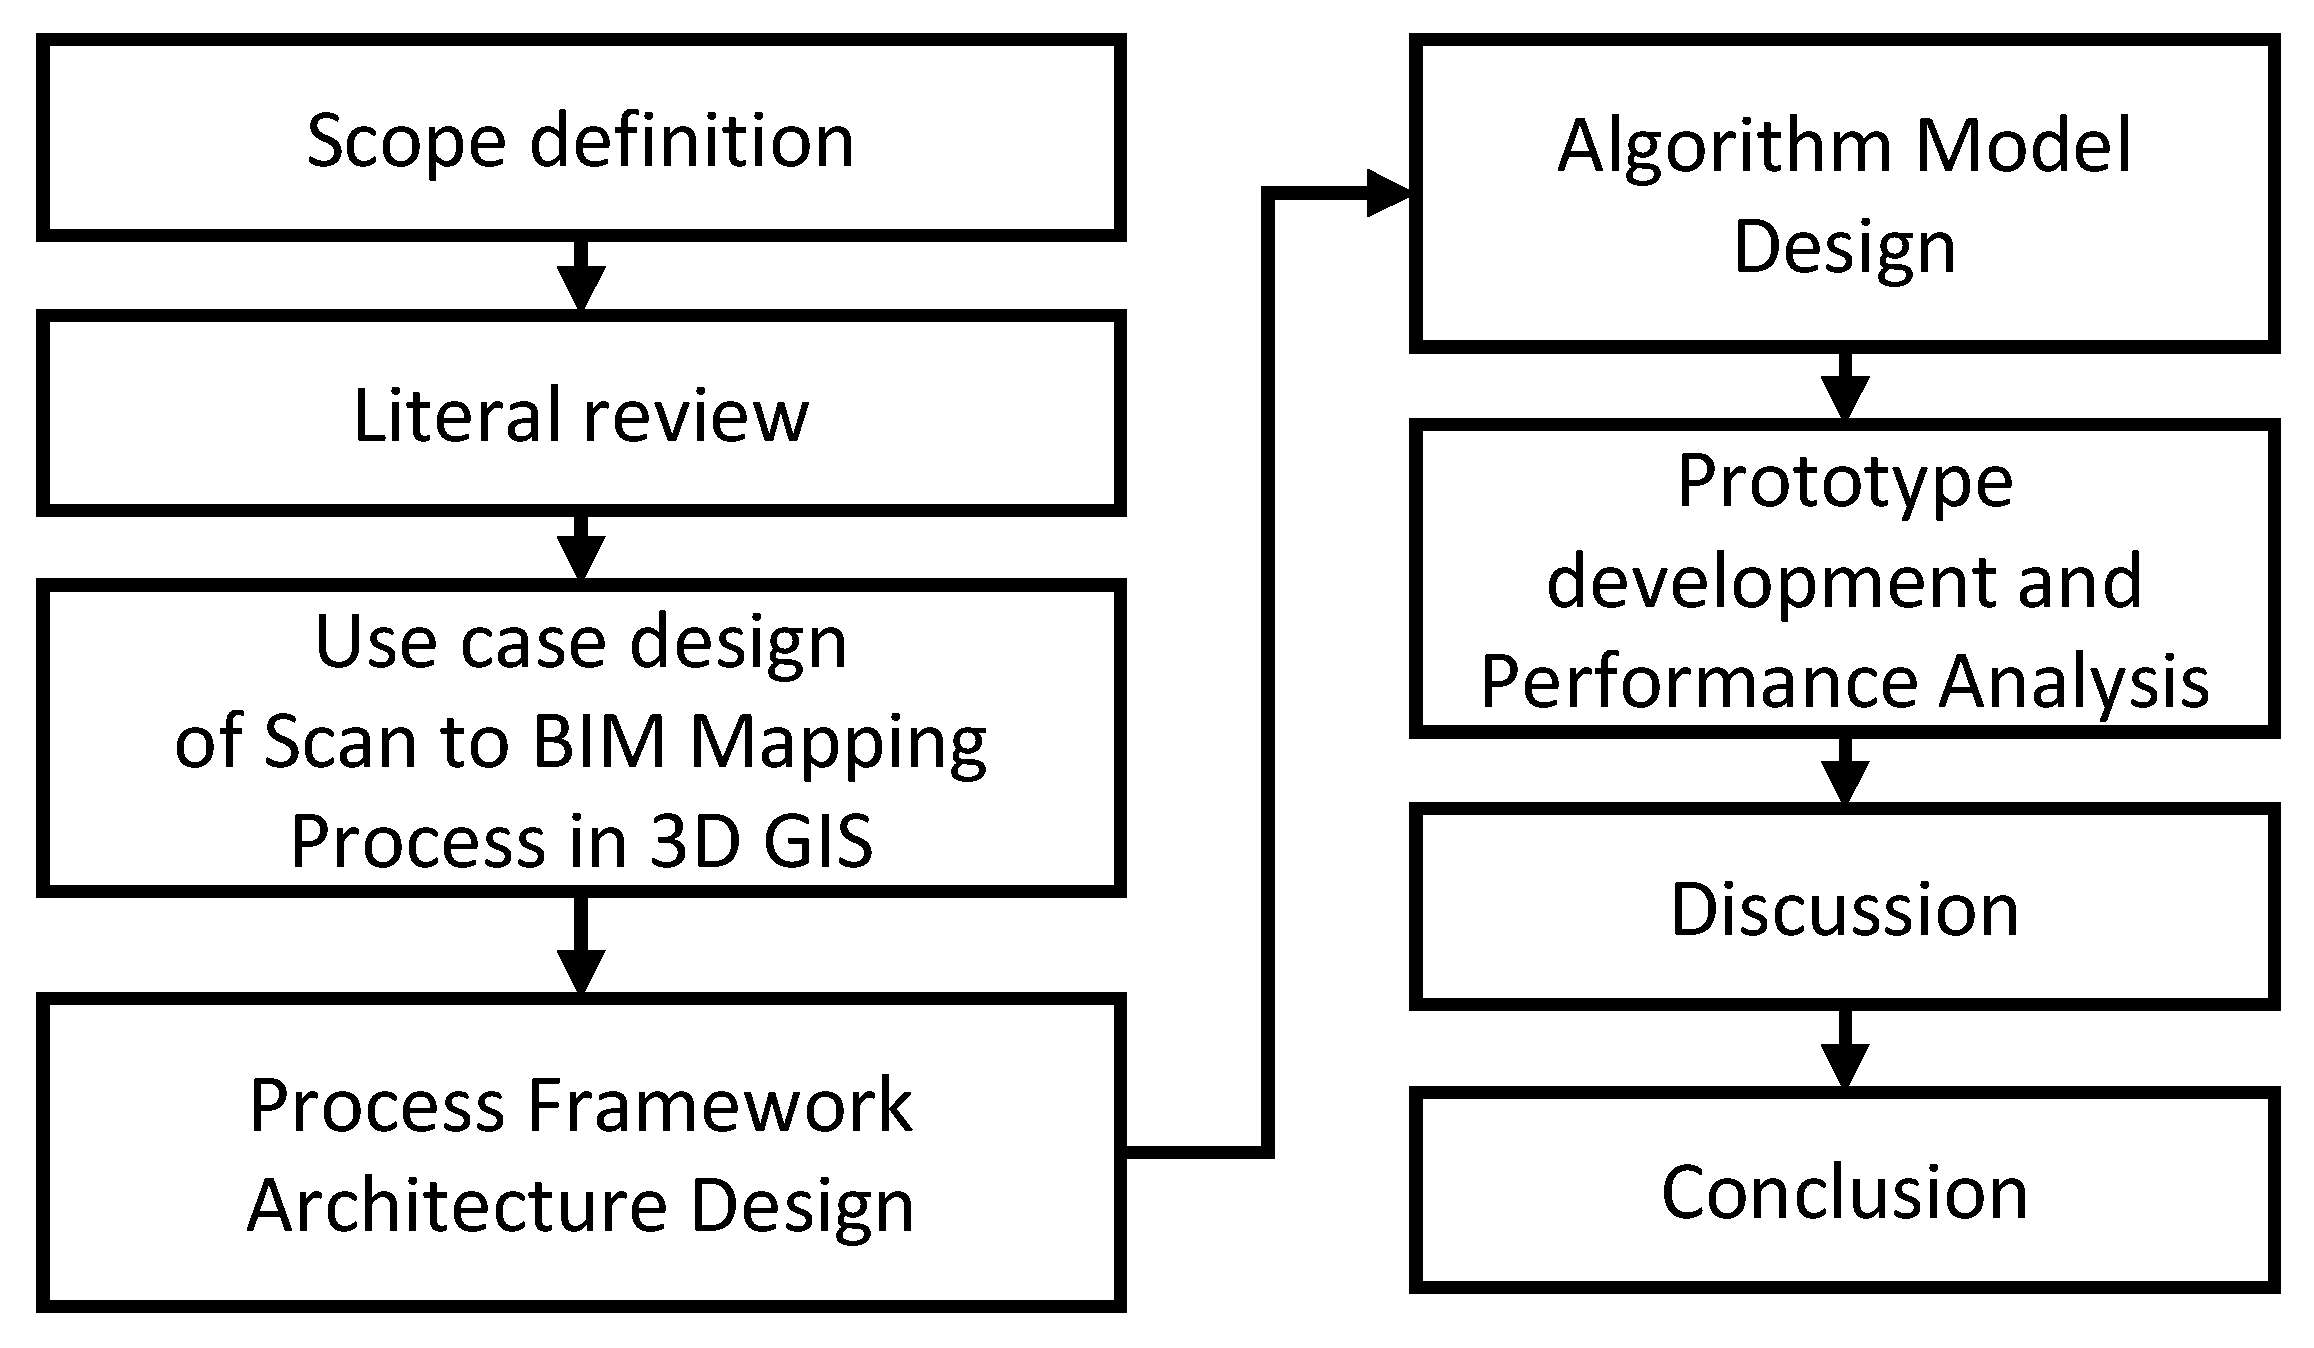
- Conduct a literature search for relevant keywords. The literature review will look at the algorithms used and identify the critical components of the Scan to BIM automation process.
- To clarify the research scope, use cases of BIM object generation necessary for urban planning or building management are investigated with ALS data, such as drones.
- Design the Scan to BIM mapping process framework and algorithm model in the 3D GIS environment based on the first and second results.
- Based on the 3rd result, develop a prototype and analyze the performance. Compared to manual work, the accuracy and productivity of the proposed method were investigated. The performance analysis identifies what needs to be improved and derives considerations for future performance improvements.
3. Related Works
- Develop the mapping process using existing commercial tools such as ESRI.
- PCD processing algorithms such as point feature calculation and denoising.
- Development of a segmentation algorithm for PCD classification, such as ground surface and building.
- Development of a Vectorization Algorithm for Building Footprint Extraction in Polygon Format such as SHP.
- Development of a building height extraction algorithm.
- A geometry generation algorithm as a 3D object format.
4. Scan to BIM Mapping in 3D GIS
4.1. Mapping Process Survey
4.2. Use Cases Design Considering SBMD
5. SBMD Process Framework Design
5.1. Process Framework Architecture Design
5.2. Algorithm Model Definition
| Algorithms 1: building footprint’s ground level calculation |
| for in : = = 1e+10 for vertex in : = (vertex.x, vertex.y) if >: = = |
6. Prototype Development and Performance Analysis
6.1. Prototype Development
| “Scan to BIM mapping Description Language”: [ { “type”: “[algorithm module name]”, “[parameter]”: “[value]”, … }, … ] |
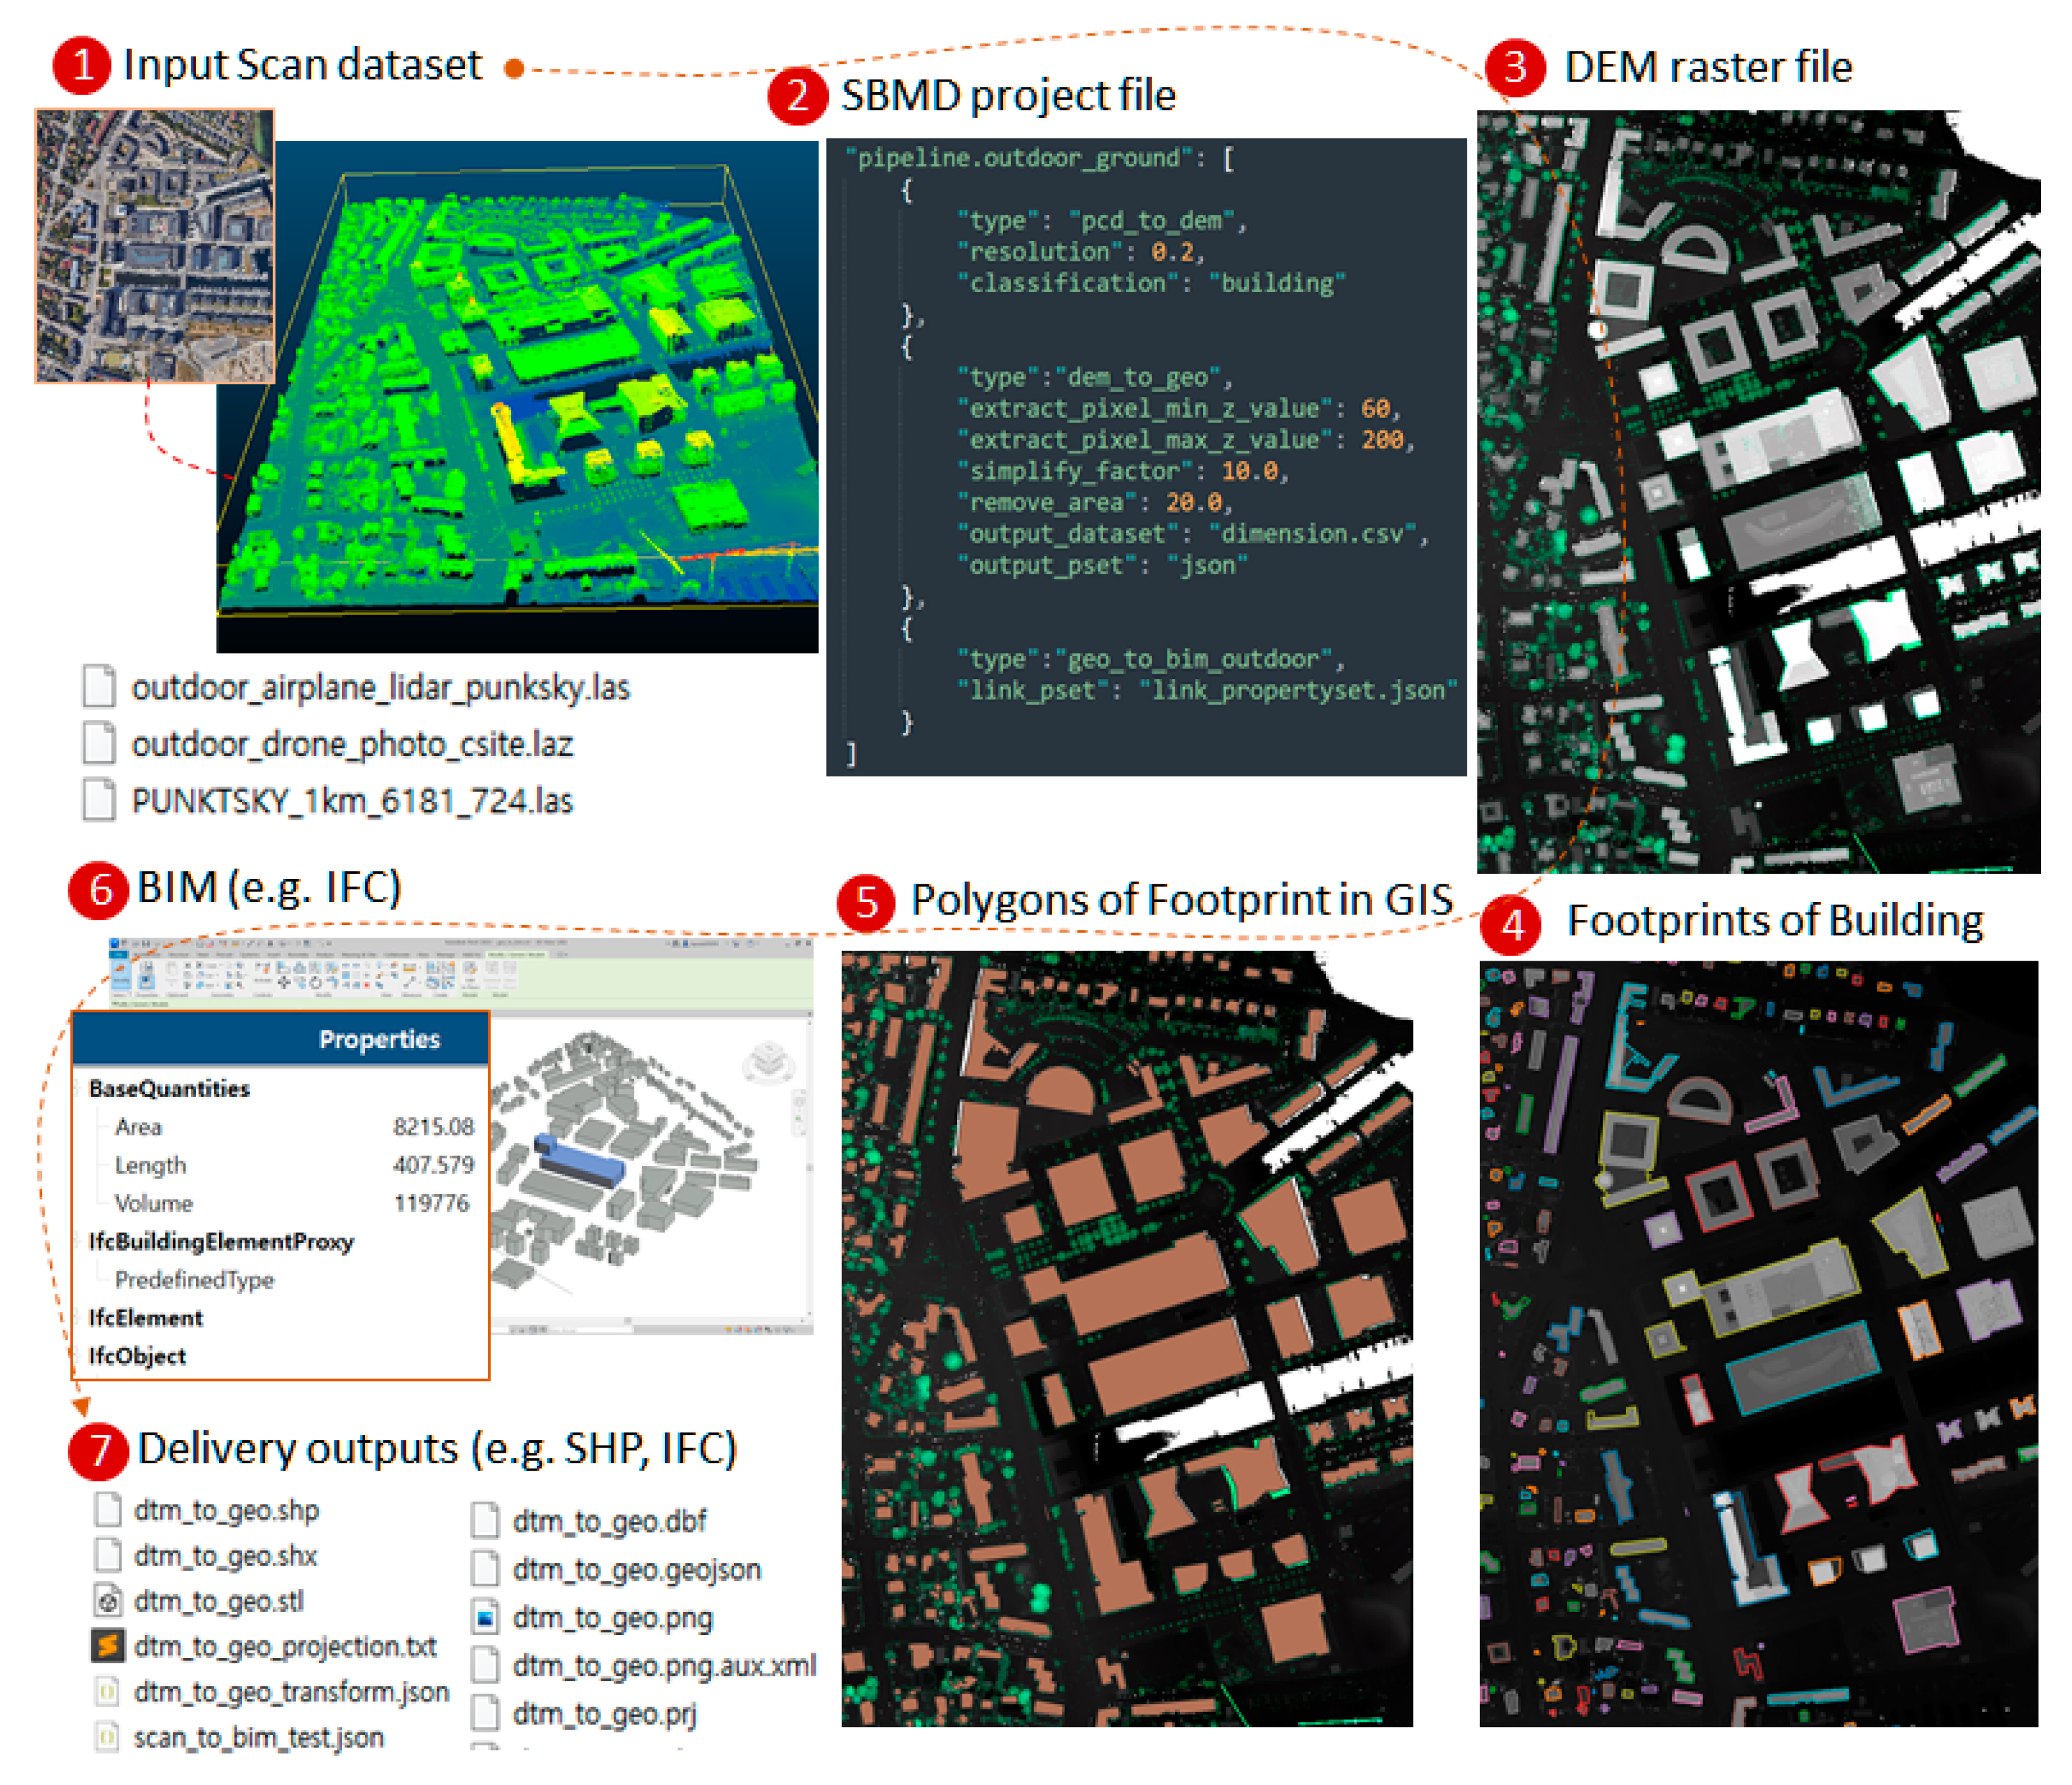
| { “Scan_to_BIM.process”: [ { “type”: “pcd_to_dem”, “resolution”: 0.2, “classification”: “building” }, { “type”:”dem_to_geo”, “extract_pixel_min_z_value”: 60, “extract_pixel_max_z_value”: 200, “simplify_factor”: 10.0, “remove_area”: 20.0, “output_dataset”: “dimension.csv”, “output_pset”: “json” }, { “type”:”geo_to_bim_outdoor”, “link_pset”: “link_propertyset.json” } ] } |
- PCD to DEM step: pixel resolution for DEM generation = 0.2.
- DEM to Geometry step: minimum height for extracting buildings from DEM = 60, maximum height for extracting buildings = 200, simplification factor = 10 [29], minimum area for removing small objects other than buildings from DEM = 20, dimension data output file including footprint polygon after geometry calculation = dimension.csv, and output property format = json.
- Geometry to BIM step: link_pset = Define properties such as area and length to be added when creating the IFC file.
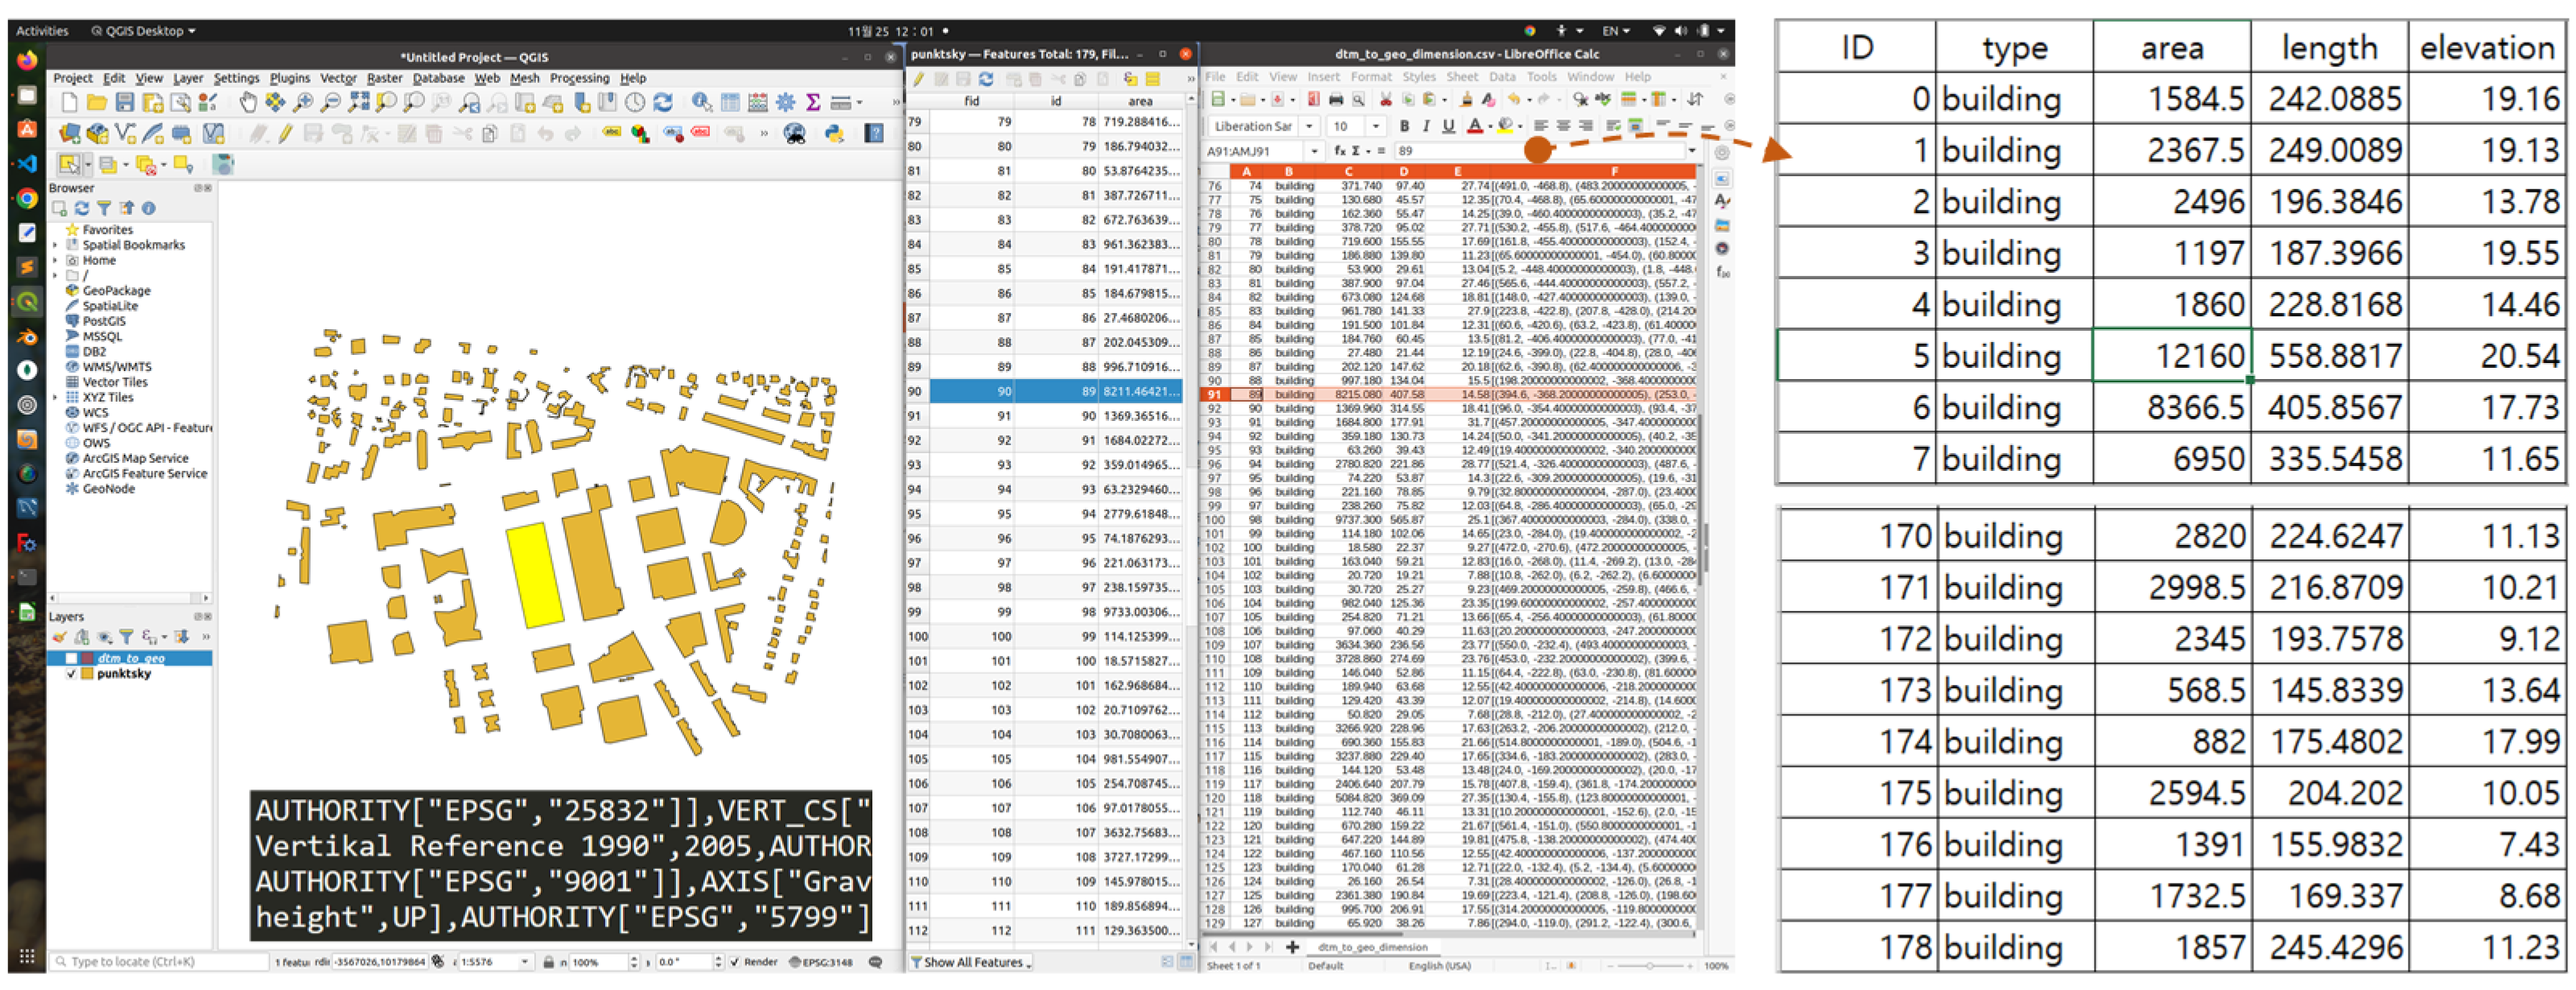
| UNIT[“meter”, 1, AUTHORITY[“EPSG”, “9001”]], AXIS[“Gravity-related height”, UP], AUTHORITY[“EPSG”, “5799”]]] |
6.2. Results Analysis
7. Conclusions and Future Work
Funding
Institutional Review Board Statement
Informed Consent Statement
Data Availability Statement
Conflicts of Interest
References
- Kang, T. Development of a conceptual mapping standard to link building and geospatial information. ISPRS Int. J. Geo-Inf. 2018, 7, 162. [Google Scholar] [CrossRef]
- Widyaningrum, E. Automatic Object Extraction from Airborne Laser Scanning Point Clouds for Digital Base Map Production. Ph.D. Thesis, Delft University of Technology, Delft, The Netherlands, 2021. [Google Scholar]
- La Russa, F.M.; Intelisano, M.; Galizia, M.; Caliò, I.; Santagati, C. An expeditious parametric approach for City Information Modeling and Finite Element Analysis. Int. Arch. Photogramm. Remote Sens. Spat. Inf. Sci. 2022, 46, 307–314. [Google Scholar] [CrossRef]
- Tarsha Kurdi, F.; Awrangjeb, M.; Munir, N. Automatic filtering and 2D modeling of airborne laser scanning building point cloud. Trans. GIS 2021, 25, 164–188. [Google Scholar] [CrossRef]
- Zeng, Z.; Xu, Y.; Xie, Z.; Tang, W.; Wan, J.; Wu, W. LEARD-Net: Semantic segmentation for large-scale point cloud scene. Int. J. Appl. Earth Obs. Geoinf. 2022, 112, 102953. [Google Scholar] [CrossRef]
- Xia, S.; Xu, S.; Wang, R.; Li, J.; Wang, G. Building instance mapping from ALS point clouds aided by polygonal maps. IEEE Trans. Geosci. Remote Sens. 2021, 60, 5700813. [Google Scholar] [CrossRef]
- O’Donnell, J.; Truong-Hong, L.; Boyle, N.; Corry, E.; Cao, J.; Laefer, D.F. LiDAR point-cloud mapping of building façades for building energy performance simulation. Autom. Constr. 2019, 107, 102905. [Google Scholar] [CrossRef]
- Buyukdemircioglu, M.; Kocaman, S. Reconstruction and efficient visualization of heterogeneous 3D city models. Remote Sens. 2020, 12, 2128. [Google Scholar] [CrossRef]
- Nurunnabi, A.; Teferle, N.; Balado, J.; Chen, M.; Poux, F.; Sun, C. Robust techniques for building footprint extraction in aerial laser scanning 3D point clouds. Int. Arch. Photogramm. Remote Sens. Spat. Inf. Sci. 2022, XLVIII-3/W, 48. [Google Scholar] [CrossRef]
- Shao, J.; Zhang, W.; Shen, A.; Mellado, N.; Cai, S.; Luo, L.; Wang, N.; Yan, G.; Zhou, G. Seed point set-based building roof extraction from airborne LiDAR point clouds using a top-down strategy. Autom. Constr. 2021, 126, 103660. [Google Scholar] [CrossRef]
- Costantino, D.; Vozza, G.; Alfio, V.S.; Pepe, M. Strategies for 3D Modelling of Buildings from Airborne Laser Scanner and Photogrammetric Data Based on Free-Form and Model-Driven Methods: The Case Study of the Old Town Centre of Bordeaux (France). Appl. Sci. 2021, 11, 10993. [Google Scholar] [CrossRef]
- Zhu, J.; Wu, P. A common approach to geo-referencing building models in industry foundation classes for BIM/GIS integration. ISPRS Int. J. Geo-Inf. 2021, 10, 362. [Google Scholar] [CrossRef]
- Pepe, M.; Costantino, D.; Alfio, V.S.; Vozza, G.; Cartellino, E. A novel method based on deep learning, GIS and geomatics software for building a 3D city model from VHR satellite stereo imagery. ISPRS Int. J. Geo-Inf. 2021, 10, 697. [Google Scholar] [CrossRef]
- Apeh, M.M.; Abdul Rahman, A. A Review of 3D Spatial Data Models for Surface and Subsurface Integration of Spatial Objects. Int. Arch. Photogramm. Remote Sens. Spat. Inf. Sci. 2023, 48, 15–23. [Google Scholar] [CrossRef]
- Zhu, J.; Wu, P.; Anumba, C. A semantics-based approach for simplifying IFC building models to facilitate the use of BIM models in GIS. Remote Sens. 2021, 13, 4727. [Google Scholar] [CrossRef]
- Gyuris, P.; Pal, B.; Benedek, C.; Janko, Z. Collaborative research and innovation project for revitalizing the BIM process. e-Zbonik Electron. Collect. Pap. Fac. Civ. Eng. 2021, 22, 11–19. [Google Scholar] [CrossRef]
- Park, Y.; Guldmann, J.M. Creating 3D city models with building footprints and LIDAR point cloud classification: A machine learning approach. Comput. Environ. Urban Syst. 2019, 75, 76–89. [Google Scholar] [CrossRef]
- Wang, C.; Ferrando, M.; Causone, F.; Jin, X.; Zhou, X.; Shi, X. Data acquisition for urban building energy modeling: A review. Build. Environ. 2022, 217, 109056. [Google Scholar] [CrossRef]
- Guo, L.; Deng, X.; Liu, Y.; He, H.; Lin, H.; Qiu, G.; Yang, W. Extraction of dense urban buildings from photogrammetric and LiDAR point clouds. IEEE Access 2021, 9, 823–832. [Google Scholar] [CrossRef]
- Mohd Noor, N.; Ibrahim, I.; Abdullah, A.; Abdullah, A.A.A. Information fusion for cultural heritage three-dimensional modeling of Malay cities. ISPRS Int. J. Geo-Inf. 2020, 9, 177. [Google Scholar] [CrossRef]
- Beil, C.; Kutzner, T.; Schwab, B.; Willenborg, B.; Gawronski, A.; Kolbe, T.H. Integration of 3D point clouds with semantic 3D city models–providing semantic information beyond classification. ISPRS Ann. Photogramm. Remote Sens. Spat. Inf. Sci. 2021, 8, 105–112. [Google Scholar] [CrossRef]
- Karimi, S.; Iordanova, I. Integration of BIM and GIS for construction automation, a systematic literature review (SLR) combining bibliometric and qualitative analysis. Arch. Comput. Methods Eng. 2021, 28, 4573–4594. [Google Scholar] [CrossRef]
- Moore, A.; Schubert, M.; Fang, T.; Smith, J.; Rymer, N. LiDAR-derived navigational geofences for low altitude flight operations. In AIAA AVIATION 2020 FORUM; American Institute of Aeronautics and Astronautics: Reston, VA, USA, 2020; p. 2908. [Google Scholar]
- Münzinger, M.; Prechtel, N.; Behnisch, M. Mapping the urban forest in detail: From LiDAR point clouds to 3D tree models. Urban For. Urban Green. 2022, 74, 127637. [Google Scholar] [CrossRef]
- Pepe, M.; Costantino, D.; Alfio, V.S.; Restuccia, A.G.; Papalino, N.M. Scan to BIM for the digital management and representation in 3D GIS environment of cultural heritage site. J. Cult. Herit. 2021, 50, 115–125. [Google Scholar] [CrossRef]
- Shirowzhan, S.; Sepasgozar, S.M. Spatial analysis using temporal point clouds in advanced GIS: Methods for ground elevation extraction in slant areas and building classifications. ISPRS Int. J. Geo-Inf. 2019, 8, 120. [Google Scholar] [CrossRef]
- Xia, H.; Liu, Z.; Efremochkina, M.; Liu, X.; Lin, C. Study on city digital twin technologies for sustainable smart city design: A review and bibliometric analysis of geographic information system and building information modeling integration. Sustain. Cities Soc. 2022, 84, 104009. [Google Scholar] [CrossRef]
- Zhu, J.; Wu, P. Towards effective BIM/GIS data integration for smart city by integrating computer graphics technique. Remote Sens. 2021, 13, 1889. [Google Scholar] [CrossRef]
- Visvalingam, M.; Whyatt, J.D. The Douglas-Peucker algorithm for line simplification: Re-evaluation through visualization. Comput. Graph. Forum 1990, 9, 213–225. [Google Scholar] [CrossRef]

| No | Stage | Description |
|---|---|---|
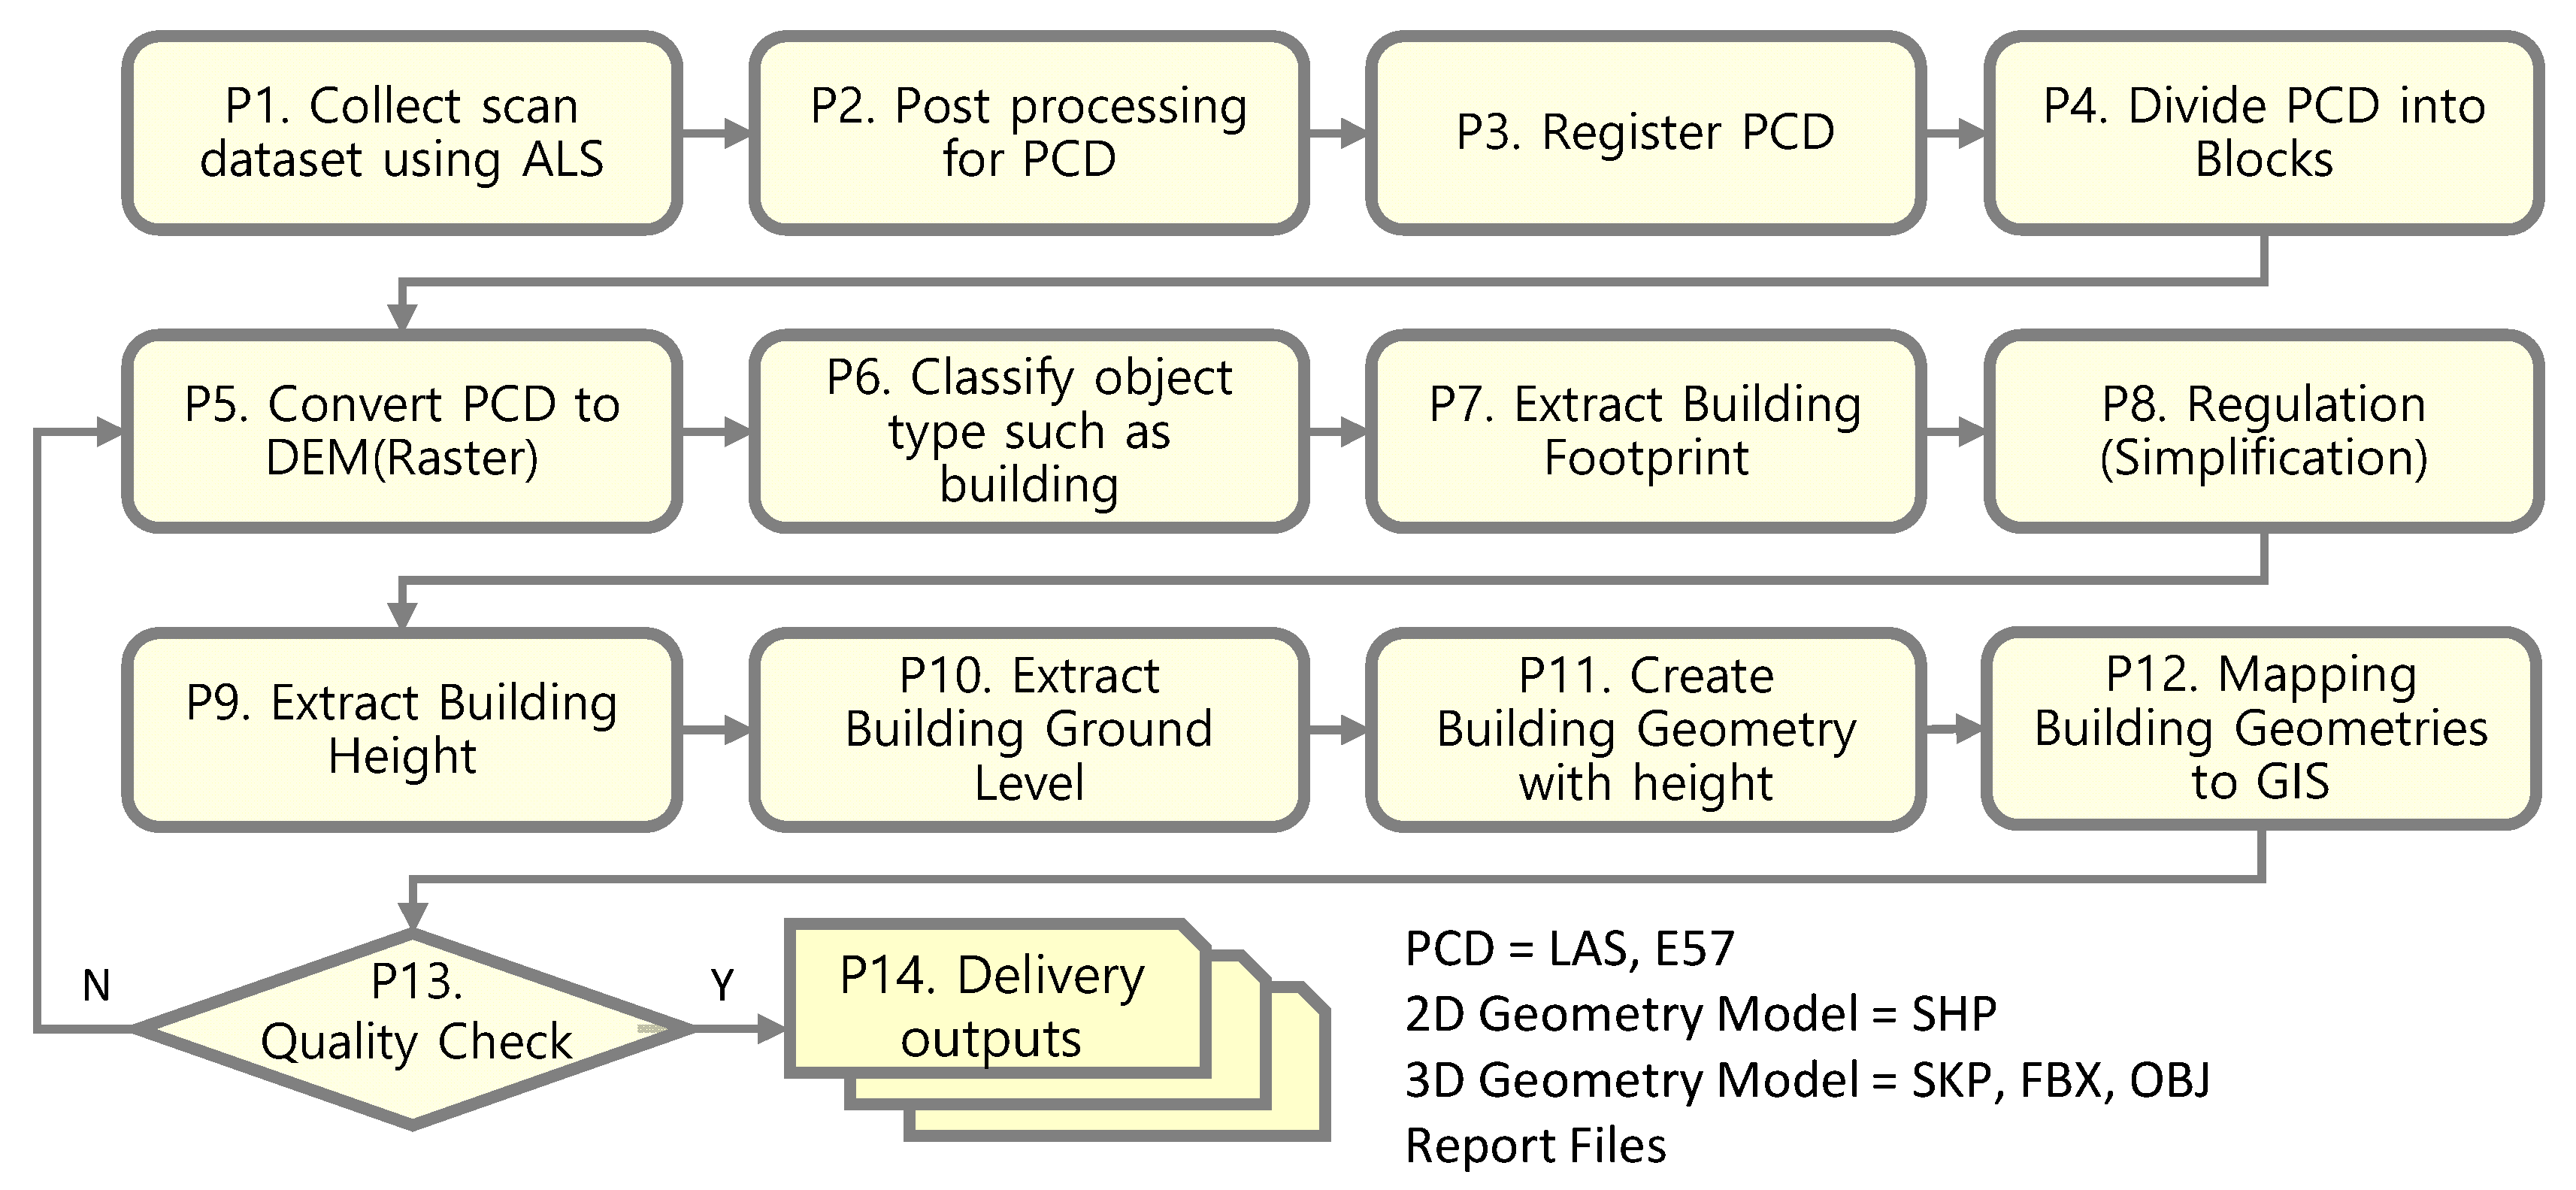
| P1 | Collect scan dataset using ALS | Acquire scan data and GPS sensor data using ALS. |
| P2 | Post-processing for PCD | Each sensor data is synchronized using a timestamp and saved as a PCD file. |
| P3 | Register PCD | Using Ground Control Points (GCP), align PCD files to a unified coordinate system. |
| P4 | Divide PCD into Blocks | Divides PCD files into workable units called block files. In the case of urban building modeling, point clouds are usually divided based on road networks so that modeling objects are not divided. |
| P5 | Convert PCD to DEM(Raster) | Convert PCD files to DEM raster files. In the conversion process, a user specifies parameters such as the resolution of raster pixels. |
| P6 | Classify object types, such as building | Classify buildings and terrain using DEM and PCD. |
| P7 | Extract Building Footprint | Extract footprint from classified building data. |
| P8 | Regulation (Simplification) | Normalize footprint polygons. |
| P9 | Extract Building Roof Height | Extract the building roof height for each footprint using DEM. |
| P10 | Extract Building Ground Level | Extract the building floor height for each footprint using the ground surface. |
| P11 | Create Building Geometry with height | Generate 3D building geometry using the extracted roof and floor height |
| P12 | Mapping Building Geometries to GIS | Mapping building geometries into GIS coordinate systems. |
| P13 | Quality Check | Check whether the quality of the previously generated data meets the requirements. If the data quality does not meet the requirements, perform the relevant steps again. For example, modify the parameters of the software tool used in the stage, adjust the LoD of the matched PCD, and repeat the steps. |
| P14 | Delivery outputs | Outputs such as PCD and SHP model files, and reports are delivered to the user. |
| No | Use Case | Function |
|---|---|---|
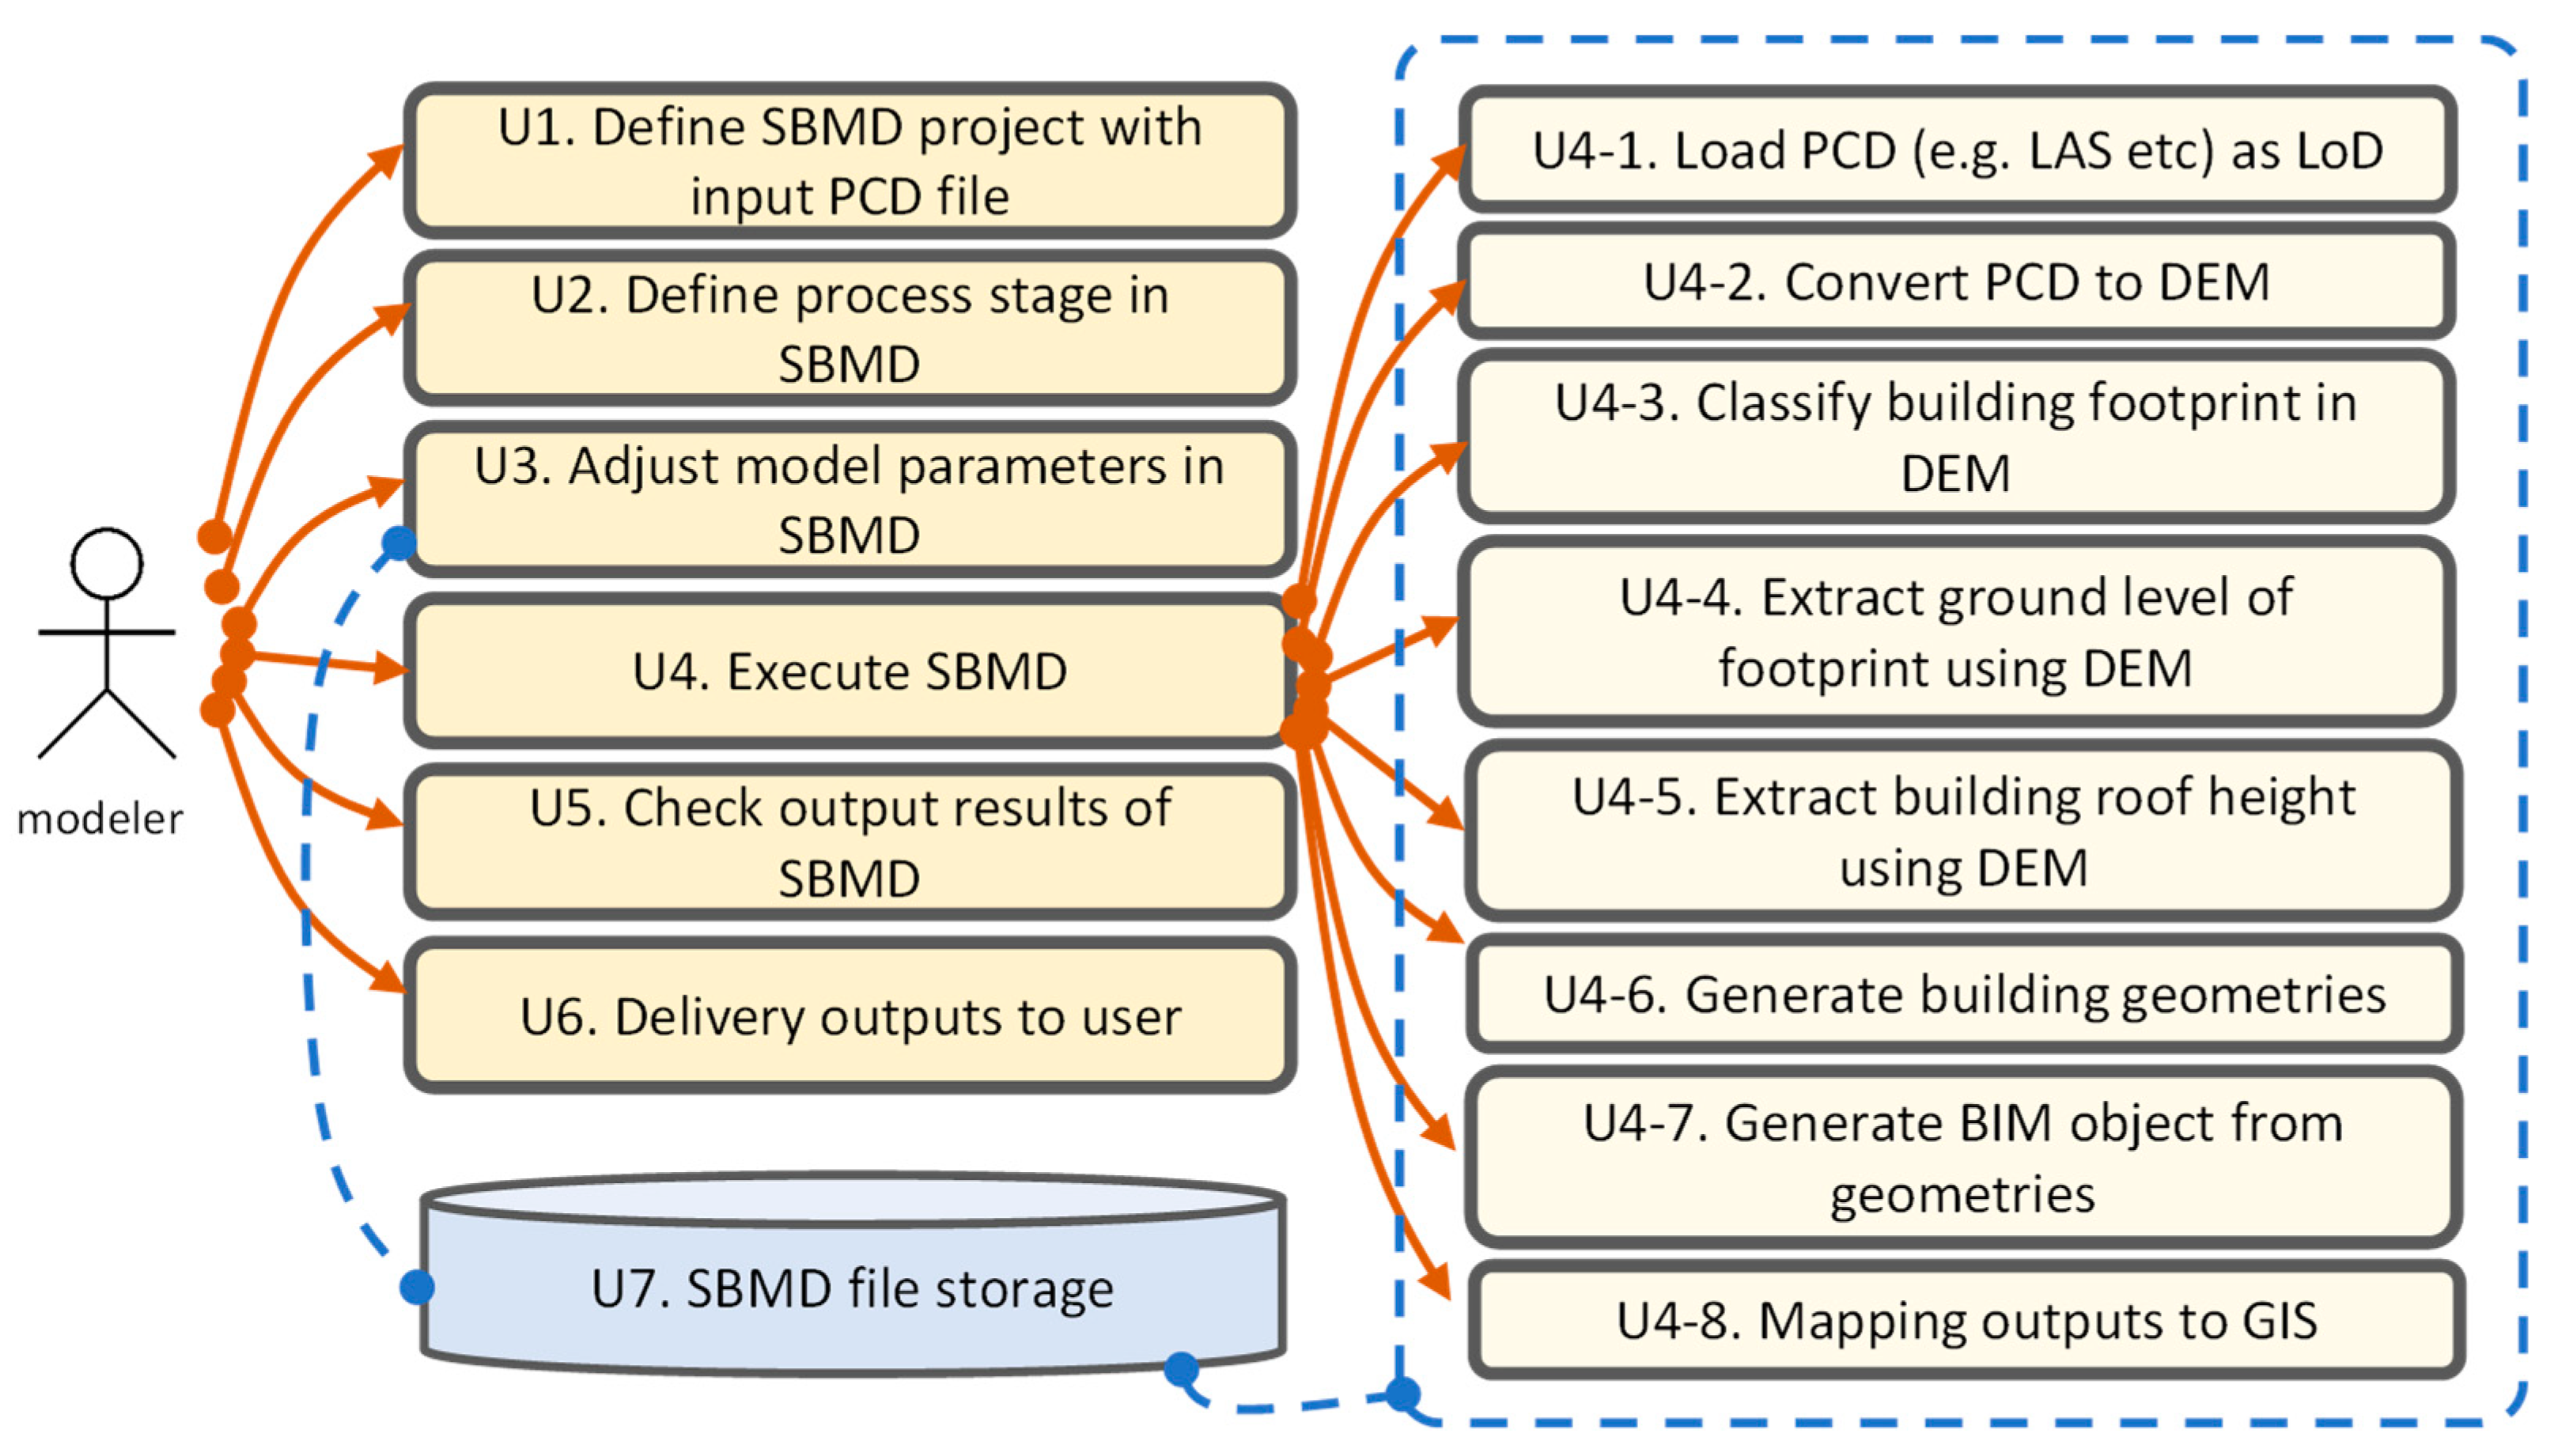
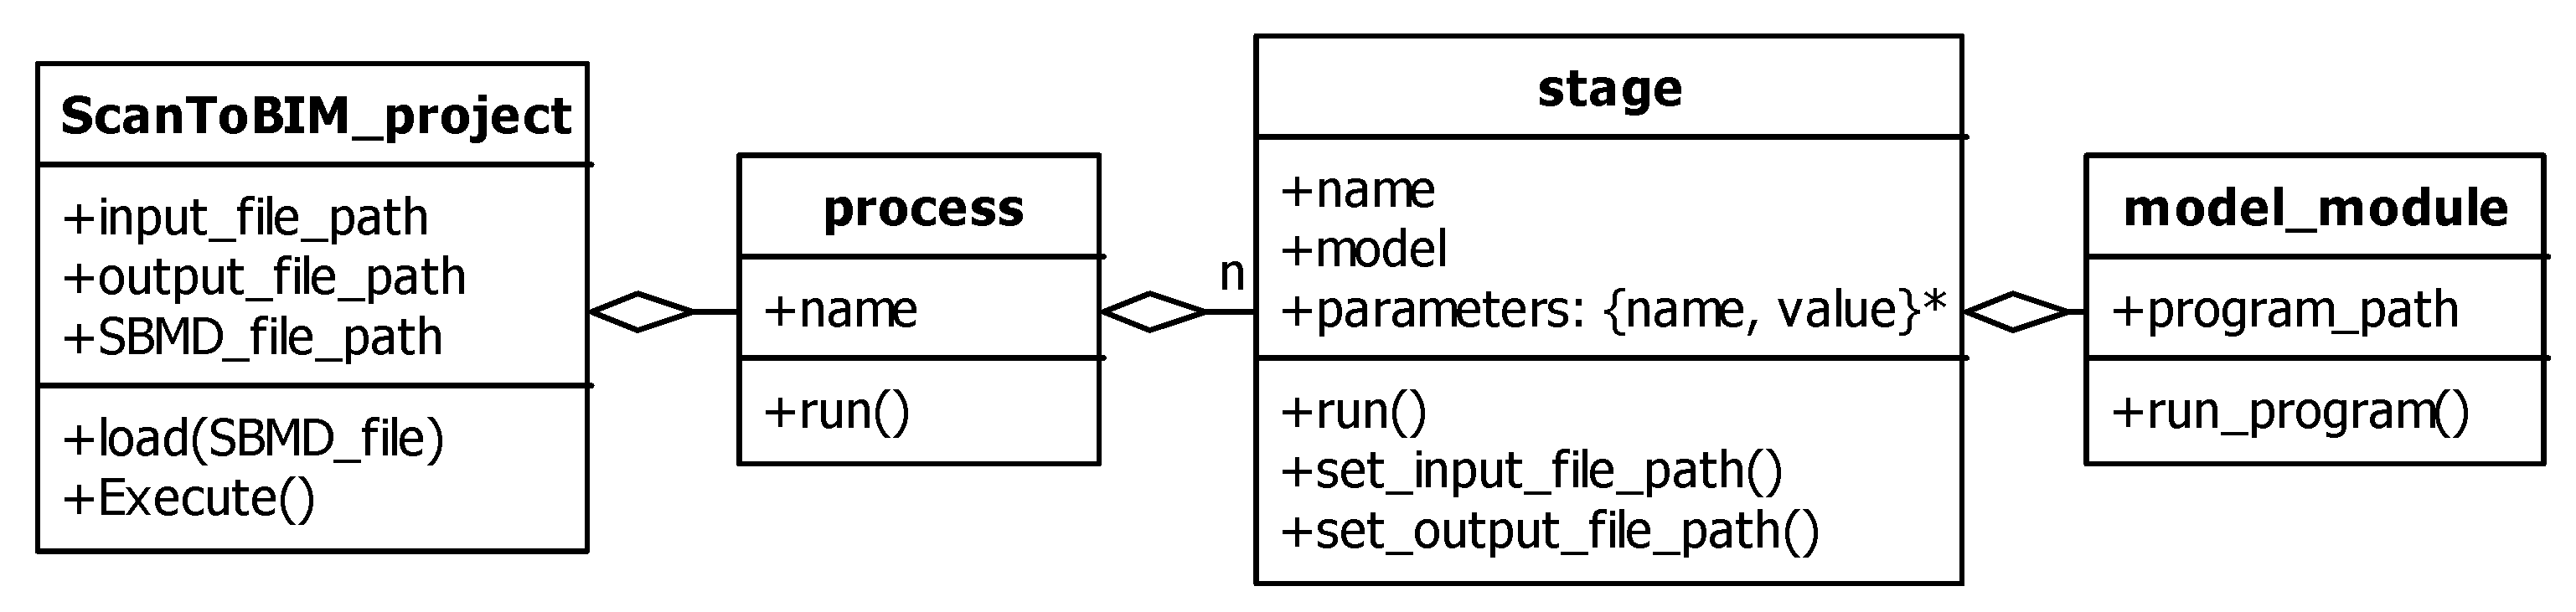
| U1 | Define SBMD project with input PCD file | Define the SBMD project. For example, PCD input file path is specified in the project file. project = {SBMD, input, output} (1) SBMD = SBMD file name input = input file path output = output file path |
| U2 | Define the process stage in SBMD. | Defines the stage that composes Scan to BIM mapping stage in the project. The stage format is as follows. SBMD = {stage*} (2) stage = {model, parameters} parameters = {name, value}* * = multiple |
| U3 | Adjust model parameters in SBMD stage | Adjust the model parameters of each stage according to the requirements. |
| U4 | Execute SBMD | Execute the defined SBMD. |
| U4-1 | Load PCD (e.g., LAS, etc.) as LoD | PCD file is loaded into memory according to LoD. |
| U4-2 | Convert PCD to DEM | Convert PCD to DEM raster (TIFF) file. |
| U4-3 | Classify building footprint in DEM | Classify the building footprint in DEM. |
| U4-4 | Calculate the ground level of the footprint using DEM | Calculate the ground level of the footprint in DEM. |
| U4-5 | Calculate building roof height using DEM | Calculate the roof height of the building from the footprint in the DEM. |
| U4-6 | Generate building geometries | Generate building geometry for each footprint. The result is a SHP, GeoJSON file, etc. |
| U4-7 | Generate BIM object from geometries | Create a BIM object containing attributes. The result is an IFC file. |
| U4-8 | Mapping outputs to GIS | Results such as SHP are mapped to the GIS coordinate system. |
| U5 | Check output results of SBMD | Check the quality of SBMD output. |
| U6 | Delivery outputs to a user | Outputs such as SHP, GeoJSON, and IFC are delivered to the user. |
| U7 | SBMD file storage | Archives the files of SBMD project. If necessary, each SBMD project information can be reused through the SBMD project storage. |
| No | Use Case | Algorithm Model |
|---|---|---|
| U4-1 | Load PCD as LoD | Generate LoD with a point cloud density that meets the requirements (e.g., number of points per square meter). To generate LoD, PCD is divided into grids such as voxels, and the points included in each grid are sampled. Sampling strategies include random, average, and uniform point-counting methods. (3) |
| U4-2 | Convert PCD to DEM | To convert from the PCD to DEM raster, the PCD is projected on the x–y plane, and then, the z-value of each raster’s pixel is expressed as a gray color value. To this end, after calculating the z-average value of the points included in each pixel, it is converted into a gray color. Therefore, the resolution (pixel size in the PCD coordinate reference system) is defined to generate pixel information. (4) |
| U4-3 | Classify building footprint in DEM. | Classify the building footprint in DEM. Classification methods may vary according to data characteristics. The method used here specifies the z-value range of buildings, assuming that the ground is somewhat flat, and converts pixels with the same z-value into contour polygons. Polygons with too-small areas, such as trees, are likely to be noisy so they can be removed. The remaining polygons are reduced in the number of vertices by a simplification algorithm. If the ground is not flat, footprint segments can be extracted using a convolutional neural network (CNN)-based deep learning model and vectorized to convert them into polygons. For classifications such as building and ground, no perfect algorithm supports all data characteristics, so it is applied according to the requirements. (5) |
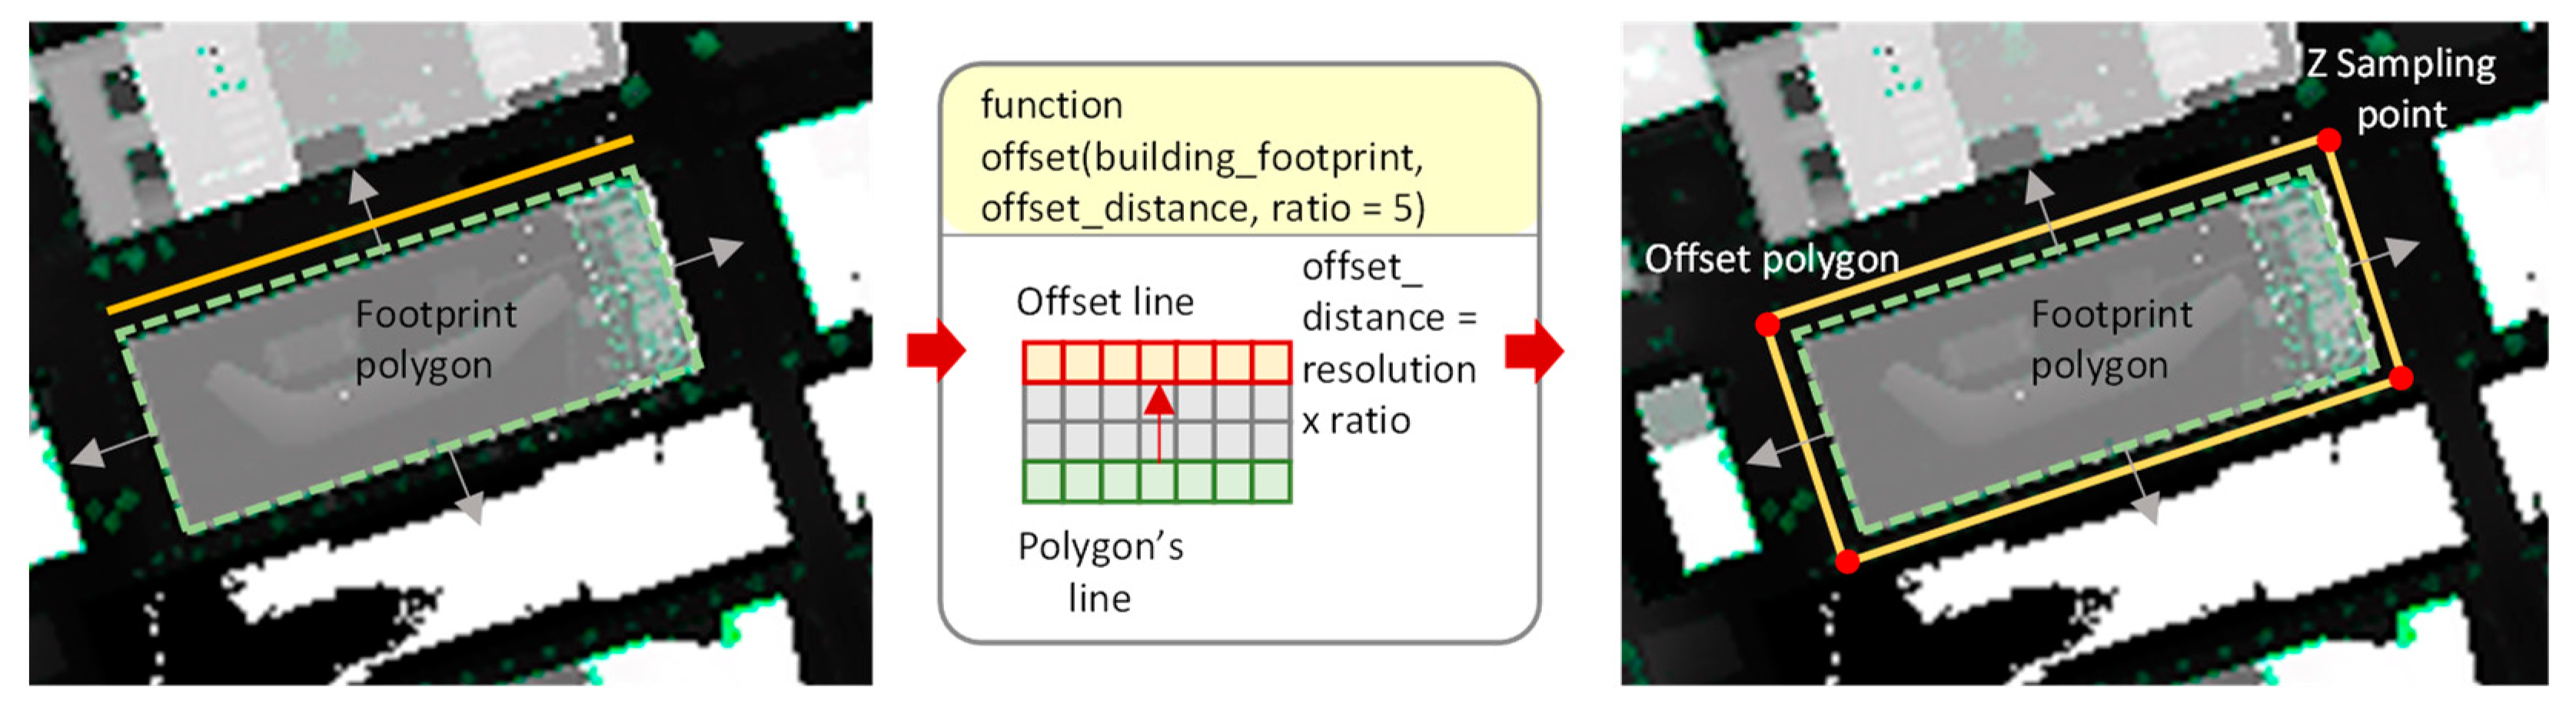
| U4-4 | Calculate the ground level of the footprint using DEM | There can be various ways to extract the ground level of the footprint. Here, the ground level is defined as the minimum ground z-values where the footprints polygon is offset. The offset distance is entered considering the density of buildings. (6) |
| U4-5 | Calculate building roof height using DEM. | To calculate the building roof height, shrink the footprint’s polygons with the offset distance. Then, the average z-value of the pixel belonging to the polygon is calculated using DEM. (7) |
| U4-6 | Generate building geometries | Generate 3D building geometry using the building footprint, roof height, and ground level. (8) |
| U4-7 | Generate BIM object from geometries. | BIM files such as IFC can express object property information. In this case, the building’s area, volume, and center position are calculated as properties and connected to the properties of the building geometry. (9) |
| U4-8 | Mapping outputs to GIS | Map building Tiff, SHP, and IFC files created from the information calculated in the previous step to GIS. |
| Indicator | Manual Modeling | SBMD Execution | Difference (SBMD—Manual) |
|---|---|---|---|
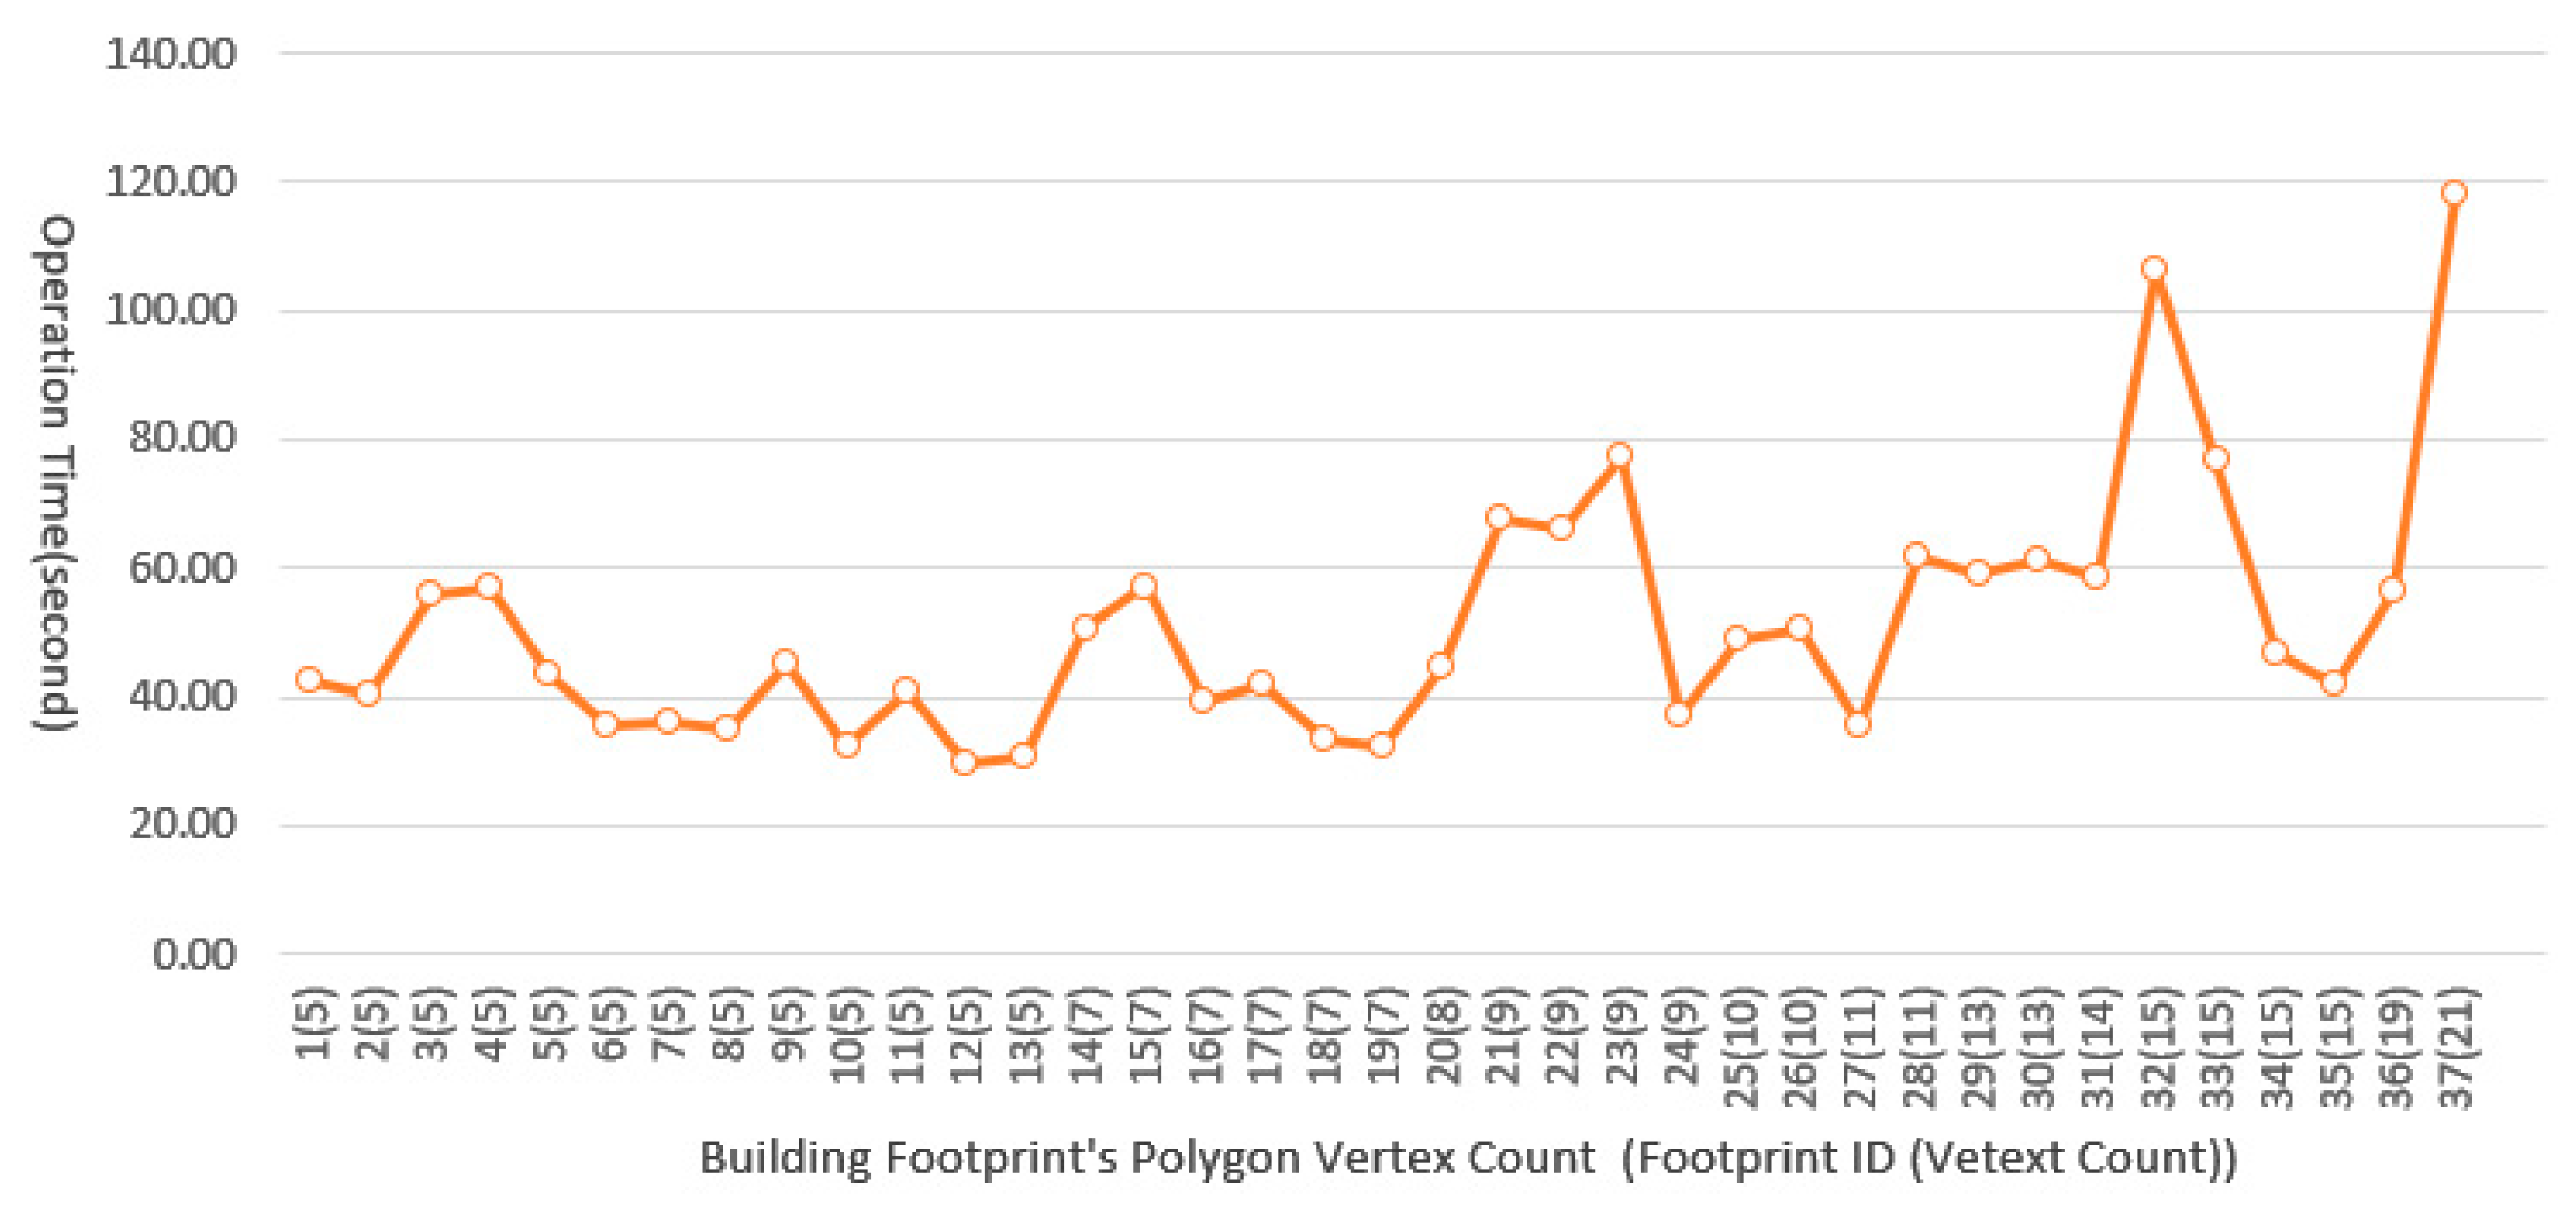
| (a) Operation Time Tm, Ts | 1896.13 (31.60) | 80.00 (1.33) | 1816.13 (30.27) |
| (b) Buildings footprint area (m2) Am, As | 66,014.45 | 64,524.50 | −1490.95 |
| (c) Vertex count Vm, Vs | 333 | 367 | 34 |
| Indicator | 1st Factor | 2nd Factor | Difference (SBMD—Manual) |
|---|---|---|---|
| (a) Error ((As − Am)/Am) | −1490.95 | 66,014.45 | −2.26% |
| (b) AoI (Amount of Information ratio = Vs/Vm) | 367 | 333 | 110.21% |
| (c) VTm (Vertex input Time, Manual = Tm/Vm) | 1896.13 | 333 | 5.69 times |
| (d) VTa (Vertex input Time, Automatic = Ts/Vs) | 80 | 367 | 0.22 times |
| (e) SBPm (Scan to BIM productivity about manual input = Tm/Ts) | 1896.13 | 80.00 | 23.70 times |
Disclaimer/Publisher’s Note: The statements, opinions and data contained in all publications are solely those of the individual author(s) and contributor(s) and not of MDPI and/or the editor(s). MDPI and/or the editor(s) disclaim responsibility for any injury to people or property resulting from any ideas, methods, instructions or products referred to in the content. |
© 2023 by the author. Licensee MDPI, Basel, Switzerland. This article is an open access article distributed under the terms and conditions of the Creative Commons Attribution (CC BY) license (https://creativecommons.org/licenses/by/4.0/).
Share and Cite
Kang, T. Scan to BIM Mapping Process Description for Building Representation in 3D GIS. Appl. Sci. 2023, 13, 9986. https://doi.org/10.3390/app13179986
Kang T. Scan to BIM Mapping Process Description for Building Representation in 3D GIS. Applied Sciences. 2023; 13(17):9986. https://doi.org/10.3390/app13179986
Chicago/Turabian StyleKang, Taewook. 2023. "Scan to BIM Mapping Process Description for Building Representation in 3D GIS" Applied Sciences 13, no. 17: 9986. https://doi.org/10.3390/app13179986
APA StyleKang, T. (2023). Scan to BIM Mapping Process Description for Building Representation in 3D GIS. Applied Sciences, 13(17), 9986. https://doi.org/10.3390/app13179986