1. Introduction
Stress and anxiety have become buzzwords of the present time, affecting many people worldwide, irrespective of gender, age group, or work profile. This trend may be due to the challenging demands of contemporary work culture, changing lifestyles, and technological interactions [
1,
2,
3].
According to the 2021 health statistics report of the Organization for Economic Co-operation and Development (OCDE), in 2019 and 2020, Portugal was the OCDE country with the highest anxiolytic consumption [
4]. Moreover, the ability to understand and perceive mental disorders has even more relevance considering the new challenges associated with the COVID-19 pandemic, which include increased anxiety and depression rates at a global level.
Anxiety is a specific reaction to stress that may persist even after a concern has passed. Anxiety can manifest psychologically and physiologically through particular responses of the nervous system. A strong association has been reported between prolonged and severe anxiety with mental disorders, such as depression and anxiety disorders, and an increased risk for other health complications, like cardiovascular diseases [
5,
6,
7,
8,
9].
Furthermore, multiple studies show an association between anxiety disorders and depression and an imbalance of the Autonomic Nervous Ssystem (ANS), characterized by increased sympathetic activity and reduced parasympathetic or vagal activity [
6,
10,
11]. The ANS maintains the homeostasis of unconscious bodily functions such as heart and respiration rates, blood pressure, and sweating, among others. The two main branches of the ANS are the Sympathetic Nervous System (SNS) and the Parasympathetic Nervous System (PNS) [
5]. The SNS responds to emergencies, activating our organs and functions to respond to stress (fight-or-flight responses), while the PNS relaxes these functions back to rest (rest-and-digest activity) [
12].
Physiological signals can reflect spontaneous, ongoing activity or activity that results from external stimulation. Physiological signals of interest for stress and anxiety detection include hormone levels, Electrocardiogram (ECG), Electrodermal Activity (EDA), Electroencephalogram (EEG), Blood Pressure (BP), Skin Temperature (ST), Electromyogram (EMG), Respiration Volume (BV), and Pupil Diameter (PD) [
13,
14]. Several parameters associated with the physiological processes of anxiety can be obtained from the physiological signals, reinforcing the need to pre-process these signals to remove noise and artifacts during collection.
Relying on physiological signals, namely ECG, EDA, and EMG, recorded with wearable sensors and self-reported, specifically the 6-item State-Trait Inventory questionnaire (6-STAI) [
15], this study proposes to attain the following objectives that can help in the current increased needs for the management of mental health:
physiological characterization of anxiety levels, providing further knowledge about the physiological responses and the physiological interactions ruling anxiety levels;
automatic detection by classifying anxiety levels using machine learning algorithms;
understand how to improve the classification of anxiety levels in such an imbalanced domain and if data-level pre-processing techniques can be good solutions to the imbalanced class distribution problem in mental health datasets.
Our approach differs from conventional studies in that it addresses anxiety levels without controlled elicitation. This ensures the classification of anxiety as a neutral condition, providing valuable insights that can contribute to developing better techniques and strategies for people to manage their health and well-being [
16].
Moreover, by tackling this from a multimodal perspective, we ensure higher classification accuracy, as research has pointed out that recognition systems that base their decisions on multiple physiological data tend to be more accurate than their single-signal counterparts [
17].
Our results suggest that physiological signals can detect anxiety levels and could be beneficial in diagnosing and managing mental disorders such as depression and anxiety disorders. By understanding the wearable physiological biomarkers and the machine learning techniques that can effectively detect and classify anxiety, even when not in the presence of anxiety stimuli, this work supports the research and development of real-time systems for the early detection of anxiety and biofeedback therapy to overcome related undesirable health outcomes. In real-life situations, wearable devices, such as smartwatches, combined with biofeedback strategies allow for more effective and on-time monitoring of anxiety.
Resuming,
Section 1 introduces the motivation, goals, and contributions of this study.
Section 2 presents key concepts and related work in the literature.
Section 3 describes the data and methods used in this study.
Section 4 and
Section 5 present and discuss the obtained results, respectively, and
Section 6 addresses the main conclusions, limitations, and future work.
2. Related Works
Anxiety recognition and detection is a highly interdisciplinary research field with links to signal processing, machine learning, and neuroscience. Anxiety disorders’ prevalence across the population vastly exceeds the capacity of mental health services to provide face-to-face therapy for all those affected, demanding novel approaches for delivering therapy. Traditional monitoring methods rely on retrospective reports, which are subject to recall bias and limit the ability to understand behavior accurately in real-time settings [
18]. Therefore, having access to valuable physiological information would greatly enrich the process of intervening in these situations [
18]. In this context, several works have been proposed addressing the classification of anxiety levels.
Several machine learning algorithms have been used to classify anxiety and stress based on their physiological mechanisms’ unique characteristics. Often, self-reported results are used as part of the labels, which puts the participant in charge of the labeling process. One of the advantages of self-reports is that they can be easily applied, although this method carries individual bias [
18]. Authors have labeled anxiety in multiple ways: binary (stressed or relaxed), three classes (no anxiety, low anxiety, and high anxiety), or four classes (no, low, mild, or high anxiety) [
19].
Supervised learning algorithms used for anxiety detection include Decision Tree (DT), Adaptative Boosting (ADB), Support Vector Machines (SVM), Naïve Bayes (NB), Markov Models (MM), Logistic Regression (LR), Random Forest (RF), Artificial Neural Networks (ANN), Linear Discriminant Analysis (LDA), etc. [
18,
19].
Previous machine learning studies have been conducted to classify distinct levels of anxiety, showing that combining different physiological signals increases the accuracy of anxiety detection systems [
14].
The EDA signal was used to detect and measure stress in call center employees at work and during each call. In a binary classification task—stressful/non-stressful calls—SVMs achieved an accuracy across participants of 78.03% [
20].
Accuracies higher than 95% were obtained in binary and multi-class classification of anxiety levels, in either subject-dependent or independent studies, using Linear Discriminant Analysis (LDA) with a combination of physiological signals such as GSR (Galvanic Skin Response), EMG, ECG, ST, and respiration data, with as many as three different physiological signals at a time [
19].
In classifying anxiety during Virtual Reality Exposure Therapy (VRET) sessions, a combination of Blood Volume Pulse (BVP), GSR, and ST were used with an SVM to classify four different anxiety classes (“low”, “mild”, “moderate”, and “high”), achieving an accuracy of 80.1% [
19]. In this research study, the feature selection was addressed by using Random Forest (RF), i.e., considering the relationship of the features with the target variable when selecting the optimal features [
19].
In another study [
21], the heart activity, skin conductance, and accelerometer signal were collected from 21 participants of an algorithmic programming contest for nine days to discriminate contest stress, relatively higher cognitive load (lecture), and relaxed time activities. Principal Component Analysis (PCA) was used for data dimensionality. This study used an imbalanced dataset; therefore, to deal with the imbalance problem, a combined strategy of undersampling the majority class and oversampling the minority class was applied. When combined with ECG and EDA information, a multilayer perceptron algorithm achieved the best classification accuracy of 92.15%.
To grant an immersive experience, Virtual Reality (VR) video games incorporate high-quality auditory and video feedback along with vibrotactile cues. Nonetheless, the user’s state is not considered to assess the video game experience. Using information extracted from ECG, EDA, and EMG signals of users while playing a VR video game with different difficulty levels, the work [
22] estimates the users’ stress levels, showing statistically significant differences between the rest and gaming stages. Moreover, using a KNN classifier, an accuracy of 83.1% was obtained for the three difficulty levels.
A study created a benchmark on the dataset using different standard machine learning methods and well-known features. Considering the three-class classification problem of neutral (baseline) vs. stress vs. amusement, the authors achieved 80% classification accuracy. In the binary case of stress vs. non-stress, accuracies of 93% were reached [
1].
Compared to the studies presented above, our study addressed the anxiety classification from a different perspective, focusing only on physiological data collected under a neutral condition without any state elicitation. Moreover, we also tackled the imbalanced distribution of anxiety classes to improve performance on typically less represented but more severe levels of anxiety.
3. Materials and Methods
The data processing and analysis were performed using Python version 3.8 [
23], NeuroKit2 version 0.2.1 [
24], scikit-learn version 1.1.1 [
25], and imblearn version 0.101 [
26].
This research follows a data processing chain consisting of the following steps: pre-processing of the physiological signals, segmentation, feature extraction, feature selection, classification, and classification performance evaluation.
Figure 1 illustrates these different steps, which are further detailed in this section.
3.1. Dataset Description
To achieve the proposed goals, we used a publicly available multimodal dataset for stress and affect detection—the WESAD dataset [
1]—containing self-reports, motion, and physiological data of 15 healthy participants during a lab study designed for stress and affect detection.
The data were collected under a study protocol designed for stress and affect detection, in which the subjects were exposed to different affective stimuli (neutral, stress, and amusement) and two meditation periods (to de-excite the participants). Besides the physiological signals collected during these conditions, the dataset also includes context notes about the participants and self-assessment report results. Self-reports were collected from all participants after each affective stimulus condition. The responses to the 6—STAI S questionnaire [
15] applied after the baseline condition were used to assess their current anxiety level.
According to the authors of the dataset, two subjects were excluded from the initial seventeen subjects that participated in the study due to sensor malfunction, resulting in 15 healthy subjects (three of whom were women). The mean age of the subjects is around 27.5 years, ranging from 25 to 29 years old.
Our study aims to address the classification of anxiety levels without any state elicitation for those or any pre-designed affective stimuli. Thus, only the data collected during the 20-min baseline condition was used to ensure a neutral affective state. The selection of the physiological signals for anxiety is supported by the literature [
17,
19], being described as reliable indicators of anxiety.
The dataset contains high-resolution data sampled at 700 Hz from a chest-worn device (RespiBAN) and a lower-resolution wrist-worn device (Empatica E4); nonetheless, only data from the RespiBAN device was employed in this study. The RespiBAN device contains multimodal sensors that allow obtaining the following physiological signals: ECG, EDA, EMG, respiratory activity (RESP), temperature (TEMP), and motion accelerometer (ACC). In this study, EMG data was recorded on the upper trapezius muscle on both sides of the spine, and the EDA signal was recorded on the rectus abdominis.
A short excerpt of these signals from two participants with anxiety levels of “High” and “Low and moderate”, with STAI-S scores of 16 and 10 (respectively), is shown in
Figure 2. Regarding the ECG, depicted on the left-hand side of the figure, it can be seen that the participant with a higher level of anxiety presents a higher heart rate (HR), as the signal presents more R-peaks for the same period. From the EDA signals, we can observe an almost constant Tonic Skin Conductance Level (SCL) for the participant with a “Low and moderate” level of anxiety. In contrast, besides showing more fluctuation, the participant with a “High” level also presents a higher number of SCR (Skin Conductance Response) peaks and higher amplitude values. Regarding the EMG signal, the right-hand side figure shows that higher anxiety levels present a higher number of bursts of activity and that these active muscle periods are longer than for lower anxiety levels. These observations in the physiological signals, supporting an increased sympathetic activity in higher levels of anxiety, are in accordance with what has been reported in the literature regarding reactions in the ANS related to anxiety disorders [
6,
10].
3.2. Raw Signals Filtering
After extracting the signals from the baseline condition, all signals were shortened to 19 min to ensure the same length for all participants. Thereafter, the signals were filtered to remove the noise and isolate frequencies of interest, improving the overall signal quality by removing different noises and artifacts. Besides the powerline interference (around 50 Hz), different noises affect the ECG, EMG, and EDA signals.
In an ECG, there are mainly two types of noises present. High-frequency noises, including electromyogram noise and additive white Gaussian noise; low-frequency noises, including baseline wandering due to movement and respiration (normally the content of the baseline wander is below 0.5 Hz) [
27].
EDA signals show expected skin conductance morphology at a low amplitude. Hence, it is mainly affected by the noise caused by electrical interference, which can manifest in the data as a small amount of fuzz on top of the signal [
28].
Regarding EMG signals, common low-frequency artifacts occur when the signal cables move due to the subject’s motion or incorrectly attached electrodes. In addition, other muscles near the testing site can generate an EMG signal, and crosstalk can be recorded. EMG recordings close to the subject’s heart may detect the subject’s pulse as a regular beat underlying the EMG signal [
27].
The physiological signals were filtered after power spectral density (PSD) analysis, supporting which frequencies contained the most information. Thus, different orders of Butterworth bandpass filters, with cutoff frequencies defined accordingly with the frequency components of interest for the various signals, were used to process the signals. Although it is an infinite impulse response filter, the Butterworth filter was chosen due to the insurance of a frequency response that is as flat as possible in the passband. Moreover, the nonlinear phase distortion was eliminated by processing all the signals in both the forward and reverse directions. After that, the order or filter was decided based on the mean absolute error and mean squared error computed from the raw and filtered signals. Regarding the ECG signal, the baseline wander, although not significant, was present in all participants. Thus, a 4th-order Butterworth bandpass filter was applied between 0.5–40 Hz. The EDA signal was filtered using a 4th-order Butterworth 5 Hz lowpass filter. As for the EMG signal, the powerline interference was removed in the 50 Hz range with a Notch filter, and a 4th-order Butterworth bandpass filter was applied between 20–200 Hz.
3.3. Anxiety Class Assignment
Based on the self-report results of the participant’s anxiety, we distinguished two classes for the classification of anxiety levels: “Low and moderate” vs. “High” anxiety. These classes were then used as labels in the classification task, and the features obtained from the physiological signals served as predictors to classify the levels of anxiety. When analyzing the self-reported results in
Figure 3a, the distribution of the anxiety scores is not balanced since they are not equally represented. The median of the anxiety scores is 12, and the mean is 12.567 with a standard deviation of ±1.726, ranging from 10 to 16.
Considerable evidence attests to the construct and concurrent validity of the STAI scale. Short forms were highly correlated with the 20-item STAI score, and all internal consistency reliability was greater than 0.90 [
29,
30]. Commonly, the 20 items of the STAI questionnaire divide individuals into three levels of anxiety: No/Low anxiety (1–11.1), moderate anxiety (11.4–13.2), and high anxiety (13.5–24) [
30].
Based on the cut points described in the literature, we defined the following classes: “Low and moderate” anxiety (6–13) and “High” anxiety (14–24). As shown in
Figure 3b, the higher level is less represented in the dataset, even though it is more important to detect and classify anxiety correctly. Therefore, as described in the literature [
31], balancing techniques were implemented to improve the classification of anxiety.
3.4. Features Extraction
An essential part of learning a model from physiological signals is feature extraction. Thus, after filtering the raw signals, features in time and/or frequency domains and non-linear features were extracted from each physiological signal.
After dividing the signals into equal time segments, ECG, EDA, and EMG features were extracted using the NeuroKit2 package [
24]. It is important to select a suitable signal window size, specifically because some features of HR and Heart Rate Variability (HRV) have a minimal time window required to be collected [
32]. Each physiological signal was divided into short-term segments with a 5-min time length and a 4-min overlap. Thus, 15 segments were obtained for each subject, and 109 features were computed for each segment (shown in
Table A1).
From the ECG-filtered signal, statistical features, such as the signal’s variance (Var) and dynamic range (Range), were calculated, and peak detection algorithms were used to compute peak features (peak standard deviation (SD), mean, and median (Med)). Through the detected peaks, the HR and corresponding statistical features (mean and median HR, mean area under the cardiac cycles (AUCC)) were also estimated.
The HRV was derived from the heartbeats’ location and corresponding statistical features. HRV time-domain indices quantify the HRV observed during monitoring periods that range from around 1 min to more than 24 h. Generally, resting values obtained from short-term monitoring periods correlate poorly with 24 h indices. Thus, it is important to consider only HRV features that can be extracted with validity in a 5-min time window (short-time measures) or less (ultra-short-term measures) [
32].
For short-term data, the time domain measures mean and median N-N intervals (MeanNN and MedianNN), with N-N representing the interval between normalized R peaks (N) intervals, the Standard Deviation of the N-N intervals (SDNN), square Root of the Mean of the Sum of Successive Differences between adjacent R-R intervals (RMSSD), and the proportion of N-N intervals greater than 50 ms or 20 ms (pNN50 and pNN20) out of the total of RR intervals, and the frequency domain measuring the total power, very low-frequency HRV (VLF), low-frequency HRV (LF), high-frequency HRV (HF), and the ratio between low-frequency HRV and high-frequency HRV (LF/HF) can be used. Their normalized and log-transformed versions are also considered appropriate [
32].
Some ultra-short-term studies mentioned Approximate Entropy (ApEn), Sample Entropy (SampEn), Triangular Interpolation of N-N interval histogram (TINN), the Standard Deviation of the Successive Differences between N-N intervals (SDSD), Median absolute deviation of the N-N intervals (MadNN), SDNN divided by the MeanNN (CVNN), RMSSD divided by the MeanNN (CVSD), and MadNN divided by MedianNN (MCVNN) were suitable for short-term measures of HRV [
32].
From the EDA-filtered signal, statistical features were computed. Furthermore, the two components of the EDA signal—SCL and SCR—were separated, and additional statistics from both components and peak features from the SCR, such as onsets, peak amplitude (Amp), and half-recovery time, were extracted.
Statistical and peak features were computed to assess muscle activity for the EMG-filtered signal. The EMG linear envelope (Env) was also extracted, and its statistical and peak features, such as activation (Activ) and pulse onsets, were computed. The EMG linear envelope consists of the smoothed EMG signal obtained through the low-pass filtering of the full-wave rectified signal [
20].
3.5. Feature Selection
Feature selection is crucial before processing any high-dimensional data for clustering or classification. It can be supervised or unsupervised, depending on whether it considers the target variable. The main objective is to reduce the data’s dimensionality by removing redundant or non-discriminatory features, which helps in the efficient execution of the classification step. Notwithstanding, not all features are relevant, leading to the need to determine the ones that best represent the analyzed condition—the two anxiety classes.
The feature selection applied consisted of three steps: (a) missing values and variance analysis; (b) unsupervised correlation threshold evaluation; and (c) supervised wrapper method. After this step, all features were normalized using the Min-Max scaling.
Concerning unsupervised methods for feature selection, the correlation between features was analyzed. This step aims to remove redundant variables that can cause bias in classification. Redundancy or collinearity may indicate very correlated processes or different ways of representing the same thing. The normality of the data was tested using a Shapiro-Wilk (SW) test. With a 95% interval confidence, the features LnHF and Corr SCR showed to follow a normal distribution. Thus, since not all variables followed a normal distribution, we used the Spearman correlation coefficient and checked the Pearson coefficient for the normal ones. The correlation coefficients that were shown to be significant (with a 0.01 or 0.05 significance level) were analyzed. The correlation coefficient threshold method—with a threshold of 0.90—was used, in which, between two highly correlated features, the one with the higher variance was selected.
Supervised feature selection selects features based on the target variable and is divided into three types of methods: filter, wrapper, and embedded methods. In this case, a wrapper method was used, Recursive Feature Elimination with Cross-Validation (RFECV), from the package scikit-learn [
25]. With this method, a subset of features is used to train a model, and then features are added or removed based on the inferences drawn from the model until a final subset is determined. RFECV derives the best feature subset using the same process as RFE, but unlike RFE, the number of features can be unspecified, and cross-validation is possible [
33].
A minimum of 10 features and a step equal to 1 (determining that one feature is eliminated in each computation) were the parameters for the RFECV method. The F1 was used as the scoring metric to choose the best set of features.
3.6. Feature Scaling
In this work, outliers were not eliminated because they may represent important cases as they can embody more severe cases of anxiety. When working with physiological signals, it is important to avoid subject-wise dependency (e.g., one person’s sweating can be extraordinarily high). Thus, the features were normalized before the classification task by the Min-Max scaling to map the data to an [0, 1] interval by applying the transformation Xn = (X − Xmin)/(Xmax − Xmin).
By normalizing all the observations, we reduce subject dependency and guarantee that all features are on the same scale, which is important for the classification task.
3.7. Data Balancing Techniques
As previously mentioned, the dataset is imbalanced, with an imbalance ratio of anxiety of 2.75 (165/45). Consequently, we used several data balancing techniques that changed the data distribution. Under-sampling techniques are not an appropriate choice as we already have a small number of observations, and this technique would further reduce our data size. Therefore, four data balancing techniques were applied—Random Oversampling (Over), SMOTE (SMO), ADASYN (ADA), and Borderline SMOTE 2 (Border). All these methods were settled to perform oversampling of the minority class; the parameters were set to guarantee a 1:1 class ratio.
Random oversampling involves randomly selecting examples from the minority class and adding them to the training dataset [
34]. SMOTE (SMO) was proposed to improve random oversampling and works by choosing a random minority class example, founding the
k nearest neighbors for that example, and then creating a new synthetic example by interpolating the features’ values of the two examples [
35].
Contrary to Random Oversampling and SMOTE, which are random methods, ADASYN and Borderline SMOTE 2 are informed methods as they act on specific observations. ADASYN (ADA) is a SMOTE version that works similarly but with one important difference: after creating the synthetic samples as described in SMOTE, ADASYN uses a density distribution as a criterion to automatically decide the number of synthetic samples that need to be generated for each minority data example. The resulting dataset will be balanced, and thus it will force the learning algorithm to focus on difficult-to-learn examples [
36]. Borderline SMOTE is also a version of SMOTE but differs from other oversampling techniques since it only makes synthetic data along the decision boundary between the two classes. Borderline SMOTE 2 (Border) not only generates synthetic examples using each minority example and its positive nearest neighbors but also does that using each minority example and its nearest negative neighbor [
37].
3.8. Classification of Anxiety Levels
Anxiety classification was addressed as a binary classification problem. Based on the literature, we have chosen seven different machine learning algorithms: Logistic Regression (LR), Linear Discriminant Analysis (LDA), Decision Tree (DT), Support Vector Machines (SVM), Adaptative Boosting (ADB), Random Forest (RF), and Extreme Gradient Boosting (XGB).
These classifiers were reported in the literature [
17,
19] to attain good results and to be suitable for the problem and the type of data available. Furthermore, the choice was motivated by evaluating different machine learning algorithms that are easily reproducible, optimized, and do not take much computing power.
To apply supervised selection and the data balancing techniques, we used nested stratified cross-validation [
38], where inner cross-validation is used to tune the parameters and select the best model. Outer cross-validation is used to evaluate the model chosen. With the package imblearn [
26], we used the data from the training set to compute the scaling parameters (min and max values of each feature), which were applied to normalize the data in both the training and test sets. We also guarantee that the data balancing techniques, while nested stratified cross-validating, are only applied to the training set, maintaining the original class imbalance ratio in the validation set.
It is well known that standard evaluation metrics, such as accuracy, are not suitable for imbalanced domains, as they might yield misleading results. Thus, it is of crucial importance to choose appropriate evaluation metrics. Accuracy evaluates the fraction of predictions the model got right. This is not an appropriate measure for imbalanced classification problems, since the majority (negative) class predictions will have a higher impact on the final results when compared to the minority (positive) class predictions [
31]. Nevertheless, other measures, such as precision and recall, were proposed to capture that impact better. Precision is the fraction of predicted relevant (positive) instances among all retrieved ones, while recall is the fraction of retrieved instances among all relevant (positive) ones. Nonetheless, these two measures exhibit a trade-off that may be impractical to monitor [
31]. Thus, combined measures are recommended, such as F1 and ROC-AUC. F1 is interpreted as a harmonic mean of precision and recall. In contrast, ROC-AUC can be described as the probability of the classifier assigning a higher rank to a random positive example than a random negative one [
31].
For the hyperparameter tuning, we used, in the inner loop, the grid-search method (from the package sklearn [
25]), which consists of an exhaustive search over a set of specified hyperparameters of a learning algorithm. The best hyperparameter combination is chosen using the F1 metric through 2-stratified-fold inner cross-validation.
The performance of the models was assessed through suitable metrics: accuracy, F1, ROC-AUC, precision, and recall. For estimating the model’s performance, the outer loop used a 5-stratified fold outer cross-validation with a train and validation percentage of 80%/20%. The mean value of the performance metrics and their standard error (SE) were computed and analyzed.
3.9. Pipeline Description
All the steps were implemented using a pipeline comprising feature scaling, supervised feature selection with the RFECV method, the application of several data balancing techniques, and the optimization of the hyperparameters of the different models trained.
When applying the different data balancing techniques to our data while cross-validating, although the supervised feature selection technique selects the feature sets before the data balancing, the best feature set is chosen considering the classifier’s performance after the data balancing technique and classifier hyperparameter tunning. Then, for each classifier and data balancing technique, the best combination of features may be different.
The pseudocode of our pipeline is shown in Algorithm 1.
| Algorithm 1: Pipeline for performance estimation of sampling techniques and learning algorithms for a set of metrics, using grid-search for model tuning |
 |
4. Results
In this section, we present and detail the results obtained by feature selection and data balancing techniques on the classification of anxiety levels.
4.1. Feature Selection
Unsupervised feature selection was performed by missing value and variance analysis and based on the pair-wise correlation method. No feature showed zero variance or missing values, and in the case of two features with a correlation coefficient higher than 0.90, the feature with the higher variance was selected. A total of 60 features were selected out of 109 from the three physiological signals (as shown in
Table 1).
Thereafter, supervised feature selection with RFECV was applied to this feature set, implemented inside a pipeline with nested cross-validation, considering the imbalanced data and data balancing techniques, as well as classifier hyperparameter tuning. Thus, we retrieved for each model the best hyperparameters and the best set of features found through the grid-search method applied in the inner loop to the selected features.
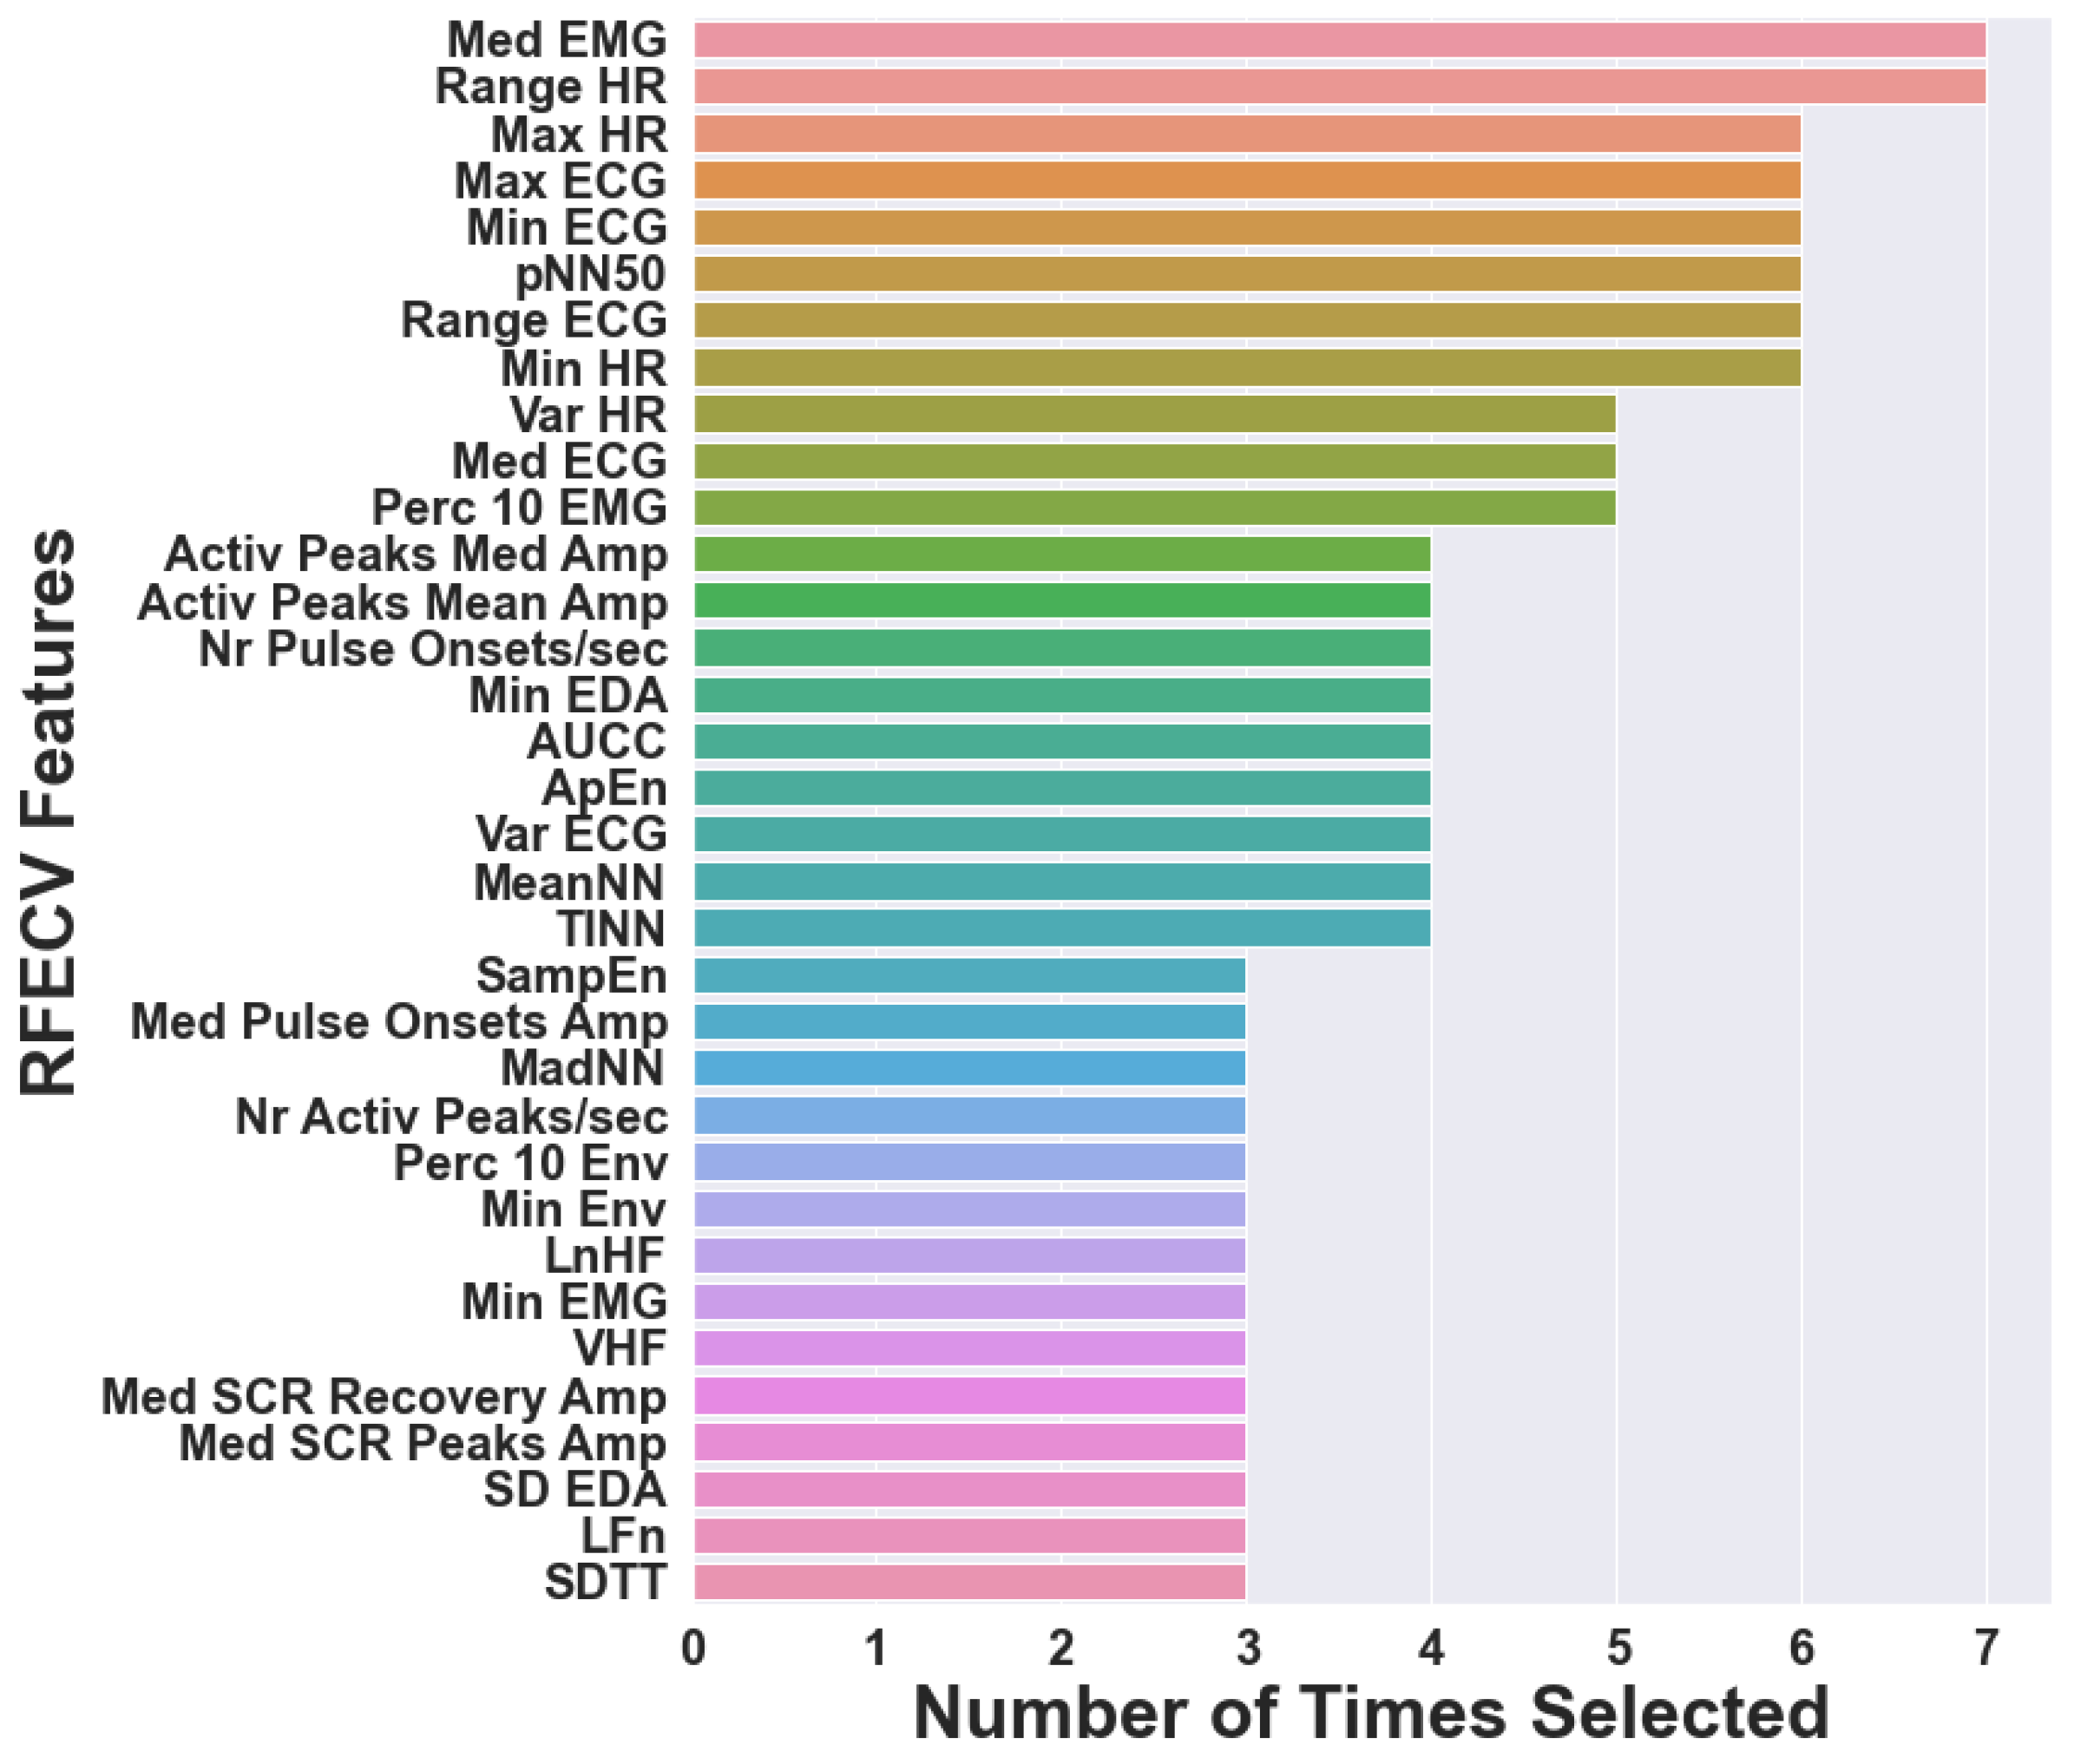
For the imbalanced data, the frequencies of the features chosen at least three times by RFECV are presented in
Figure 4. As RFECV was performed inside the pipeline, different sets of features were selected for the various classifiers, with a total of 55 features selected. Thus,
Figure 4 displays the number of times that 34 features, out of 55 different features, were selected (for different classifiers). We can observe that Range ECG and Med EMG are present in the feature sets selected for all the classifiers, while Max HR and Range HR are chosen for six of the seven classifiers. Max ECG, Var ECG, MeanNN, TINN, pNN50, Min HR, and Perc 10 EMG are present in five of the seven chosen feature sets. This analysis allows the visualization of which features could be of greater importance for classifying anxiety levels.
The features selected for the highest scores found for each classifier and the data balancing techniques are presented in
Table A2.
4.2. Anxiety Classification
We compared the estimated performance of the classification models when using RFECV for feature selection and four different data balancing techniques—Random Oversampling (Over), SMOTE (SMO), ADASYN (ADA), and Borderline SMOTE 2 (Border). For comparison purposes of the different balancing techniques between the different classifiers, the parameters were chosen for each technique and applied to all classifiers.
To better understand the performance and behavior of the data balancing techniques, we look at how the observations are distributed in the data space without the use of supervised feature selection in
Figure 5. It can be seen that in the original imbalanced dataset, there is a slight overlap of classes where the instances might be easily misclassified and that there is no relevant noise or small disjuncts in the data. Nevertheless, although the class overlap persists and is even slightly increased by the data balancing techniques, the number of minority examples increased, and therefore the classification of those difficult cases might be improved, especially along the decision border.
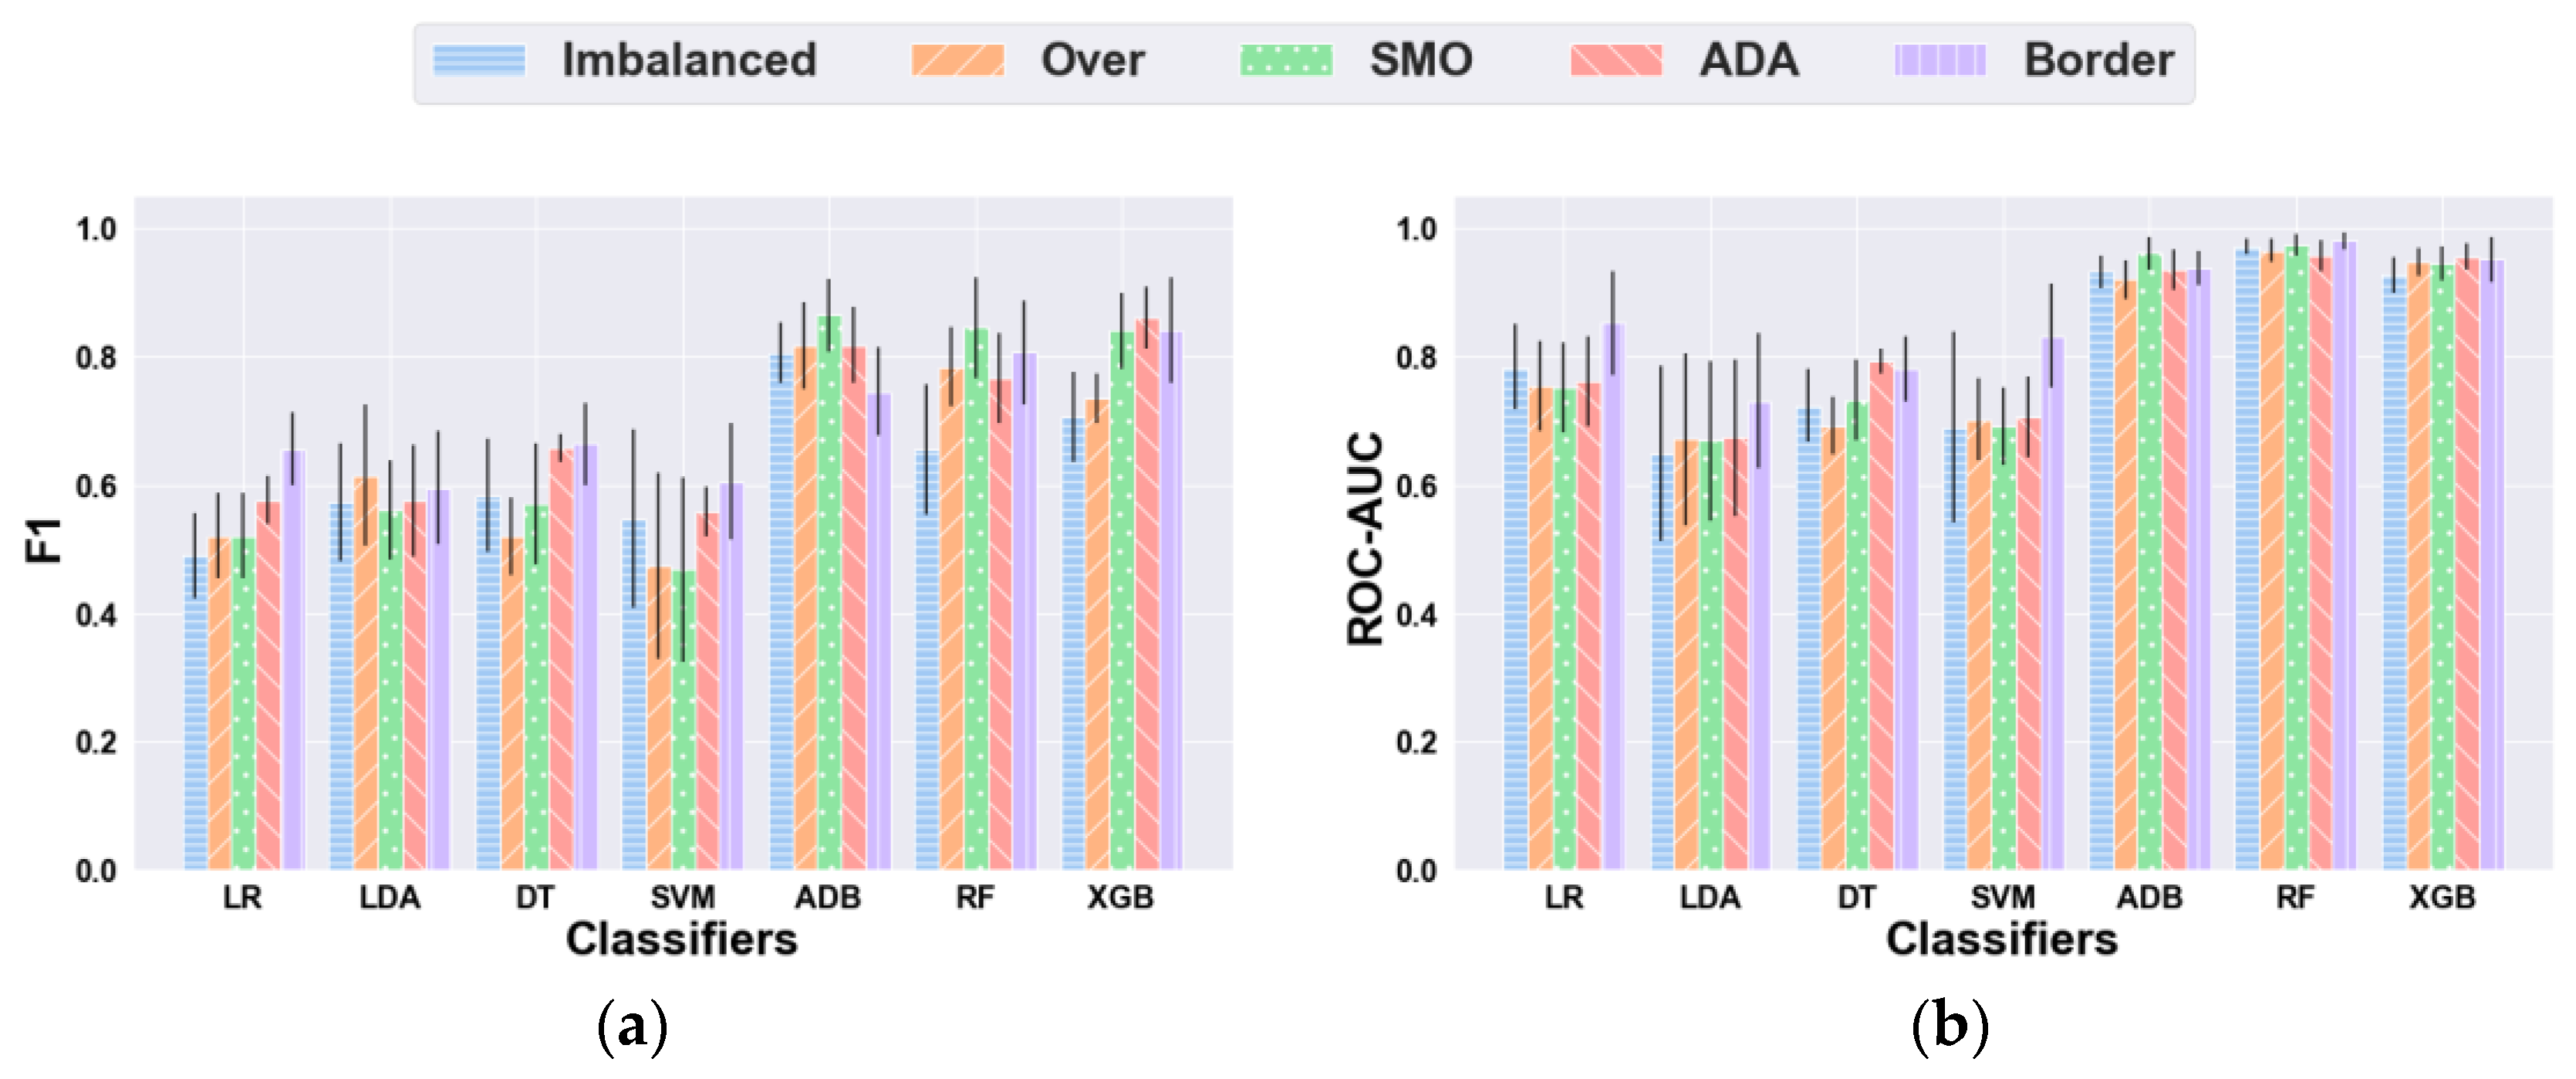
The anxiety classification performance of each classifier, using RFECV with the different data balancing techniques, is presented in
Figure 6 and
Table A3.
Using the imbalanced dataset, some of the classifiers showed relatively lower measures of F1-score because of low recall or precision, while maintaining good accuracy values. This may reflect the impact of data imbalances on the classification performance of the models. Considering our problem, recall is more relevant than precision since misclassifying severe cases of high anxiety is more prejudicial.
Concerning the F1 metric, Random Oversampling (Over) improved all classifiers’ performance except DT and SVM, and SMOTE (SMO) showed improvements in all classifiers’ performance aside from LDA, DT, and SVM. At the same time, ADASYN (ADA) appeared to increase the performance of all classifiers, and Borderline SMOTE 2 (Border) did not improve the score of ADB. The best F1 result was achieved using SMOTE and ADB, with a mean score of 0.864 (SE = 0.057). Regarding ROC-AUC, Over showed improved scores for LDA, SVM, and XGB, while SMO increased the evaluation scores of all classifiers except LR. ADA improved all models’ performance apart from LR and RF, and Border boosted the performance of all classifiers. The best ROC-AUC score was obtained with Border and RF, with a mean score of 0.980 (SE = 0.017).
The execution time of our pipeline (without the data balancing techniques) is presented in
Figure 7. It is worth noticing that the classifiers with the worst performance results had lower execution times: 1.91 s, 1.07 s, 0.47 s, and 0.58 s, respectively. As for the best-performant algorithms, ADB presented intermediate runtimes of 14.73 s, whereas RF and XGB presented higher execution times.
5. Discussion
We tackled the problem of predicting anxiety levels from physiological data collected without any emotional elicitation (under a neutral condition) as an imbalanced binary classification problem. Rather than proposing new techniques for addressing this problem, we relied on a systematic approach to predict anxiety, combining several pre-processing and machine learning methods, including signal analysis, feature extraction, and re-sampling strategies for classifying anxiety. Thus, this section discusses the obtained results and main findings from feature selection and anxiety classification perspectives.
5.1. Feature Selection
The main challenges faced were concerned with the physiological characterization through the different signals, arising either from the combination of several features extracted from them or from the potential of each signal to contribute more to a better description. This required feature importance and selection to be carefully attained.
The frequencies of the features chosen at least three times by RFECV, as depicted in
Figure 4, allow for identifying which features were more relevant when classifying anxiety. We can say that the top 10 most frequently selected features are predominantly ECG-extracted features, while Med EMG was the only EMG-extracted feature. However, Med EMG was the only feature present in the feature sets for all classifiers, reinforcing its ability to distinguish between anxiety classes. It is also worth noting that no features extracted from the EDA signal are in the top 10. This might suggest that the ECG and EMG features are more important when combined with other physiological signals, while the EDA features do not add relevant information.
It is also important to notice that five features were not chosen for any of the classifiers. Three of them were extracted from the EDA signal—Range SCR, Mean, and Median Rise Time—and the other two were extracted from the EMG signal—Range Envelope and Mean EMG. Again, this further confirms the lower importance of the EDA signal on anxiety classification when compared to the ECG signal.
5.2. Anxiety Classification
Concerning the multimodal classification of anxiety, another challenge is that, frequently, in a non-clinical population, more severe cases of anxiety are rare [
1]. Nevertheless, training machine learning models to predict those levels accurately is of crucial importance as they represent higher health risks. The WESAD dataset [
1] used in this work is imbalanced, as more severe cases of anxiety are not as common, and consequently, the various levels are not equally represented. As this poses difficulties for standard classification algorithms, we resorted to techniques that involve oversampling and synthetic data generation to improve anxiety classification.
Overall, for both F1 and ROC-AUC, a pattern can be distinguished in the global efficacy of the balancing techniques, which reveals a better performance with Borderline SMOTE 2 and ADASYN. In
Table A3, it can be seen that Borderline SMOTE 2 attained the highest results in both metrics with two classifiers—LR and SVM in F1 with DT and ROC-AUC with LDA and RF. SMOTE was the best technique with two classifiers—in both metrics with ADB and F1 with RF. ADASYN outperformed the other techniques with XGB and ROC-AUC with DT. Random oversampling was the least efficient technique in both metrics, achieving only the best results in F1 with LDA.
Ordering the combination of data balancing techniques, considering the number of classifiers that obtained the best results, we get the following sequence: Borderline SMOTE 2, ADASYN together with SMOTE, and Random Oversampling. The success of Borderline SMOTE 2 and ADASYN can be explained by the way they synthesize new instances in an informed rather than random manner, acting on the examples that are more likely to be misclassified.
Our results support a comparison study [
39] that used Random Oversampling, SMOTE, ADASYN, and Borderline SMOTE 1 and 2. For both true positive rate (TPR) and F1, Borderline SMOTE 1 and Borderline SMOTE 2 performed better than the other data balancing techniques.
Analyzing F1 and ROC-AUC metrics, the balancing techniques have been shown to improve, in general, the classification results. Moreover, in some cases, the addition of class overlaps, noise, and even overfitting of the classifiers prevented the enhancement of the results. Borderline SMOTE 2 showed the most consistent results. Regarding precision and recall, there is a notable overall pattern of increased values. However, recall is consistently higher than precision, which is valuable since misclassifying severe cases of high anxiety is more harmful. In cases where the data balancing did not improve F1, both metrics decreased or precision worsened considerably.
As a final remark, concerning the balancing techniques, the “default” sampling rate of 1:1 was used, which might not always be the best option for every classifier. It would be beneficial to tune the sampling ratio on our dataset while considering each classifier at a time. Since the same parameters were chosen for each balancing technique and applied to all classifiers, some classifiers may respond better to the parameters selected, which can also partially explain the differences encountered in the results for each technique.
Although our study uses only the data collected during the neutral condition, and therefore comparisons of the obtained results to anxiety-stimulating conditions may be inaccurate, we can observe the results of the benchmark study performed on the WESAD dataset [
1]. In the binary classification task (stress vs. non-stress, or neutral and amusement conditions), the best F1 scores using the RespiBAN physiological modalities—ECG, EDA, EMG, RESP, and TEMP—were obtained by the RF, ADB, and LDA classifiers for the binary task and ranged from 86.0% (RF) to 90.9% (LDA) [
1]. For our study, the best F1 results were obtained by ADB, RF, and XGB, ranging from 84.5% (RF) up to 86.4% (ADB). Our F1 results are close but slightly worse than the results from the benchmark study, even though we are solely working with the neutral condition.
As for the computational complexity, our study presented the highest execution times with ADB, RF, and XGB, congruent with the complexity of these three algorithms.
5.3. Comparison with Other Works
Multiple studies have been developed in the field of anxiety and mental stress detection, either using a single signal or multi-signal approach, to attain anxiety as an induced condition using different stimuli such as driving or public speaking. Our study did not use anxiety stimuli since we relied on the data collected during a neutral affective condition. Therefore, these methods are not directly comparable to ours. However, it is important to place our results in comparison with the existing anxiety detection systems.
Concerning studies conducted in real-life settings, the study [
17] relies on the classifier LDA and the EDA signal to discriminate between three mental stress levels—low, medium, and high—corresponding to three driving conditions: at rest, on the highway, and city driving. The study used the MIT Media lab “stress database” and eighteen EDA-extracted features. The Fisher projection was applied for dimensionality reduction, and LDA was used to classify the mental stress levels, achieving a recognition rate of 81.82%. Additionally, as described in the review article [
40], in research carried out by Healey et al., the same driving task was used to induce mental stress. Using the signals EDA, ECG, EMG, and respiration combined, the classifier LDA reported a recognition rate of 100%, 94.7%, and 97.4% for low, medium, and high stress levels, respectively. In the work [
21], regarding a programming contest scenario, heart activity, skin conductance, and accelerometer data from 21 participants were gathered to discriminate between contest stress, higher cognitive load, and relaxed time. The dataset is imbalanced, so minority examples were added and the majority ones were removed. The study evaluated six classifiers, and when combining ECG and EDA, MLP attained an accuracy of, at most, 92.15%.
For the VR-based approaches introduced in
Section 2, when evaluating five classifiers using features from ECG, EDA, and EMG signals, the study [
22] obtained an accuracy of 89.7%. Relying on BVP, GSR, and ST signals from 30 participants collected during a VRET-based public speaking anxiety treatment session, the work [
19] attained a four-level anxiety (low, mild, moderate, and high) classification. The authors used RF to select the best features. The SVM penalty parameter C was set for class balancing by adjusting weights inversely proportional to class frequencies, and the obtained accuracy was 86.3%.
Concerning the laboratory-induced anxiety studies, the review work [
17] analyzed mental stress and anxiety recognition approaches, mostly using multimodal binary classification, like our study, and reported accuracies ranging from 40% to 95%. Hovsepian et al. [
41], who conducted both a lab and a field study, achieved a 92% mean accuracy in detecting stress based on laboratory data and 62% on field data. In the survey [
21], the EDA and HR combination yielded the best results with more than 95% accuracy.
While inducing stress and alleviation through several stimuli and based on a multimodal approach with ECG, GSR, BP, respiration, and oximeter data, Akmandor et al. [
42] applied SVM and KNN for binary classification and achieved 95.8% accuracy. Attaining a binary mental stress classification task, the laboratory study by Sandulescu et al. [
43], which used GSR and BVP with an SVM classifier, reported an accuracy of 80%.
When compared to other studies, we can state that our results are consistent. Our study’s accuracy ranges from 62.7% (LDA with Borderline SMOTE 2) to 92.0% (RF with SMOTE). Thus, even though none of these works tackled the classification problem from an imbalanced domain learning perspective as we did, we can report:
compared to real-life driving and contest scenario studies, our study shows better accuracy results than the first driving study [
16] but slightly worse results than the second one and the contest scenario study [
21,
40].
our study attained better accuracy results than both VR-based studies [
19,
22].
we achieved lower accuracy scores than the Akmandor et al. [
21,
42] study but very similar and better results than the Hovsepian et al. study [
41] and the Sandulescu et al. study [
43], respectively.
6. Conclusions
Our study used the WESAD dataset and the combination of three physiological signals—ECG, EDA, and EMG—collected under a neutral condition to classify different anxiety levels, with particular emphasis on more severe and less frequent levels of these mental conditions. The physiological signals were processed, and relevant features were extracted for classification purposes. A supervised feature selection algorithm, seven machine learning algorithms, and four data balancing techniques were analyzed.
Concerning the features selected for the classification task, we concluded that ECG-extracted features were revealed to have more importance than features extracted from EMG and EDA signals. Additionally, the balancing techniques have been shown to improve, in general, the classification results.
Two main shortcomings of this study are the reduced number of participants, which restricts the data’s representativeness, and the neutral condition of the data set used, whose protocol was not specifically designed for this study. Although it is already challenging to achieve a neutral condition, the fact that the participants knew they would face different stimuli after the neutral condition may lead them into an anticipation state. Additionally, the fact that half the participants were sitting down and half were standing up during the neutral condition can influence the physiological signals, especially the EMG signal.
Despite the limitations, our findings allowed us to successfully classify anxiety in a neutral state, providing a deeper understanding of this condition. Through our outcomes, we concluded that it is viable to use classification models in applications connected with wearable devices (e.g., watches, smartphones), which can help detect and manage anxiety.
In future work, there are some topics to be considered further in this line of research. At first, by considering a protocol specifically designed for attaining neutral conditions and engaging more participants. In addition, by addressing anxiety classification tasks from a multiclassification perspective or as ordinal classification tasks. Concerning the feature selection techniques, supervised feature selection, such as sequential feature selection or filter methods, may be an option as well. Regarding the data balancing techniques, when facing a data imbalance problem, the use of techniques that combine over/under-sampling methods and the integration of those into machine learning algorithms are also worth trying. Further tuning the balancing parameters and the classifier hyperparameters may improve the results.


