Article

Effects of Time and Temperature on Stability of Bioactive Molecules, Color and Volatile Compounds during Storage of Grape Pomace Flour

National Research Council (CNR)-Institute of Sciences of Food Production (ISPA), Via Lecce-Monteroni, 73100 Lecce, Italy
*
Author to whom correspondence should be addressed.
Appl. Sci. 2022, 12(8), 3956; https://doi.org/10.3390/app12083956
Submission received: 14 March 2022 / Revised: 11 April 2022 / Accepted: 12 April 2022 / Published: 14 April 2022
(This article belongs to the Special Issue Unconventional Raw Materials for Food Products)

Abstract

:
Background: Grape pomace is highly attractive for the food industry as it contains numerous bioactive molecules relevant for human health. However, in order to exploit pomace flour as a functional food ingredient for food industry, it is important understand how long-term storage affects the stability of both bioactive molecules and volatile compounds, in addition to color. To this end, we analyzed whole pomace flour from red grape during a six-month storage period in the dark, either at 4 °C or 25 °C. Methods: The specific parameters monitored of grape pomace flour included: antioxidant activity (TEAC assay), total phenol content (Folin-Ciocalteu assay), phenol composition (high performance liquid chromatography), fatty acid composition (gas chromatography-mass spectrometry), volatile compound profiles (headspace-solid phase micro-extraction) and color. Results: Prolonged storage did not significantly affect total phenol content, antioxidant activity and characterized bioactive molecules (polyphenols, fatty acids). The only detected effect of storage was a slight whitening of the pomace flour and a small increase of volatile long chain esters and ketons after 6 months at 25 °C. Conclusions: The activity of several health-relevant bioactive compounds remained stable following storage of pomace flour for 6 months at 4 °C, supporting its possible use as a functional food ingredient.

1. Introduction

In conventional wine processing, large amounts of grape pomace (GP) are produced annually, accounting for 25% of the original fruit mass [1]. Although GP represents an excellent source of dietary fibers and polyphenols, this renewable natural resource is still underutilized in nutraceutical products [2,3]. However, deterioration of biologically active compounds caused by processing represents a major bottleneck for GP utilization in food production chains. Several studies have disclosed the possibility of creating value-added products by incorporating grape by-products in bakery products or pasta [4,5,6]. For example, the addition of GP to semolina has a positive impact on functional and physio-chemical properties of pasta such as adhesiveness, firmness and volatile profile. The inclusion of GP also leads to an increase in total polyphenol content and antioxidant activity and a decrease in the glycemic index as a result of an increase in resistant starch content [7]. As reported by Ungureann-Iuga and coworkers [8], grape peel powder also improves the technological properties of doughs used for the production of high quality gluten-free foods. The most economically viable approach of longterm storing GP is by reducing its highwater content (75–80%) by drying. That also leads to reduction in volume, thus lowering transportation costs. The drying method adopted is an important factor that affects both the content and activity of phenols, as well as functional properties of GP. In particular, high temperatures can compromise the bioactivity of thermally sensitive compounds. Thus, there is strong interest in the development of an economically and technically feasible technology for GP preservation at an industrial scale that results in a stable product with minimum presence of water and a high concentration of biomolecules. An optimal drying step could enhance the potential use of pomace as a powerful natural antioxidant ingredient in functional foods. To avoid the loss of bioactive compounds due to their thermal instability, freeze-drying is considered superior to oven drying [9]. However, this approach is time-consuming and too costly for industrial application [7]. However, as reported by Gerardi et al. [10] freeze or oven dried (50 °C) GP skin showed no significant difference in total phenol content. Moreover, it has been shown that heat treatment over long periods can favorize the extraction of low molecular weight molecules, thus increasing their bioavailability [11]. Oven drying at 50° is preferred because it is faster, more reproducible and it allows for the storage of grape pomace [10]. GP stabilization and grape pomace flour (GPF) storage conditions play a significant role in their subsequent utilization as functional ingredients [12]. In fact, phenols (such as catechins, soluble acids, flavonols, stilbenes and anthocyanins) and fatty acids present in GP exhibit antioxidative, cardioprotective, antidiabetic, gastroprotective and antilipemic effects [10]. The bioactive compounds that contribute to the positive health properties of grape-pomace-added foods are presumed to be poly and monounsaturated fats, fiber and antioxidants [13]. Moreover, previous studies [14,15] have demonstrated potential applications of polyphenols in food preservation and product shelf life. In previous investigations, GP obtained from winemaking of white or red grape cultivars was studied for antimicrobial and antioxidant properties [14,16]. The results suggested that the antioxidant and antimicrobial activities of different grape variety extracts were related to their phenolic profile. Given these results, flour pomace could be exploited for future applications in food, pharmaceutical and cosmetic industries. In this study, we prepared GPF as a functional food ingredient aimed at increasing the daily intake of dietary bioactive antioxidant compounds. To this end, we applied a simple dehydration technology to whole GP originating from individual varieties of grape and analyzed the content and stability of biomolecules present in GPF during a six month period at two different storage temperatures. We also assessed factors relating to shelf life such the stability of different classes of polyphenols and fatty acids, total phenols (T.P.) and antioxidant activity. Furthermore, to evaluate sensory changes over time, we monitored GP volatile profiles and color. To our knowledge, this is the first work that describes the effects of storage on the shelf life of GPF obtained from GP.

2. Materials and Methods

2.1. Reagents

Trans-resveratrol was obtained from by ICN Biomedicals (South Chillicothe Road, Aurora, OH, USA), whereas catechin, quercetin, quercetin-3-glucoside, epicatechin, rutin and oenin were purchased by Extrasynthese (Genay, France). All other compounds were provided by Sigma-Aldrich (St. Louis, MO, USA).

2.2. Raw Material and Sample Preparation

GP (skins and seeds) from the grape cultivar Vitis vinifera cultivar Negroamaro was obtained from a local winery. GP was dried in an oven at 50 °C, until constant weight (48 h in the dark) [10]. GPF was obtained by a laboratory sample mill (FOSS, Hillerød, Denmark). For the six-month storage study, GPF was stored in sealed polypropylene bags. GPF were prepared for sampling and stored either at 4 °C or 25 °C in the dark at ambient humidity. Samples were analyzed at time point (T0) and at monthly intervals for a period of six months (T1–T6).

2.3. GPF Polyphenol Extraction and HPLC Analysis

GPF samples (1 g) were extracted with methanol/ethanol/formic acid (75:20:5, v/v/v) in a ratio of 1:10 (GPF/solvent, w/v) [10]. Supernatants were collected in fresh tubes and stored at −20 °C until analysis. GPF extracts were quali-quantitatively examined by an 1100 Series HPLC system (Agilent) equipped with a Luna 5 µm C18(2) 100 Å column (250 × 4.6 mm) (Phenomenex, Torrance, CA, USA) as reported by Gerardi et al. [16]. The wavelengths used for quantification of phenol compounds were 280, 306, 320, 370 and 520 nm. The qualitative analysis of phenolic compounds was carried out on the basis of their retention times and spectroscopic spectrum. Weighted amounts of each standard compound were dissolved in 80% (v/v) methanol-water mixture to prepare the requested stock solutions. Each sample was independently injected into the HPLC column and then eluted using the above method in order to establish its chromatographic retention time and collecting UV spectrum. The working solutions were obtained by diluting the stock solutions with the methanol-water mixture (80% v/v), thus allowing to achieve for each compound a ten-point regression curve (r2 ≥ 0.99). Quantification of single compounds was achieved by employing a ten-point regression curve of the UV absorption data sampled at the wavelength of maximum absorbance of each analyte and expressed in μg/g.

2.4. High Performance Liquid Chromatography (HPLC) Characterization of Anthocyanins

To quantify and characterize the anthocyanin molecules in alcoholic extract from grape pomace flour we performed an HPLC analysis using an Agilent-1100 liquid chromatograph equipped with a DAD detector as described in Gerardi et al. [10]. The column was a C18 Luna (Phenomenex, 250 × 46 mm, 5 μm) in conjunction with a C18 guard cartridge column, both maintained at 30 °C temperature. The mobile phase was (A) H2O/formic acid = 95/5 and (B) acetonitrile/formic acid = 95/5. The samples were eluted following a linear gradient: 1 min of isocratic elution with 6.7% B, 25 min of linear gradient from 6.7 to 16.7% B, 9 min of linear gradient from 16.7 to 55.6% B, 5 min of isocratic elution with 55.6% B, 3 min of linear gradient from 55.6 B to 80% B and 8 min of isocratic elution with 80% B. Flow rate: 0.7 mL/min. Chromatograms were acquired at 520 nm. Quantification of total anthocyanins was directly performed by HPLC/DAD using a five-point regression curve (r2 ≥ 0.99) generated through the use of malvidin 3-O-glucoside (oenin) as reference compounds and was expressed as oenin equivalents (OEs).

2.5. Total Polyphenols Content

A previously optimized Folin-Ciocalteu method was carried out to measure the total amount of polyphenols. The amount of total phenols in GPF extracts was assessed by determining the absorbance at 760 nm [16]. Results were expressed as milligram of Gallic Acid Equivalents per gram of GPF (mg GAEs/g of GPF).

2.6. TEAC Antioxidant Capacity Determination

The Trolox Equivalent Antioxidant Capacity (TEAC) assay is based on the scavenging capability of antioxidant molecules to reduce the radical cationic action of 2,2′-azinobis (3-ethylbenzoithiazolone 6-sulphonate) (ABTS•+). The analysis was performed as previously described [17]. To generate the ABTS•+ radical cation, ABTS (7 mM) was dissolved in water added with potassium persulfate solution (2.45 mM) and incubated at 25 °C in absence of light for 12–16 h. To produce the calibration curve, 20 μL of Trolox standard solution (from 0 to 25 μM) was added to the ABTS•+ solution diluted to an absorbance value (734 nm) of 0.40 ± 0.02. Absorbance was determined at 734 nm and obtained values were expressed as μmol Trolox Equivalents (TE)/g of GPF.

2.7. GPF Fatty Acids Extraction and GC Analysis

Total lipids were extracted from aliquots (0.1 g DW) with 4 mL of n-hexane and stirring (3000 rpm) overnight at 4 °C. Samples were centrifuged (6000× g 10 min) and a stream of nitrogen was used to vaporize the organic phase. Lipids were subjected to fatty acids derivatization, as previous reported [18]. Briefly, each sample was solubilized in a methanol solution (3 mL) of 0.5 M NaOH, incubated at 100 °C for 5 min and cooled to room temperature. Two mL of boron trifluoride in methanol (12% w/v) was added and boiled at 100 °C for 30 min. After cooling, 1 mL di n-hexane and 1 mL of NaCl (0.6% w/v) were added. The organic phase was diluted with n-hexane to 1:10 (v/v) and analyzed by GC-MS employing the Agilent 5977E Series GC/MS system (Agilent Technologies, Santa Clara, CA, USA) using a DB-Wax column (60 m, 0.25 mm i.d., 0.25 mm film thickness, Agilent) [18]. The GC parameters were as follows: the temperature of the column was 50 °C after injection for 1 min, then programmed at 25 °C/min to 200 °C, at 3 °C/min to 230 °C and maintained at constant temperature of 230 °C for 23 min. Split injection was conducted with a split ratio of 5:1, the flow-rate was 1.0 mL/min, carrier gas used was 99.999% pure helium, the injector temperature was 250 °C and the column head pressure was 40 psi for 0.4 min, constant pressure at 20 psi. The MS detection conditions were as follows: transfer line temperature 250 °C, mode Scan, source and quadrupole temperature 230 °C and 150 °C respectively, scanning method of acquisition, ranging from 46 to 500, for mass/charge (m/z) was optimized. Spectrum data were collected at 0.5 s intervals. Solvent cut time was set at 2 min and 40 min retention time sufficient for separating all the fatty acids. Compounds were identified by using online NIST-library spectra and published MS data. Furthermore, authentic standards were used to confirm MS data.

2.8. Analysis of Volatile Compounds

The Headspace-Solid phase micro-extraction (HS-SPME) technique was adopted to identify and quantify GPF volatile compounds. For each analysis, 0.5 g of sample was placed in a 20 mL glass vial, containing 0.5 g of sodium chloride and 2 mL of distilled water and then stirred for 20 min in a water bath (50 °C). The n-tridecane (100 mg/L) was used as internal standard A DVB/CAR/PDMS (Divinylbenzene/Carboxen/Polydimethylsiloxane) fiber was inserted, maintained for 40 min, and then it was removed and inserted in the GC injector to desorb the volatile molecules. Flour samples were analyzed with the 5977E Series GC/MS system (Agilent Technologies, Santa Clara, CA, USA) furnished with a DB-Wax column (60 m, 0.25 mm i.d., 0.25 mm film thickness). Oven temperature increased from 40 °C for 5 min to 50 °C at a rate of 3 °C/min, and finally to then 225 °C at a rate of 5 °C/min. The MS acquisition mode was full scan (40–450 m/z). The identity of molecules was determined by comparison of spectra with the NIST14 library and confirmed by injection of the pure reference standards when available. The semi-quantitative analysis was performed using the internal standard method [19].

2.9. Color and Moisture Evaluation

GPF color was measured during the six-month storage in the dark at 4 °C and 25 °C, using a Minolta CR-410 chromatometer (Konica Minolta Camera Co., Ltd., Osaka, Japan). The CIELAB color space was used to determine the parameters L* from black (0) to white (100), a* (red (+a) to green (−a) color) and b* (yellow (+b) to blue (−b) color). Color measurement was replicated three times for each flour sample.
Grape pomace moisture was evaluated by utilizing a moisture measuring balance (AND MX50, A&D Company, Limited, Tokyo, Japan). The temperature for the measurement was 120 °C for 30 min. Moisture measurement was replicated three times for each flour sample.

2.10. Statistical Analysis

The statistical significance of the differences between the measured data was assessed by performing both a parametric method (two sample-t-test) and a non-parametric one (Mann-Whitney U Test) by means of the SigmaStat software Version 3.1 (Jandel Corp., Erkrath, Germany). The Principal Component Analysis and the heatmap were obtained using routines written in the MATLAB program design. Data are the mean ± standard deviation of three independent replicates (n = 3).

3. Results and Discussion

3.1. Stability of Polyphenols in Negroamaro Pomace Flour Extracts during Storage

GPF stored for six months in the dark at 4 and 25 °C, showed no significant differences in total anthocyanin and oenin content (Table 1).
In the chromatographic profile of the GPF extracts, we detected phenolic acids such as caffeic, caftaric, cutaric and gallic acids and these metabolites had a similar relative distribution during storage (Table 1).
Stilbenes content, and in particular resveratrol, shows significant differences among V. vinifera cultivars [20]. Table 1 shows the results related to the analysis of stilbene levels in Negroamaro GPF. It can be seen that trans-resveratrol levels increase during the six months storage period, both at 4 °C and 25 °C.
In grape, flavanols can be found as monomers (epicatechin 3-gallate, gallocatechin, catechin, epigallocatechin and epicatechin), oligomers and polymers (i.e., tannins and proanthocyanidins) that show antioxidant activity both in vitro and in vivo [21,22,23]. In this study we identified the flavanols catechin and epicatechin in GPF (Table 1). While storage at 4 °C did not affect their content significantly, we observed a slight but statistically significant decrease following storage for six months at 25 °C.
Flavonols are considered bioactive grape/wine compounds that are potentially relevant for human health and nutrition [24,25]. Moreover, in a process known as co-pigmentation anthocyanins can interact with flavonols, leading to an increase in red color. In our GPF we identified the flavonols quercetin and quercetin 3-glycoside (Table 1). In this study GPF prolonged storage do not affect flavonols content. Conversely, the concentration of other compounds such as stilbenes increased over time. This later is in agreement with other studies of food ingredients, that reported a storage-related increase in phenol content [26,27]. Storage can lead to changes in plant and cell tissue structure, as well as degradation of covalently bound phenolic molecules. In turn, that lead to an increase in solubility and consequently an improved extraction of such compounds. These results confirmed the hypothesis that GPF can be stored at both 4 °C and 25 °C without losing of several of its biological properties.

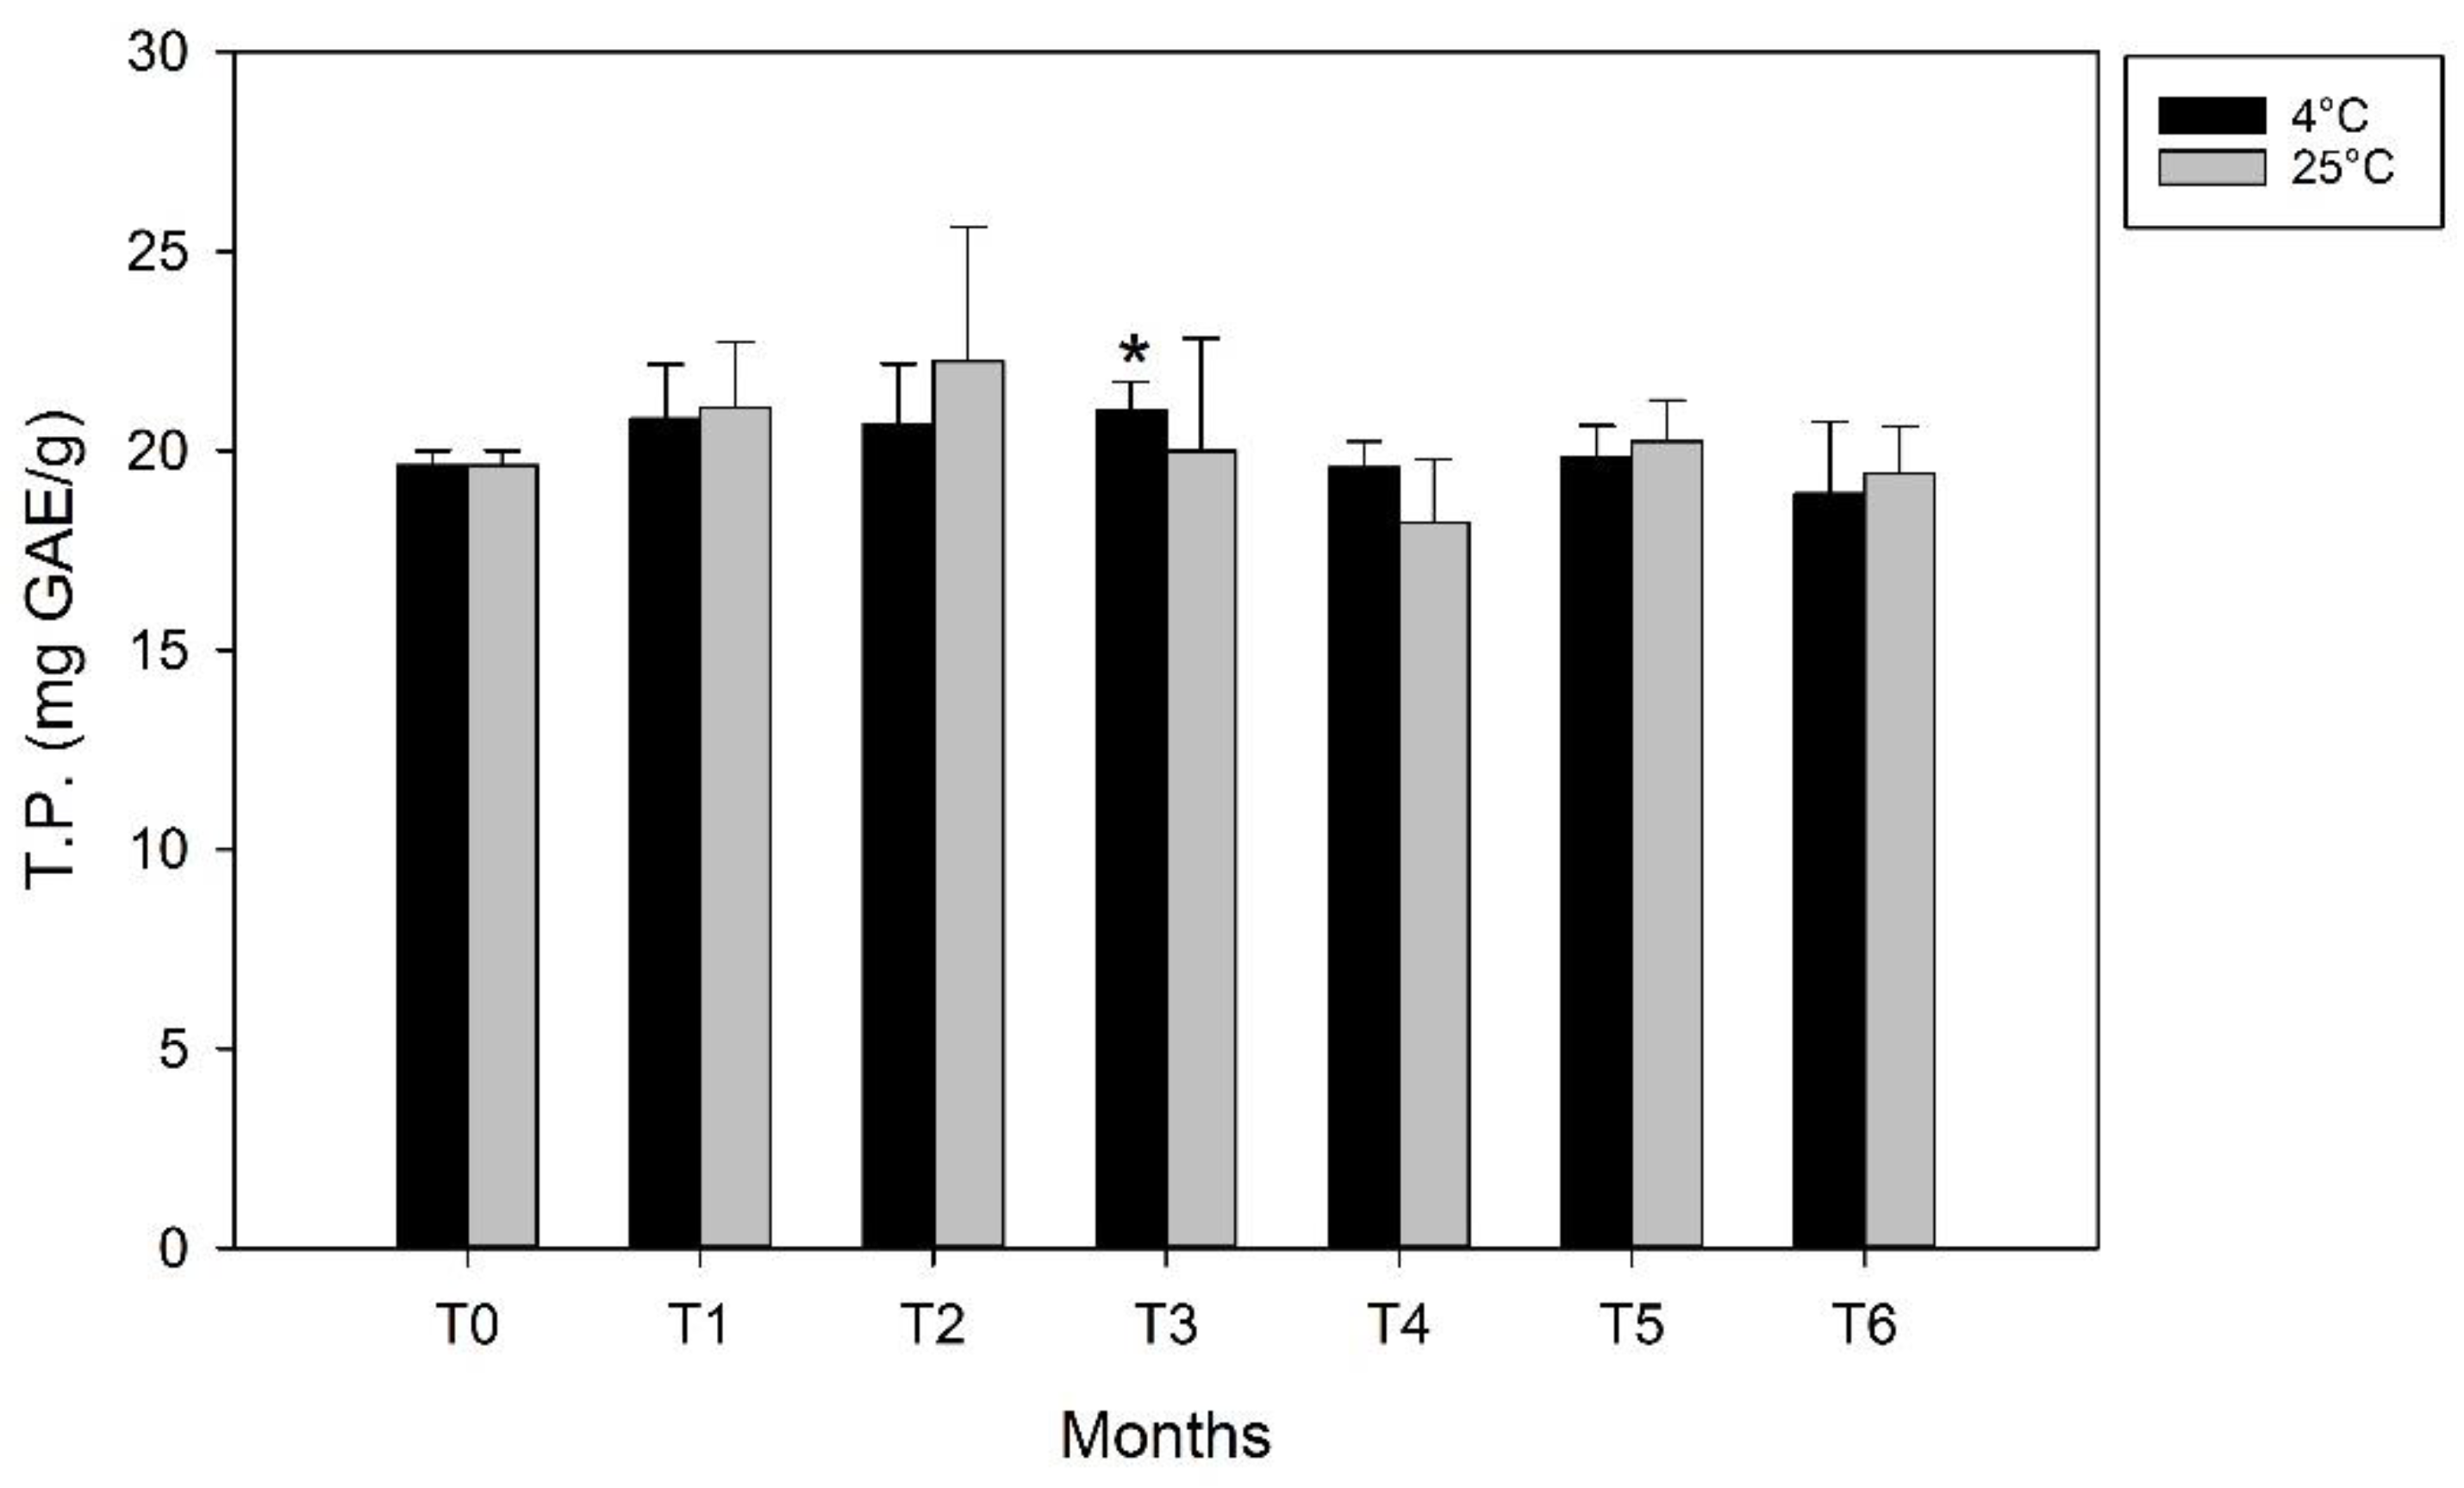
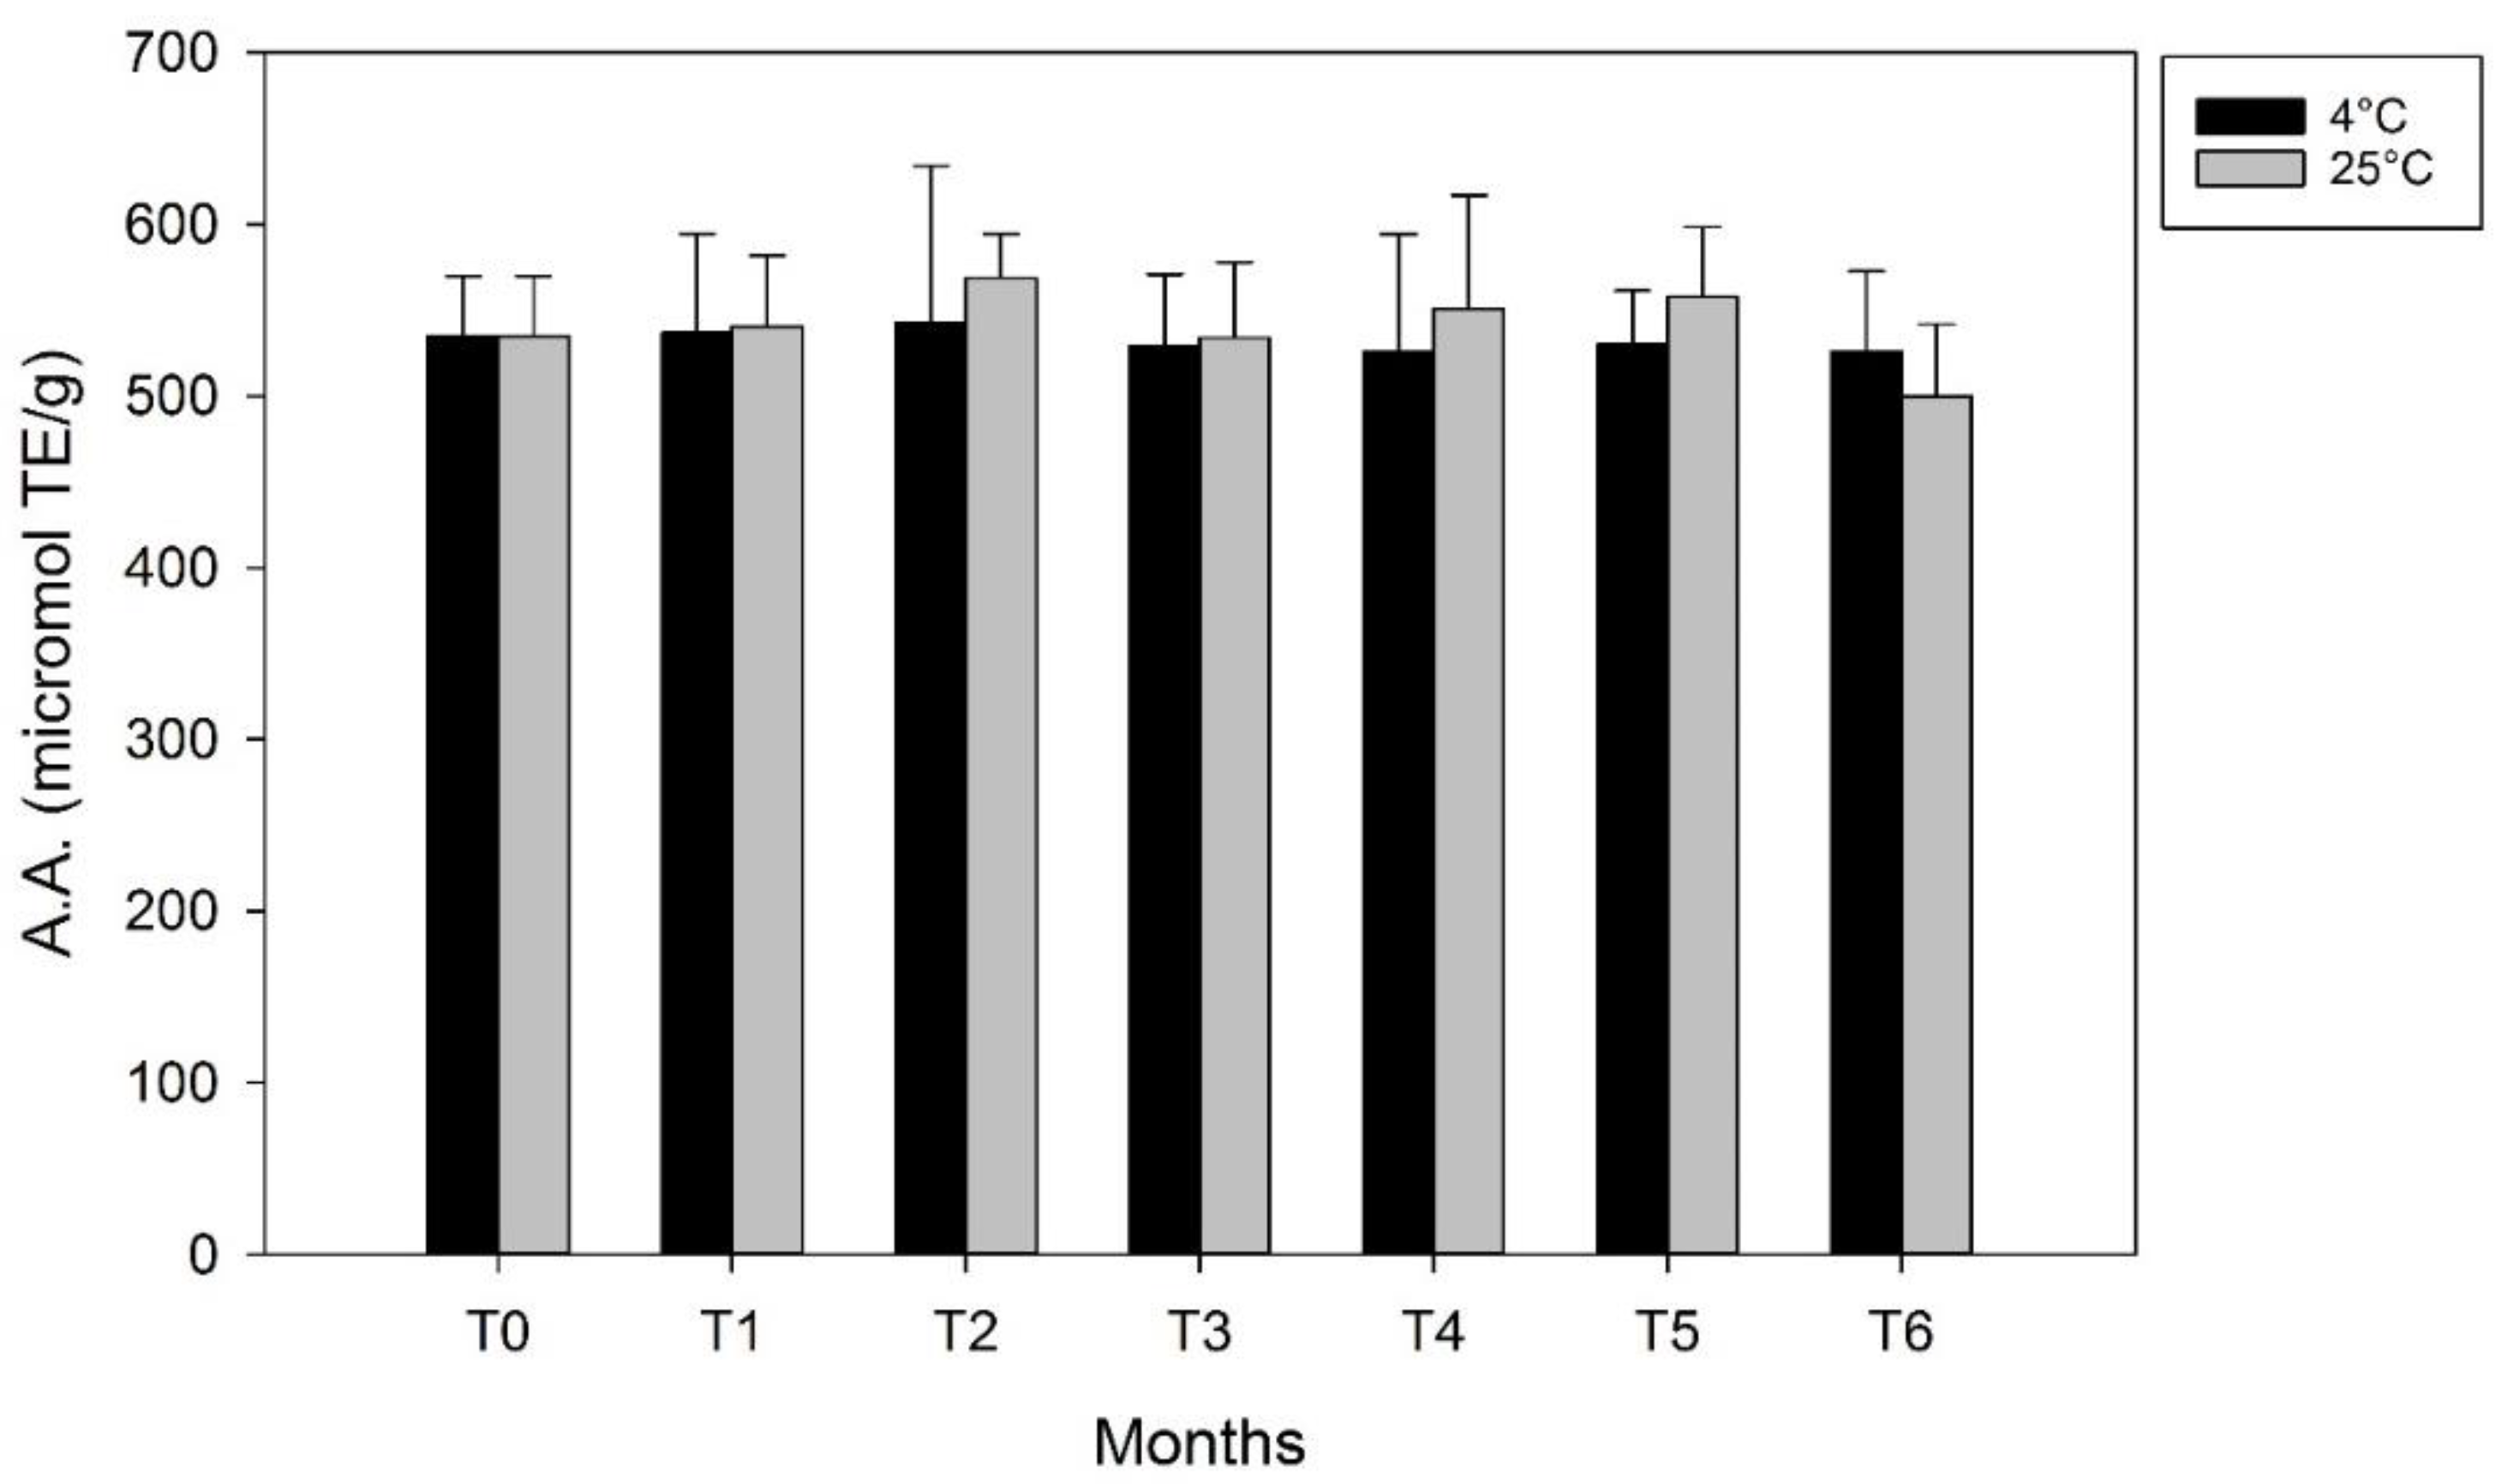
3.2. Assessment of Total Phenols and Antioxidant Activity of GPF during Storage at Different Temperatures

During six months, at 28-day intervals, we monitored variations in the concentration of phenolic compounds present in GPF using the Folin Ciocalteu assay. The obtained results indicated that the total phenol content in grape flour does not change significantly throughout the entire period either at 4 °C or 25 °C (Figure 1) remaining comparable to the control sample (T0).
Total antioxidant activity (AA) was determined using the TEAC/ABTS•+ assay. This assay, despite its limitations mainly due to the steric accessibility of ABTS•+, has been and still is used to monitor changes in antioxidant activity during food processing or storage, as the sample components with antioxidant activity are constant. We observed no significant changes in antioxidant activity across all timepoints analyzed during the six month storage period. The above findings highlighted a correlation with the stability of different polyphenol groups (in Table 1), and their synergic activity (Figure 2).

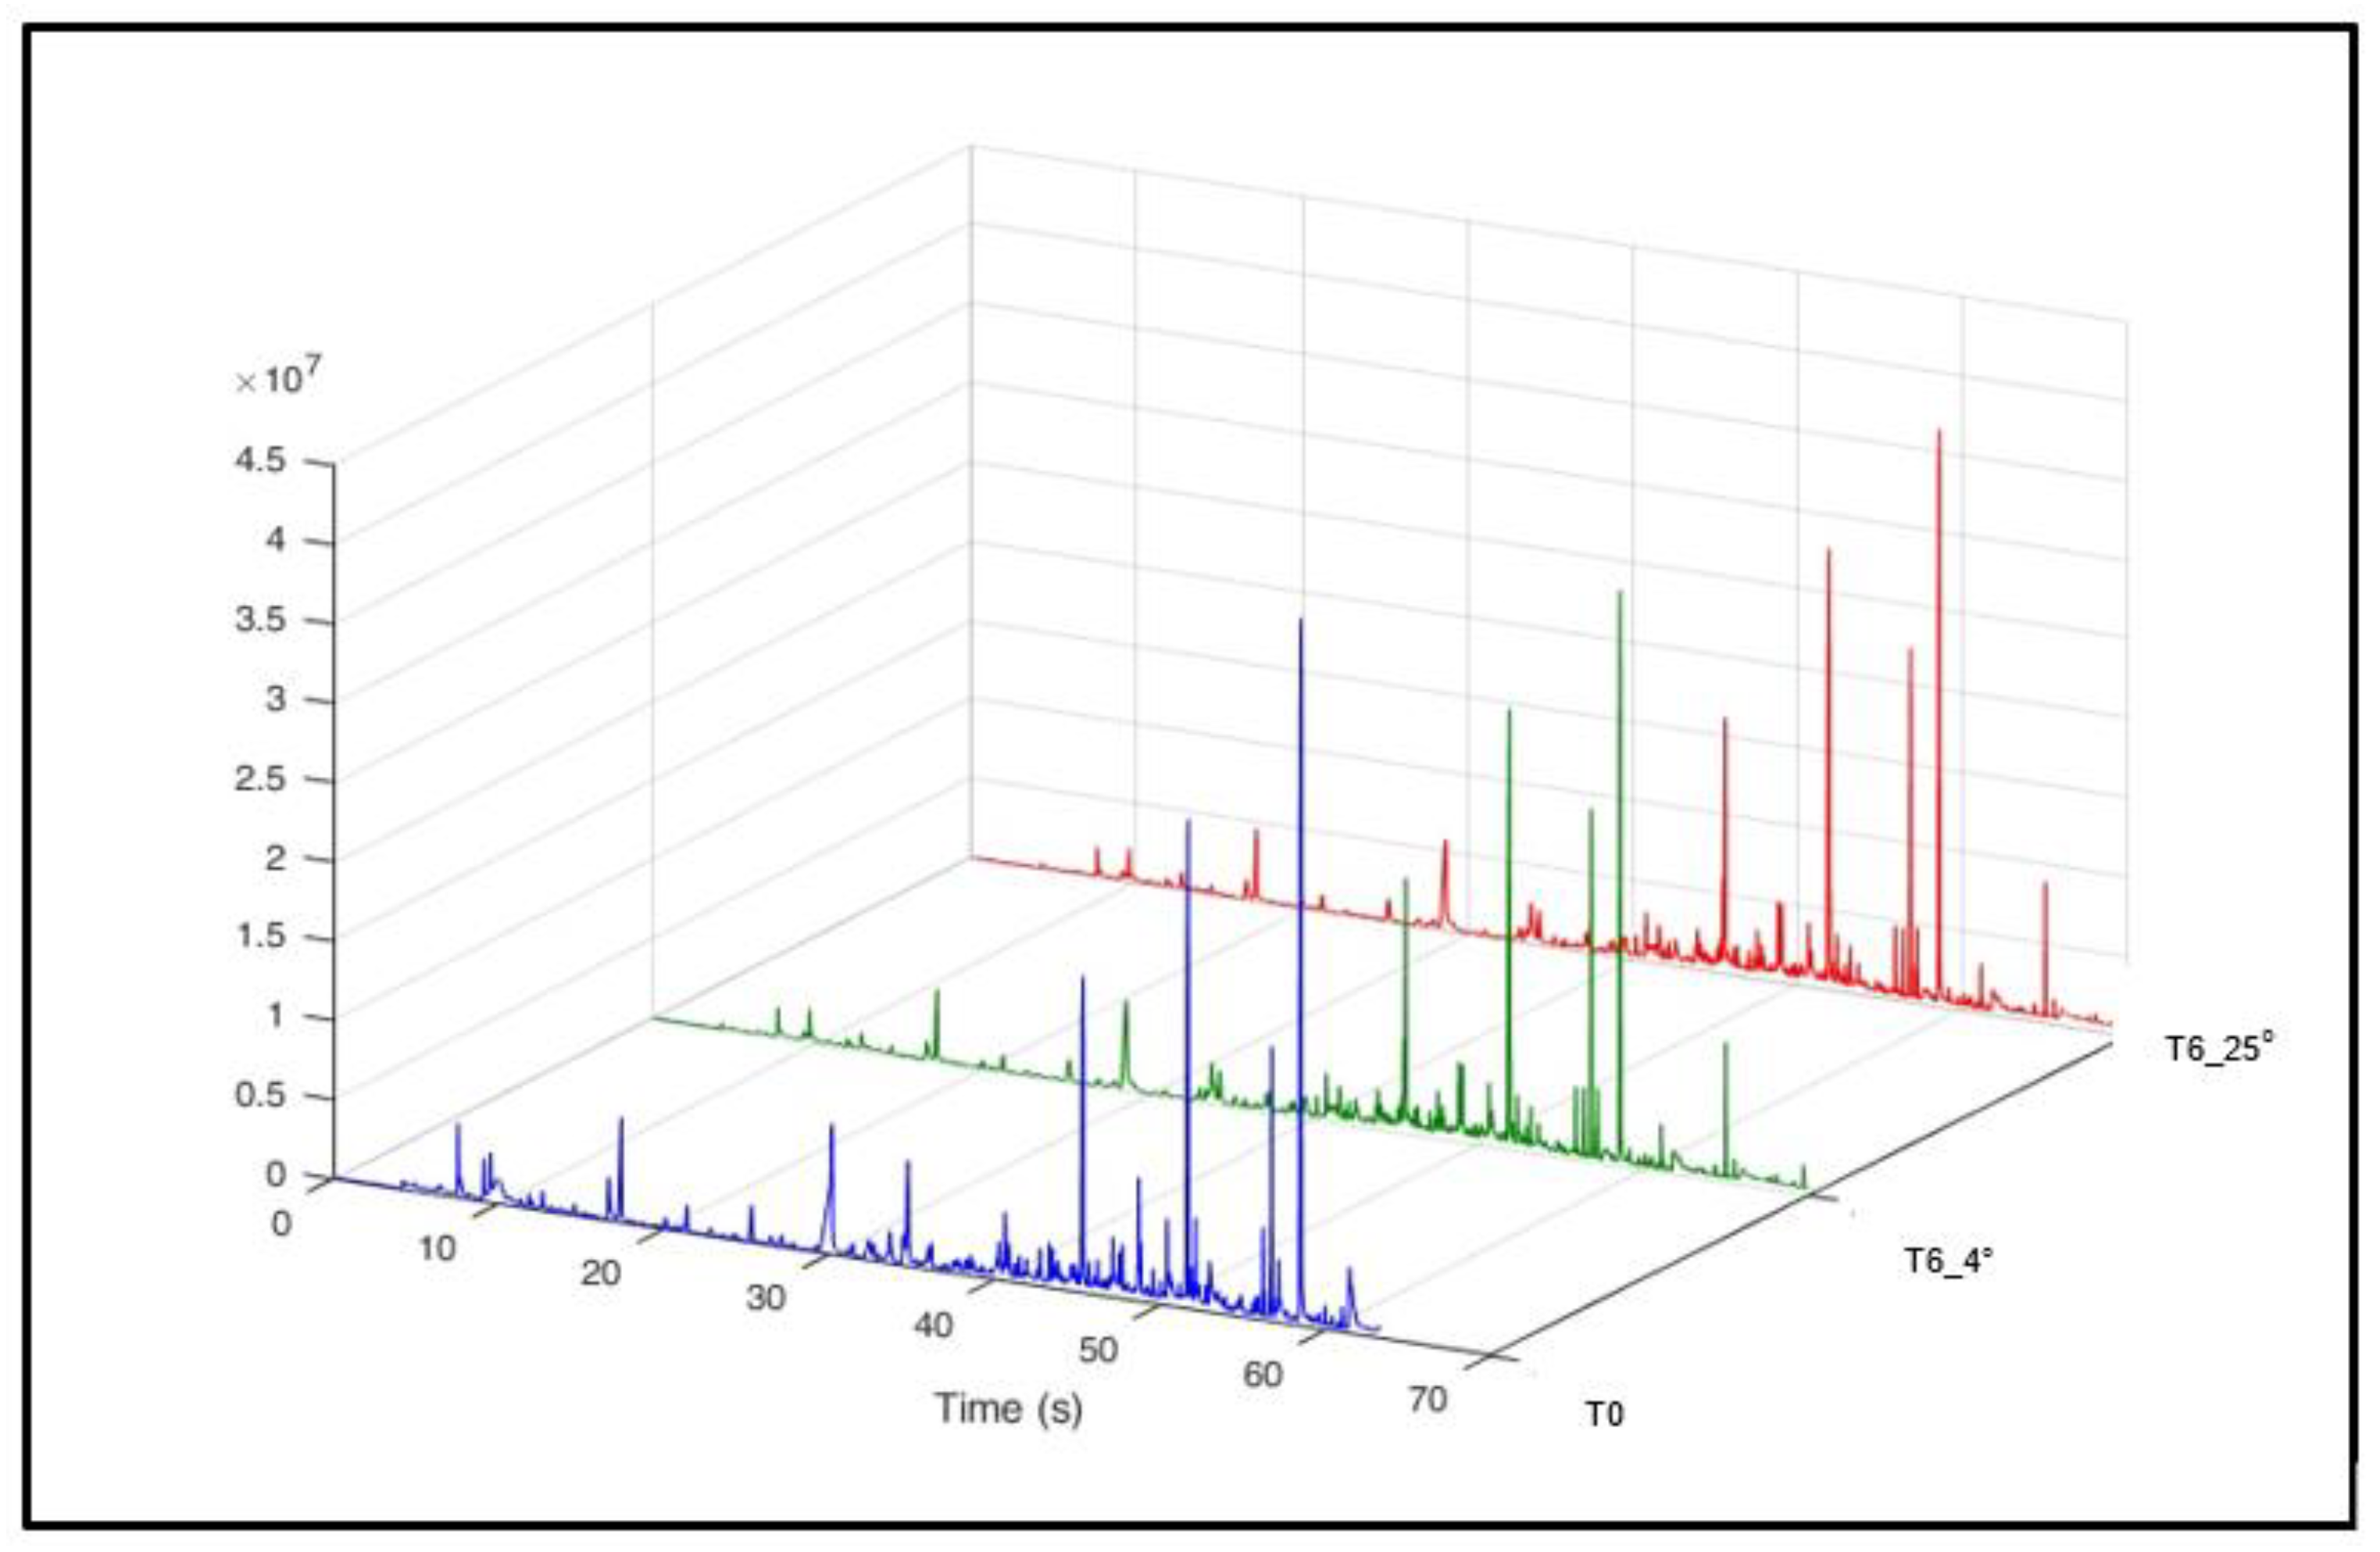
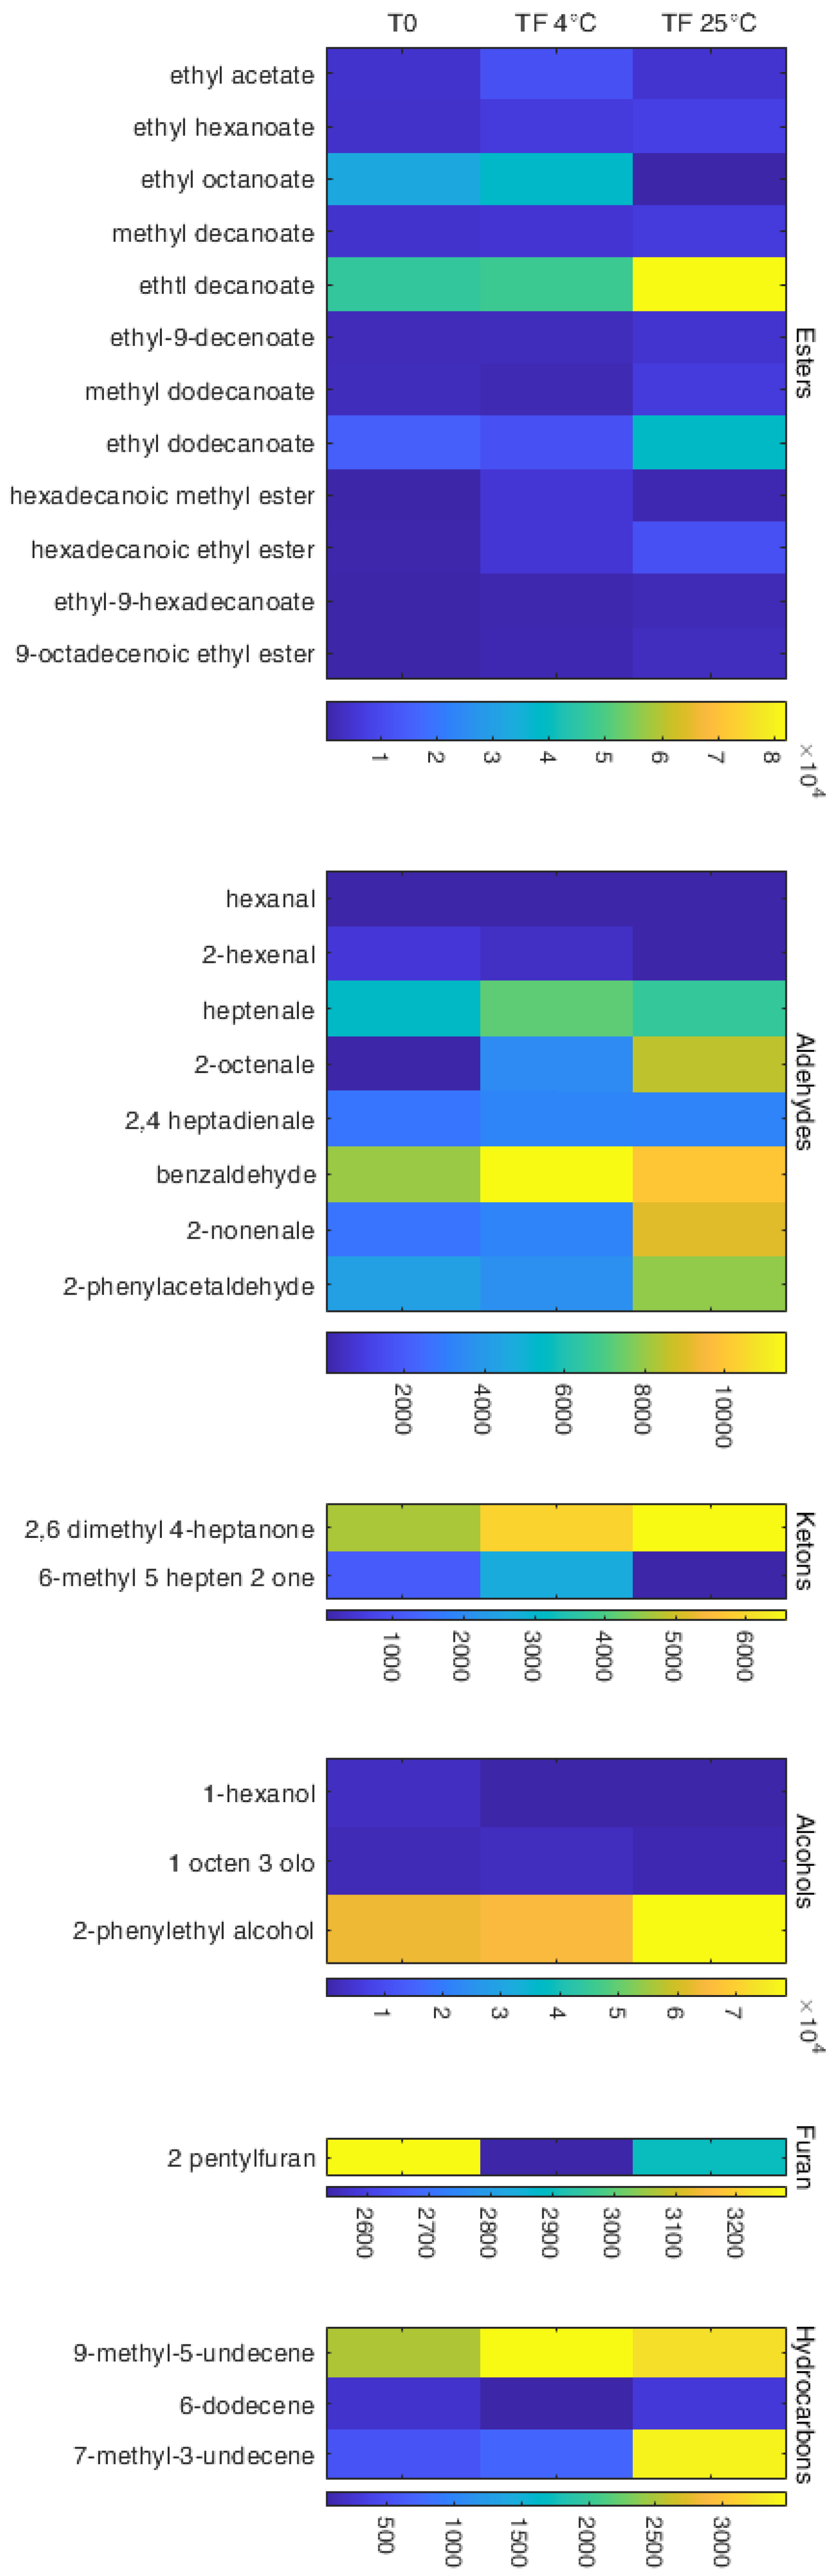
3.3. Effect of Storage on Fatty Acids and Volatile Composition of Negroamaro GPF

Analysis of the FA profile shows that polyunsaturated fatty acids (PUFA) accounted for approximately 57% of the total percentage of fatty acids identified, followed by monounsaturated (MUFA, ~24%) and saturated (SFA, ~19%) acids (Table 2).
Linoleic acid (C18:2n6) represented approximately 54% of the total fatty acids, followed by oleic (C18:1 n9, ~24%), palmitic (C16:0, ~11%) and stearic (C18:0; ~7%) acid. During the storage period of six months, we observed a significant increase in SFA at 5 and 6 months (p < 0.05) in GPF stored at 4 °C or 25 °C, compared to T0 (Table 2). However, neither MUFA nor PUFA content changed significantly across the time period analyzed, indicating excellent stability with regard to fatty acid oxidation. The presence of antioxidants such as polyphenols in GPF could play an important role in protecting unsaturated fatty acids from oxidation. Likewise, olive pomace by-products, that are characterized by a high content of phenolic compounds, have also been shown to increase oxidative stability and improving the quality and shelf life of food products [28].
Although the total lipid content in GPF is not very high, if GPF is subjected to storage conditions at temperature higher than 4 °C, enzymatic and non-enzymatic processes could contribute to lipid oxidation leading to rancidity. Therefore, we investigated whether changes in SFA, MUFA and PUFA content significant contribution to the oxidation stability of grape pomace flour. The stability of oleaginous component in the stored whole grape pomace flour containing seeds was assessed. Fatty acids (FAs) have a variable number of carbons and double bonds [29]. Generally, in foods containing a fatty component then, lipid oxidation is one of the main factors linked to oxidative rancidity, the loss of essential fatty acids, and the development of unpleasant flavor and smells in food ingredients. Polyphenols perform their antioxidant action by: (i) inactivating free radical, (ii) scavenging and neutralizing reactive oxygen species (ROS), (iii) enhancing the electron transfer, (iv) preventing the oxidation propagation phase and avoiding the formation of peroxides [30,31].
We also characterized the volatile profile of Negroamaro GPF during six months of storage at different temperatures. In total, 30 volatile compounds were identified, quantified by triphasic fiber coupled GC-MS analysis and grouped according to the class of volatile (esters, alcohols, aldehydes, ketons, furans and hydrocarbons). As shown in Figure 3 the differences between samples collected at T0 and after six months at 4–25 °C (T6_4 °C and T6_25 °C, respectively) appear to be quantitative rather than qualitative [32].
In all samples, esters, alcohols and aldehydes were the main groups of compounds identified in GP. Esters ranged from 51.65% of the total peak area in T0 sample to 63.38 and 77.40% in T6_4 °C and T6_25 °C, respectively. Alcohols ranged from 31.49% in T0 to 31.38 and 36.88% in T6_4 °C and T6_25 °C, respectively. Ethyl esters of fatty acids with a linear chain from 6 to 18 carbon atoms, are the molecules with the highest concentration detectable in all samples. The volatile fraction of Negroamaro grapes is also characterized by ethyl esters in free form whose content depends from ethanolysis of acetyl-CoA during fatty acids synthesis or degradation [33]. Among acetate esters, ethyl acetate showed a decrease during storage from 4.24 mg/kg at T0 to 1.34 and 1.011 at T6_4 °C and T_25 °C, respectively. Lower concentrations of ethyl acetate in processed samples may be due to glucose reduction via Maillard reactions, or inactivation by microorganisms produced during storage [34]. The detection of esters in control sample and their increase during the storage suggests that the fruity odor of the initial raw material is well preserved. While, the defined mechanism underlying the increase in esters is unknown [34], so it could be hypothesized that it results from oxidative breakdown of unsaturated fatty acids [35].
The aldehyde content varied from 11.13% at T0 to 15.94 and 20.93% in T6_4 °C and T6_25 °C samples, respectively. The large amount of linear aldehydes identified in GPF could result from oxidation degradation of unsaturated fatty acids, especially oleic, linoleic, linolenic [36], while the increase in aromatic aldehydes such as benzaldehyde and phenylacetaldehyde resulted from the degradation of aromatic amino acids during drying [37]. We found that 2-hexenal, a commonly used indicator of food rancidity, decreased during storage; i.e., from 0.41 mg/Kg in T0 to 0.06 and 0.08 mg/Kg in T6_4 °C and T6_25 °C samples, respectively. Furthermore, both values were lower than the concentration associated with rancid odors [38]. Moreover, we found no significant difference betweenT6_4 °C and T6_25 °C. It could be considered that constant antioxidant activity with a non-significant decrease in PUFA and MUFA contributes to reduce lipid oxidation.
While there is limited literature reporting changes in 2-hexenal content GP during storage, the decrease in 2-hexenal could be linked to oxidative breakdown processes. As C6 compounds are products of fatty acid oxidation, we also detected 1-hexanol in concentration varying from 0.26 mg/Kg at T0 to 0.14 and 0.15 mg/Kg in T6_4 °C and T6_25 °C, samples respectively. Volatile alcohols, in particular 1-hexanol and 1-octen-3-ol are produced at low temperature by oxidation of linoleic acid [39,40]. Therefore, it is probable that a decrease in C6 alcohols is linked to a decrease in the level of its precursor.
In the light of this, the low percentage of 2-hexenal and the absence of pentanal considered responsible for off flavor, the increase in esters and aromatic aldehydes during the six months of storage suggest a preservation of sensory quality. To identify main volatile compounds that discriminated GPF samples collected at two different times and temperatures, we performed a principal component analysis (PCA) on data obtained by SPME-GC/MS. As shown in Figure 4, two principal components (PC), PC1 and PC2 accounted for all variation; i.e., 60.23 and 39.77%, respectively.
PCA allowed us to differentiate the three samples collected at two different times and temperatures, based on the concentration of specific volatiles. PC1, which explained 60.23% of variance, clearly differentiated T0 and T6_4 °C samples from the T6_25 °C sample. On the other hand, PC2, that explained 39.77% of variation, separated the samples into three different groups. The T0 sample was located in the negative region of PC2 and positive PC1 for the higher values of C6 molecules. The T6_4 °C sample located in the positive region of PC1 and PC2, was characterized by an increase of specific esters (hexadecanoic methyl ester, ethyl acetate, ethyl hexanoate), alcohols (2-ethyl-1-hexanol and 1-octen-3-ol) and aldehydes (hexanal, 2,4-heptadienal). Finally, T6_25 °C sample is described by component negative of PC1 for the high content of long chain esters and ketones. In generally, alcohols, esters and aldehydes are derived from oxidation of unsaturated fatty acids [39,40]. Previous reports have indicated that higher storage temperature might also be responsible for loss of GPF phenol content [41,42]. However, the above results suggest the lack of any significant effect of temperature the quality of GPF.
The heatmap shown in Figure 5 illustrates the changes in the amounts of different volatiles at T0_4 °C or T6_25 °C relative to T. Alcohols and esters, the two main groups of molecules identified, showed significant changes from T0 to T6 at either temperature. Among aldehydes C6-C10, heptenale, 2-octenale, benzaldehyde, 2-nonenale and 2-phenylacetaldehyde increased during storage and with increasing temperature as previously reported [40]. The increase in the concentrations of alcohols and aldehydes could be associated with variation in the percentage of mono and polyunsaturated fatty acids detected. The formation of ketones, 2-phenylethylalcohol, 2-pentylfuran and some hydrocarbons seems to depend on both time and temperature. The two factors, time and temperature, led to a significant increase in alcohols and esters, the latter associated with sensory notes of fruitiness, while no significant variation was found of the remaining of molecules detected [43].
The evaluation of the volatile component, aldehydes were detected after six months of storage at the both temperatures, which could accompany the rancidity process of the GPF mostly at 25 °C. The concentrations of these compounds suggest a start of production of the volatile component, which is generally very subjective in individual perception.

3.4. Color Profile and Moisture Percentage of Negroamaro Flour Pomace after Six Months of Storage at Different Temperatures

GFP color is a quality parameter that affects both the appearance and consumer perception. L*, a* and b* (see Materials and Methods section) values of GPF at T0 and T6 samples stored at 4 °C and 25 °C in the dark and air conditions, are shown in Table 3. GPF samples showed positive a* and b* values, indicating that a GPF is more red than green and more yellow than blue, respectively.
Table 3 showed that storing pomace flour during six months lead to a significant increase of L*, a* and b* values. On the other end storage of pomace flour for six months at 4 °C does not effect L*, a* and b* values. Increase of L*, a* and b* values suggests that storage at 25 °C of GPF leads to a mild whitening and an intensification of red and yellow color. This effect could be a direct consequence of the initial anthocyanins degradation in grape pomace during the storage at 25 °C [44,45]. With regards to the percentage of moisture, no significant differences were found between sampling time nor storage temperature (Table 3). Moisture content of food ingredients affect physical and chemical aspects related to freshness and stability during long term storage. Moreover, even slight deviations from a defined standard can adversely affect the physical properties of a food. Interestingly, in the case of wheat flour, fluctuation in moisture content during storage may be associated with changes in flavonoids and antioxidant activity [46].

4. Conclusions

This study is the first to assess the effect of two commonly employed storage temperatures on the chemical and technological properties of GPF. Our results show that the content of total phenols and other bioactive molecules such as polyphenols and fatty acids are largely preserved at both temperatures. However, minor changes in GPF color and volatile component content occur following a storage period of six months at 25 °C. In particular, GPF color becomes slight whitened and shows and small increase in the volatile long chain esters and ketones. Based on this data, we conclude that the optimal storage temperature for GPF storage is 4 °C. Furthermore, our results lend further support to include GPF as a sustainable natural ingredient in functional foods.

Author Contributions

Conceptualization, G.G., C.G. and F.G.; methodology, C.G., M.T. and M.D.; investigation, C.G., G.G., M.D. and M.T.; writing—original draft preparation, G.G.; writing—review and editing, C.G., G.G., M.D. and F.G.; project administration, C.G. and G.G.; funding acquisition, C.G. and G.G. All authors have read and agreed to the published version of the manuscript.

Funding

This research was funded by CNR project NUTR-AGE (FOE2019, DSB.AD004.271), and ValBioVit-SNSvS NP-2.75 project-“2.2 Circular Economy” MITE-Italy.

Institutional Review Board Statement

Not applicable.

Acknowledgments

The authors are grateful for technical support to L. D’Amico, to A.M. Pascali, and to Azienda Agricola Cantele (Guagnano, Lecce, Italy) for providing the grape pomaces. The authors are grateful to Lorenzo Palombi (CNR-IFAC) for the valuable assistance in the data statistical analyses and Gertrud Lund for English language revision.

Conflicts of Interest

Authors declare no conflict of interest.

References

  1. Berbegal, C.; Spano, G.; Tristezza, M.; Grieco, F.; Capozzi, V. Microbial Resources and Innovation in the Wine Production Sector. S. Afr. J. Enol. Vitic. 2017, 38, 156–166. [Google Scholar] [CrossRef]
  2. Ahmad, B.; Yadav, V.; Yadav, A.; Rahman, M.U.; Yuan, W.Z.; Li, Z.; Wang, X. Integrated Biorefinery Approach to Valorize Winery Waste: A Review from Waste to Energy Perspectives. Sci. Total Environ. 2020, 719, 137315. [Google Scholar] [CrossRef] [PubMed]
  3. Beres, C.; Costa, G.N.S.; Cabezudo, I.; da Silva-James, N.K.; Teles, A.S.C.; Cruz, A.P.G.; Mellinger-Silva, C.; Tonon, R.V.; Cabral, L.M.C.; Freitas, S.P. Towards Integral Utilization of Grape Pomace from Winemaking Process: A Review. Waste Manag. 2017, 68, 581–594. [Google Scholar] [CrossRef] [PubMed]
  4. Bender, A.B.B.; Speroni, C.S.; Salvador, P.R.; Loureiro, B.B.; Lovatto, N.M.; Goulart, F.R.; Lovatto, M.T.; Miranda, M.Z.; Silva, L.P.; Penna, N.G. Grape Pomace Skins and the Effects of Its Inclusion in the Technological Properties of Muffins. J. Culin. Sci. Technol. 2017, 15, 143–157. [Google Scholar] [CrossRef]
  5. Gaita, C.; Alexa, E.; Moigradean, D.; Conforti, F.; Poiana, M.-A. Designing of High Value-Added Pasta Formulas by Incorporation of Grape Pomace Skins. Rom. Biotechnol. Lett. 2020, 25, 1607–1614. [Google Scholar] [CrossRef]
  6. Iuga, M.; Mironeasa, S. Use of Grape Peels by-Product for Wheat Pasta Manufacturing. Plants 2021, 10, 926. [Google Scholar] [CrossRef]
  7. Tolve, R.; Pasini, G.; Vignale, F.; Favati, F.; Simonato, B. Effect of Grape Pomace Addition on the Technological, Sensory, and Nutritional Properties of Durum Wheat Pasta. Foods 2020, 9, 354. [Google Scholar] [CrossRef] [Green Version]
  8. Ungureanu-Iuga, M.; Dimian, M.; Mironeasa, S. Development and Quality Evaluation of Gluten-Free Pasta with Grape Peels and Whey Powders. LWT 2020, 130, 109714. [Google Scholar] [CrossRef]
  9. Tseng, A.; Zhao, Y. Effect of Different Drying Methods and Storage Time on the Retention of Bioactive Compounds and Antibacterial Activity of Wine Grape Pomace (Pinot Noir and Merlot). J. Food Sci. 2012, 77, H192–H201. [Google Scholar] [CrossRef]
  10. Gerardi, C.; D’amico, L.; Migoni, D.; Santino, A.; Salomone, A.; Carluccio, M.A.; Giovinazzo, G. Strategies for Reuse of Skins Separated from Grape Pomace as Ingredient of Functional Beverages. Front. Bioeng. Biotechnol. 2020, 8, 645. [Google Scholar] [CrossRef]
  11. Planinić, M. Influence of Temperature and Drying Time on Extraction Yield of Phenolic Compounds from Grape Pomace Variety “Portogizac”. Chem. Biochem. Eng. Q. 2015, 29, 343–350. [Google Scholar] [CrossRef]
  12. Teixeira, A.; Baenas, N.; Dominguez-Perles, R.; Barros, A.; Rosa, E.; Moreno, D.; Garcia-Viguera, C. Natural Bioactive Compounds from Winery by-Products as Health Promoters: A Review. Int. J. Mol. Sci. 2014, 15, 15638–15678. [Google Scholar] [CrossRef] [PubMed] [Green Version]
  13. Giovinazzo, G.; Gerardi, C.; Uberti-Foppa, C.; Lopalco, L. Can Natural Polyphenols Help in Reducing Cytokine Storm in COVID-19 Patients? Molecules 2020, 25, 5888. [Google Scholar] [CrossRef] [PubMed]
  14. Iuga, M.; Mironeasa, S. Potential of Grape Byproducts as Functional Ingredients in Baked Goods and Pasta. Compr. Rev. Food Sci. Food Saf. 2020, 19, 2473–2505. [Google Scholar] [CrossRef] [PubMed]
  15. Oliveira, D.A.; Salvador, A.A.; Smânia, A.; Smânia, E.F.A.; Maraschin, M.; Ferreira, S.R.S. Antimicrobial Activity and Composition Profile of Grape (Vitis vinifera) Pomace Extracts Obtained by Supercritical Fluids. J. Biotechnol. 2013, 164, 423–432. [Google Scholar] [CrossRef]
  16. Gerardi, C.; Pinto, L.; Baruzzi, F.; Giovinazzo, G. Comparison of Antibacterial and Antioxidant Properties of Red (Cv. Negramaro) and White (Cv. Fiano) Skin Pomace Extracts. Molecules 2021, 26, 5918. [Google Scholar] [CrossRef]
  17. Gerardi, C.; Tommasi, N.; Albano, C.; Blando, F.; Rescio, L.; Pinthus, E.; Mita, G.; Prunus Mahaleb, L. Fruit Extracts: A Novel Source for Natural Food Pigments. Eur. Food Res. Technol. 2015, 241, 683–695. [Google Scholar] [CrossRef]
  18. Durante, M.; Lenucci, M.S.; Marrese, P.P.; Rizzi, V.; De Caroli, M.; Piro, G.; Fini, P.; Russo, G.L.; Mita, G. α-Cyclodextrin Encapsulation of Supercritical CO2 Extracted Oleoresins from Different Plant Matrices: A Stability Study. Food Chem. 2016, 199, 684–693. [Google Scholar] [CrossRef]
  19. Tufariello, M.; Pati, S.; D’Amico, L.; Bleve, G.; Losito, I.; Grieco, F. Quantitative Issues Related to the Headspace-SPME-GC/MS Analysis of Volatile Compounds in Wines: The Case of Maresco Sparkling Wine. LWT 2019, 108, 268–276. [Google Scholar] [CrossRef]
  20. Gatto, P.; Vrhovsek, U.; Muth, J.; Segala, C.; Romualdi, C.; Fontana, P.; Pruefer, D.; Stefanini, M.; Moser, C.; Mattivi, F.; et al. Ripening and Genotype Control Stilbene Accumulation in Healthy Grapes. J. Agric. Food Chem. 2008, 56, 11773–11785. [Google Scholar] [CrossRef]
  21. Calabriso, N.; Massaro, M.; Scoditti, E.; Pellegrino, M.; Ingrosso, I.; Giovinazzo, G.; Carluccio, M. Red Grapes Skin Polyphenols Blunt Matrix Metalloproteinase-2 and -9 Activity and Expression in Cell Models of Vascular Inflammation: Protective Role in Degenerative and Inflammatory Diseases. Molecules 2016, 21, 1147. [Google Scholar] [CrossRef] [PubMed] [Green Version]
  22. Calabriso, N.; Scoditti, E.; Massaro, M.; Pellegrino, M.; Storelli, C.; Ingrosso, I.; Giovinazzo, G.; Carluccio, M.A. Multiple Anti-Inflammatory and Anti-Atherosclerotic Properties of Red Wine Polyphenolic Extracts: Differential Role of Hydroxycinnamic Acids, Flavonols and Stilbenes on Endothelial Inflammatory Gene Expression. Eur. J. Nutr. 2016, 55, 477–489. [Google Scholar] [CrossRef] [PubMed]
  23. Flamini, R.; Mattivi, F.; Rosso, M.; Arapitsas, P.; Bavaresco, L. Advanced Knowledge of Three Important Classes of Grape Phenolics: Anthocyanins, Stilbenes and Flavonols. Int. J. Mol. Sci. 2013, 14, 19651–19669. [Google Scholar] [CrossRef] [PubMed]
  24. Giovinazzo, G.; Grieco, F. Functional Properties of Grape and Wine Polyphenols. Plant Foods Hum. Nutr. 2015, 70, 454–462. [Google Scholar] [CrossRef]
  25. Lesjak, M.; Beara, I.; Simin, N.; Pintać, D.; Majkić, T.; Bekvalac, K.; Orčić, D.; Mimica-Dukić, N. Antioxidant and Anti-Inflammatory Activities of Quercetin and Its Derivatives. J. Funct. Foods 2018, 40, 68–75. [Google Scholar] [CrossRef]
  26. Bolling, B.W.; Blumberg, J.B.; Oliver Chen, C.-Y. The Influence of Roasting, Pasteurisation, and Storage on the Polyphenol Content and Antioxidant Capacity of California Almond Skins. Food Chem. 2010, 123, 1040–1047. [Google Scholar] [CrossRef] [Green Version]
  27. Kapcum, C.; Uriyapongson, J. Effects of Storage Conditions on Phytochemical and Stability of Purple Corn Cob Extract Powder. Food Sci. Technol. 2018, 38, 301–305. [Google Scholar] [CrossRef] [Green Version]
  28. Difonzo, G.; Troilo, M.; Squeo, G.; Pasqualone, A.; Caponio, F. Functional Compounds from Olive Pomace to Obtain High-added Value Foods—A Review. J. Sci. Food Agric. 2021, 101, 15–26. [Google Scholar] [CrossRef]
  29. Fahy, E.; Subramaniam, S.; Murphy, R.C.; Nishijima, M.; Raetz, C.R.H.; Shimizu, T.; Spener, F.; van Meer, G.; Wakelam, M.J.O.; Dennis, E.A. Update of the LIPID MAPS Comprehensive Classification System for Lipids. J. Lipid Res. 2009, 50, S9–S14. [Google Scholar] [CrossRef] [Green Version]
  30. Radzikowska, U.; Rinaldi, A.O.; Çelebi Sözener, Z.; Karaguzel, D.; Wojcik, M.; Cypryk, K.; Akdis, M.; Akdis, C.A.; Sokolowska, M. The Influence of Dietary Fatty Acids on Lmmune Responses. Nutrients 2019, 11, 2990. [Google Scholar] [CrossRef] [Green Version]
  31. Zhao, M.; Chiriboga, D.; Olendzki, B.; Xie, B.; Li, Y.; McGonigal, L.; Maldonado-Contreras, A.; Ma, Y. Substantial Increase in Compliance with Saturated Fatty Acid Intake Recommendations after One Year Following the American Heart Association Diet. Nutrients 2018, 10, 1486. [Google Scholar] [CrossRef] [PubMed] [Green Version]
  32. Tufariello, M.; Fragasso, M.; Pico, J.; Panighel, A.; Castellarin, S.D.; Flamini, R.; Grieco, F. Influence of Non-Saccharomyces on Wine Chemistry: A Focus on Aroma-Related Compounds. Molecules 2021, 26, 644. [Google Scholar] [CrossRef] [PubMed]
  33. Coletta, A.; Toci, A.T.; Pati, S.; Ferrara, G.; Grieco, F.; Tufariello, M.; Crupi, P. Effect of Soil Management and Training System on Negroamaro Wine Aroma. Foods 2021, 10, 454. [Google Scholar] [CrossRef] [PubMed]
  34. Gasiński, A.; Kawa-Rygielska, J.; Mikulski, D.; Kłosowski, G.; Głowacki, A. Application of White Grape Pomace in the Brewing Technology and Its Impact on the Concentration of Esters and Alcohols, Physicochemical Parameteres and Antioxidative Properties of the Beer. Food Chem. 2022, 367, 130646. [Google Scholar] [CrossRef]
  35. Wang, D.; Javed, H.U.; Shi, Y.; Naz, S.; Ali, S.; Duan, C.-Q. Impact of Drying Method on the Evaluation of Fatty Acids and Their Derived Volatile Compounds in ‘Thompson Seedless’ Raisins. Molecules 2020, 25, 608. [Google Scholar] [CrossRef] [Green Version]
  36. Whitfield, F.B.; Mottram, D.S. Volatiles from Interactions of Maillard Reactions and Lipids. Crit. Rev. Food Sci. Nutr. 1992, 31, 1–58. [Google Scholar] [CrossRef] [PubMed]
  37. Cirlini, M.; Dall’Asta, C.; Silvanini, A.; Beghè, D.; Fabbri, A.; Galaverna, G.; Ganino, T. Volatile Fingerprinting of Chestnut Flours from Traditional Emilia Romagna (Italy) Cultivars. Food Chem. 2012, 134, 662–668. [Google Scholar] [CrossRef]
  38. Fritsch, C.W.; Gale, J.A. Hexanal as a Measure of Rancidity in Low Fat Foods. J. Am. Oil Chem. Soc. 1977, 54, 225–228. [Google Scholar] [CrossRef]
  39. Chai, D.; Li, C.; Zhang, X.; Yang, J.; Liu, L.; Xu, X.; Du, M.; Wang, Y.; Chen, Y.; Dong, L. Analysis of Volatile Compounds from Wheat Flour in the Heating Process. Int. J. Food Eng. 2019, 15, 1–13. [Google Scholar] [CrossRef]
  40. Cramer, A.-C.J.; Mattinson, D.S.; Fellman, J.K.; Baik, B.-K. Analysis of Volatile Compounds from Various Types of Barley Cultivars. J. Agric. Food Chem. 2005, 53, 7526–7531. [Google Scholar] [CrossRef]
  41. Galmarini, M.V.; Maury, C.; Mehinagic, E.; Sanchez, V.; Baeza, R.I.; Mignot, S.; Zamora, M.C.; Chirife, J. Stability of Individual Phenolic Compounds and Antioxidant Activity during Storage of a Red Wine Powder. Food Bioprocess Technol. 2013, 6, 3585–3595. [Google Scholar] [CrossRef] [Green Version]
  42. Tolun, A.; Artik, N.; Altintas, Z. Effect of Different Microencapsulating Materials and Relative Humidities on Storage Stability of Microencapsulated Grape Pomace Extract. Food Chem. 2020, 302, 125347. [Google Scholar] [CrossRef] [PubMed]
  43. Tufariello, M.; Chiriatti, M.A.; Grieco, F.; Perrotta, C.; Capone, S.; Rampino, P.; Tristezza, M.; Mita, G.; Grieco, F. Influence of Autochthonous Saccharomyces Cerevisiae Strains on Volatile Profile of Negroamaro Wines. LWT—Food Sci. Technol. 2014, 58, 35–48. [Google Scholar] [CrossRef]
  44. Augustine, S.; Kudachikar, V.B.; Vanajakshi, V.; Ravi, R. Effect of Combined Preservation Techniques on the Stability and Microbial Quality and Retention of Anthocyanins in Grape Pomace Stored at Low Temperature. J. Food Sci. Technol. 2013, 50, 332–338. [Google Scholar] [CrossRef] [Green Version]
  45. Ayed, N.; Yu, H.-L.; Lacroix, M. Improvement of Anthocyanin Yield and Shelf-Life Extension of Grape Pomace by Gamma Irradiation. Food Res. Int. 1999, 32, 539–543. [Google Scholar] [CrossRef]
  46. Zhang, Y.; Truzzi, F.; D’Amen, E.; Dinelli, G. Effect of Storage Conditions and Time on the Polyphenol Content of Wheat Flours. Processes 2021, 9, 248. [Google Scholar] [CrossRef]
Figure 1. Comparison of Total Phenols content in Negroamaro GPF during six months storage at 4 °C and 25 °C in the dark. Data represent mean values ± standard deviation (n = 3). “*” indicates a timepoint that was significantly different (p < 0.05) relative to T0 as determined by the two sample-t-test and the Mann-Whitney U Test.
Applsci 12 03956 g001
Figure 2. Comparison of TEAC values (AA) in Negroamaro GPF during the six month storage period at 4 °C and 25 °C in the dark. Data represent mean values ± standard deviation (n = 3).
Applsci 12 03956 g002
Figure 3. Total ion chromatogram of Negroamaro pomace flour at initial and final time point (T0 and T6, respectively) at 4 °C and 25 °C in the dark.
Applsci 12 03956 g003
Figure 4. Principal Component Analysis of volatile compound concentrations detected in GPF stored for six months at 4 °C and 25 °C in the dark. PCA biplots on the PC1-PC2 plane combining score plots of major volatiles variables and the final sampling of GPF stored at 4° C (T6) and at 25 °C (T6).
Applsci 12 03956 g004
Figure 5. Heatmap of volatile compounds.
Applsci 12 03956 g005
Table 1. Characterization of different classes of phenolic compounds in GPF samples stored for 6 months at 4 or 25 °C in the dark.
Time
(Months)
AnthocyaninsOeninCaffeic Acid Caftaric Acid Cutaric AcidGallic AcidTrans-ResveratrolCatechin Epicatechin Quercetin Querc.
3-Gluc.
Rutin
(μgOE/g)μg/g
Temperature of storage 4 °C
T0790 ± 10220 ± 200.77 ± 0.5721.63 ± 4.582.95 ± 0.8041.00 ± 0.728.81 ± 1.71460 ± 30800 ± 7057.61 ± 0.5028.12 ± 0.41530 ± 7
T1840 ± 30240 ± 400.73 ± 0.08422.45 ± 3.862.71 ± 0.5438.40 ± 2.8713.43 ± 0.23 *460 ± 30700 ± 2059.72 ± 2.01 33.04 ± 5.18580 ± 3 *
T2970 ± 70 *270 ± 501.35 ± 0.3323.41 ± 2.343.08 ± 0.3846.77 ± 1.55 *12.85 ± 2.57 *480 ± 80680 ± 6062.69 ± 0.22 *42.18 ± 12.1740 ± 10 *
T3780 ± 1220 ± 200.70 ± 0.3521.59 ± 3.952.71 ± 0.8241.60 ± 3.5012.45 ± 1.12 *470 ± 40610 ± 6058.67 ± 1.7527.55 ± 0.30540 ± 7
T4850 ± 60250 ± 501.38 ± 0.1323.22 ± 2.283.29 ± 0.5438.80 ± 0.66 *8.95 ± 1.68540 ± 70720 ± 13059.71 ± 3.1636.98 ± 14.1640 ± 5 *
T5850 ± 10 *250 ± 101.89 ± 0.7822.29 ± 4.413.24 ± 0.9049.35 ± 5.5017.88 ± 4.01 *520 ± 30720 ± 12066.04 ± 2.98 *35.22 ± 4.98680 ± 1 *
T6820 ± 50240 ± 301.46 ± 0.4523.26 ± 4.113.41 ± 0.9741.54 ± 6.0717.53 ± 3.88 *510 ± 40660 ± 1062.04 ± 1.19 *34.45 ± 8.23660 ± 6 *
Temperature of storage 25 °C
T1760 ± 10 *220 ± 200. 94 ± 0.0722.13 ± 4.492.97 ± 0.8046.25 ± 3.419.80 ± 1.17450 ± 10710 ± 3059.19 ± 0.9227.89 ± 0.65560 ± 6 *
T2810 ± 40240 ± 102.31 ± 0.89 *23.77 ± 6.152.82 ± 0.9551.16 ± 7.8716.44 ± 4.45490 ± 50770 ± 11064.78 ± 6.0832.30 ± 4.56640 ± 15 *
T3740 ± 40220 ± 302.39 ± 0.12 *22.79 ± 3.372.76 ± 0.6145.82 ± 1.25 *8.94 ± 1.08450 ± 20740 ± 1060.26 ± 2.5229.79 ± 1.70510 ± 4
T4790 ± 40210 ± 302.61 ± 0.16 *22.21 ± 3.003.06 ± 0.6644.10 ± 0.16 *7.90 ± 2.09410 ± 40650 ± 10 *60.44 ± 0.94 *27.24 ± 3.57560 ± 2 *
T5850 ± 80260 ± 502.09 ± 0.03 *21.37 ± 3.232.99 ± 0.9858.92 ± 12.96.51 ± 1.84470 ± 40710 ± 5067.14 ± 10.936.50 ± 8.84560 ± 6 *
T6790 ± 40230 ± 304.03 ± 0.09 *23.89 ± 2.974.31 ± 0.1655.04 ± 7.96 *14.86 ± 0.32 *430 ± 50550 ± 80 *64.90 ± 0.05 *37.63 ± 11.1690 ± 9 *
Data are the mean ± standard deviation of three independent replicates (n = 3). “*” indicates statistically significant differences (p < 0.05) between each treatment after T1, T2, T3, T4, T5 and T6 time (months) versus initial storage time (T0) as determined by the two sample-t-test and the Mann-Whitney U Test.
Table 2. Characterization and comparison of different fatty acids composition in GPF stored for six months at 4 and 25 °C in the dark.
Time Storage (Months)
01234560123456
% of Total Fatty Acids Identified
Fatty Acids4 °C25 °C
Palmitic acid
(C16:0)
11.5512.4612.7212.8113.0914.3714.72 *11.5512.7112.5712.7713.1013.6615.28
Palmitoleic acid
(C16:1)
0.711.010.950.960.780.760.91 *0.710.95 *0.99 *0.92 *1.20 *0.93 *1.07 *
Stearic acid
(C18:0)
6.817.437.047.227.199.49 *9.52 *6.817.23 *7.03 *7.94 *7.63 *9.12 *9.96 *
Oleic acid
(C18:1 n9)
23.5723.6423.0923.5023.7621.5021.0923.5723.1723.3123.8223.6722.0220.97
Linoleic acid
(C18:2 n6)
53.8552.3953.4052.8852.3551.2751.1653.8552.9653.2051.5851.5851.6950.17
Linolenic acid
(C18:3 n3)
2.972.472.292.14 *2.12 *1.99 *2.08 *2.972.442.402.26 *2.20 *2.06 *2.00 *
Arachidic acid
(C20:0)
0.540.600.510.490.71 *0.62 *0.520.540.540.500.71 *0.620.520.55
SFA18.9020.4920.2720.5220.9924.48 *24.66 *18.9020.4820.1021.42 *21.35 *23.30 *25.79 *
MUFA24.2824.6524.0424.4624.5422.3622.1024.2824.1224.3024.7424.8722.9522.04
PUFA56.8254.8655.6955.0254.4753.1653.2456.8255.4055.6053.8453.7853.7552.17
Standard deviation is less than 10%. “*” indicates statistically significant differences (p < 0.05) between each treatment after T1, T2, T3, T4, T5 and T6 time (months) versus initial storage time (T0) as determined by the two sample-t-test and the Mann-Whitney U Test.
Table 3. Color and moisture of GPF stored for six months at 4 and 25 °C in the dark.
Time
(Months)
Color ParameterMoisture
L *a *b *%
T044.23 ± 0.086.13 ± 0.064.89 ± 0.067.56 ± 0.06
Temperature of storage 4 °C
T644.48 ± 0.386.38 ± 0.205.07 ± 0.207.69 ± 0.08
Temperature of storage 25 °C
T645.61 ± 0.19 *6.83 ± 0.13 *5.59 ± 0.09 *7.9 ± 0.09
Standard deviation is less than 10%. “*” indicates statistically significant differences (p < 0.05) between T6 time (months) versus initial storage time (T0) as determined by the two sample-t-test and the Mann-Whitney U Test.
Publisher’s Note: MDPI stays neutral with regard to jurisdictional claims in published maps and institutional affiliations.

